Article

Private and Externality Costs and Benefits of Recycling Crystalline Silicon (c-Si) Photovoltaic Panels

1
Department of Civil and Environmental Engineering, University of Toledo, Toledo Lucas County, OH 43606, USA
2
Department of Electrical and Computer Engineering, University of Wisconsin–Platteville, Platteville Grant County, WI 53818, USA
*
Author to whom correspondence should be addressed.
Energies 2020, 13(14), 3650; https://doi.org/10.3390/en13143650
Submission received: 15 May 2020 / Revised: 30 June 2020 / Accepted: 12 July 2020 / Published: 15 July 2020
(This article belongs to the Special Issue Life Cycle & Technoeconomic Modeling)

Abstract

:
With solar photovoltaics (PV) playing an increasing role in our global energy market, it is now timely and critical to understand the end of life management of the solar panels. Recycling the panels can be an important pathway, possibly recovering a considerable amount of materials and adding economic benefits from currently installed solar panels. Yet, to date, the costs and benefits of recycling, especially when externality costs resulting from environmental pollution are considered, are largely unknown. In this study, we quantified the private and externality costs and benefits of recycling crystalline silicon (c-Si) PV panels. We found that the private cost of end-of-life (EoL) management of the c-Si PV module is USD 6.7/m2 and much of this cost is from transporting (USD 3.3/m2) and landfilling (USD 3.1/m2), while the actual recycling process (the cost of consumed materials, electricity or the investment for the recycling facilities) is very small (USD 0.3/m2). We found that the external cost of PV EoL management is very similar to the private cost (USD 5.2/m2). Unlike the breakdown of the private costs, much of the externality costs (USD 4.08/m2) come from the recycling process, which suggests that more environmentally friendly methods (e.g., recycling methods that involve fewer toxic chemicals, acids, etc.) should be preferred. We estimated that the total economic value of the recycled materials from c-Si PV waste is USD 13.6/m2. This means that when externality costs are not considered, the net benefit of recycling is USD 6.7; when the externality cost of recycling is considered, there is still a net benefit of USD 1.19 per m2.

Graphical Abstract

1. Introduction

Solar photovoltaic (PV) technology plays an increasingly important role as a key energy source [1,2] As this technology grows, it is important to ensure that each process in the life cycle of PVs is sustainable [3,4]. The environmental impacts from manufacturing and operation of solar PV panels have been widely studied [5,6] and more recently, there has been a growing interest in understanding the environmental impacts of the end-of-life (EoL) management of solar panels [7,8,9]. Solar panels last from 20–30 years before weather and external conditions necessitate their retirement [10,11]. Because the mainstream, large-scale use of PV technology is relatively new, the infrastructure to recycle solar panels is not yet built for the capacity it must handle in the future [12]. The decrease in the price of PV modules’ and the reduction in the environmental impact of solar systems in comparison to traditional fossil fuel technologies has led to many more large-scale solar plants being installed [11,13]. The global annual PV power capacity installed was equal to 114 GW in 2019, a net year-on-year increase of 17.5% from 2018 [14,15]. This rapid increase in panel use necessitates responsible, industrial-scale recycling and disposal processes.
In developing recycling processes for solar panels, it is important for us to understand both the cost and environmental impacts of the technology. The environmental impacts of EoL management of solar PV panels has received great attention recently; many authors have estimated the environmental impacts of EoL of solar panels using the life cycle assessment method [16,17,18,19,20] These studies highlighted that the majority of the impacts are associated with chemical usage for process recycling as well as the transportation of PV waste at the EoL of PVs. These studies also widely found that the environmental harm that can be avoided by recovering materials from PV panels is greater than the environmental harm caused from the energy and fuel that it takes to recycle them. The cost of recycling solar panels has also received great attention [21,22,23,24]. The cost assessment studies concluded that the PV recycling process cost—more specifically, using mechanical and/or thermal methods—is the major contributor to the cost of EoL management of PV waste. Since these studies either focus on the cost or environmental impacts, and since each study focuses on a different recycling process, we cannot deduce how cost and environmental information relate to one another for a given recycling process. Besides, environmental cost PV EoL management has been largely ignored in the literature.
In this study, we addressed this issue by studying the “full recovery end of life photovoltaic project” (FRELP) method of recycling crystalline silicone (c-Si) panels. The FRELP approach has found technological solutions for every step of the c-Si PV treatment process and has been successful in translating this information into a technically and economically feasible industrial process design [20]. We monetized the environmental impacts of c-Si PV recycling using this approach to obtain the externality costs of the FRELP method. We also analyzed the FRELP method to estimate its private costs. We then created our cost model, which compares these private to externality costs and showed the net benefits of the FRELP method by comparing the economic and environmental benefits that can be supplied from the recovered materials and processes associated with EoL management.

2. Method

2.1. Data Collection
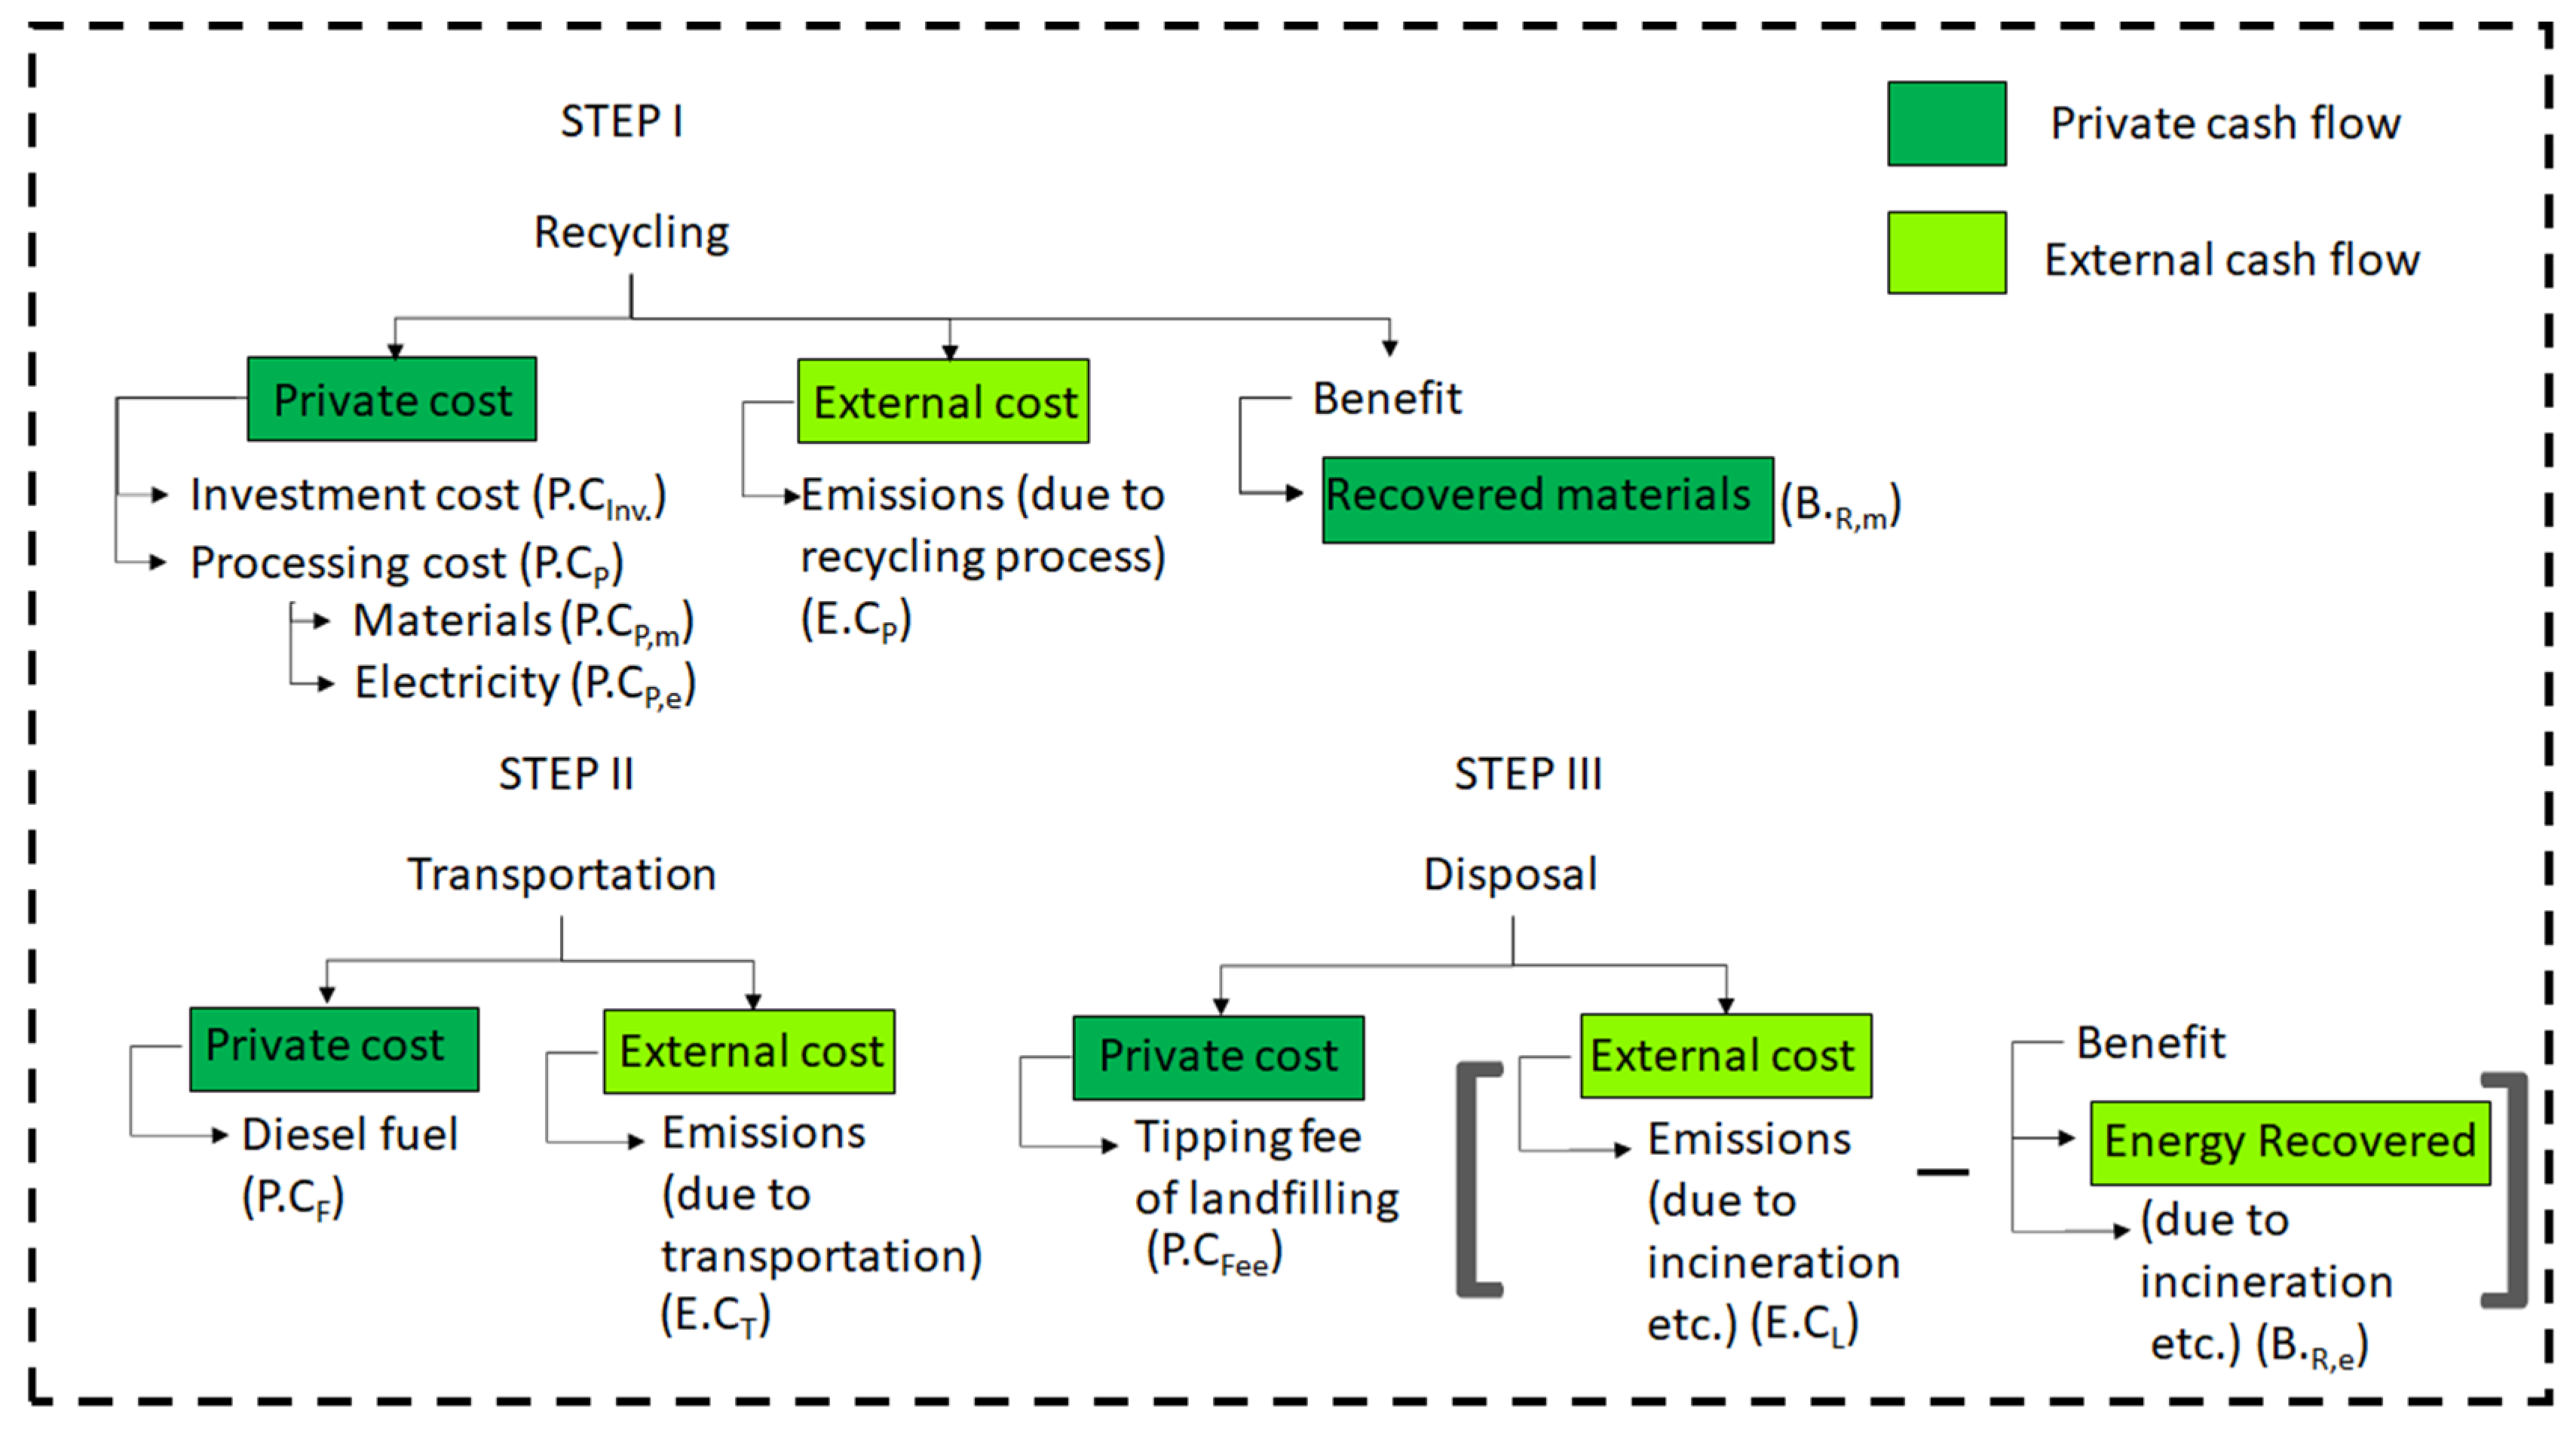
There are several methods that have been proposed or are in use for the recycling of solar panels [21,22,25,26]. Of these, we followed the FRELP method, proposed by Latunussa et al., because, unlike other studies, FRELP was developed for industrial-scale recycling and all the details of life cycle inventories, including emissions from the facility and the efficiency of recycling, achieved yields data that were provided clearly, making the method easy to understand and utilize to expand for further cost analysis [20]. The FRELP method aims to test new methods and technologies with the goal of 100% recycling of PV panels in an economically responsible manner. Data on process costs and investment costs of the PV recycling process were developed using literature and industry data which can be found throughout the Supplementary Information tables (Tables S1 and S2).
The method of recycling we modeled by Latunussa et al., 2016, is acid leaching and electrolysis (Figure 1). In this process, after the PV panels are unloaded into the recycling facility, they are disassembled, the glass is separated and refined, and the PV sandwiches are cut and incinerated. The bottom ash from the incinerator is shipped to a different facility to be sent through several processes including sieving, acid leaching, filtration, electrolysis, neutralization, and a filter press. These processes for treating the bottom ash make up all the material inputs in the process cost of PV recycling and more than half of the electricity input. From these recycling steps, the recovery materials of aluminum scrap, silicon scrap, silver scrap, copper scrap, and glass scrap are recovered. Liquid wastes, sludge, hazardous fly ash, and contaminated glass produced during the entire recycling process (all waste boxes in Figure 1) are sent to landfills.
Figure 2 shows the costs and benefits considered in the analysis. The data were broken down into several different components: process costs, investment costs, environmental externality costs, recovered material costs, transportation costs, policy benefit costs, and landfilling tipping costs. The functional unit used in this work is 1 m2 of PV. The private costs (defined as the market cost for a technology or production), external costs, and benefit costs are all broken down in terms of this unit.
To quantify the different values shown in Figure 2, the below equations were used:
Total cost of PV Recycling = ∑Private Cost + ∑External Cost − ∑Benefits
Private cost of PV recycling = P.CInv + P.CP,m + P.CP,e + P.CF + P.CFee
External cost of PV recycling = E.CP + E.CT + E.CL
Benefits of PV recycling = B.R,e + B.R,m.
In calculating the private cost (P.C) values, we consider all the private transactions that a PV recycler would have to pay during the end of life management of PV waste. For example, throughout the recycling process of PV waste (STEP I in Figure 2), the PV recycler must invest in purchasing the instruments (See Supplementary Information Table S2 required for operating the process (P.CInv) (see Table S2). In addition, the cost of materials (P.CM) (see Table S1) and electricity (P.CE) (Table S1) utilized in operating these instruments are considered. Similarly, during the transportation (STEP II in Figure 1) of PV waste (from installation location to recycling center and from recycling center to landfills), private cash flows are associated with the cost of fuel consumption of the trucks (P.CF) (Table S3) that carries the PV waste. Finally, during the landfilling of unrecovered materials (STEP III in Figure 1), a tipping fee is paid for dumping non-hazardous materials, P.CFee (Table S4).
The external cost in Equantion 1 refers to the cost of environmental damage resulting from the pollutants released during the end-of-life management of PVs, expressed as the dollar value. The external cost of the emissions from recycling process (E.CP) (Table S5), transportation (E.CT) (Table S6), and incineration during the landfilling (E.CL) (see Table S7) are considered in this analysis.
Equations (2)–(4) show all the components of our cost calculation framework. Note that we normalized all these values in terms of 1 m2 c-Si PV module, since a unit surface area is the functional unit of this study.
Finally, the economic value of benefits of end-of-life management associated with the recycling and landfilling of PV waste were assessed. The private benefit value of recovered materials (BR,m e.g., from scrap metals) (Table S8) and energy (BR,e e.g., as electricity) (Table S7) are analyzed as positive private cash flows in the framework.

2.2. Private Cost

P.CInv is important to discuss in the private cost assessment of PV recycling because, before being able to make a turn of profit on PV recycling, an infrastructure must be set up. This can require significant amounts of money as many innovative PV recycling processes warrant new, specialized equipment. Another issue is that the profitability of investments related to the construction of PV recycling facilities and equipment is guaranteed only by the management of great amounts of wastes [23]. In small or lab-scale operations, high investment costs may mean that a facility never turns a profit. This paper draws its investment costs from processes required in the FRELP method, in which insight into the steps of the PV recycling techniques was given. The costs of equipment were taken from manufacturers’ websites [27,28]. In order to complete the recycling processes described in the paper the costs of purchasing, these technologies must be taken into account. Although these are traditionally one-time costs, the lifetime of machinery, yearly mass produced, and number of panels in our functional unit were considered to represent the investment cost of PV relative to the other process costs on a 1 m2 basis. Table S2 in the Supplementary Information tables is a collection of the supplies and costs of the equipment needed for c-Si investment for the given recycling process.
The transportation costs were found by utilizing Latunussa data on distance traveled (km), averaging diesel cost, and estimating average semi-truck fuel efficiency. This can be found in Supplementary Information Table S3.

2.3. External Cost

The environmental externality cost (E.C) data were estimated by multiplying the emissions from the recycling process with the damage cost per mass of emissions
E.C = Emission (kg) × Damage Cost (USD/kg).
Emission data were taken directly from Latunussa’s paper. The PV recycling pollutant numbers were multiplied by the found environmental externality multipliers to determine the approximate cost of the process’ impact per material. The data for these externality values comes from four sources [23,29,30,31,32] The Supplementary Information tables include all externality tables for the recycling of PV panels (Tables S5–S7). Below are the impact categories used in this paper and their corresponding damage cost values. Within the four papers from which this data was pulled, some variation occurred between values. For simplicity in this paper, the damage cost number listed below was pulled from its most recent publicized representation. For example, if a value for CED was found in three of the four papers, the value used in this paper would be pulled from the most recently published work. The nature of the gaps between the values can be investigated in their original work, but, in short, different LCA metrics have different environmental impacts which cause distinct environmental damage. Some of the metrics with higher damage costs are those which have impacts that society deems more disruptive and unsafe than others.

2.4. Benefits

The benefit cost data were found by adding the monetized energy recovered from the incineration disposal process and the cost payback from the materials recovered during the recycling process
Benefits of PV recycling = B.R,e + B.R,m.
Recovery yield was included within the scope of this paper because it is an important aspect when evaluating the success of the cost-saving measures of using non-virgin materials. Although the recycling process requires high up-front investment costs, money can be saved in the purchasing of new materials. This is because many of these materials are saved after the recycling process and can be sold to manufacturers or, in the case of First Solar, with its identity as both a manufacturing and recycling facility, processed again as recycled feed (First Solar’s Module Collection and Recycling Program). The beneficiary of the recovered products depends on whether there is a closed-loop vs. open-loop process. In an open-loop process, materials are sold to external processing facilities, and in a closed-loop process, the materials are sent to make more of the same product they had been pre-recycled.
In this work the percent yields of recovered materials were taken from the literature [20]. Using these numbers, the cost of the recovered materials per m2 were found. Recovery cost tables can be found in the Supplementary Information tables (Tables S5 and S6).

3. Results

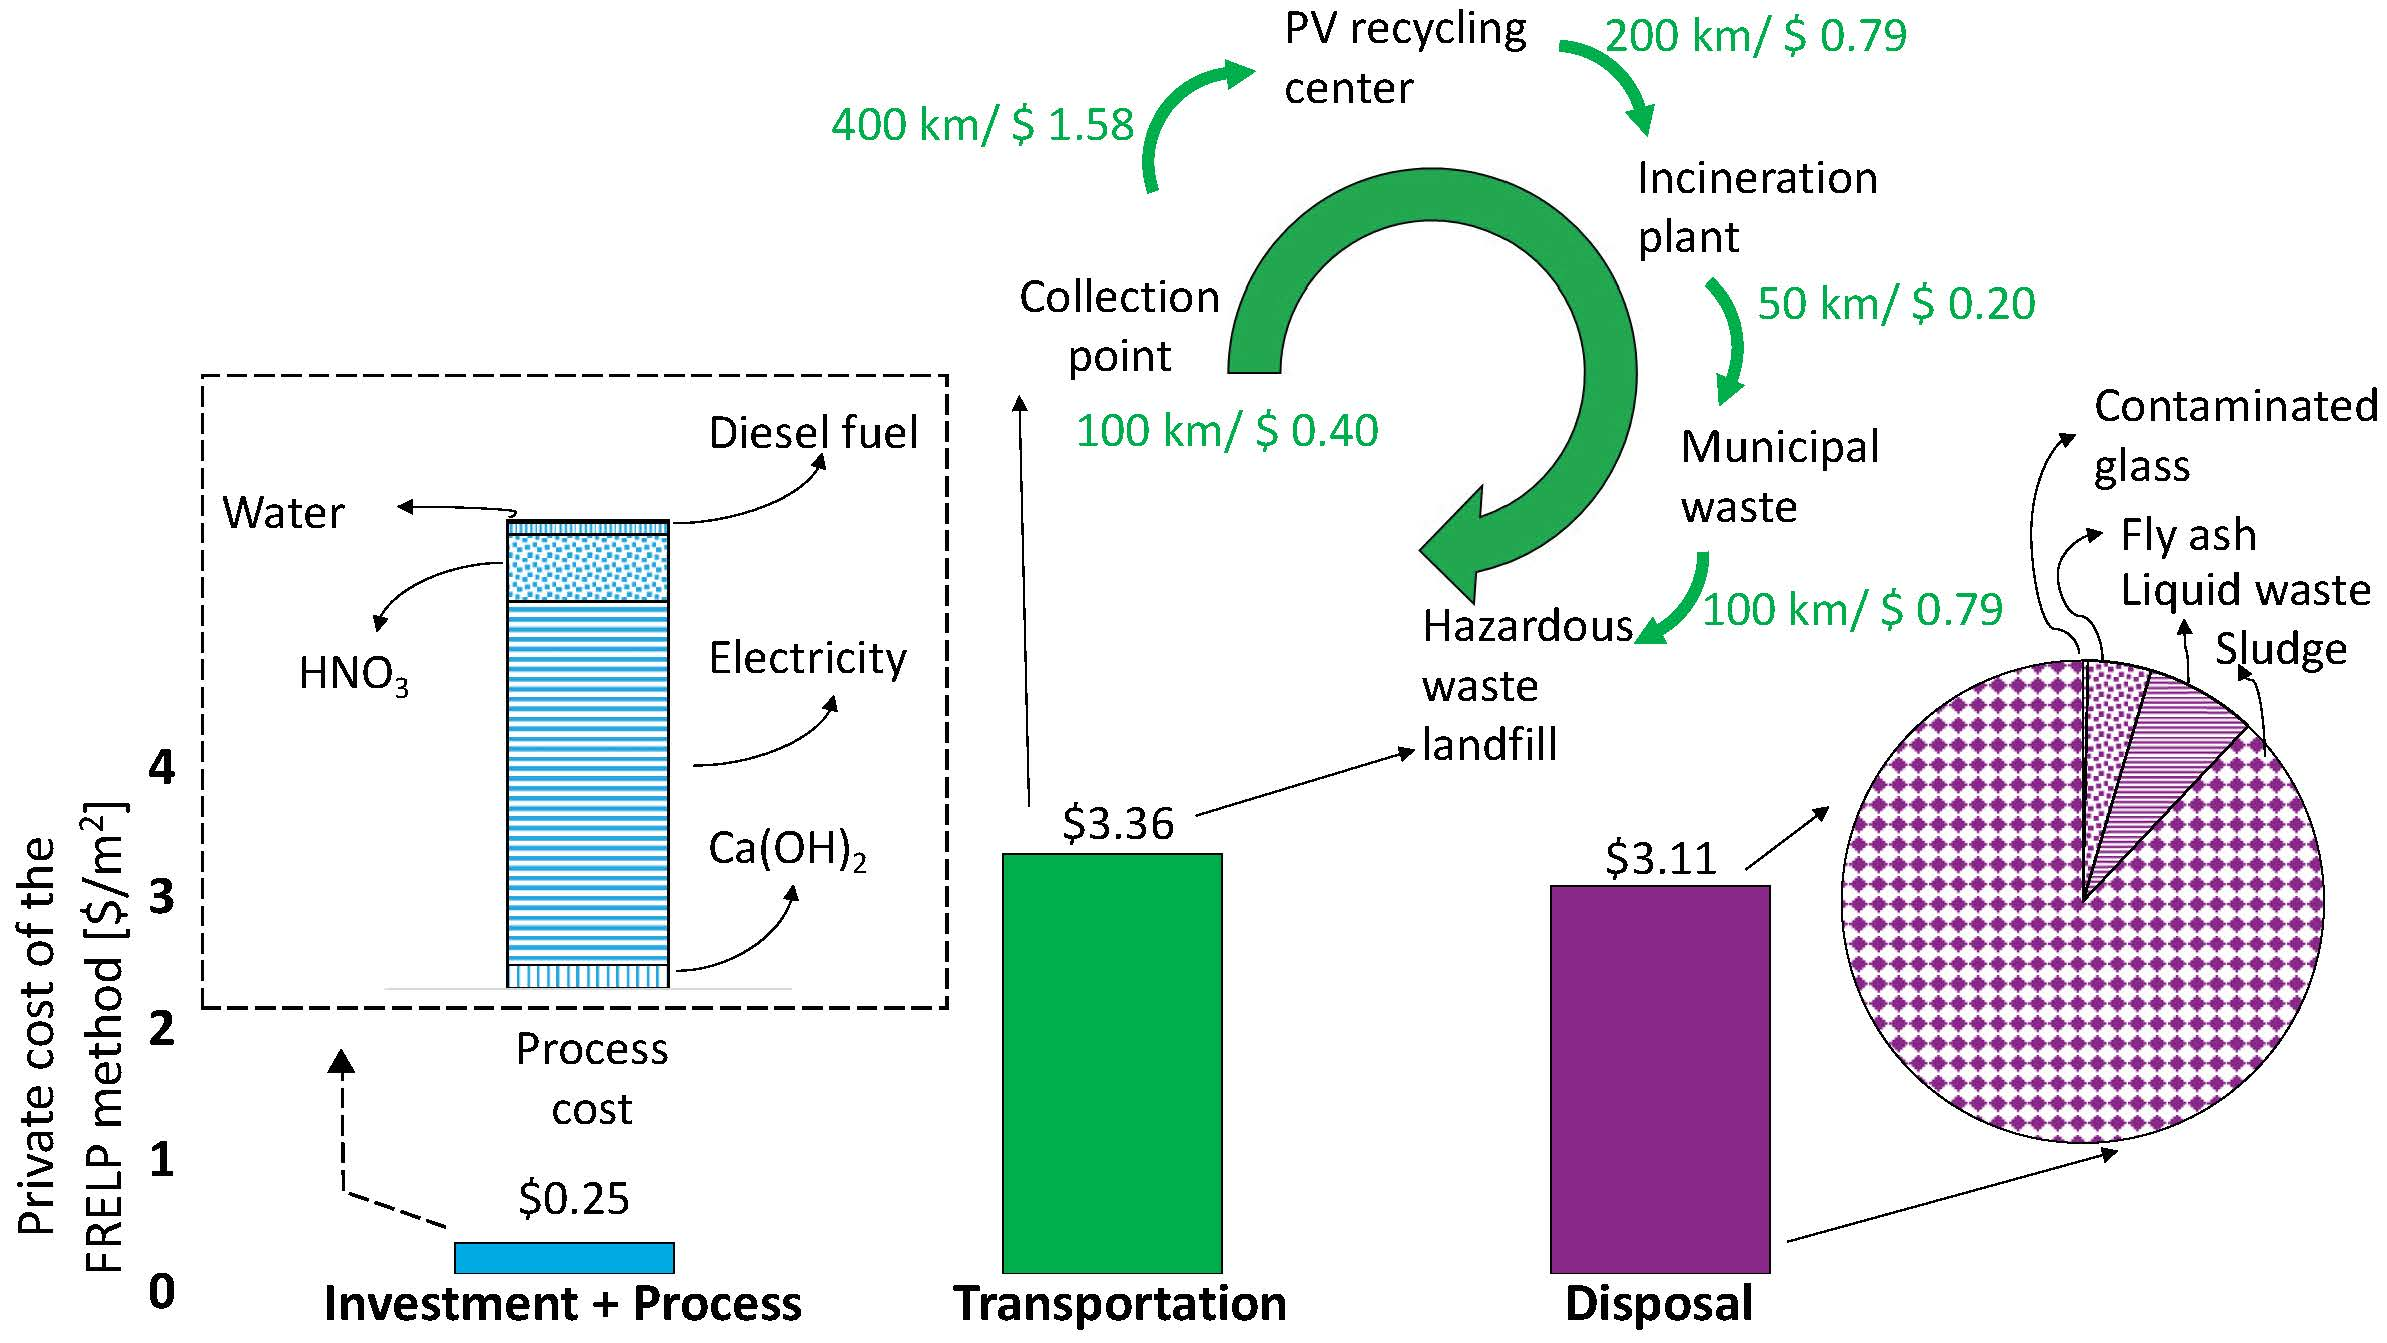
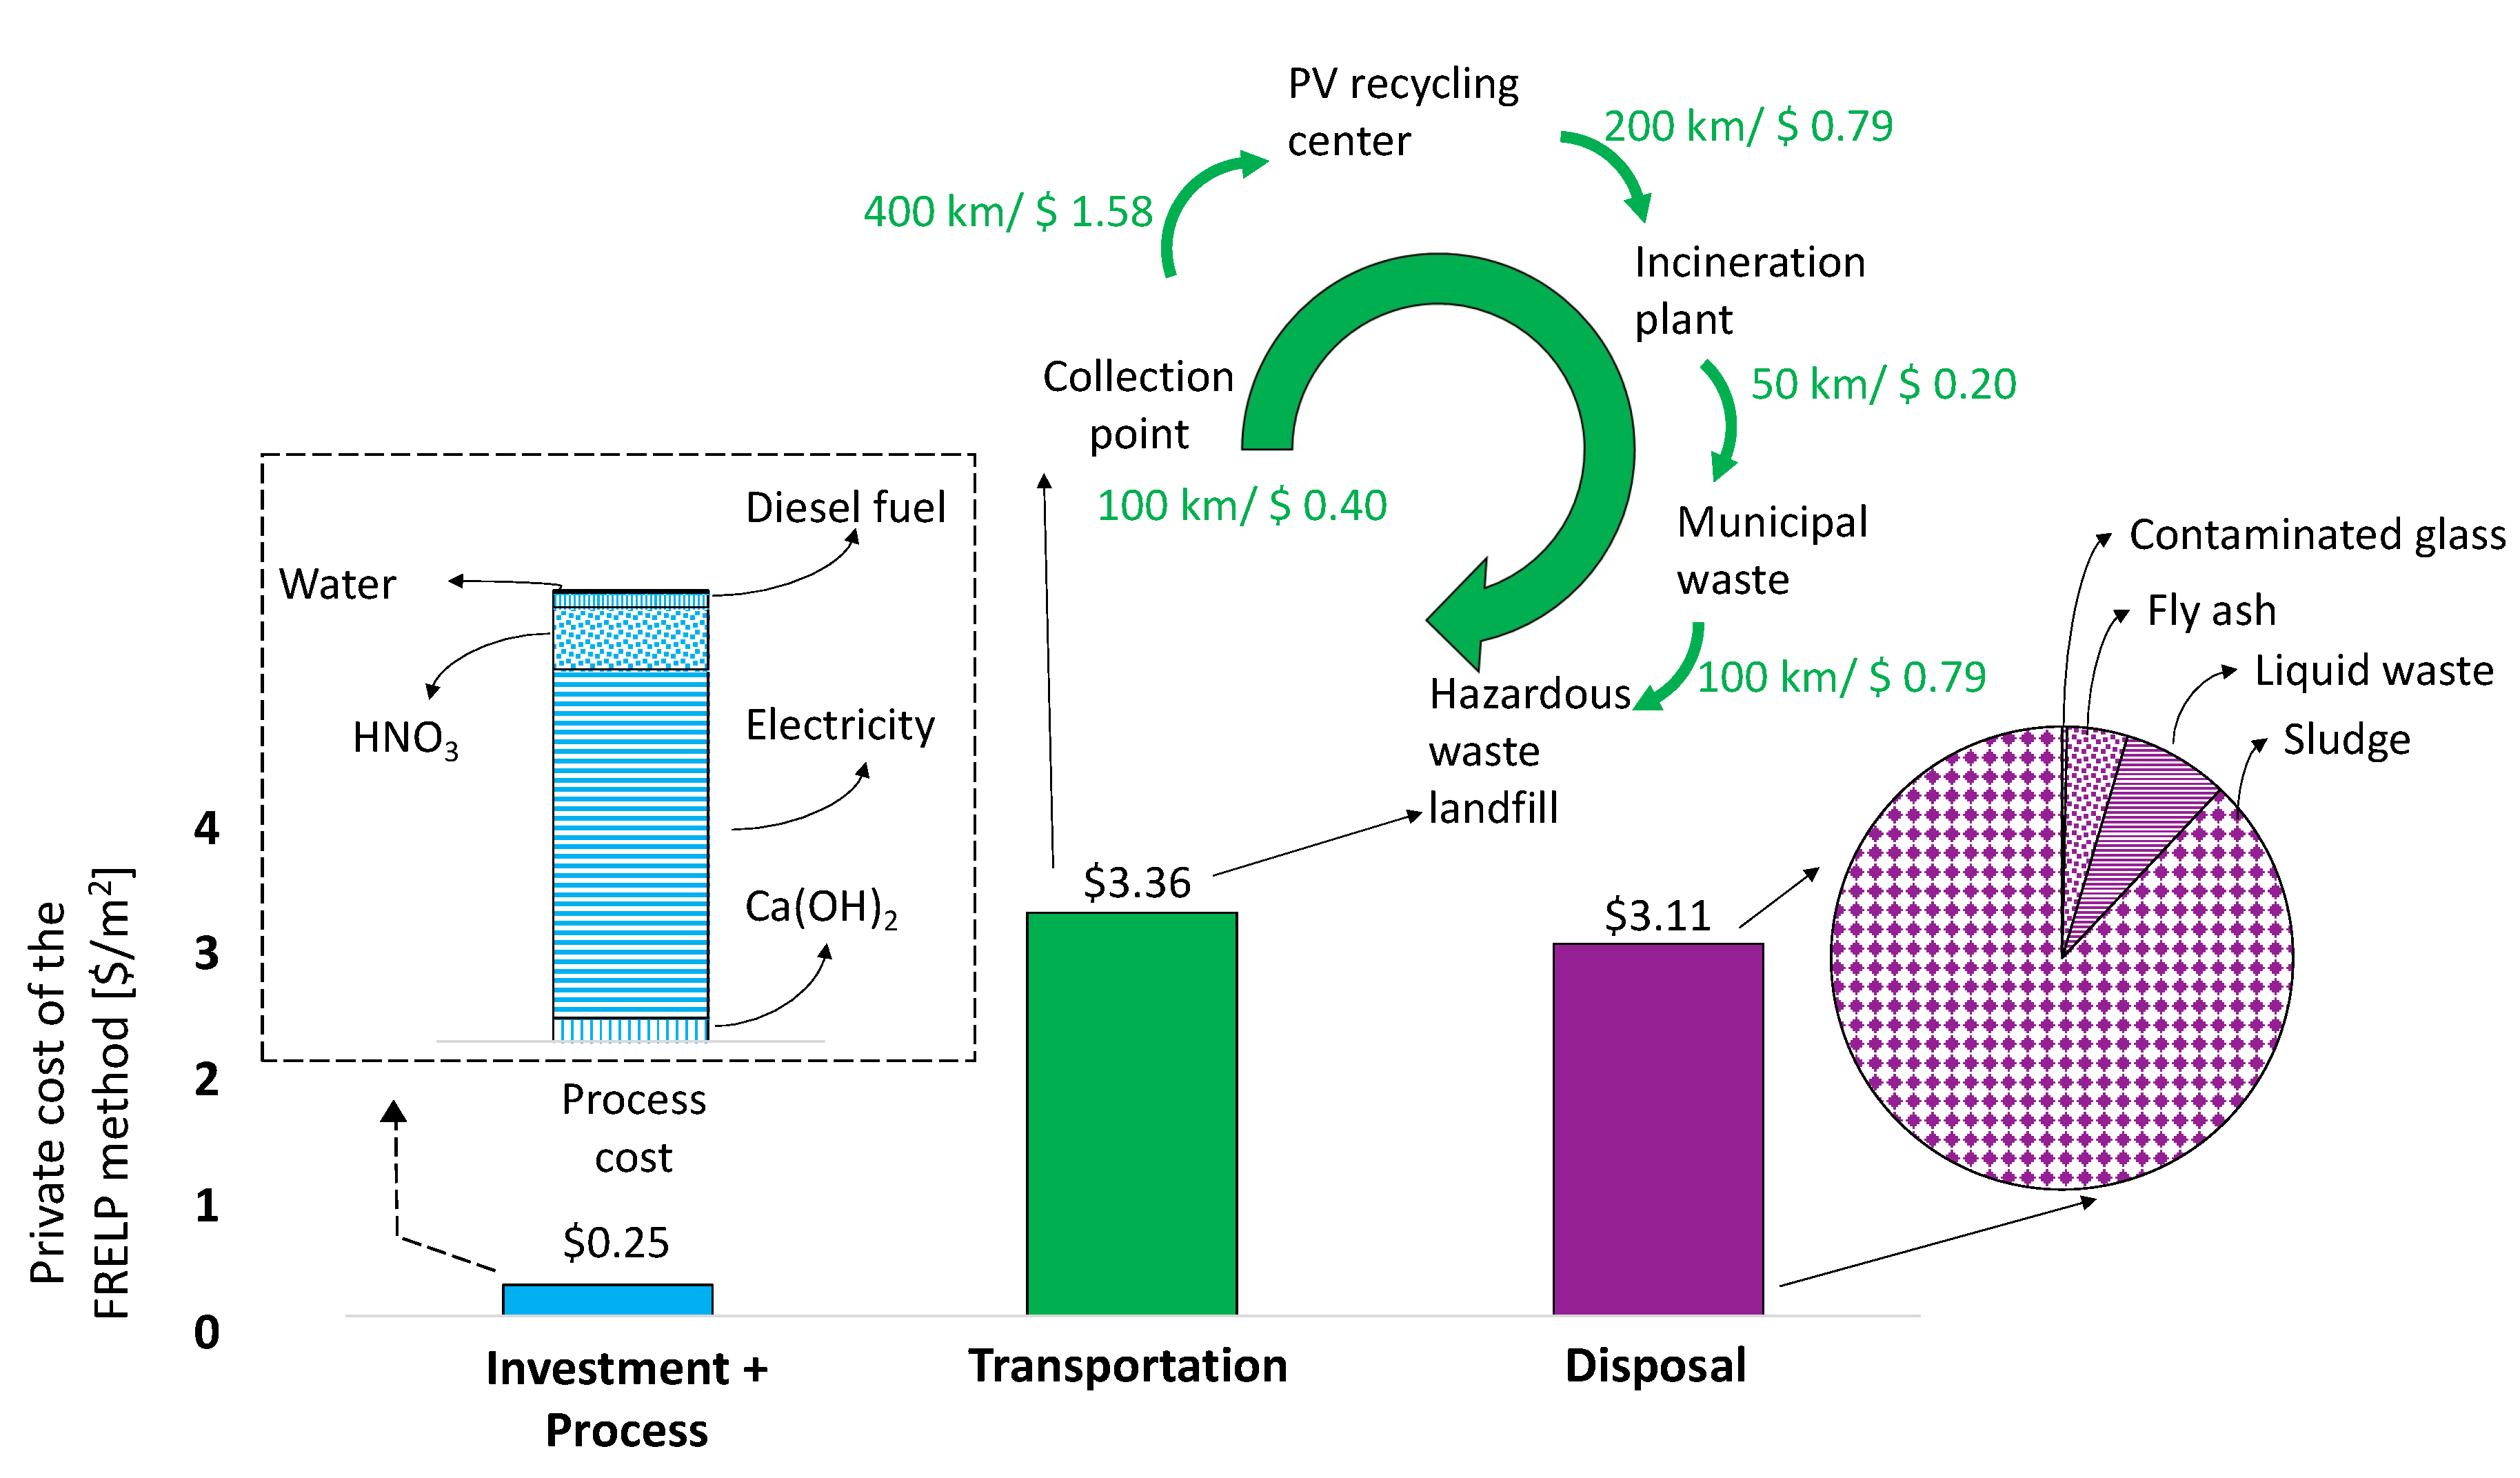
3.1. Private Cost of Recycling

The total EoL cost of 1 m2 of c-Si PV module was found to be USD 6.72/m2 (Figure 3). Of the three cost components of PV EoL management, the transportation-associated cost was found to be the highest (USD 3.36/m2) while the cost of the recycling process (the cost of consumed materials, electricity or the investment for the recycling facilities) was found to be the most insignificant (USD 0.25/m2).
The main reason for the high transportation cost can be attributed to the long distance of transportation required in the end-of-use of PV panels. Figure 3 also shows each transportation step and its cost in carrying them with a truck, as referred to in the FRELP method. The costs of each transportation step correlate directly with the distance between facilities. As can be derived from Figure 3, the long distances from deployment locations to PV recycling facilities are the main drivers of the high cost due to transportation in the EoL of PVs (an average of 400 km away from the collection points [20]). The table containing these distances can be found in Supplementary Information Table S3 (note that the cost of transportation is linearly proportional with traveled distances).
The disposal cost of c-Si PV waste is made up of the tipping fees for four materials such as contaminated glass, fly ash, liquid waste and sludge (Figure 3) in landfills. The landfilling associated cost can be attributed to the high cost of tipping fees for the sludge treatment that consists of hazardous materials. The recycling of 1 m2 of c-Si PV resulted in the generation of 0.70 kg of sludge, which equals approximately 90% of the total landfilling cost of c-Si PV’s EoL management. For every 1000 kg of PV panels processed, 374.4 kg of waste is produced [20].
The total cost of the investment and processing for recycling has a minor impact on the private cost of c-Si PV’s EoL management. In the FRELP recycling method, diesel fuel, electricity, nitric acid (HNO3), water, and calcium hydroxide (Ca(OH)2) were consumed during the recycling process of c-Si PV modules. Figure 3 also shows the cost breakdown of these process inputs. As seen, the electricity consumed is the most expensive cost component of the PV recycling process, with a value of 12 cents/kWh. Electricity is only used in the recycling process, totaling 1.55 KWh. The electricity is consumed in multiple steps during recycling such as during disassembly of the module, glass separation, and PV sandwich cutting. The second-largest cost component of the recycling process can be contributed to the chemicals required. The FRELP method utilizes 0.1 kg of nitric acid per 1 m2 during the acid leaching process. Another chemical utilized during the FRELP method is calcium hydroxide, which is needed for the neutralization step of PV dismantling. This step is necessary because of the need to neutralize the nitric acid used in the acid leaching step beforehand. A total of 0.5 kg of calcium hydroxide per 1 m2 is used, making it the largest amount of material required for the direct PV dismantling process, disregarding water. We found the impact of the investment cost for the instruments required for the recycling of c-Si PV panels is insignificant (¢1.1/m2). The most outstanding cost component among the eight pieces of the instruments required for the FRELP process was found in the cartesian robot system, making up ¢0.6/m2. Note that the instruments used in PV recycling can process about 8 million kg of PV waste annually and they can be used for long period of time (approximately 20 years) [20]. Therefore, their impact on processing 1 m2 of the PV module was found to be very limited.
Faircloth et al. [33] also calculated the processing cost of the FRELP method as USD 0.03 per kg PV waste, which equals USD 0.48 per m2 of PV waste, assuming that the FRELP recycling facility operates in Thailand. The difference (24 cents per m2) between the processing cost of our and Faircloth et al.’s [33] results can be attributed to the differences in the cost of materials (acids, diesel fuel, water etc.) and electricity in the US and Thailand which are required for the FRELP process, as well as differences in methods of recycling. Similarly, we compared the disposal cost of the unrecovered materials from the recycling of PV waste with Faircloth et al.’s values [33]. However, the high cost of transportation was not identified in the literature. The reason could be the difference in the modeling approaches on transportation distances. Faircloth et al [33] assumed the total distance of travel as 100 km while Latunnusa et al [20] reported the overall distance of travel as 850 km. The type of fuel used is another factor which could cause discrepancies between different papers about PV transportation. However, diesel fuel is used by both this paper and Faircloth et al. [33].

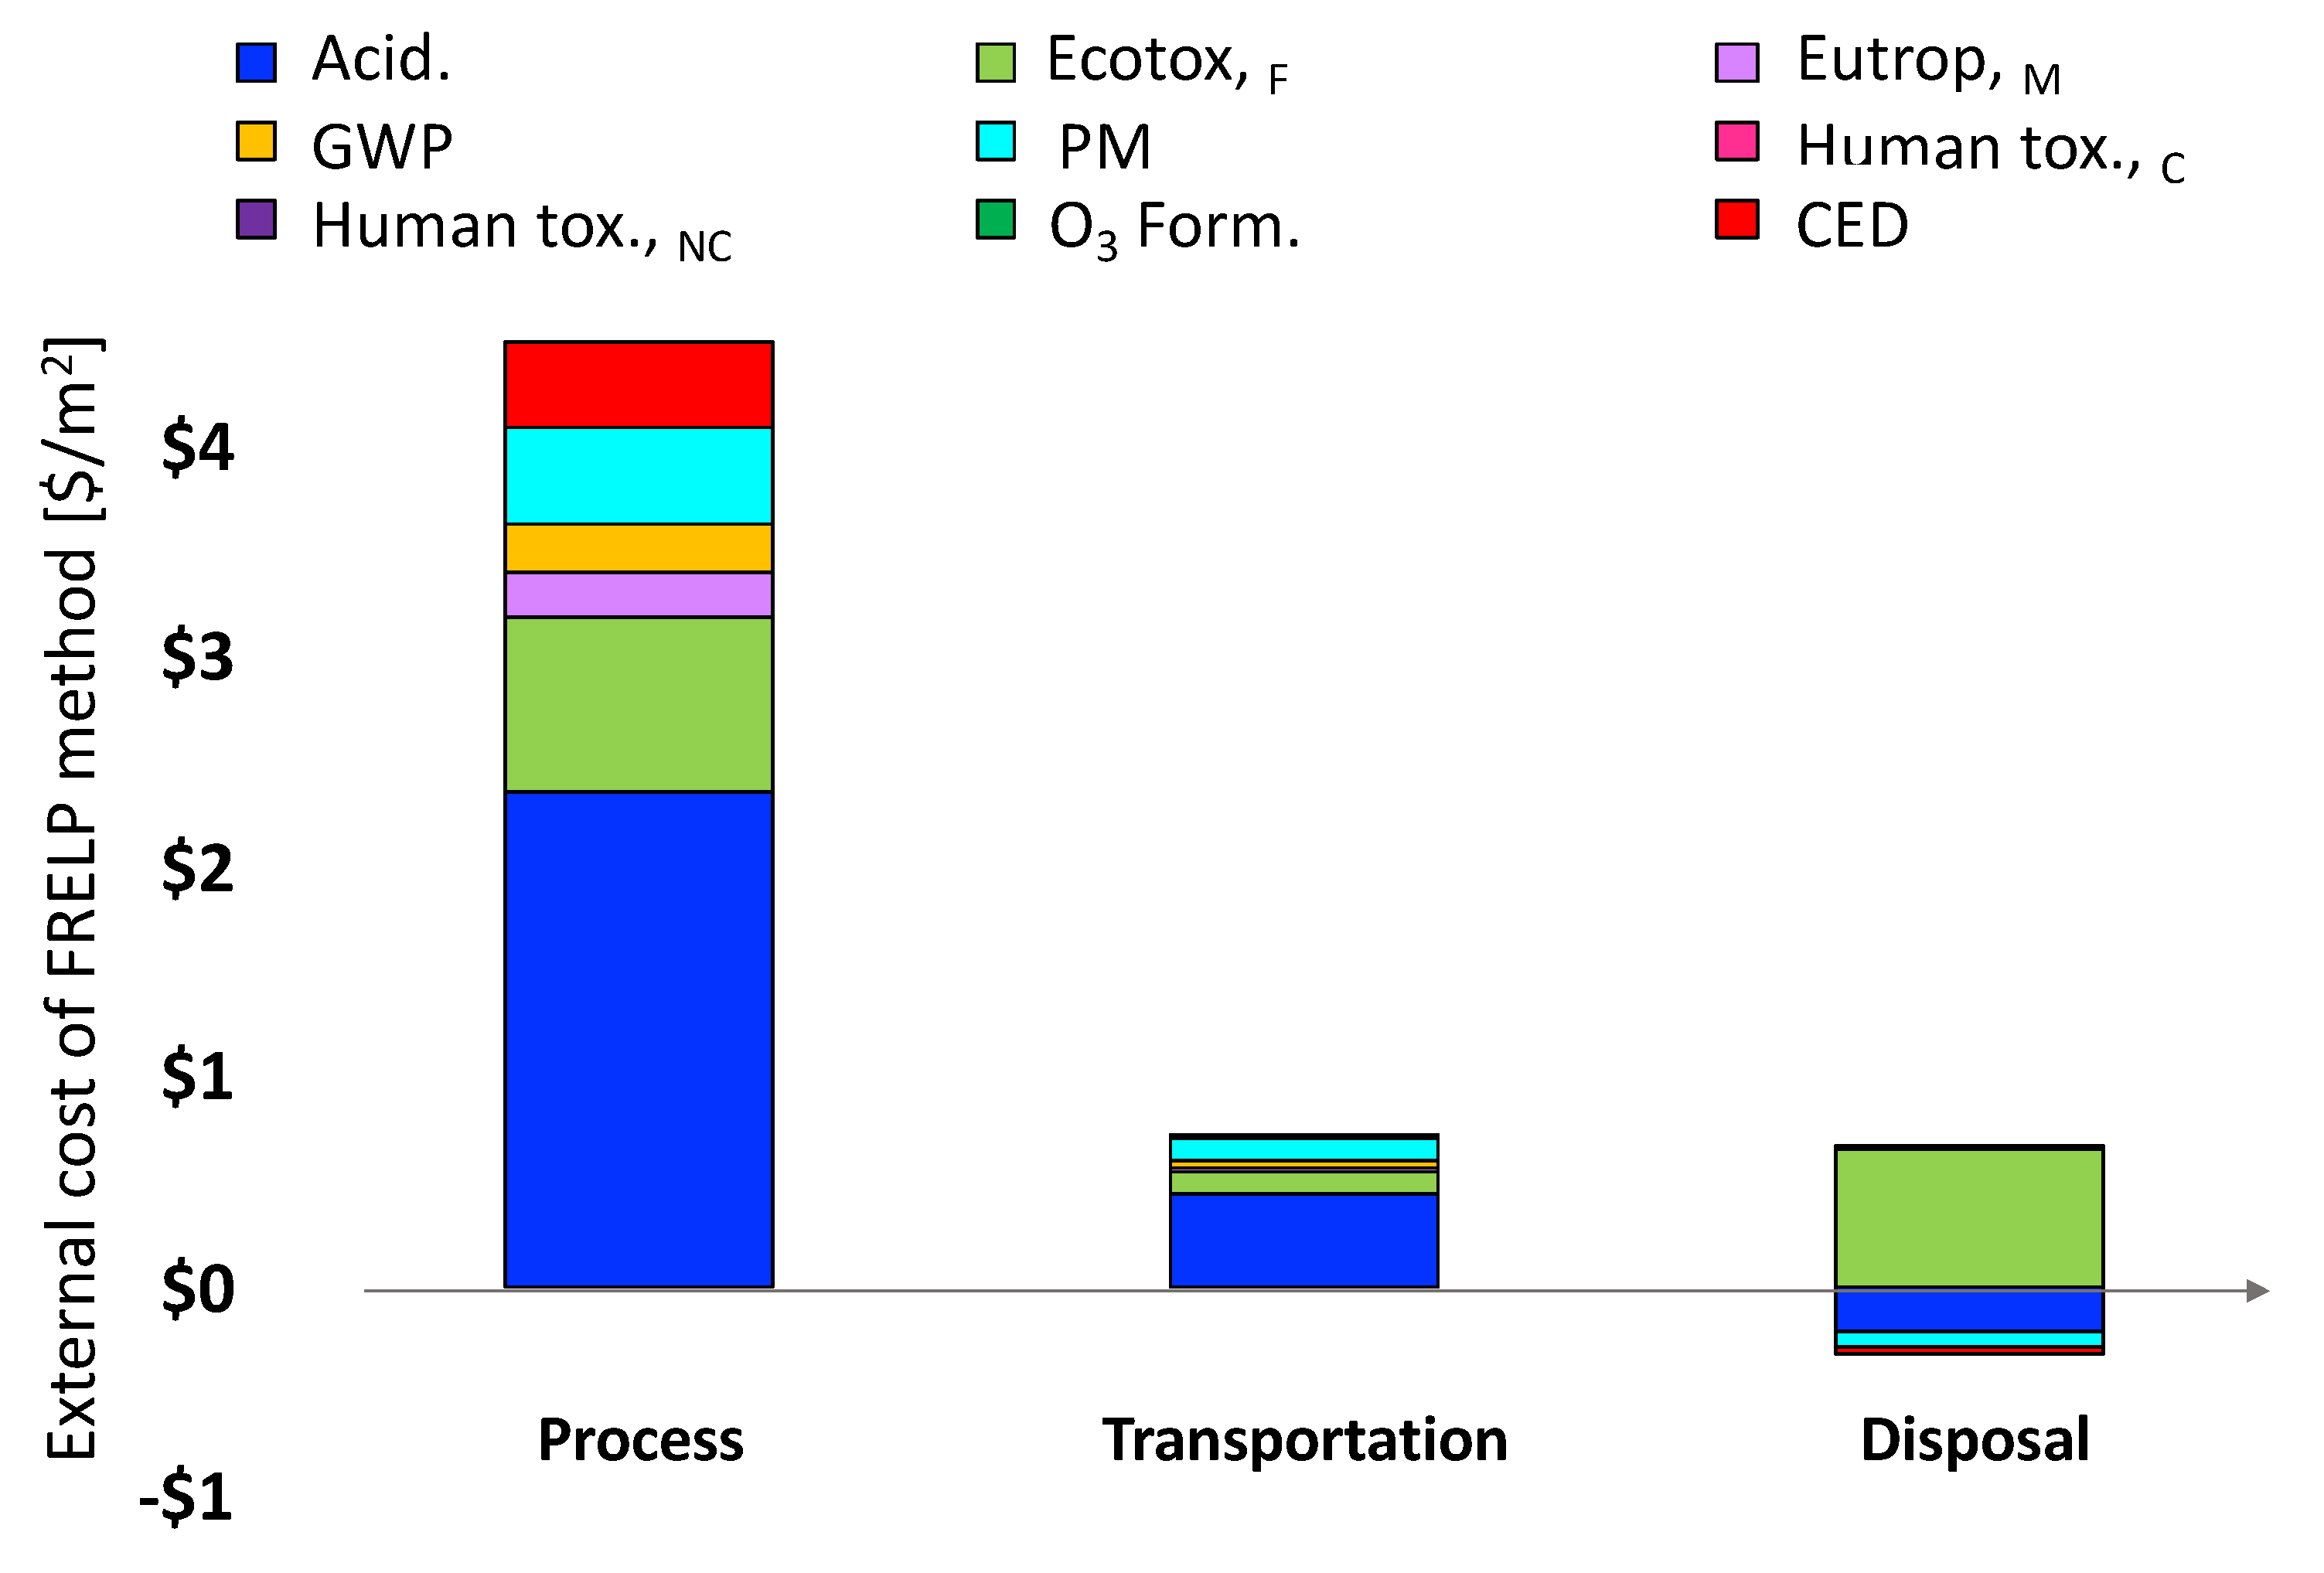
3.2. External Cost of Recycling

We found that the total external cost of PV EoL management is about USD 5.7/m2. The PV recycling process makes up the majority of the external costs (USD 4.08/m2) since the environmental impacts associated with the processing of PV waste have a greater environmental impact than the sum of both the impacts of transportation (USD 0.73/m2) and landfilling (USD 0.36/m2). In fact, both transpiration and landfilling combined only make up 19% of the total external cost of PV EoL management. Various reasons cause this contrast. First off, the landfilling value is low because the positive impact of recovered energy from landfill incineration is factored into the total. This energy recovered offsets some of the negative externality costs of landfilling. The recycling process uses different chemicals such as HNO3 and Ca(OH)2, which are particularly harmful for the environment. Both the transportation and recycling processes require the input of diesel fuel, however, because the recycling process requires other chemical inputs as well, it acquires a higher external cost. This relationship can be seen in Figure 4 below.
The emissions associated with acidification, ecotoxicity and particulate matter (PM) impacts have the greatest external cost. Particularly, acidification-related emissions dominate the recycling and transportation steps of c-Si PVs’ EoL phases. About 75% of acidifying emissions of the recycling process are released to the environment during the sieving and acid leaching of c-Si modules to separate the content of the materials of the silicon wafer and during the filtration, electrolysis, and neutralization processes to extract copper, metallurgical grade silicon and silver materials from the silicon wafer [20]. The acidifying emissions of transportation are due to the upstream emissions of diesel fuel extraction in refineries [20]. Figure 4 also shows that the external cost of landfilling is dominated by the particulate matter (PM) emissions. These PMs are released during the incinerations of polymer-based materials such as cables used in the balance-of-system of PV modules and encapsulant materials (Ethylene Vinyl Acetate (EVA)). Note that another reason that acidification and particulate matters dominate the external cost of c-Si PV’s EoL management is that these two impact categories are priced with the highest externality cost according to x and y sources, with USD 341.80 kg PM2.5-eq and USD 64.47 per kg of SO2, for particulate matter and acidification impacts, respectively.
The second highest external cost contributor to the recycling process and transportation steps of c-Si PV’s EoL management was found to be the freshwater ecotoxicity (Ecotox.,F). This is important to note because the cost value associated with freshwater ecotoxicity is on the lower end of the damage cost values shown in Table 1, which indicates that the number of ecotoxic emissions is greater than other emissions during the EoL management of PVs. Similar to particulate matter impacts, the incinerations of polymer-based materials are found to be the reasons for the harmful ecotoxic emissions to freshwater. The incineration process does not involve direct emissions to water. Rabl et al. explain that the air emissions from incinerators end up in water bodies due to the wet or dry deposition of aerosols [34]. Among the ecotoxic emissions from incinerators, the impact of mercury, lead and chromium was found to be dominant [34].
The net external cost of disposal was found to be the lowest. In fact, the external cost of the landfilling process is very similar to transportation; however, the negative cost (avoided impacts) due to heat generation in the incineration creates credit values, which resulted in a lower external cost during the landfilling.

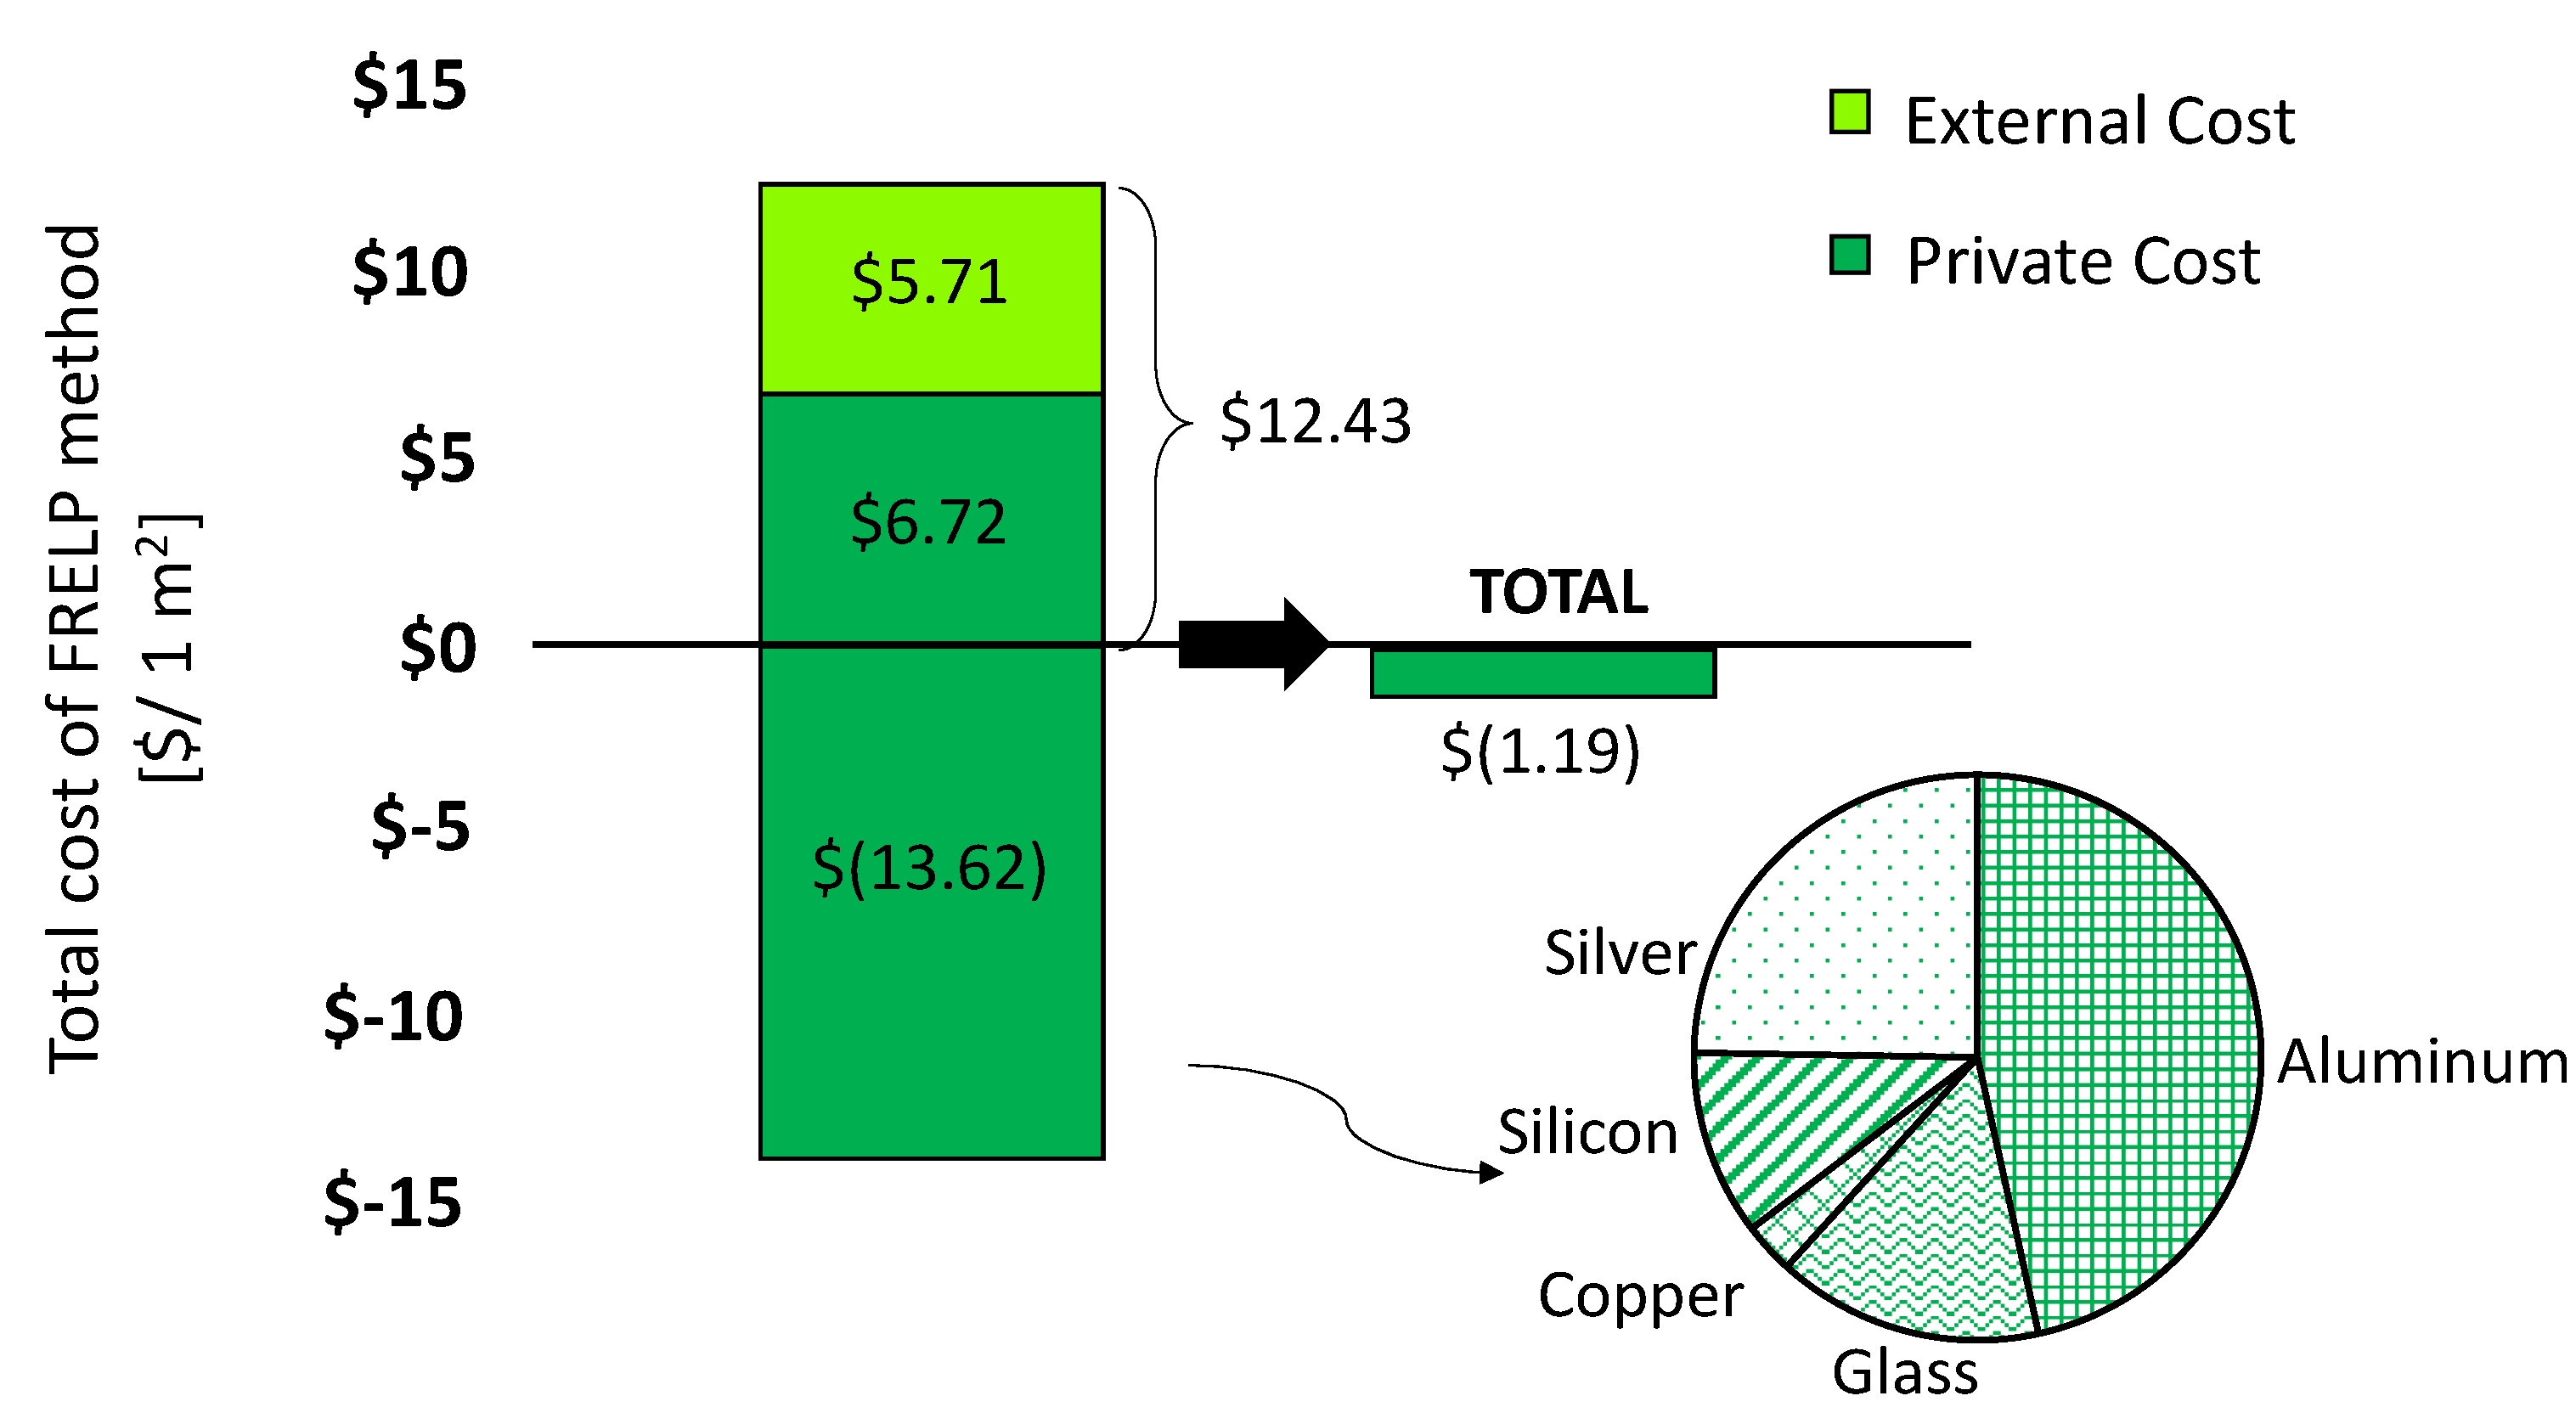
3.3. Cost–Benefit Analysis of Recycling

Figure 5 offers a cost–benefit analysis on recycling c-Si PV modules in their EoL. The negative cost values (benefits) show the revenue that can be realized the PV waste, while the positive cost values indicate the private and external cost of PV EoL management. The economic value of recovered materials through FRELP method was found to be USD 13.6/m2 while the private cost of the method was calculated as USD 6.7/m2. Taking the difference results in USD 7 of net economic benefit per recycling 1 m2 of c-Si waste PV panel using FRELP method. This high net economic benefit value is due to the high material recovery rates in the FRELP. In the FRELP method, the material recovery rates are 96.2% (aluminum), 98% (glass), 74.5% (copper), 38.6% (silicon) and 11.3% (silver) [20]. However, the breakdown of the total revenue that can be realized from the reselling of the material recovery is 46% (aluminum), 25% (silver), 15% (glass), 11% (silicon) and 3% (copper), based on the market prices of these commodities [35] (see Supplementary Information Table S8). These results indicate that the substantial increases in the net economic benefit from c-Si PVs are hindered by the limited recovery rate of silver. For example, increasing the recovery rate of silver from 11% to 20% will result in a nearly 25% increase (from 13.62 to 16.22) in the total benefits from material recovery.
The recycling process is a net benefit to the society, even when we include the externality costs of recycling. The total cost of c-Si recycling, including both private and external costs, is USD 12.43 without considering the benefit from recovered materials. When this benefit is added, the cost—or more accurately the benefit—is USD 1.19, meaning there is still a benefit from recycling c-Si PV even when the externality costs of recycling are considered. The total cost of PV recycling we found is USD −1.19/m2, meaning that it is cheaper to recycle and use PV panels made from recycled materials than it is to throw these materials away at their end-of-life and use virgin materials.
Our net economic benefit results are consistent with the existing literature studies. Adamo et al. [36] also analyzed the cost of waste c-Si PV waste and reported that the cost of c-Si PV recycling varies from 8–19 EUR/m2 (assuming that the c-Si PV module weighs 16 kg/m2). The higher benefits in Adamo et al.’s result can be explained due to the modeling approach of transportation and disposal. Adamo et al. ignored the cost of transportation and tipping fees and only modeled the cost of the recycling process for the net economic benefit. If we performed the same analysis as Adamo, our result would show a USD 13/m2 benefit, which is consistent with Adamo et al.’s result. Choi and Fthenakis calculated the net benefit as about 23 USD/module for thin-film CdTe PV technology [7,36]. The higher benefits from CdTe technology can be attributed to the high yields (>90%) of expensive materials (i.e., tellurium, cadmium) from the recycling of thin films.

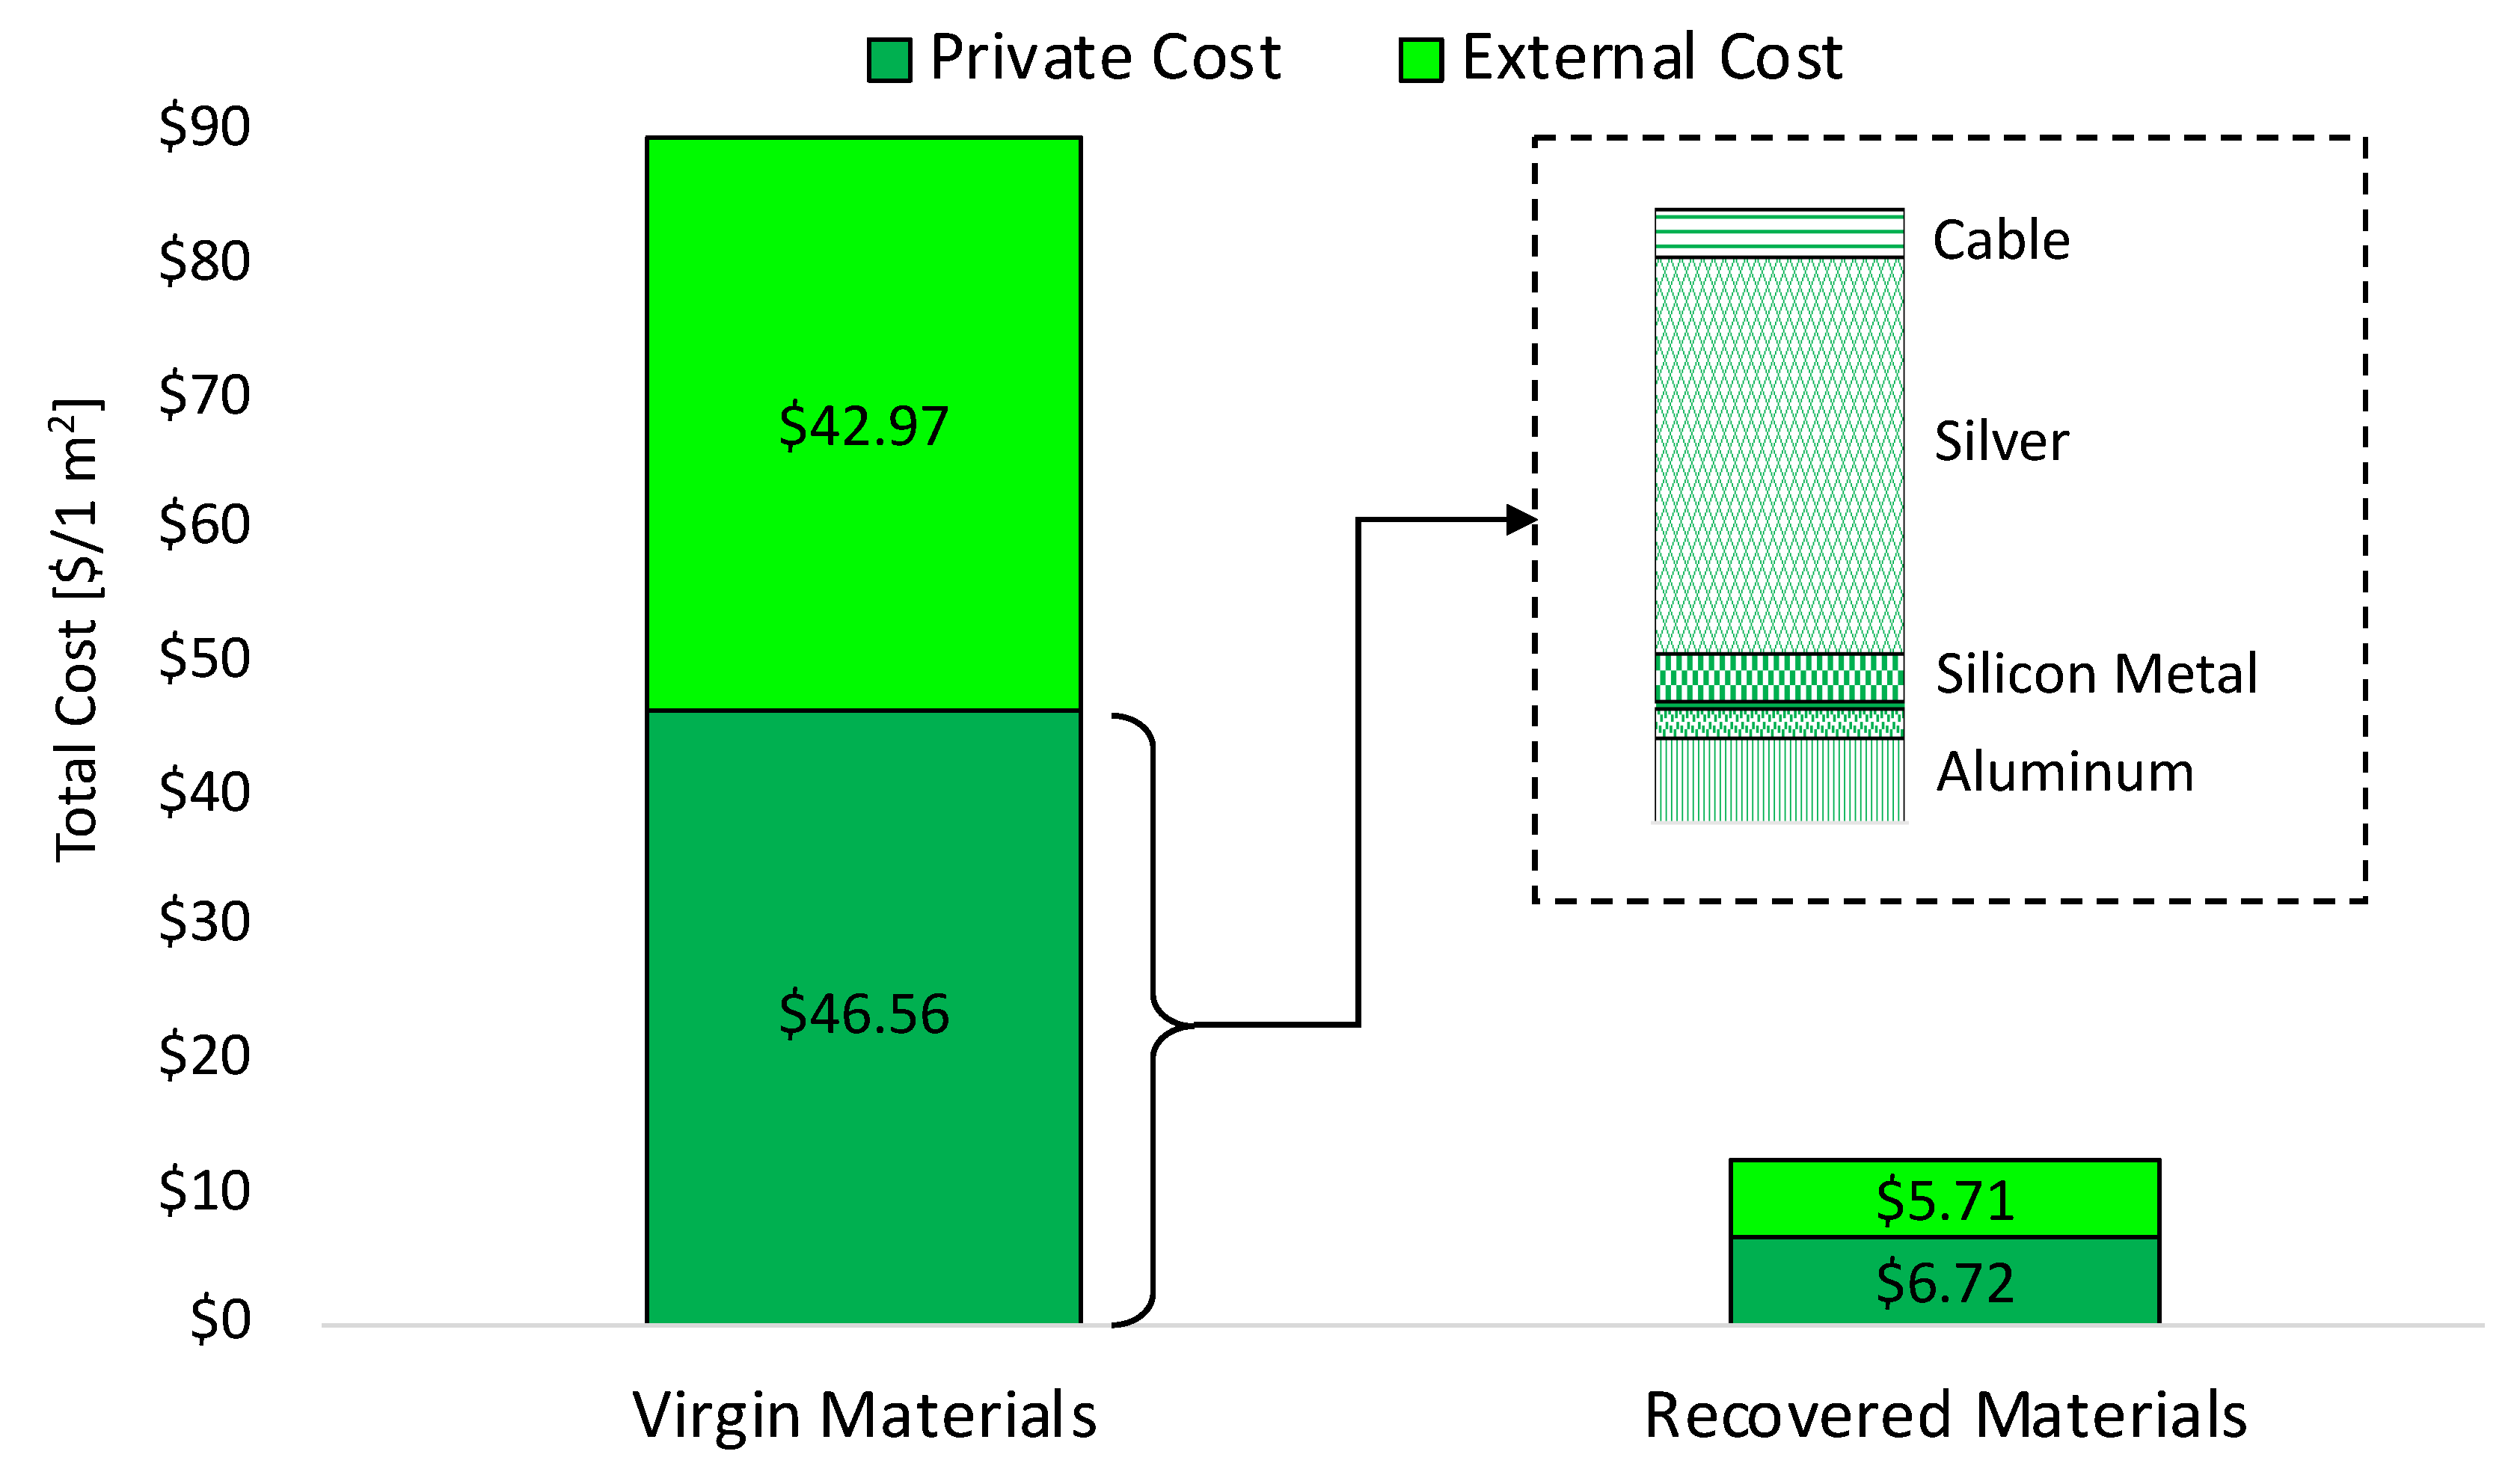
3.4. Comparing the Cost of Virgin Materials to Recovered Materials

One final comparison which is important to note is the difference in the private and external costs for virgin materials vs. recovered materials, shown in Figure 6. In Figure 5, we estimate the value of the recovered materials as USD 13.62 but, in Figure 6, the cost of the virgin materials is about USD 90/m2 [37]. There are two main reasons why the virgin material calculation and recovered material calculation are so different from one another. First, the recycling process is not able to recover all the valuable materials that go into making the PV panels, which makes the recovered material payback cost inevitably lower than the input (virgin) cost. Second, the virgin cost estimate includes the machinery and equipment needed for the extraction of materials, while the recovered material cost does not, as recovery does not bare these costs.
There is a large difference in the two private cost values in Figure 6 because the cost of purchasing all the materials to construct 1 m2 of the virgin PV panel is significantly more than the cost of purchasing the materials to recycle these panels. This is due to the fact that many of the metals needed to construct the crystalline silicon panels, such as silver, can be quite expensive. The external cost of using virgin materials is also higher, considering that these materials must be extracted from their original sources, which uses heavy equipment and transportation, while the external cost of recovering the materials comes exclusively from the discharge of chemicals and energy used to break down spent panels. Overall, it is clear that the use of virgin materials is cost-prohibitive as their recycled counterparts have funds of significantly less value. Recovered materials also include the cost savings of selling back these recovered products, which ultimately makes the recycling process a gain cost (or cost positive) for the recycler.

4. Conclusions

In this study, we calculated the private and externality cost of PV recycling in their EoL. We investigated the FRELP method that is used in recovering materials from c-Si PV waste. Our results indicate that the cost of EoL management of c-Si PV module are USD 6.72/m2 and of the cost components of PV EoL management, the transportation associated cost was found to be the highest (USD 3.36/m2) while the cost of the recycling process (the cost of consumed materials, electricity or the investment for the recycling facilities) was found to be the most insignificant (USD 0.25/m2). We calculated that the external cost of PV EoL management is very similar to the private cost (about USD 5.2 m2). To the best of our knowledge, this is the first study to analyze the external cost of PV recycling. We found that the majority of the external costs of PV EoL management are associated with the processing of PV waste, USD 4.08/m2 which suggests that more environmentally friendly methods (e.g., recycling methods that involve fewer toxic chemicals, acids, etc.) should be preferred in the recycling process of PV waste. Finally, we showed that the net economic benefit of FRELP method is almost USD 7 per m2 module when external costs of recycling are not considered and USD 1.19 per m2 when the external costs of recycling are considered. However, because this net benefit is so small, appropriate policies may need to be enacted to further motivate PV manufacturers to recycle their EoL panels.

Supplementary Materials

The following are available online at https://www.mdpi.com/1996-1073/13/14/3650/s1.

Author Contributions

E.M. is primarily responsible for data generation and writing the first draft of the manuscript. I.C. worked on interpretation of data and revisions to address Reviewers’ comments. D.A. provided supervision and guidance. All authors have read and agreed to the published version of the manuscript.

Funding

This research was funded by the University of Toledo’s Office of Undergraduate Research and SAIF grant provided by Office of Research and Sponsored Programs at the University of Wisconsin–Platteville.

Conflicts of Interest

The authors declare no conflict of interest.

Nomenclature

AbbreviationExplanation
P.CInvPrivate cost of investment
P.CPPrivate cost of process
P.CP,mPrivate cost of materials
P.CP,ePrivate cost of electricity
E.CPExternal cost of process
B.R,mBenefit cost of recovered materials
P.CFPrivate cost of diesel fuel
E.CTExternal cost of transportation
P.CFeePrivate cost of landfill tipping fee
E.CLExternal cost of incineration emissions
B.R,eBenefit cost of recovered energy
CEDCumulative Energy Demand
Ecotox.,FFreshwater ecotoxicity
Eutrop.,MMarine eutrophication
Eutrop.,FFreshwater eutrophication
Acid.Acidification
O3 Form.Photochemical ozone formation
PMParticulate matter
Human tox., NCHuman toxicity, non-cancer effects
Human tox., CHuman toxicity, cancer effects
GWPGlobal warming potential

References

  1. Celik, I.; Mason, B.E.; Phillips, A.B.; Heben, M.J.; Apul, D. Environmental impacts from photovoltaic solar cells made with single walled carbon nanotubes. Environ. Sci. Technol. 2017, 51, 4722–4732. [Google Scholar] [CrossRef] [PubMed]
  2. Ahangharnejhad, R.H.; Phillips, A.B.; Ghimire, K.; Koirala, P.; Song, Z.; Barudi, H.M.; Barudi, A.; Sengupta, M.; Ellingson, R.J.; Yan, Y.; et al. Irradiance and temperature considerations in the design and deployment of high annual energy yield perovskite/CIGS tandems. Sustain. Energy Fuels 2019, 3, 1841–1851. [Google Scholar] [CrossRef] [Green Version]
  3. Celik, I.; Philips, A.B.; Song, Z.; Yan, Y.; Ellingson, R.J.; Heben, M.J.; Apul, D. Energy Payback Time (EPBT) and Energy Return on Energy Invested (EROI) of perovskite tandem photovoltaic solar cells. IEEE J. Photovolt. 2017, 8, 2156–2161. [Google Scholar] [CrossRef]
  4. Briese, E.; Piezer, K.; Celik, I.; Apul, D. Ecological network analysis of solar photovoltaic power generation systems emily. J. Clean. Prod. 2019, 223, 368–378. [Google Scholar] [CrossRef]
  5. Celik, I.; Song, Z.; Cimaroli, A.; Yan, Y.; Heben, M.; Apul, D. Life Cycle Assessment (LCA) of perovskite PV cells projected from lab to fab. Sol. Energy Mater. Sol. Cells 2016, 156, 157–169. [Google Scholar] [CrossRef] [Green Version]
  6. Celik, I.; Phillips, A.B.; Song, Z.; Yan, Y.; Ellingson, R.J.; Heben, M.J.; Apul, D. Environmental analysis of perovskites and other relevant solar cell technologies in a tandem configuration. Energy Environ. Sci. 2017, 10, 1874–1884. [Google Scholar] [CrossRef]
  7. Lunardi, M.M.; Alvarez-Gaitan, J.P.; Bilbao, J.I.; Corkish, R. A review of recycling processes for photovoltaic modules. Sol. Panels Photovolt. Mater. 2018. [Google Scholar] [CrossRef] [Green Version]
  8. Fiandra, V.; Sannino, L.; Andreozzi, C.; Graditi, G. End-of-life of silicon PV panels: A sustainable materials recovery process. Waste Manag. 2019, 84, 91–101. [Google Scholar] [CrossRef]
  9. Jung, B.; Park, J.; Seo, D.; Park, N. Sustainable system for raw-metal recovery from crystalline silicon solar panels: From noble-metal extraction to lead removal. ACS Sustain. Chem. Eng. 2016, 4, 4079–4083. [Google Scholar] [CrossRef]
  10. Wu, S.R.; Celik, I.; Apul, D.; Chen, J. A social impact quantification framework for the resource extraction industry. Int. J. Life Cycle Assess. 2019, 24, 1898–1910. [Google Scholar] [CrossRef]
  11. Celik, I.; Song, Z.; Phillips, A.B.; Heben, M.J.; Apul, D. Life cycle analysis of metals in emerging photovoltaic (PV) technologies: A modeling approach to estimate use phase leaching. J. Clean. Prod. 2018, 186, 632–639. [Google Scholar] [CrossRef]
  12. Deng, Y.; Liu, H.; Zhao, X.; Jiaqiang, E.; Chen, J. Effects of cold start control strategy on cold start performance of the diesel engine based on a comprehensive preheat diesel engine model. Appl. Energy 2018, 201, 279–287. [Google Scholar] [CrossRef]
  13. Beránek, V.; Olšan, T.; Libra, M.; Poulek, V.; Sedláček, J.; Dang, M.Q.; Tyukhov, I.I. New monitoring system for photovoltaic power plants’ management. Energies 2018, 11, 2495. [Google Scholar] [CrossRef] [Green Version]
  14. Willuhn, M. Global PV Market: 114 GW to Be Installed in 2019, with Continued Growth Onwards; PV Magazine: Berlin, Germany, 2019. [Google Scholar]
  15. Celik, I. Eco-Design of Emerging Photovoltaic (PV) Cells; University of Toledo: Toledo, OH, USA, 2018. [Google Scholar]
  16. Giwa, A.S.; Xu, H.; Wu, J.; Li, Y.; Chang, F.; Zhang, X.; Jin, Z.; Huang, B.; Wang, K. Sustainable recycling of residues from the food waste (FW) composting plant via pyrolysis: Thermal characterization and kinetic studies. J. Clean. Prod. 2018, 180, 43–49. [Google Scholar] [CrossRef]
  17. Tao, J.; Yu, S. Review on feasible recycling pathways and technologies of solar photovoltaic modules. Sol. Energy Mater. Sol. Cells 2015, 141, 108–124. [Google Scholar] [CrossRef]
  18. Smith, Y.R.; Bogust, P. Review of solar silicon recycling. Miner. Met. Mater. Ser. Part F 2018, 6, 463–470. [Google Scholar]
  19. Maani, T.; Celik, I.; Heben, M.J.; Randall, J. Environmnetal impacts of recycling crystalline silicon (c-Si) and cadmium telluride (CdTe) solar panels. Sci. Total Environ. 2020, 735, 138827. [Google Scholar] [CrossRef]
  20. Latunussa, C.E.L.; Ardente, F.; Blengini, G.A.; Mancini, L. Life cycle assessment of an innovative recycling process for crystalline silicon photovoltaic panels. Sol. Energy Mater. Sol. Cells 2016, 156, 101–111. [Google Scholar] [CrossRef]
  21. Deng, R.; Chang, N.L.; Ouyang, Z.; Chong, C.M. A techno-economic review of silicon photovoltaic module recycling. Renew. Sustain. Energy Rev. 2019, 109, 532–550. [Google Scholar] [CrossRef]
  22. Choi, J.K.; Fthenakis, V. Design and optimization of photovoltaics recycling infrastructure. Environ. Sci. Technol. 2010, 44, 8678–8683. [Google Scholar] [CrossRef]
  23. Cucchiella, F.; D’Adamo, I.; Rosa, P. End-of-Life of used photovoltaic modules: A financial analysis. Renew. Sustain. Energy Rev. 2015, 47, 552–561. [Google Scholar] [CrossRef]
  24. di Nola, A.; Flondor, P.; Leuştean, I. MV-modules. J. Algebr. 2003, 267, 21–40. [Google Scholar] [CrossRef] [Green Version]
  25. Fthenakis, V.M. End-of-life management and recycling of PV modules. Energy Policy 2000, 28, 1051–1058. [Google Scholar] [CrossRef] [Green Version]
  26. Choi, J.-K.; Heo, J.-B.; Ban, S.-J.; Yi, S.-M.; Zoh, K.-D. Source apportionment of PM2.5 at the coastal area in Korea. Sci. Total Environ. 2013, 447, 370–380. [Google Scholar] [CrossRef]
  27. Worx, R. How Much Do Industrial Robots Cost. Available online: https://www.robots.com/faq/how-much-do-industrial-robots-cost (accessed on 8 October 2019).
  28. Alibaba Manufacturers, Suppliers, Exporters & Importers. Available online: https://www.alibaba.com/?spm=a2700.details.scGlobalHomeHeader.9.df0b7eeeTwMxhR (accessed on 19 July 2019).
  29. Pizzol, M.; Weidema, B.; Brandao, M.; Osset, P. Monetary valuation in life cycle assessment: A review. J. Clean. Prod. 2015, 86, 170–179. [Google Scholar] [CrossRef]
  30. Keijzer, E. The environmental impact of activities after life: Life cycle assessment of funerals. Int. J. Life Cycle Assess. 2017, 22, 715–730. [Google Scholar] [CrossRef]
  31. Martinez-Sanchez, V.; Levis, J.W.; Damgaard, A.; DeCarolis, J.F.; Barlaz, M.A.; Astrup, T.F. Evaluation of externality costs in life-cycle optimization of municipal solid waste management systems. Environ. Sci. Technol. 2017, 51, 3119–3127. [Google Scholar] [CrossRef] [Green Version]
  32. Environmental Prices Handbook 2017 Methods and numbers for valuation of environmental impacts. 2018, pp. 1–177. Available online: https://www.cedelft.eu/en/publications/2113/envionmental-prices-handbook-2017 (accessed on 17 July 2019).
  33. Faircloth, C.C.; Wagner, K.H.; Woodward, K.E.; Rakkwamsuk, P.; Gheewala, S.H. The environmental and economic impacts of photovoltaic waste management in Thailand. Resour. Conserv. Recycl. 2019, 143, 260–272. [Google Scholar] [CrossRef]
  34. Rabl, A.; Spadaro, J.V.; Zoughaib, A. Environmental impacts and costs of solid waste: A comparison of landfill and incineration. Waste Manag. Res. 2008, 26, 147–162. [Google Scholar] [CrossRef]
  35. USGS. Commodity Statistic and Information; USGS: Reston, VA, USA, 2018. [Google Scholar]
  36. D’Adamo, I.; Miliacca, M.; Rosa, P. Economic feasibility for recycling of waste crystalline silicon photovoltaic modules. Int. J. Photoenergy 2017, 2017, 1–7. [Google Scholar] [CrossRef]
  37. Li, Z.; Zhao, Y.; Wang, X.; Sun, Y.; Zhao, Z.; Li, Y.; Zhou, H.; Chen, Q. Cost Analysis of perovskite tandem photovoltaics. Joule 2018, 2, 1559–1572. [Google Scholar] [CrossRef] [Green Version]
Figure 1. Simplified PV recycling process modeled from Latunussa et al., 2016 [20].
Energies 13 03650 g001
Figure 2. Our framework in analyzing the cost of FRELP recycling method.
Energies 13 03650 g002
Figure 3. The end of life (EoL) management (private) cost of EoL of 1 m2 of c-Si PV.
Energies 13 03650 g003
Figure 4. External costs of solar photovoltaic (PV) recycling.
Energies 13 03650 g004
Figure 5. Total cost breakdown of the full recovery end-of-life photovoltaic project (FRELP) method.
Energies 13 03650 g005
Figure 6. Virgin material vs. recovered material total cost. The virgin materials’ private and external cost data were pulled from our group’s earlier study [19], while the recovered materials’ data were pulled from the estimations made in this paper.
Energies 13 03650 g006
Table 1. Damage cost of different impact categories.
Impact Category [20]AbbreviationDamage Cost ($/kg)
Cumulative Energy Demand [MJ]CED0.01 [29]
Freshwater ecotoxicity [CTUe]Ecotox.,F0.05 [30]
Marine eutrophication [kg Neq]Eutrop.,M14.18 [30]
Freshwater eutrophication [kg Peq]Eutrop.,F2.02 [30]
Acidification [molc H+eq]Acid.64.47 [31]
Photochemical ozone formation [NMVOCeq]O3 Form.2.33 [31]
Particulate matter [kg PM2.5 eq]PM341.80 [31]
Human toxicity, non-cancer effects [CTUh]Human tox., NC0.02 [30]
Human toxicity, cancer effects [CTUh]Human tox., C0.02 [30]
Global warming potential [kg CO2-eq]GWP0.04 [31]

