1. Introduction
As natural geological materials, rocks usually have discontinuous, non-homogeneous, multi-phase composite structures. Geometric and topological properties of pore space in rocks play significant roles in mechanical and transport properties [
1]. Therefore, further quantifying the complex pore space (both geometry and topology) of rocks has become a goal of scientists and engineers in numerous engineering fields.
X-ray micro-computed tomography (micro-CT) technology enables quantitative measurements of the internal structure of rock material in a precise and nondestructive manner. Most of the geometric and topological properties of the pore structure can be quantitatively assessed using micro-CT technique. Digital image analysis with micro-CT method has been widely used for analyzing actual 3D pore spaces in sandstones [
2,
3,
4,
5,
6,
7,
8,
9,
10,
11,
12,
13,
14,
15,
16], carbonates [
17,
18,
19,
20,
21,
22,
23], coals [
24,
25] and shales [
26].
A detailed pore geometrical and topological characterization is essential to reveal the main mechanisms that act in sandstones in response to its macro properties, such as hydrologic and elastic properties. As far as we know, the 3D quantification of pore space in rocks, including sandstones, has not been comprehensively reported in previous studies. In this research, we selected eight different types of sandstone to further investigate the 3D pore geometry and topological features of sandstones. We firstly evaluated the representative elementary volume (REV) for fluid flow in sandstone samples. Then, we presented some geometrical and topological properties obtained for sandstone samples.
2. Methods
2.1. Image Preparation
This research aims at studying Bentheimer, Berea, Boise, Clashach, Doddington, Fontainebleau, Gildehauser and Stainton sandstone samples. The CT image data of all sandstones were sourced externally. Some CT datasets (Bentheimer, Boise and Gildehauser) used in this study were acquired online from the open-access Digital Rocks Portal [
11,
14,
27]. The Doddington sandstone CT datasets were obtained online from the British Geological Society’s (BGS) National Geoscience Data Centre [
28]. The Berea and Fontainebleau sandstone CT datasets used in this study were acquired online from a paper by Thomson et al. [
2]. The Clashach and Stainton sandstone data were obtained from Qatar Carbonates and Carbon Storage Research Centre, Imperial College London [
29].
2.2. Image Processing
The raw images acquired using the CT scanner usually cannot be used directly. It is necessary to implement some image processing algorithms to enhance the quality of the raw images. To enhance gray contrast, we stretched the gray-scale histograms of images by using the brightness/contrast filter. The noise filtering of image data was also an important step of image processing to reduce the noise from CT images. Then, the resulting image stack could be segmented to different phases based on the gray-scale contrast. Once the pore space was separated, qualitative and quantitative analysis of the internal pore structure of the sandstone could be done.
2.2.1. Image Filtering
The first process of the fundamental image processing is to improve image contrast using contrast enhancement techniques (see
Figure 1). Various types of noise often contribute to degrading CT images of sandstone samples, affecting the subsequent quantitative analysis. It is essential to improve the signal-noise ratio by applying image filters. There are various image filtering algorithms, including gaussian filtering, median filtering, anisotropic diffusing filtering and non-local means filtering, which can be useful for noise reduction in CT images. Compared with other denoising methods, non-local means denoising algorithm performs well in promoting better smoothing flat areas while keeping the integrity of boundaries. In this study, we used a non-local means filter [
30] with settings for spatial standard deviation at 5, intensity standard deviation at 0.2, search window size at 10 and local neighborhood at 3 (see
Figure 1).
2.2.2. Image Segmenting
Image segmentation is a prerequisite step to provide an accurate sandstone CT image analysis. Binary image segmentation is the process used to classify the pixels of a gray-scale image into two categories, which is necessary to better identify and quantify the pores and solid in sandstone. Many segmentation algorithms have already been proposed for labelling images, such as thresholding, region-based segmentation and deep learning-based approaches. The thresholding method is one of the commonly used methods for segmenting the image. In thresholding, we can convert a gray-level image into a binary image based on a threshold value. The segmentation threshold value is significant for binary classification, so researchers should choose the appropriate segmentation threshold value carefully. Many studies have shown that different threshold values may lead to different values for pore geometry and topology parameters [
31,
32]. There is still no consensus on which type of thresholding method is preferable. For "simple" materials, we can use manual, interactive thresholding method to determine the threshold value, while for high-resolution images, fully-automated segmentation approaches are theoretically enough [
33]. In this paper, the CT images were segmented using the ImageJ version 1.52p (National Institutes of Health, Bethesda, MD, USA) [
34] to distinguish pores and solid in sandstone samples. The selection of the best threshold value used in the image binarization can be determined interactively, with immediate visual feedback. By selecting a proper threshold value, gray level images can be changed to binary form.
2.3. Image Analysis
The three-dimensional visualization of CT image data is usually performed to characterize the sample microstructure qualitatively. In this study, the volume-rendering technique was applied to construct 3D volume data of the sandstone by applying the commercial software VGStudio MAX 2.0 (Volume Graphics GmbH, Heidelberg, Germany) [
35]. We chose the Gildehauser sandstone as an example of the application of volume rendering, as shown in
Figure 2.
2.3.1. Representative Elementary Volume (REV)
To optimize the computational demands and reflect sample macroscopic properties, selecting a statistically representative elementary volume (REV) of the sandstone sample is essential to the follow-up study. The REV is the smallest volume within a structure that should be large enough to represent a reliable microscopic pore heterogeneity [
36,
37]. A suitable and accurate size of the REV has a significant influence on the geometric topology calculation and flow simulation. In most studies [
2,
3] the REV is based on porosity due to its strong correlation to permeability. In this study, we describe a new method for the selection of the size of the REV. The sampling volume on the segmented three-dimensional image starts from the center of the entire image and then gradually increases in all dimensions. Then, respective pore network models (PNM), with the voxel size from 100 × 100 × 100 to 500 × 500 × 500, are extracted from the sampling volume. The interval is 100 voxel (See the next section for more detailed descriptions of PNM). According to the parameters obtained from the PNM, such as porosity, average pore shape factor, average pore radius and volume, are used to identify the size of the REV. When these parameters have relatively stable values, the corresponding REV size can characterize the microscopic pore structure of sandstone sample well.
2.3.2. Pore Network Model(PNM)
As stated above, the geometry and topology properties of the complex pore structure are vital for revealing the fluid transport properties in sandstone pore space. An equivalent pore network model (PNM) of interconnected pores can reproduce the complex pore structure of the porous medium with equivalent simple shapes [
38]. The purpose of pore network extraction is to tessellate the pore system into pores and throats. Spheres and cylinders usually represent the pores and throats, respectively. In this way, geometry and topology properties can be analyzed in the PNM [
39].
Figure 3 shows the workflow to generate the PNM.
There are several algorithms employed to tessellate the pore system into pores and throats. These algorithms extract the PNM mainly using one of the following approaches: (a) the medial axis method [
40], (b) the maximal ball method, and (c) the Voronoi diagram method [
41]. These approaches can produce representative networks that make reasonable estimates of pore geometry and transport properties. Each of these approaches come with their advantages and limitations [
10,
42]. These approaches may not be able to generate a unique representation of the pore system due to inherent approximations and dependency on image resolution. Raeini et al. [
43] combined the maximal ball algorithm with medial axis algorithm to acquire information about pore geometries. They also used flow simulations on real datasets to demonstrate that the improved network extraction procedure could preserve macroscopic properties of rock, including permeability. This pore network extraction algorithm can decrease the uncertainties in conventional network modelling predictions introduced due to the oversimplification of complex pore geometries encountered in porous materials. Compared with the traditional network of the pore, the added complexity of the pore network can better reproduce the experimental results [
42]. In this paper, pores and throats were identified using the improved pore network extraction algorithm of Raeini et al. [
43].
2.3.3. Skeleton
The degree of pore interconnectivity is an essential property for the sandstone. Skeleton analysis is a practical approach to quantify the degree of connectivity of the porous network. The skeleton is a representation composed of connected thin lines that preserve the connectivity or topology and capture both boundary and region information of the object. The basis for skeleton analysis is strongly dependent on nodes and branches extracted from binary 3D image data [
44]. Further skeleton analysis provides valuable information to quantify the number and the dimensions of skeleton nodes and branches using the maximum inscribed sphere method [
45]. The veracity of the skeletonization algorithm constrains the availability of the skeleton extraction. The Pore3D software library (Elettra Synchrotron Light Laboratory, Trieste, Italy) [
46] provides some skeletonization and skeleton pruning algorithms, enabling us to extract reliable skeletons in most practical situations. In the present study, the Pore3D software was used for skeleton analysis. To compute the image skeleton, we used the Gradient Vector Flow (GVF) skeletonization algorithm raised by Brun and Dreossi (2010) [
47].
3. Results and Discussions
3.1. Representative Elementary Volume Analysis (REV)
It is a significant issue to investigate the magnitude of REV that provides statistically meaningful parameter values. The studied volume should remain larger than the magnitude of REV [
48]. For different sizes of cubic REV, this paper analyzes eight pore structure parameters, such as the number of pores per unit volume, porosity, average pore volume, minimum pore volume and maximum pore radius, minimum pore radius, average pore radius and average pore shape factor. The above eight parameters were extracted from the pore network model for quantitative parameter analysis.
Figure 4 plots the correlation curves between the different cube lengths and the pore network parameters of Gildehauser sandstone sample. It can be seen that the values of the parameters gradually converge with the increase of the cube length, which proves that there is a uniform REV for different pore structure parameters. When the curve of each parameter tends to be gentle, or the magnitude of the change is not large, the length of the cube corresponding to the starting point of the initial gentle section is the length of the side of the REV. The REV side length selection rule under multiple parameters is to select the maximum value from the REV side length under every single parameter. The maximum REV side length in
Figure 5 is 400 pixels, so the REV side length of the scanned sample is determined to be 400 pixels.
3.2. The Geometrical Properties of Pore Space
A 3D representation of the extracted pores and throats of all sandstone samples can be seen in
Figure 5. The network statistic provided by the maximal ball algorithm can provide the geometrical statistics necessary for the quantification of sandstone systems. In this study, properties including pore-size distribution, pore shape factor and pore-throat aspect ratio were analyzed based on the extracted PNM. We also analyzed pore anisotropy. The detailed data of the network extraction for eight sandstone samples are shown in
Table 1. As shown in
Table 1, the sandstone samples were divided into two groups: high porosity group H (Bentheimer, Berea, Boise and Gildehauser sandstones), low porosity group L (Clashach, Fontainebleau, Doddington and Stainton sandstones), according to the different porosities in this paper.
3.2.1. Pore Size Distributions
The pore size distribution can indicate complicated pore structures in far more detail than porosity alone. As shown in
Table 1, we can see that Bentheimer sandstone has the largest average pore radii of 31.043 μm, while Stainton sandstone has the least average pore radii of 18.362 μm. The average pore radii of other sandstone samples are between 21 μm and 26 μm. A comparison of the pore size distributions is presented in
Figure 6. As shown in
Figure 6, the high porosity group sandstones (group H) exhibit wider ranges of pore sizes than the low porosity group sandstones (group L). For example, the radius of Bentheimer and Gildehauser sandstone can be within the scope of 10–150 μm and 10–100 μm. The pore radius of other sandstone samples has smaller range of radius, mostly ranging from 10 µm to 80 µm. The pore volume of sandstone becomes greatest almost in the pore radius range of 20–50 μm.
3.2.2. Pore Shape Factor
The pore shape factor (PSF) is a parameter used to describe the geometrical property of the maximal ball-based extracted network. Shape factor can describe the irregularity and complexity of a pore boundary. The pore shape factor G is defined as [
49]:
where A is the pore cross-sectional area, P is the pore perimeter [
49]. The complex and irregular shape of a pore can be represented by an equivalent circular, square and triangle cross-sections based on the PSF during flow simulations. The PSF value of a circle and square are 1/(4π) and 1/16, respectively. However, for a triangle, the value of PSF differs from 0 for a slit-shaped triangle to √3/36 for an equilateral-shape triangle.
Figure 7 presents the pore shape factor distribution of the extracted networks. The pore shape factor distribution in sandstones also follows the unimodal distribution. And distributions of pore shape factor in all the sandstones is nearly symmetric, as shown in
Figure 7.
Table 1 shows that average shape factors of all of the sandstone samples range from 0.0363 to 0.0471, which indicate that sandstone samples have highly triangular-shaped pores.
Table 1 also shows the proportion of triangular pore elements in all the sandstone sample exceeded 50%. This conclusion is expected for the conventional sandstone rocks since it is unlikely to have spherical and cylindrical shaped pore bodies and necks, respectively.
3.2.3. Pore-Throat Aspect Ratio
The pore-throat aspect ratio is an appropriate parameter for characterizing the degree homogeneity of the pore system. In this paper, the global aspect ratios have been validated, using the inscribed radii given in the network data files. The global aspect ratio is the ratio between the average pore size and the average throat size. The average pore-throat aspect ratio AR was calculated as follows:
The AR was the adopted index to analyze the differences concerning the dimension of pores and pore-throats. As shown in
Table 1, the AR ranges from 1.71 to 2.18 among both group H and L samples. There are noticeable changes between group L and group H. Compared to the group H, group L samples show a higher AR, indicating some pores exist in the form of bottlenecks. The large value of this parameter may be an important factor leading to poor connectivity in sandstones. The feature of large-pore spaces and small-throats is one of the main characters, which distinguishes tight sandstone reservoirs from conventional sandstone reservoirs.
3.2.4. The Preferred Orientation of Pores
Anisotropy means that some properties of the porous medium do not have the same value in different directions. The anisotropy of porous media can be determined by using three-dimensional fabric tensors in many ways, including the star volume distribution [
50], the mean intercept length [
51], and the star length distribution [
52]. To provide a global characterisation of pore distribution, the star length distribution method was applied in this study. The star length distribution method places a series of points within the pores, from which lines are projected outward with a uniform orientation distribution. The length of lines is measured between the original point to the material boundary. Line intersections are used as orientations for directional analysis and plot as 3D rose diagrams. The degree of anisotropy (DA) is a measure of preferential orientation of the shape of the global pore system within a volume [
51]. The DA value was calculated by:
where
and
are the shortest and longest axes, respectively, of the ellipsoid, which is fitted and constructed by a series of vectors within the pore system. A DA value of one means that the shape of the pore system is isotropic. A higher value of DA indicates that the shape of the pore system is more anisotropic. In this paper, we calculated DA values using the free software package Quant3D v2.3 (IDL Virtual Machine, Boulder, CO, USA) [
53].
Figure 8 shows the 3D rose plots for pores within sandstone samples. There were little differences in the degree of pore shape anisotropy between the high porosity group sandstones (group H) and the low porosity group sandstones (group L). As shown in
Figure 8, the 3D rose plots in all the sandstone samples have spherical shapes. The least DA was 1.03 (Berea sandstone sample), the highest DA is 1.24 (Boise sandstone sample), indicating a high degree of isotropy exists.
3.3. Topological Properties of Pore Space
Besides the geometrical properties of pores, the topology properties of 3D pore system are vital to the transport of fluids in a porous medium. The topology of the pore network refers to the way how pores are interconnected. The topological properties can be characterized by several parameters, e.g., the coordination number, connectivity density and tortuosity. These parameters can be used to describe pore connectivity in the porous medium.
Table 2 shows these topological parameters.
3.3.1. Coordination Number
The coordination number that can be obtained from pore network extraction has an essential impact on transport properties [
54]. A pore body coordination number can be obtained by counting the number of throats that directly connect that pore to its neighbouring pore bodies. A higher value of the average coordination number means that the pore is well connected, i.e., a typical pore connects directly to a lot of other pores.
We calculated the coordination number and compared the differences between different sandstone samples. The average network statistics for coordination number are displayed in
Table 2 for eight sandstone samples. There are noticeable changes between the low porosity group sandstones (group L) and the high porosity group sandstones (group H). Compared to the low porosity group sandstones (group L), the high porosity group sandstones (group H) samples show a higher coordination number. As shown in
Table 2, we can see that Bentheimer sandstone has the largest average coordination number of 5.10, indicating that the pores and throats are well connected. The Stainton sandstone has the least average coordination number of 1.67 since the sample only presents a total porosity of 6.5% and lots of pores were sealed by diagenesis. The relatively low coordination number is due to a large number of pores with poor connectivity.
Figure 9 presents the coordination number distributions of the eight sandstone samples. The pores well connected are the principal flow pathways, and there are no pores for which the coordination number is equal to zero. The coordination number distribution of pore in sandstones follows the unimodal distribution. As shown in
Figure 9, the high porosity group sandstones (group H) exhibit wider ranges of pore coordination numbers than the low porosity group sandstones (group L). The distribution of calculated coordination number in group H ranges from 1 to 30, though the peak values are different. More pores with low coordination number ranging from 1 to 20 are found in the pore network of group L.
3.3.2. Connectivity Density
As is stated above, the connectivity analysis was conducted through the skeleton extracted using an algorithm, namely gradient vector flow (GVF) [
47,
53,
55]. We calculated the connectivity density characterizing pore connectivity with the following equation,
where
is defined as the difference between the number of branches and number of branches in the extracted skeleton;
V is the selected 3D volume of interest. In this paper, we considered the longest connected image skeleton and ignored the isolated non-connected branches. As shown in
Figure 10, the Gildehauser sandstone was chosen as an example of the skeleton extraction from CT images using Pore3D.
We also calculated the connectivity density and compared the differences between different sandstone samples. The average network statistics for connectivity density are displayed in
Table 2 for eight sandstone samples. The quantified connectivity density parameter based on the extracted skeletons reveals that the porous parts were more connected in the high porosity group sandstones (group H) than in the low porosity group sandstones (group L). As shown in
Table 2, we can see that Boise sandstone has the largest connectivity density of 439.86mm
−3, indicating that the pores and throats are all highly connected. Conversely, the result of the Stainton sandstone sample showed a smaller connectivity density value of 1.61 mm
3. For some VOIs within Stainton, the connectivity is null because of the lack of a connected pore network, as shown in
Figure 5.
3.3.3. Tortuosity
Tortuosity is an important parameter to describe the extent of twisted curves. The geometric tortuosity can be defined using the following relationship [
56]:
where τ is the tortuosity, L is the length of a flow channel (geodesic length) and R is the straight line between two ends of a pore channel.
In the current study, tortuosity was measured by applying Avizo’s Centroid Path Tortuosity module on the binary 3D dataset. This method is based on a computed path formed by centroids of each interconnected region identified as the same phrase on each plane of the dataset along the Z-axis.
The calculated geometric tortuosity results of eight sandstone samples are tabulated in
Table 2. As shown in
Table 2, the geometric tortuosity of sandstones slightly changes with porosity. Compared to group L, group H samples show a lower geometric tortuosity. It shows that sandstone with high porosity tends to have low geometric tortuosity. The Stainton sandstone has the largest geometric tortuosity of 3.89. The Berea sandstone has the least geometric tortuosity of 1.84.
The effective tortuosity of each sandstone sample has also been calculated using an open source application Taufactor in MATLAB (MATLAB VERSION 2018B, Mathswork Inc., Natick, MA, USA). Taufactor can obtain the effective tortuosity factor along different directions of the interconnected three-dimensional pore structures [
57]. Results indicate that the effective tortuosity values in the group H sandstone samples are also larger than those of the group L sandstone samples. The effective tortuosity values in sandstones except Stainton sandstone are slightly bigger than the geometric tortuosity results. However, for the Stainton sample, effective tortuosities are more significant than geometric tortuosities. The effective tortuosity in Stainton sample is around 374, whereas the geometric tortuosity is 3.89. In the Stainton sample, geometric tortuosity is the secondary effect and pore connectivity is the most important factor controlling fluid flow. The average coordination number is the number of links connected to one pore, which can also be applied to explain the variation of tortuosity in different samples. Following the drop in the number of links connected to one pore, the possibility that fluid travels along with a straight path decreases, thus the fluid’s path becomes more tortuous.
3.3.4. Porosity and Pore Topological Characteristics
Through the analysis of topological properties, we found that the porosity has an obvious correlation with topological parameters. It is, therefore, necessary to analyze the relationship between them.
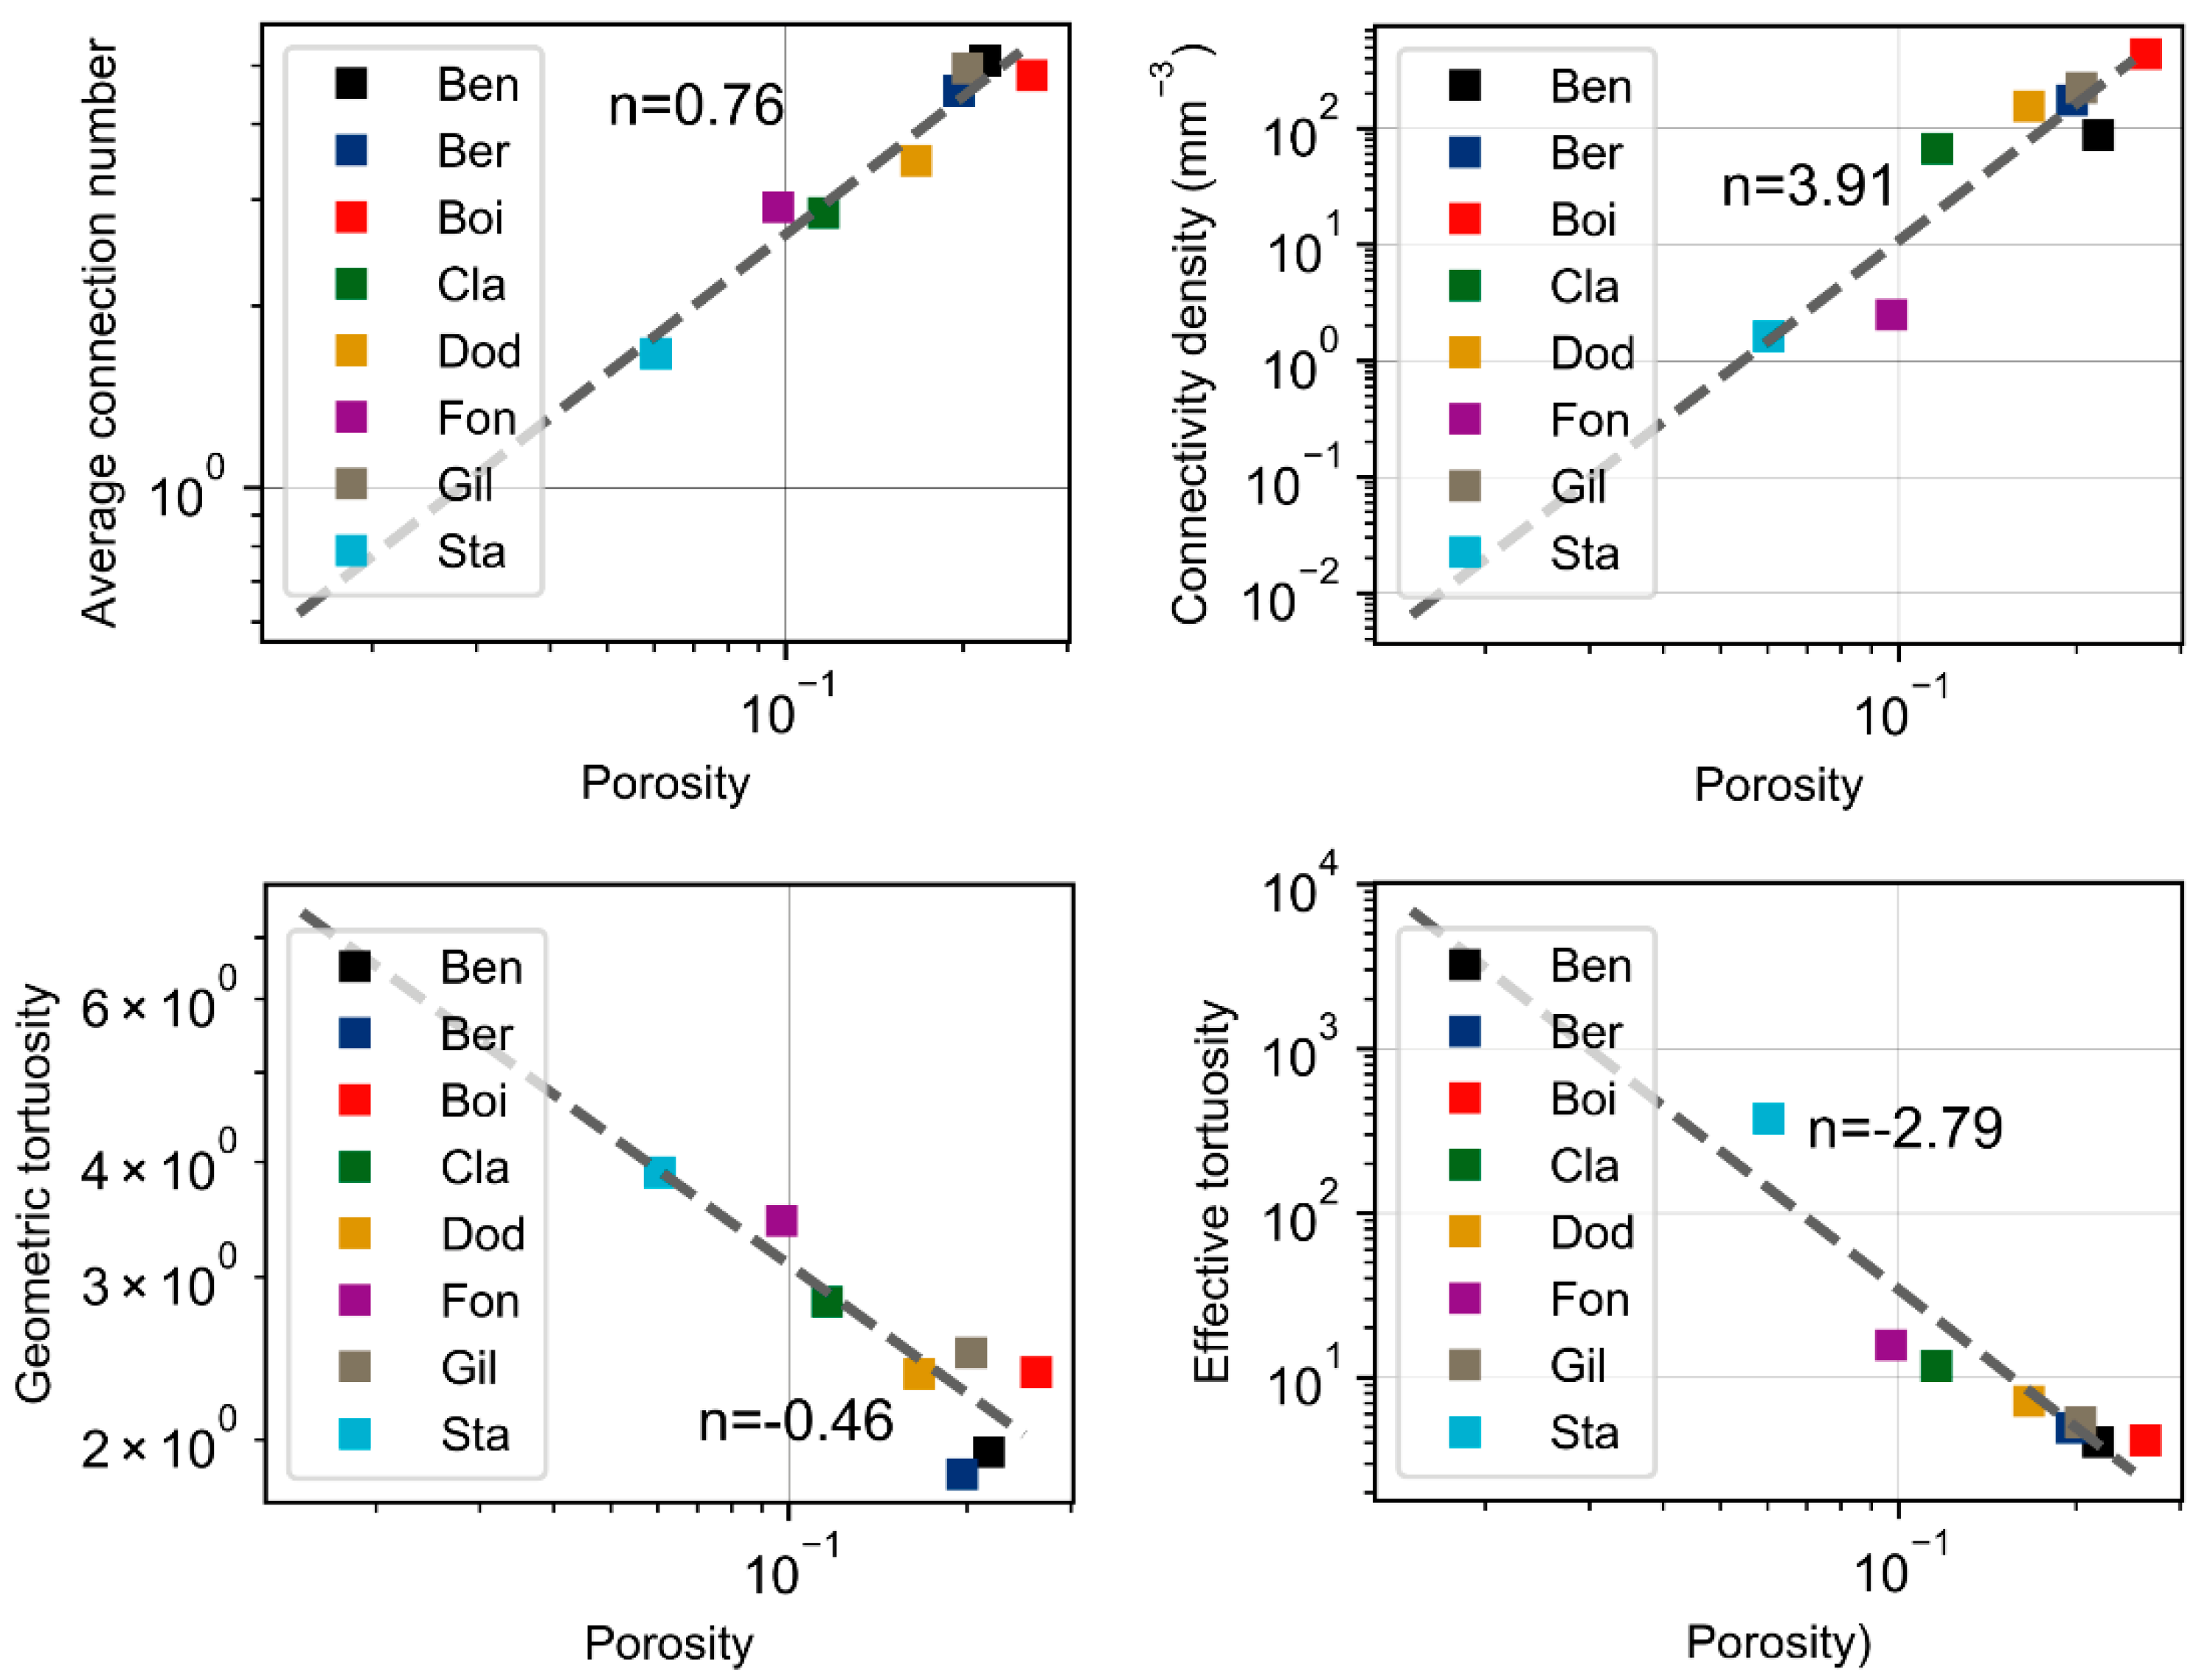
Figure 11 shows the relationship between porosities and pore topological characteristics in all sandstone samples. As shown in
Figure 11, the dashed line indicates a power-law fit of the data. The best-fit power-law index (n) for each fit is marked in the figure. The pore space topological features show a power-law relationship with porosity.
As shown in
Figure 11 above, the porosity has a high correlation with the connectivity density, the coordination number, the geometric tortuosity and effective tortuosity. The positive correlation between the porosity and the connectivity density is significant. We observe that the connectivity density varies with porosity with an exponent of 3.91. The coordination number of the pores also increases with the porosity with an exponent of 0.76. Both the geometric tortuosity and effective tortuosity show a reducing variation with porosity.
4. Conclusions
In this research, we presented geometric properties (i.e., pore size and shape factor) and topological properties (i.e., coordination number, connectivity density and tortuosity) obtained from representative elementary volume (REV) of each sandstone sample. For the sake of comparing and analyzing, the sandstone samples can be divided into two groups: high porosity group H (Bentheimer, Berea, Boise, Doddington and Gildehauser sandstones), low porosity group L (Clashach, Fontainebleau and Stainton sandstones) according to the different porosities. Despite different porosity, all the sandstone samples have highly triangular-shaped pores and a high degree of isotropy. The high porosity group sandstones exhibit wider ranges of pore sizes than the low porosity group sandstones. Compared to the high porosity group sandstones, the low porosity group sandstones samples show a higher global aspect ratio, indicating some pores exist in the form of the bottlenecks. The pore topological properties of different sandstones show a high dependence of the porosity. The high porosity group sandstones obtain large coordination numbers, large connectivity densities and low tortuosities.
Author Contributions
Each author has made a contribution to the present paper. L.N. and Y.X. conceived and designed the work; L.G. and L.N. proposed and participated in the analysis of the CT scan images; L.G. and Y.X. wrote the paper. All authors have read and agreed to the published version of the manuscript.
Funding
This study was financially supported by National Natural Science Foundation of People’s Republic of China (Grant No. 41502272, Grant No. 41572254).
Conflicts of Interest
The authors declare no conflict of interest.
References
- Wiedenmann, D.; Keller, L.; Holzer, L.; Stojadinović, J.; Münch, B.; Suarez, L.; Fumey, B.; Hagendorfer, H.; Brönnimann, R.; Modregger, P. Three-dimensional pore structure and ion conductivity of porous ceramic diaphragms. AIChE J. 2013, 59, 1446–1457. [Google Scholar] [CrossRef]
- Thomson, P.-R.; Aituar-Zhakupova, A.; Hier-Majumder, S. Image Segmentation and analysis of pore network geometry in two natural sandstones. Front. Earth Sci. 2018, 6, 58. [Google Scholar] [CrossRef]
- Wopara, O.F. Pore Network Modelling of Wettability Effects on Waterflood Oil Recovery from Agbada Sandstone Formation in the Niger Delta, Nigeria. Ph.D. Thesis, University of the Witwatersrand, Johannesburg, South Africa, 2016. [Google Scholar]
- Chauhan, S. Phase Segmentation and Analysis of Tomographic Rock Images Using Machine Learning Techniques. Ph.D. Thesis, Technische Universität Darmstadt, Darmstadt, Germany, 2019. [Google Scholar]
- Arawole, S.S. Multiple Approaches To Characterizing Pore Structure For A Range Of Sandstones Samples. Master’s Thesis, The University of Texas at Arlington, Arlington, VA, USA, 2015. [Google Scholar]
- Baychev, T.G.; Jivkov, A.P.; Rabbani, A.; Raeini, A.Q.; Xiong, Q.; Lowe, T.; Withers, P.J. Reliability of algorithms interpreting topological and geometric properties of porous media for pore network modelling. Transp. Porous Media 2019, 128, 271–301. [Google Scholar] [CrossRef]
- Feali, M.; Pinczewski, W.; Cinar, Y.; Arns, C.H.; Arns, J.-Y.; Francois, N.; Turner, M.L.; Senden, T.; Knackstedt, M.A. Qualitative and quantitative analyses of the three-phase distribution of oil, water, and gas in bentheimer sandstone by use of micro-CT imaging. SPE Reserv. Eval. Eng. 2012, 15, 706–711. [Google Scholar] [CrossRef]
- Schmitt, M.; Halisch, M.; Müller, C.; Fernandes, C.P. Classification and quantification of pore shapes in sandstone reservoir rocks with 3-D X-ray micro-computed tomography. Solid Earth 2016, 7, 285–300. [Google Scholar] [CrossRef]
- Lisitsa, V.; Khachkova, T.; Kolyukhin, D.; Gurevich, B.; Lebedev, M.; Reshetova, G.; Tcheverda, V. Scale dependency of pore-space topology and transport properties of sandstone CT scans. In SEG Technical Program Expanded Abstracts 2016; Society of Exploration Geophysicists: Tulsa, OK, USA, 2016; pp. 3148–3153. [Google Scholar]
- Blunt, M.J.; Bijeljic, B.; Dong, H.; Gharbi, O.; Iglauer, S.; Mostaghimi, P.; Paluszny, A.; Pentland, C. Pore-scale imaging and modelling. Adv. Water Resour. 2013, 51, 197–216. [Google Scholar] [CrossRef]
- Ramstad, T.; Idowu, N.; Nardi, C.; Øren, P.-E. Relative permeability calculations from two-phase flow simulations directly on digital images of porous rocks. Transp. Porous Media 2012, 94, 487–504. [Google Scholar] [CrossRef]
- Andrew, M. A quantified study of segmentation techniques on synthetic geological XRM and FIB-SEM images. Comput. Geosci. 2018, 22, 1503–1512. [Google Scholar] [CrossRef]
- Muljadi, B.P.; Blunt, M.J.; Raeini, A.Q.; Bijeljic, B. The impact of porous media heterogeneity on non-Darcy flow behaviour from pore-scale simulation. Adv. Water Resour. 2016, 95, 329–340. [Google Scholar] [CrossRef]
- Alpak, F.; Berg, S.; Zacharoudiou, I. Prediction of fluid topology and relative permeability in imbibition in sandstone rock by direct numerical simulation. Adv. Water Resour. 2018, 122, 49–59. [Google Scholar] [CrossRef]
- Lin, Q.; Bijeljic, B.; Pini, R.; Blunt, M.J.; Krevor, S. Imaging and measurement of pore-scale interfacial curvature to determine capillary pressure simultaneously with relative permeability. Water Resour. Res. 2018, 54, 7046–7060. [Google Scholar] [CrossRef]
- Mehmani*, A.; Prodanović, M.; Milliken, K. A quantitative pore-scale investigation on the paragenesis of Wilcox tight gas sandstone. In Proceedings of the Unconventional Resources Technology Conference, San Antonio, TX, USA, 20–22 July 2015; Society of Exploration Geophysicists, American Association of Petroleum: Tulsa, OK, USA, 2015; pp. 2511–2517. [Google Scholar]
- Bijeljic, B.; Mostaghimi, P.; Blunt, M.J. Insights into non-Fickian solute transport in carbonates. Water Resour. Res. 2013, 49, 2714–2728. [Google Scholar] [CrossRef] [PubMed]
- Jiang, F.; Tsuji, T.; Shirai, T. Pore geometry characterization by persistent homology theory. Water Resour. Res. 2018, 54, 4150–4163. [Google Scholar] [CrossRef]
- Alyafei, N.; Mckay, T.J.; Solling, T.I. Characterization of petrophysical properties using pore-network and lattice-Boltzmann modelling: Choice of method and image sub-volume size. J. Pet. Sci. Eng. 2016, 145, 256–265. [Google Scholar] [CrossRef]
- Scanziani, A.; Singh, K.; Bultreys, T.; Bijeljic, B.; Blunt, M.J. In situ characterization of immiscible three-phase flow at the pore scale for a water-wet carbonate rock. Adv. Water Resour. 2018, 121, 446–455. [Google Scholar] [CrossRef]
- Gao, Y.; Raeini, A.Q.; Blunt, M.J.; Bijeljic, B. Pore occupancy, relative permeability and flow intermittency measurements using X-ray micro-tomography in a complex carbonate. Adv. Water Resour. 2019, 129, 56–69. [Google Scholar] [CrossRef]
- Boone, M.; de Kock, T.; Bultreys, T.; de Schutter, G.; Vontobel, P.; van Hoorebeke, L.; Cnudde, V. 3D mapping of water in oolithic limestone at atmospheric and vacuum saturation using X-ray micro-CT differential imaging. Mater. Charact. 2014, 97, 150–160. [Google Scholar] [CrossRef]
- Bultreys, T.; Stappen, J.V.; Kock, T.D.; Boever, W.D.; Boone, M.A.; Hoorebeke, L.V.; Cnudde, V. Investigating the relative permeability behavior of microporosity-rich carbonates and tight sandstones with multiscale pore network models. J. Geophys. Res. Solid Earth 2016, 121, 7929–7945. [Google Scholar] [CrossRef]
- Li, Z.; Liu, D.; Cai, Y.; Ranjith, P.; Yao, Y. Multi-scale quantitative characterization of 3-D pore-fracture networks in bituminous and anthracite coals using FIB-SEM tomography and X-ray μ-CT. Fuel 2017, 209, 43–53. [Google Scholar] [CrossRef]
- Ni, X.; Miao, J.; Lv, R.; Lin, X. Quantitative 3D spatial characterization and flow simulation of coal macropores based on μCT technology. Fuel 2017, 200, 199–207. [Google Scholar] [CrossRef]
- Zheng, D.; Reza, Z. Pore-network extraction algorithm for shale accounting for geometry-effect. J. Pet. Sci. Eng. 2019, 176, 74–84. [Google Scholar] [CrossRef]
- Garing, C.; de Chalendar, J.A.; Voltolini, M.; Ajo-Franklin, J.B.; Benson, S.M. Pore-scale capillary pressure analysis using multi-scale X-ray micromotography. Adv. Water Resour. 2017, 104, 223–241. [Google Scholar] [CrossRef]
- Shah, S.; Gray, F.; Crawshaw, J.; Boek, E. Micro-computed tomography pore-scale study of flow in porous media: Effect of voxel resolution. Adv. Water Resour. 2016, 95, 276–287. [Google Scholar] [CrossRef]
- Alyafei, N.; Raeini, A.Q.; Paluszny, A.; Blunt, M.J. A sensitivity study of the effect of image resolution on predicted petrophysical properties. Transp. Porous Media 2015, 110, 157–169. [Google Scholar] [CrossRef]
- Buades, A.; Coll, B.; Morel, J.-M. Non-local means denoising. Image Process. Line 2011, 1, 208–212. [Google Scholar] [CrossRef]
- Baveye, P.C.; Laba, M.; Otten, W.; Bouckaert, L.; Sterpaio, P.D.; Goswami, R.R.; Grinev, D.; Houston, A.; Hu, Y.; Liu, J. Observer-dependent variability of the thresholding step in the quantitative analysis of soil images and X-ray microtomography data. Geoderma 2010, 157, 51–63. [Google Scholar] [CrossRef]
- Houston, A.N.; Schmidt, S.; Tarquis, A.; Otten, W.; Baveye, P.C.; Hapca, S.M. Effect of scanning and image reconstruction settings in X-ray computed microtomography on quality and segmentation of 3D soil images. Geoderma 2013, 207, 154–165. [Google Scholar] [CrossRef]
- Porter, M.L.; Wildenschild, D. Image analysis algorithms for estimating porous media multiphase flow variables from computed microtomography data: A validation study. Comput. Geosci. 2010, 14, 15–30. [Google Scholar] [CrossRef]
- Abràmoff, M.D.; Magalhães, P.J.; Ram, S.J. Image processing with ImageJ. Biophotonics Int. 2004, 11, 36–42. [Google Scholar]
- Graphics, V. VG Studio Max 1.2; Volume Graphics GmbHr: Heidelberg, Germany, 2004. [Google Scholar]
- Bear, J.; Braester, C. On the flow of two immscible fluids in fractured porous media. In Developments in Soil Science; Elsevier: Amsterdam, The Netherlands, 1972; Volume 2, pp. 177–202. [Google Scholar]
- Gitman, I.; Askes, H.; Sluys, L. Representative volume: Existence and size determination. Eng. Fract. Mech. 2007, 74, 2518–2534. [Google Scholar] [CrossRef]
- Dong, H.; Fjeldstad, S.; Alberts, L.; Roth, S.; Bakke, S.; Øren, P.-E. Pore Network Modelling on Carbonate: A Comparative Study of Different Micro-CT Network Extraction Methods; International Symposium of the Society of Core Analysts: Abu Dhabi, UAE, 2008. [Google Scholar]
- De Boever, E.; Varloteaux, C.; Nader, F.H.; Foubert, A.; Békri, S.; Youssef, S.; Rosenberg, E. Quantification and prediction of the 3D pore network evolution in carbonate reservoir rocks. Oil Gas Sci. Technol. Rev. d’IFP Energ. Nouv. 2012, 67, 161–178. [Google Scholar] [CrossRef]
- Lindquist, W.B.; Lee, S.M.; Coker, D.A.; Jones, K.W.; Spanne, P. Medial axis analysis of void structure in three-dimensional tomographic images of porous media. J. Geophys. Res. Solid Earth 1996, 101, 8297–8310. [Google Scholar] [CrossRef]
- Thompson, K.E.; Willson, C.S.; White, C.D.; Nyman, S.; Bhattacharya, J.P.; Reed, A.H. Application of A New Grain-Based Reconstruction Algorithm to microtomography Images for Quantitative Characterization and Flow Modeling; Naval Research Lab Stennis Space Center MS Marine Geoacoustics Div: Hancock County, GA, USA, 2008. [Google Scholar]
- Dong, H.; Blunt, M.J. Pore-network extraction from micro-computerized-tomography images. Phys. Rev. E 2009, 80, 036307. [Google Scholar] [CrossRef] [PubMed]
- Raeini, A.Q.; Bijeljic, B.; Blunt, M.J. Generalized network modeling: Network extraction as a coarse-scale discretization of the void space of porous media. Phys. Rev. E 2017, 96, 013312. [Google Scholar] [CrossRef] [PubMed]
- Cornea, N.D.; Silver, D.; Min, P. Curve-skeleton properties, applications, and algorithms. IEEE Trans. Vis. Comput. Graph. 2007, 13, 530–548. [Google Scholar] [CrossRef] [PubMed]
- Hildebrand, T.; Rüegsegger, P. A new method for the model-independent assessment of thickness in three-dimensional images. J. Microsc. 1997, 185, 67–75. [Google Scholar] [CrossRef]
- Brun, F.; Mancini, L.; Kasae, P.; Favretto, S.; Dreossi, D.; Tromba, G. Pore3D: A software library for quantitative analysis of porous media. Nucl. Instrum. Methods Phys. Res. Sect. A Accel. Spectrometers Detect. Assoc. Equip. 2010, 615, 326–332. [Google Scholar] [CrossRef]
- Brun, F.; Dreossi, D. Efficient curve-skeleton computation for the analysis of biomedical 3d images-biomed 2010. Biomed. Sci. Instrum. 2010, 46, 475–480. [Google Scholar]
- Cnudde, V.; Boone, M.N. High-resolution X-ray computed tomography in geosciences: A review of the current technology and applications. Earth Sci. Rev. 2013, 123, 1–17. [Google Scholar] [CrossRef]
- Mason, G.; Morrow, N.R. Capillary behavior of a perfectly wetting liquid in irregular triangular tubes. J. Colloid Interface Sci. 1991, 141, 262–274. [Google Scholar] [CrossRef]
- Cruz-Orive, L.M. Characterizing anisotropy: A new concept. Micron Microsc. Acta 1992, 23, 75–76. [Google Scholar] [CrossRef]
- Harrigan, T.; Mann, R. Characterization of microstructural anisotropy in orthotropic materials using a second rank tensor. J. Mater. Sci. 1984, 19, 761–767. [Google Scholar] [CrossRef]
- Smit, T.H.; Schneider, E.; Odgaard, A. Star length distribution: A volume-based concept for the characterization of structural anisotropy. J. Microsc. 1998, 191, 249–257. [Google Scholar]
- Ketcham, R.A.; Ryan, T.M. Quantification and visualization of anisotropy in trabecular bone. J. Microsc. 2004, 213, 158–171. [Google Scholar] [CrossRef] [PubMed]
- Arns, J.-Y.; Robins, V.; Sheppard, A.P.; Sok, R.M.; Pinczewski, W.V.; Knackstedt, M.A. Effect of network topology on relative permeability. Transp. Porous Media 2004, 55, 21–46. [Google Scholar] [CrossRef]
- Wu, X.; Spencer, S.A.; Shen, S.; Fiveash, J.B.; Duan, J.; Brezovich, I.A. Development of an accelerated GVF semi-automatic contouring algorithm for radiotherapy treatment planning. Comput. Biol. Med. 2009, 39, 650–656. [Google Scholar] [CrossRef]
- Shanti, N.O.; Chan, V.W.; Stock, S.R.; de Carlo, F.; Thornton, K.; Faber, K.T. X-ray micro-computed tomography and tortuosity calculations of percolating pore networks. Acta Mater. 2014, 71, 126–135. [Google Scholar] [CrossRef]
- Cooper, S.; Bertei, A.; Shearing, P.; Kilner, J.; Brandon, N. TauFactor: An open-source application for calculating tortuosity factors from tomographic data. SoftwareX 2016, 5, 203–210. [Google Scholar] [CrossRef]
Figure 1.
(a) Original computed tomography (CT) image; (b) image with brightness/contrast filter; (c) noise-removed image by non-local means filter.
Figure 1.
(a) Original computed tomography (CT) image; (b) image with brightness/contrast filter; (c) noise-removed image by non-local means filter.
Figure 2.
The 3D reconstruction of Gildehauser sandstone sample: (a) Gildehauser sandstone: greyscale, (b) segmented Gildehauser sandstone, (c) solid volume in Gildehauser sandstone, and (d) pore volume in Gildehauser sandstone.
Figure 2.
The 3D reconstruction of Gildehauser sandstone sample: (a) Gildehauser sandstone: greyscale, (b) segmented Gildehauser sandstone, (c) solid volume in Gildehauser sandstone, and (d) pore volume in Gildehauser sandstone.
Figure 3.
Workflow to generate the pore network model (PNM). (a) The original 3D volume; (b) the subvolume; (c) the binary subvolume; (d) the full PNM, including nodes and links; (e) nodes in the PNM; and (f) links in the PNM.
Figure 3.
Workflow to generate the pore network model (PNM). (a) The original 3D volume; (b) the subvolume; (c) the binary subvolume; (d) the full PNM, including nodes and links; (e) nodes in the PNM; and (f) links in the PNM.
Figure 4.
Pore network parameters of Gildehauser sandstone sample at different sizes of sub-volumes.
Figure 4.
Pore network parameters of Gildehauser sandstone sample at different sizes of sub-volumes.
Figure 5.
Pore network models from micro-computed tomography (micro-CT) scans of eight sandstone samples: (a) Bentheimer sandstone, (b) Berea sandstone, (c) Boise sandstone, (d) Gildehauser sandstone, (e) Clashach sandstone, (f) Doddington sandstone, (g) Fontainebleau sandstone, and (h) Stainton sandstone.
Figure 6.
The distribution histogram of equivalent pore radii for the sandstone samples.
Figure 6.
The distribution histogram of equivalent pore radii for the sandstone samples.
Figure 7.
Pores shape factor distribution of eight sandstone samples.
Figure 7.
Pores shape factor distribution of eight sandstone samples.
Figure 8.
3D rose plots for pores within sandstone samples.
Figure 8.
3D rose plots for pores within sandstone samples.
Figure 9.
Pores coordination number distribution.
Figure 9.
Pores coordination number distribution.
Figure 10.
(a,b) Solid rendering (yellow), skeleton (red) and inflated pores (blue) of Gildehauser sandstone sample; (c) inflated pores; (d) skeleton.
Figure 10.
(a,b) Solid rendering (yellow), skeleton (red) and inflated pores (blue) of Gildehauser sandstone sample; (c) inflated pores; (d) skeleton.
Figure 11.
The log–log plots of average coordination number, connectivity density, geometric tortuosity and effective tortuosity as a function of porosity.
Figure 11.
The log–log plots of average coordination number, connectivity density, geometric tortuosity and effective tortuosity as a function of porosity.
Table 1.
The pore geometric properties based on the PNMs.
Table 1.
The pore geometric properties based on the PNMs.
| Quantified Parameter | H Group | L Group |
|---|
| Bentheimer | Berea | Boise | Gildehauser | Clashach | Doddington | Fontainebleau | Stainton |
|---|
| Resolution (μm) | 7 | 5.34 | 4.44 | 4.4 | 4.52 | 4.2 | 5.7 | 4.46 |
| Size (voxels) | 4003 | 4003 | 4003 | 4003 | 4003 | 4003 | 4003 | 4003 |
| Porosity (%) | 21.78 | 19.65 | 26.19 | 20.35 | 11.61 | 16.62 | 9.72 | 6.03 |
| Network porosity (%) | 21.69 | 19.49 | 26.08 | 20.18 | 11.47 | 16.44 | 9.68 | 5.88 |
| Average pore radius (μm) | 31.04 | 22.11 | 24.29 | 22.41 | 21.46 | 25.39 | 23.88 | 18.36 |
| Average pore shape factor | 0.043 | 0.042 | 0.038 | 0.036 | 0.042 | 0.038 | 0.040 | 0.047 |
| Proportion of triangular elements | 55.3% | 56.7% | 67.4% | 73.1% | 64.7% | 71.3% | 67.4% | 53.4% |
| Average pore-throat aspect ratio | 1.812 | 1.893 | 1.889 | 1.710 | 1.991 | 1.906 | 2.106 | 2.117 |
Table 2.
Quantified topological parameter.
Table 2.
Quantified topological parameter.
| Quantified Parameter | Bentheimer | Berea | Boise | Gildehauser | Clashach | Doddington | Fontainebleau | Stainton |
|---|
| Average coordination number | 5.10 | 4.54 | 4.82 | 4.95 | 2.85 | 3.48 | 2.92 | 1.67 |
| Connectivity density (mm−3) | 87.83 | 174.97 | 439.86 | 224.08 | 66.84 | 154.41 | 2.49 | 1.61 |
| Geometric tortuosity | 1.94 | 1.84 | 2.37 | 2.48 | 2.82 | 2.36 | 3.45 | 3.89 |
| Effective tortuosity | 4.06 | 4.96 | 4.16 | 5.33 | 11.80 | 7.18 | 15.70 | 374.00 |
© 2020 by the authors. Licensee MDPI, Basel, Switzerland. This article is an open access article distributed under the terms and conditions of the Creative Commons Attribution (CC BY) license (http://creativecommons.org/licenses/by/4.0/).


