Article

Characterization of Pore Structures and Implications for Flow Transport Property of Tight Reservoirs: A Case Study of the Lucaogou Formation, Jimsar Sag, Junggar Basin, Northwestern China

1
School of Geosciences, China University of Petroleum, Qingdao 266580, China
2
Laboratory for Marine Mineral Resources, Qingdao National Laboratory for Marine Science and Technology, Qingdao 266071, China
3
Geophysical Research Institute, Shengli Oilfield Company of SINOPEC, Dongying 257022, China
*
Author to whom correspondence should be addressed.
Energies 2021, 14(5), 1251; https://doi.org/10.3390/en14051251
Submission received: 29 December 2020 / Revised: 19 February 2021 / Accepted: 22 February 2021 / Published: 25 February 2021
(This article belongs to the Special Issue Pore-Scale Multiphase Fluid Flow and Transport in Porous Media)

Abstract

:
Quantitate characterization of pore structures is fundamental to elucidate fluid flow in the porous media. Pore structures of the Lucaogou Formation in the Jimsar Sag were investigated using petrography, mercury intrusion capillary porosimetry (MICP) and X-ray computed tomography (X-ray μ-CT). MICP analyses demonstrate that the pore topological structure is characterized by segmented fractal dimensions. Fractal dimension of small pores (r < Rapex) ranges from 2.05 to 2.37, whereas fractal dimension of large pores (r > Rapex) varies from 2.91 to 5.44, indicating that fractal theory is inappropriate for the topological characterization of large pores using MICP. Pore volume of tight reservoirs ranges over nine orders of magnitude (10−1–108 μm3), which follows a power-law distribution. Fractal dimensions of pores larger than a lower bound vary from 1.66 to 2.32. Their consistence with MICP results suggests that it is an appropriate indicator for the complex and heterogeneous pore network. Larger connected pores are primary conductive pathways regardless of lithologies. The storage capacity depends largely on pore complexity and heterogeneity, which is negatively correlated with fractal dimension of pore network. The less heterogeneous the pore network is, the higher storage capability it would have; however, the effect of pore network heterogeneity on the transport capability is much more complicated.

1. Introduction

Unconventional oil and gas, especially shale gas and tight oil, have gained great attention of the whole world for their huge geological reserves and recoverable potential [1,2]. Shales and tight sandstones have been investigated in a wide range of research fields [3,4,5], and they are featured by poor reservoir quality and high reservoir heterogeneity. These reservoirs are commonly composed of pores and throats ranging from nanometer scale to micrometer scale, which are characterized by poor connectivity. Pore microstructure is considered to have significant effect on flow capacity, storage capability and recovery efficiency of the unconventional reservoirs [6,7,8]. A profound understanding of pore structure of tight reservoirs can lead to more accurate predictions of potential area and higher recovery of these unconventional resources [9,10,11].
Compared with conventional reservoirs, various difficulties emerge when efforts are devoted to characterizing a full-scale pore structure of tight reservoirs. Generally, parameters including pore size, geometry and connectivity are quantified to characterize pore network structures of tight reservoirs, which can be obtained by using direct and indirect techniques, such as thin section, MICP, SEM, NMR and X-ray computed tomography (X-ray μ-CT). Gao et al. (2019) used SEM, rate-controlled mercury and high-pressure mercury to characterize the pore and throat system of tight sandstone reservoirs, and predicted the permeability of tight reservoirs [12]. Xiao et al. (2017) combined SEM, rate-controlled mercury and NMR to investigate the pore throat structures and their evolutions [13]. Hemes et al. (2015) established a conceptual 3D model of the pore network by multi-scale characterization using X-ray μ-CT and SEM tomography [14]. As a rule of thumb, X-ray μ-CT gives more information in the three-dimensional and the length scale ranges from nanometer to centimeter, when compared with other analytical techniques (e.g., SEM, MICP). X-ray μ-CT presents finer and detailed visualization of pore network, which gives insight into the nature of pore network [15]. X-ray μ-CT, as a non-destructive technique, has been applied in the visualization and quantification of the internal structure of objects in the geosciences since the 1980s [16,17,18]. The improvement in the resolution of computed tomography promotes the further application in the quantification of mineral spatial distribution, petrophysical property and pore microstructure [19,20]. Both merits and demerits of X-ray μ-CT have been uncovered in the published literatures [18,21,22,23]. Artifacts emerge during the scanning process, causing difficulties in the procedure of image post-processing. Even though a portion of artifacts can be reduced or eliminated in the data acquisition, still, some artifacts (e.g., beam hardening) cannot be completely removed and have a non-neglected effect on the phase segmentation [21]. However, with the aid of image processing software (e.g., Avizo, ImageJ), pore network can be described with relative high accuracy, when combined with other imaging techniques (e.g., SEM) [14,24]. Negative correlation has been observed between the target size and the scanning resolution, high resolution can provide more detailed information of the internal structure at the cost of representativeness. Besides this, pore network can be established by centerline tree algorithm and pore network model (PNM) algorithm, which are often used in the digital core analysis [25,26]. Subsequently, pore network can be used to conduct single phase and multiple phases flow simulations to present the displacement process, which can visualize the preferential pathways of fluid flow, velocity and pressure distribution [27].
Theoretically, pore size distribution of tight reservoirs and its effect on the physical properties of reservoirs can be quantitatively characterized by the application of fractal theory. Pore structure characterized by the techniques summarized above can be analyzed the fractal characters and various calculation methods of fractal dimension for different techniques have been proposed to describe the heterogeneity of pore network system [28,29,30,31,32]. Lai et al. (2018) gave a brief review of various methods to investigate the feature of pore structure and its fractal geometry, where the limitations of methods were discussed and a full range of pore size distribution was characterized by combining several complimentary methods [28]. Zhao et al. (2017) investigated the pore structure and multifractal characteristics of tight reservoirs by NMR measurements and applied the fractal dimension calculation into the NMR logs [29]. Although X-ray μ-CT achieves the three-dimensional visualization of pore network, relatively less efforts have been devoted to fractal analysis of 3D pore system [31,32]. Therefore, in this context, pore microstructures of tight reservoirs were investigated by a combination of complimentary techniques, aiming to elucidate (1) features of the interconnected pore network obtained by MICP and its fractal character; (2) features of the pore network segmented by X-ray μ-CT images and its fractal character; (3) a full-range of pore size distribution and the effect of pore structure on the storage and transport capability.

2. Geological Setting

The Jimsar Sag is located in the southeastern part of the Junggar Basin, Northwest China. The sag has a half-graben structure faulting in the west and overlapping in the east, which is surrounded by several boundary faults (Figure 1a–c). From the early Permian, sediments started to deposit onto the Carboniferous basement. The thickness of sedimentary strata reaches the maximum at the central-western part of the sag and generally decreases eastward toward the uplift. The Permian Lucaogou Formation is widespread in the sag and it is a significant exploration target of tight oil [33]. The thickness of this formation commonly ranges from 200 m to 350 m, which contains four subparts (P2l21, P2l22, P2l11 and P2l12 in Figure 1d).
The Jimsar Sag was an underfilled saline lake when the Permian Lucaogou Formation was deposited. The depositional environment and water depth were characterized by highly frequent changes, resulting in the variation of terrigenous clastic components and carbonate components. Moreover, the intermittent volcanic activity of surrounding area provided pyroclastic materials as the important components for the mixed sedimentary rocks [34,35]. The frequent fluctuation of the relative lacustrine level and farraginous sediments lead to the vertical variation of lithology, textures and structures, thin layers and strong heterogeneity [36]. As a result, pore structures of the mixed sedimentary rocks display remarkable differences, including pore types, pore size distribution and connectivity [30]. The exploration practice demonstrates that “sweet spots” with relatively high porosity and permeability are preferential locations for the accumulation of oil [30,31]. However, oil saturation of tight reservoirs in the “sweet spot” presents a great diversity, which has been attributed to multiple factors, such as hydrocarbon potential of source rock, reservoir quality and assemblage type of source rock and reservoir [37].

3. Sample and Methods

3.1. Samples

Samples of the Lucaogou Formation from four wells in the Jimsar Sag were selected for the characterization of pore network. The sub-samples were prepared for casting thin sections (blue epoxy resin impregnated thin sections), physical property measurement (porosity and permeability), mercury intrusion capillary porosimetry (MICP) and X-ray computed tomography (X-ray μ-CT).

3.2. Methods

3.2.1. Porosity and Permeability

On the basis of Boyle’s law, porosity of the cylindrical subsample (approximately 2.54 cm in diameter and 4 cm in length) was tested using helium gas as pore fluid, which was described in detail in Tian et al. (2012) [38]. The permeability was estimated using an instrument designed especially for measuring the permeability of tightstone and shale, the measurement procedures of which were in accordance with the standard GB/T 34533-2017. Nitrogen gas was used as pore fluid and several differential pore pressures under room temperature were set to revise gas permeability using Klinkenberg equation, resulting in the gas permeability close to the water permeability [39].

3.2.2. Mercury Intrusion Capillary Porosimetry

Mercury intrusion capillary porosimetry was performed on the aforementioned samples in order to evaluate the pore-throat geometry and pore-throat size distribution. According to the standard SY/T 5346–2005, an AutoPore IV 9505 mercury porosimeter was used to obtain the characteristic parameters (e.g., average pore-throat radius, maximum mercury intrusion saturation, displacement pressure), and the operation and analysis procedures were modified from Pittman (1992) [40].

3.2.3. X-ray μ-CT

The Zeiss Xradia 510 Versa was used for obtaining original two-dimensional image projections and then three-dimensional image data was subsequently reconstructed using XMReconstructor. Prior to core scanning, cylindrical core samples with a diameter of 2 mm were drilled and glued onto the carbon fibers. The carbon fiber was mounted onto the lifting platform located between the X-ray source and the contrast-optimized detectors. The X-ray accelerating voltage was chosen as 60 kV and the corresponding power was set as 5 W. The same size of the detector was used as 2000 × 2000 pixels and 3201 projections were conducted during the scanning process. Due to the component differences between the selected samples, the exposure time ranged from 4.5 s to 6.5 s. The pixel size of the obtained images was quite similar and the value was approximate 0.75 μm.

4. Results

4.1. Bulk Property

The mineral components of the Lucaogou reservoirs are characterized by high content of feldspar, quartz and dolomite as well as low content of calcite, clay and pyrite. The relative contents of minerals change frequently, which result in the heterogeneity of lithology and the complexity of lithological assemblage. Mixed sedimentary rock is prevalent in the Lucaogou Formation, which was formed in a transitional process of clastic detrital deposition and chemical deposition. The reservoir lithology varies vertically and is mainly composed of silty dolomite, dolomitic siltstone and tufaceous siltstone (Figure 2). In these reservoirs, terrigenous detrital particles (e.g., feldspar, quartz) present a certain degree of roundness and their size predominantly distributes in the grain-size scale of silt. The majority of terrigenous detrital particles are isolated and spread in the dolomitic, tafaceous or muddy matrix. However, pyroclastic particles (e.g., albite, quartz) show a poor roundness with an angular or subangular shape, which have a clean surface under the optical microscope. The size of these particles is relatively smaller than terrigenous detrital particles. Moreover, dolomite is one of the major components, the shape and size of which show significant difference due to their origin. Dolomite particles of the dolomitic matrix are so small that they are hardly recognizable other than recrystallized dolomite particles. Dolomites deposited as detritus are identified to be subhedral to euhedral, which have a similar size as terrigenous detrital particles. Calcite is generally recognized as the products of cementation or replacement. The relative content of clay and pyrite is quite low; however, they are identifiable in almost every sample.
The helium porosity of the selected samples varies from 2.0% to 16.2%, averaging 8.0%, and the permeability is less than 1 × 10⁻³ μm2, demonstrating a poor physical property of the Lucaogou tight reservoirs (Figure 3). A positive correlation exists between helium porosity and permeability (R2 = 0.8163), suggesting the physical properties of tight reservoirs are virtually unaffected by microfractures.

4.2. MICP Analysis

4.2.1. Features of Pore Network by MICP

Connected pore structure can be characterized by MICP analysis, pore throat size and fractal feature can be quantified via theoretical calculation [41,42]. Entry pressure is defined as the minimum capillary pressure for forming continuous non-wetting phase, which varies from 0.0115 MPa to 1.1466 MPa with an average value of 0.374 MPa (Table 1). Correspondingly, maximum pore throat radius is the pore throat size calculated at the entry pressure, which spreads over a wide range from 0.4074 μm to 63.9924 μm, averaging 9.2409 μm. Pore size distribution of the Lucaogou reservoir is predominantly unimodal, but peak width and the pore throat size corresponding to the peak present remarkable differences (Figure 4). Pore throat size is controlled by the slope of mercury capillary pressure curve; steeper capillary pressure curve indicates a wide range of pore-throat size distribution and a poor sorting degree of pore-throat size (e.g., sample 2-3). On the contrary, a plateau of capillary pressure curve demonstrates a concentrated distribution and relatively good sorting degree of pore-throat size (e.g., sample 2-7). In addition, the apex (i.e., inflection point in Figure 5) can be recognized in the cross-plot of mercury saturation over capillary pressure against mercury saturation [41], and the mercury saturation (SHgapex) corresponding to the apex varies from 4.57% to 50.63%. SHgapex represents the volume proportion of the broad and well-connected pores, which provides information of storage capability of these pores. The maximum mercury saturation (SHgmax) changes from 38.14% to 98.16%, while mercury removal efficiency ranges from 1.63% to 33.19% (Table 1). This result manifests that pore network is characterized by tiny throats and large pore throat radius ratio, which is detrimental to fluid flowing in the complex pore network.

4.2.2. Fractal Dimension by MICP

A fractal object characterized by self-affinity can be described mathematically by a power law function, and previous studies have proven that pores of the natural rocks are fractal following a function as shown below [43,44].
N ( r ) r D f
where N(r) is the number of pores larger than the size of r, dimensionless; r is the size of pore, μm; Df is the fractal dimension, dimensionless.
As described in the capillary tube model, N(r) is expressed as below:
N ( r ) = V H g π r 2 l
where VHg is the cumulative mercury volume at a specific capillary pressure, µm3; l is the capillary tube length, μm [45].
According to the Washburn equation [46], the relationship between capillary pressure and pore size can be expressed as follows:
P c = 2 σ c o s θ r
where Pc is capillary pressure, MPa; σ is surface tension, N/m; θ is contact angle, °.
The mercury saturation is conventionally used in percentage terms and is calculated as follows:
S H g = V H g V p
where SHg is the cumulative mercury saturation, %; Vp is the total pore volume of the measured sample, µm3.
Then, by combining the equations above, SHg can be expressed as:
S H g P c ( 2 D f )
The fractal dimension can be simply obtained in a double-logarithm coordination as follows:
log S H g = ( D f 2 ) l o g P c + α
where α is a constant, dimensionless; Df can be calculated by the slope of fitting curve.
The log-log plots of mercury saturation versus capillary pressure illustrate that fractal dimension can be described in two segments, which are separated by the Swanson’s parameter (Figure 5). Remarkable differences present between fractal dimension of large pores and fractal dimension of small pores (Figure 5 and Table 2). Fractal dimension of small pores (Df2) varies in a relatively small range of 2.05–2.37, which suggests that the size distribution of small pores is less heterogeneous. However, fractal dimension of large pores (Df1) is commonly greater than 3, which indicates that fractal theory may be inappropriate for characterizing the size distribution of large pores. The theoretical fractal dimension of a three-dimensional object is less than 3. Pore size calculated by MICP data is based on the assumption of cylindrical pore model, while pores of the Lucaogou reservoirs are in fact more complex. Besides this, the microfractures may also lead to a fractal dimension greater than 3, as suggested by the previous studies [41,45,47].

4.3. X-ray μ-CT Analysis

Pores are segmented using watershed algorithm after image denoising by the non-local means algorithm in the Avizo software [23,48]. Then, pores are quantitatively analyzed using a number of geometric parameters, including surface area, volume, equivalent radius, perimeter, shape factor, pore throat radius ratio and tortuosity. The spatial distribution of pores in the Lucaogou reservoirs is analyzed by the pore network model in the Avizo software, which is a simplified topology model of pore structure established by the central axis algorithm [27]. As shown in Figure 6, pore structures of the Lucaogou reservoirs present significant differences in the pore geometrical and topological feature. The 2D grayscale images provide valuable information of mineral compositions based on mineral density and corresponding gray-scale value range [32,49]. Dark areas are interpreted as pore spaces, dark gray regions represent silicate minerals, primarily including quartz, feldspar and clay minerals. Bright gray areas correspond to carbonate minerals or carbonate-containing minerals, spots with highest brightness are pyrite (Figure 6). The 3D segmented pores are labeled by different colors to present the pore connectivity, where interconnected pore clusters are labeled by one color and adjacent different colored clusters are disconnected with each other. Moreover, the characteristics of pore skeleton can present a simple and clear spatial distribution of pores, where sample 2-7 has better connectivity than the rest of the selected samples.

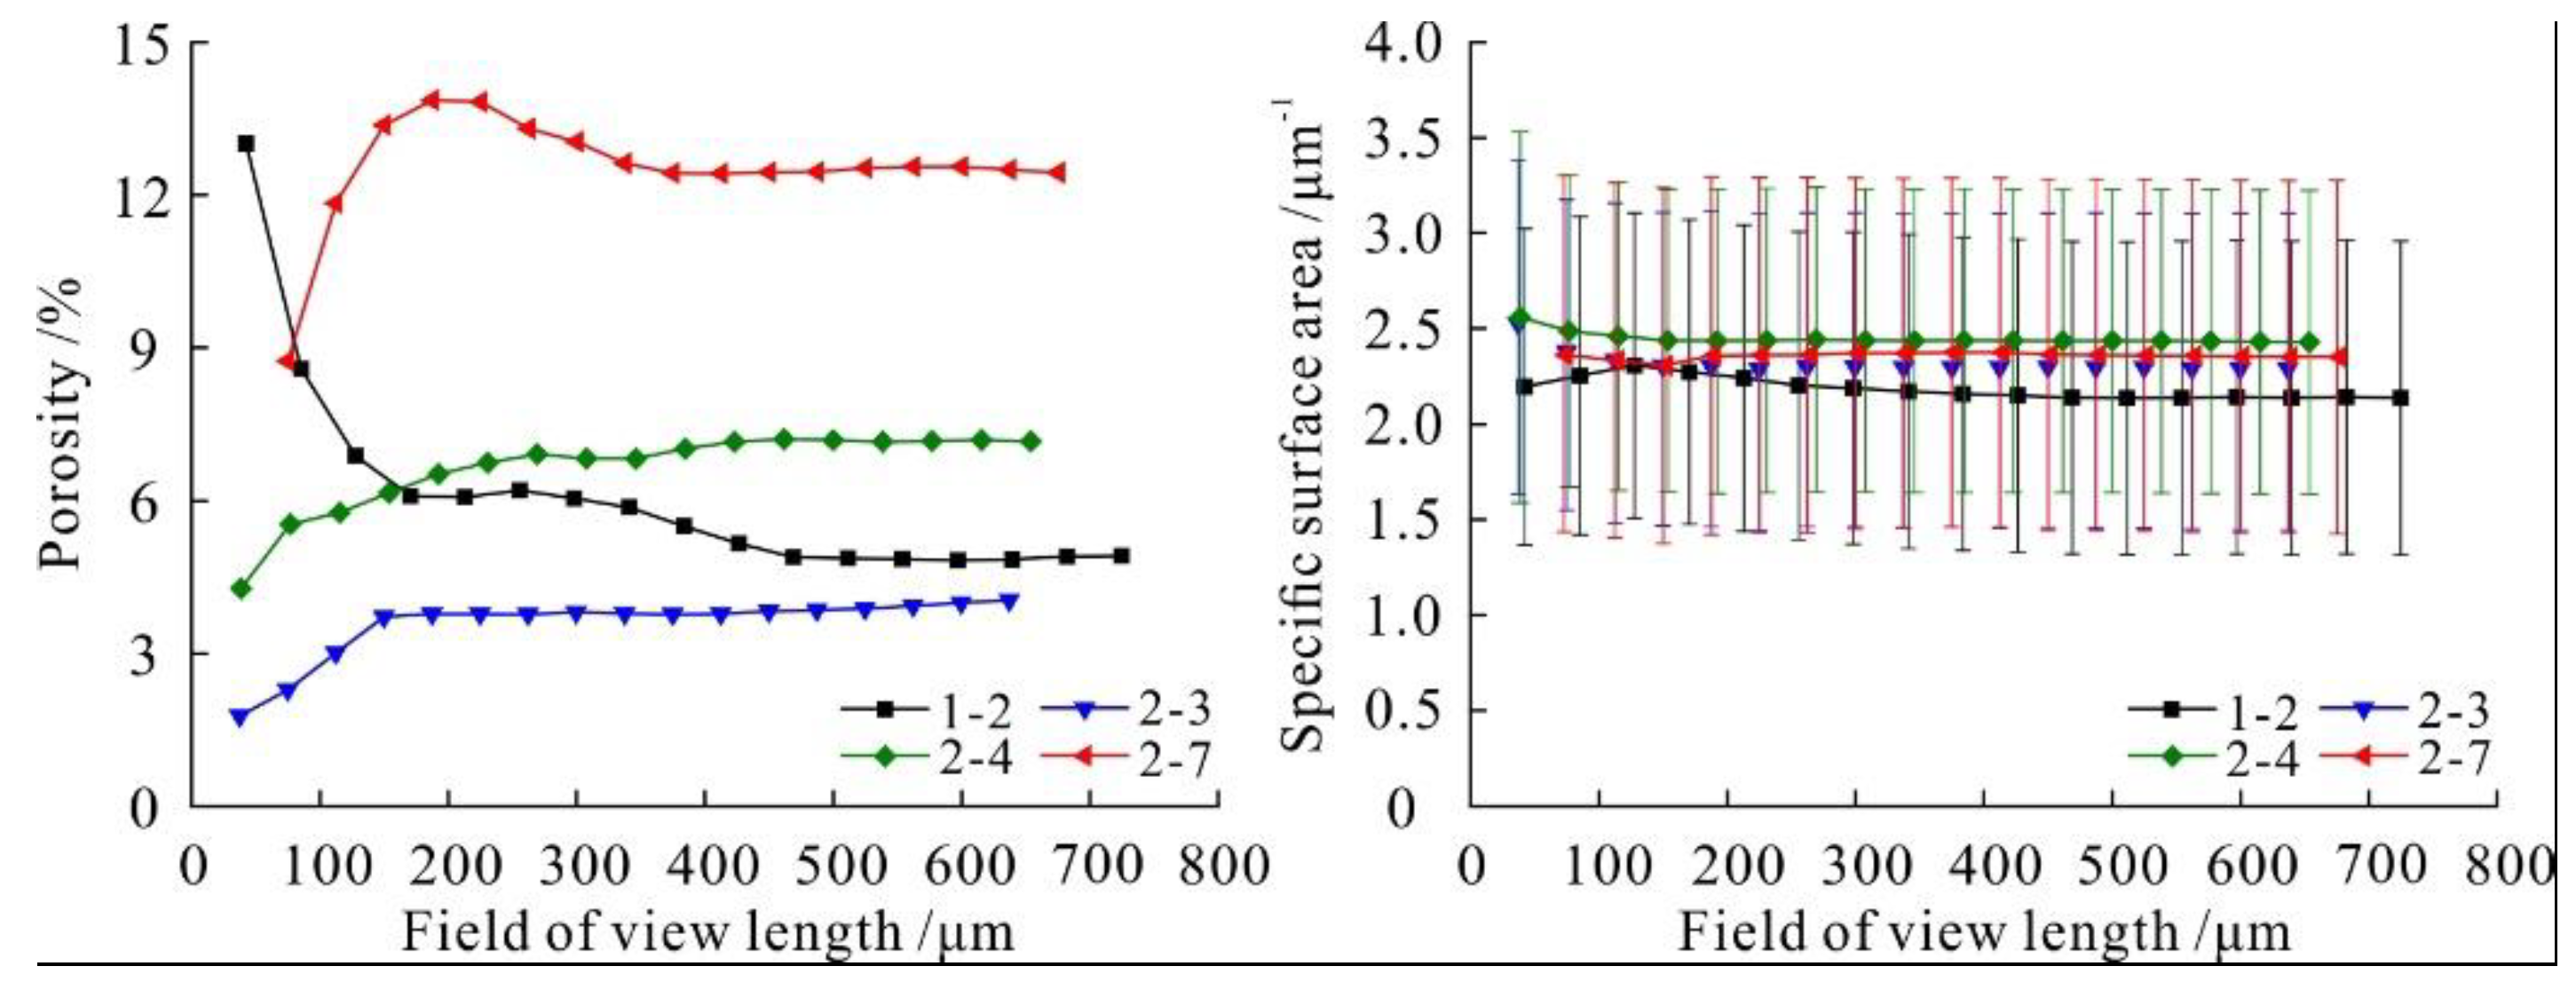
4.3.1. Representative Elementary Volume (REV)

In order to give a comprehensive description of pore network, REV needs to be determined due to the strong heterogeneity of the Lucaogou reservoirs [32,50]. Porosity and specific surface area are common parameters used in the determination of REV, and REV is the minimum volume when parameter reaches a relatively stable value [7,51]. As the volume of cropped cube increases, porosity of these cubes and specific surface area of segmented pores are calculated. As indicated by Figure 7, REV values identified by porosity are slightly greater than REV identified by specific surface area. REV of the Lucaogou reservoirs is determined to be the volume of a cube with a side of 600 pixels, and the corresponding volume depends on its resolution. In general, REV is smaller than the scanned volume of samples, which suggests the determination of REV is valid for representing the sample [52].

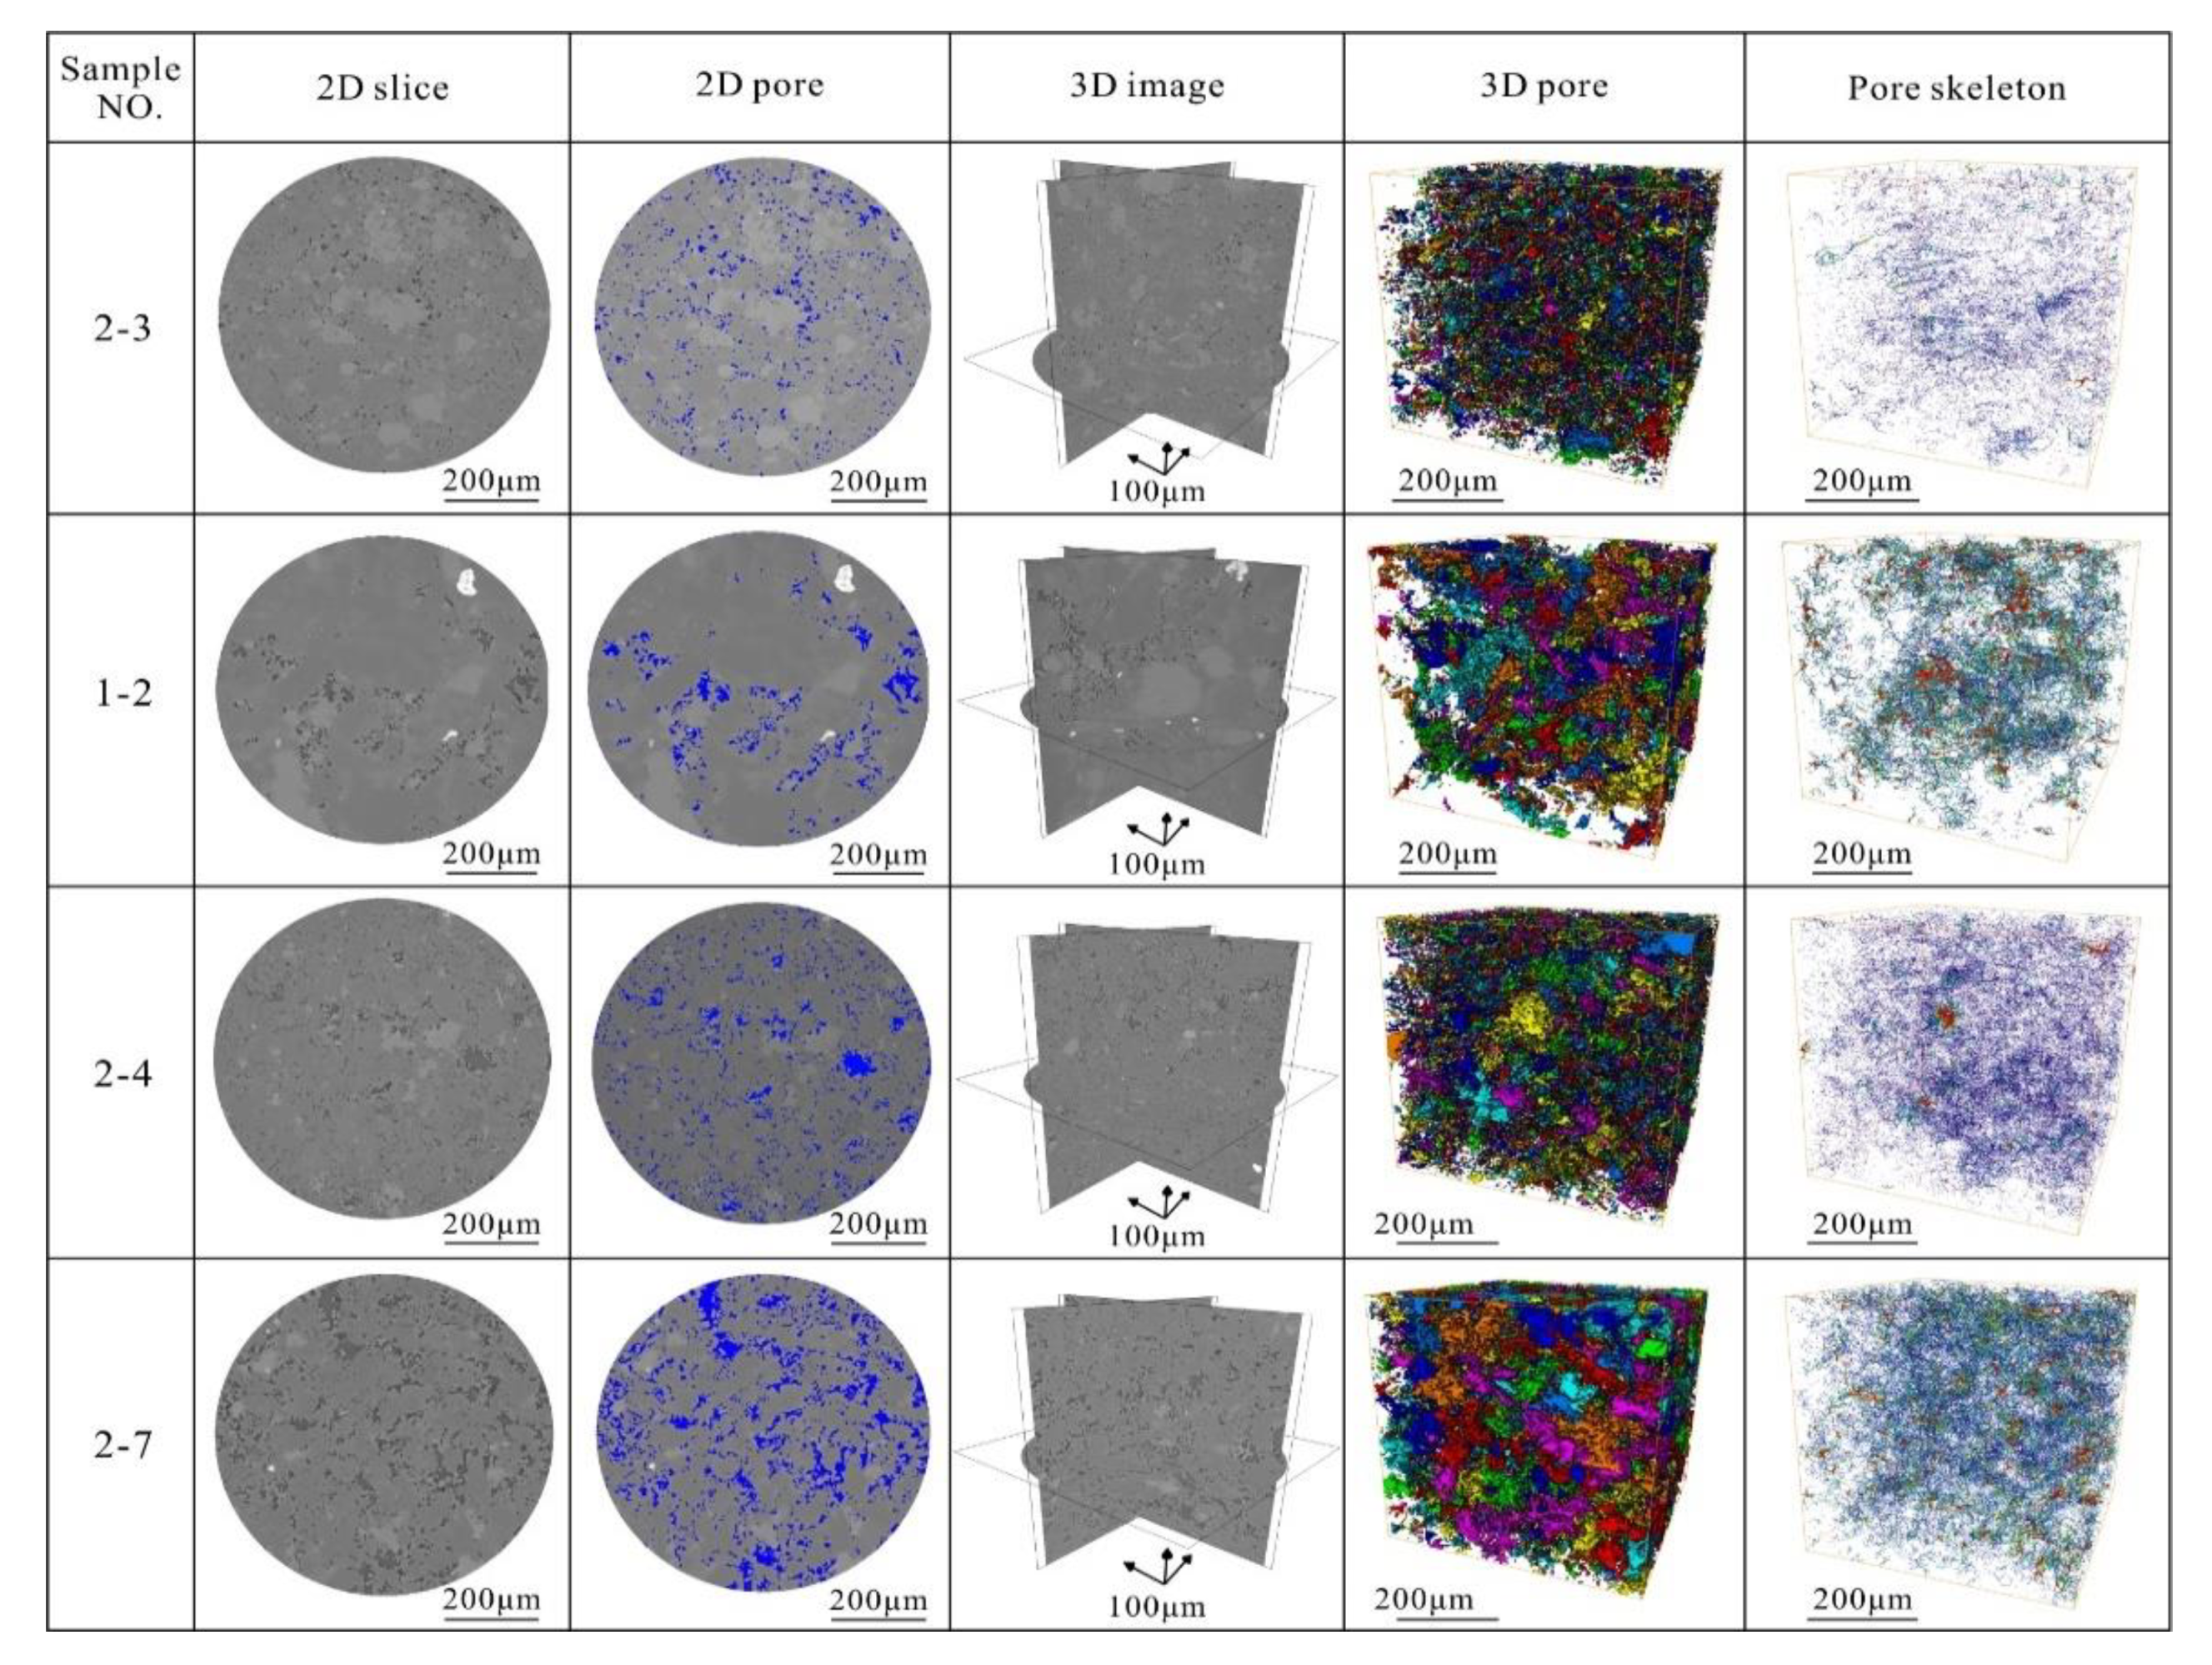
4.3.2. Features of Pore Network by X-ray μ-CT

Shape factor is calculated by the geometrical parameters of the cross-sectional pores or throats, which is used to reflect the smoothness of pore wall. Shape factor (G) is the ratio of the cross-sectional surface area (A) to the square of perimeter (P2), and the larger G value indicates a smoother pore wall [53]. Pore shape can be simplified as triangle, square and circle [27,54], where 0.0481, 0.071 and 0.0796, respectively, are commonly used as threshold values of shape factor [26,55]. Shape factor distribution of the pores in the Lucaogou reservoirs suggests that pores are predominantly characterized by irregular shape; the cumulative percentage of pores with a shape of triangle is greater than 50% (Figure 8). Shape factor presents a negative correlation with pore size, indicating small pores tend to be circle.
Pores segmented from X-ray μ-CT images are dominated by micro-scale pores due to the relatively low resolution (≈0.75 μm), pore and throat size distributions of the Lucaogou reservoirs are shown in Figure 9. The majority of pores are smaller than 10 μm, since the connected pores are separated into individual pores using the separate objects module in the Avizo software. The number frequency distributions of pore size are similar among the selected samples, which are skewed toward lower values with a peak at the range of 2 μm (Figure 9). Throat size is featured by a unimodal distribution pattern with peak value less than 1 μm, but obvious distinctions exist in the distribution ranges (Figure 9). However, volume frequency distributions display distinct differences, where two types of distribution patterns are observed in the Lucaogou tight reservoirs (Figure 9). A broad and relatively even distribution of pore volume is commonly skewed toward larger pore size (e.g., sample 2-4, sample 2-7), manifesting larger pores with small number are vital component of the total pore volume. Smaller pores can also be important contributor to pore volume, as indicated by the unimodal distribution skewed toward smaller pore size (e.g., sample 2-3, sample 1-2). Besides, pore throat radius ratio is defined as the ratio of pore radius to throat radius, which is a crucial parameter of controlling the permeability of tight reservoirs [56,57]. Tight reservoirs are commonly characterized by high pore throat radius ratio, resulting in low permeability less than 1 × 10⁻³ μm2 [30,58]. Pore throat radius ratios calculated by pore network models are distributed in the range of 1.1–160, and the majority of ratio values are less than 30.
The centroid path tortuosity is defined as the ratio between the path length and the distance between its two ends, and the latter parameter is directly given by the number of planes along a direction. The path length of one pore is the cumulative distance between the centroids of the pore along a direction. The tortuosity of pore network is the average tortuosity of the connected pores in the pore system [53]. The tortuosity of the selected samples shows a wide range of 2.76–9.76 (Table 3), and larger values indicate more complex pore network.
Furthermore, pore network models of the Lucaogou reservoirs are extracted to evaluate the pore network connectivity, where coordination number as a key parameter is calculated using the module of generate pore network model in the Avizo [32,55]. Coordination number refers to the average number of independent throats connected to a pore in a pore network, and its distribution illustrates pores segmented from X-ray μ-CT images are predominated by the unconnected pores (Figure 10). Small coordination number is mainly attributed to the relatively lower resolution of X-ray μ-CT images, since the connectivity rate of the sample in the area studied can reach as high as 82% when analyzing the high-resolution FIB-SEM images [59]. The average coordination number can reflect the complexity of the pore network, as indicated by the negative correlation between average coordination number and tortuosity (Figure 10b).

4.3.3. Fractal Dimension by X-ray μ-CT

The pore size distributions are statistically analyzed, and the relationship between the number (count N) and the size (volume s) of pores is investigated. Results indicate that they follow a power-law relationship N(s) α s−Df. P (s) versus pore size (s) is plotted on the doubly logarithmic axes (Figure 11), where P (s) represents the complementary cumulative distribution of pores larger than smin. The fractal dimension Df of pore size distribution is obtained using the maximum likelihood method for the best fit, which provides consistent maximum likelihood estimators [30,60].
Three-dimensional X-ray μ-CT images have been regarded as the innovative method to give a direct and intuitive description of morphological and topological pore structure. Due to the limitation of image resolution, X-ray μ-CT is limited to describe the fractal features of microscale and macroscale pores. In general, fractal dimension Df3 varies from 1.66 to 2.32 (Table 3), and the increase of fractal dimension suggests the drop in homogeneity of the pore network.

5. Discussion

5.1. Implications for a Full-Range of Pore Size Distribution

MICP can give an important indication of small pore size distribution due to the ultra-high intrusion pressure, but it is inadequate to describe the large pore size distribution (>40 μm) on account of shielding effects [61]. Moreover, only connected pore-throat network is investigated by mercury intrusion techniques, since isolated pore space cannot be reached during the intrusion process [56]. On the contrary, X-ray μ-CT is a burgeoning technique to provide three-dimensional visualization of microscale pore system, as a result, both interconnected and isolated pores can be analyzed qualitatively and quantitatively [14,49]. However, in view of the relatively low space resolution and high expense of X-ray μ-CT, MICP and X-ray μ-CT can be combined to give a comprehensive investigation of pore size distribution.
The overall pore size of tight reservoirs ranges from 0.01 μm to 50 μm, which presents various peak distribution patterns. Four representative samples are taken as examples to illustrate the characteristics of peak distribution, namely sample 2-3, 1-2, 2-4 and 2-7 (Figure 12). Sample 2-3 indicates a relatively uniform pore size distribution with one peak located at the value of 3 μm, which demonstrates a poor sorting of pore sizes (Figure 12a). The rest representative samples are characterized by two peaks, but peak values are quite different. Peaks of sample 1-2 are located at the values of 2 μm and 10 μm (Figure 12b), whereas peaks of sample 2-4 are located at the values of 0.3 μm and 3 μm (Figure 12c). It is worth noting that the location of the second peak of sample 2-7 skews toward the large pores, where the values of two peaks are 0.6 μm and 26 μm respectively (Figure 12d). Pore size distribution is quantitatively analyzed in volume fraction, which demonstrates pore volume contribution of different sized pores. The volume contribution of large pores increases as the peak of pore size distribution skews toward large pores, which means storage capacity of large pores is enhanced. The observations of thin sections and two-dimensional X-ray μ-CT slices suggest that large pores are commonly associated with residual intergranular pores and dissolved intergranular pores (Figure 2), and these pores play significant roles in the storage of tight oil.

5.2. Implications for Storage Capability and Transport Capability

MICP is commonly used to characterize the internal structure of interconnected pore network and evaluate the storage capability and flow potential of the reservoir [6,62,63]. The inflection point, known as Pittman’s hyperbola’s apex, is a key turning point from large and well-connected pore-throats to small and poor-connected pore-throats [28,40,64]. This point divides the pore size range into two subranges, and also divides the fractal curve into two segments (Figure 5). According to the curves calculated by MICP data in Figure 13, pores connected by throats larger than radius at the inflection point account for less than 50% of reservoir storage volume for most of tight reservoirs in the Lucaogou Formation. In order to more accurately evaluate the reservoir storage capability, the ratio of SHgapex to SHgmax is calculated to eliminate the effect of SHgmax (Figure 14). A relatively weak positive correlation between SHgapex-SHgmax ratio and helium porosity infers that the storage capability of pores connected by throats larger than rapex increases with the increase of tight reservoirs porosity (Figure 14a).
Transport capability of tight reservoir can be described quantitatively by the permeability contribution, which is calculated using the transformation of the Kozeny-Carman equation [56] as shown below.
K i = S i S i + 1 r ( S ) 2 d S 0 S m a x r ( S ) 2 d S
where Ki is the permeability contribution value under a pressure, %; Smax is the maximum mercury saturation under the highest pressure, %; Si is the mercury saturation under a pressure, %; Si+1 is the mercury saturation under next point of pressure, %; r(S) is the corresponding pore throat radius under a pressure, μm; dS is the incremental mercury saturation between two pressures, %. The cumulative permeability contribution curve illustrates that more than 90% of reservoir flow potential is attributed to pores connected by throats larger than rapex, and these pores are the main flow path (Figure 13). Moreover, deviation is observed among the relationship between storage capability and flow potential of tight reservoirs when the ratio of SHgapex to SHgmax is less than 25% (Figure 14b). Their cumulative permeability contribution corresponding to rapex are abnormally high, which suggests that pores connected by throats greater than rapex control fluid flow in the pore network, even though they provide less than 25% of storage volume (Figure 14b). It is worth noting that these tight reservoirs are characterized by low porosity less than 5% (Figure 14a), indicating that reservoir storage space is predominantly composed of small pores but reservoir flow potential is mainly controlled by large pores. However, with regard to tight reservoirs with porosity greater than 5%, a positive correlation between SHgapex-SHgmax ratio and cumulative permeability contribution indicates that reservoir flow potential controlled by large pores is proportional to its storage capability (Figure 14b). This suggests that pores larger than rapex are the dominant contributor to total storage space and also serve as the main flow path.
Fractal analyses of pore size distribution demonstrate that consistency of fractal dimension exists between large pores calculated by X-ray μ-CT data and small pores calculated by MICP data, suggested by a positive correlation between Df3 and Df2 (Figure 15a). This reveals the fractal nature of pore system in the tight reservoirs regardless of the approaches to characterizing the pore network or calculation method of fractal dimension of the pore network [31,65]. The fractal dimension can reflect the heterogeneity of pore spaces, which also has an impact on the storage and transport property of tight reservoirs [66]. As shown in Figure 15b, a negative correlation exists between the fractal dimension Df2 and the maximum mercury saturation, manifesting that tight reservoirs with less heterogeneous pore network are apt to have high storage capability. Moreover, it is confirmed by a strong negative correlation between fractal dimension Df2 and mercury saturation at the radius of apex as well as the negative correlation between Df2 and air porosity of tight reservoirs (Figure 15c,d). However, the relations between Df2 and transport-related parameters are characterized by weak trends (Figure 15e,f), which suggests that the effect of pore network heterogeneity of tight reservoirs on the transport capability are more complicated. The transport capability of tight reservoir can be influenced by pore structure and physical interactions of fluids with minerals [31].

6. Conclusions

Mercury intrusion capillary Porosimetry (MICP) and X-ray computed tomography (X-ray μ-CT) were employed to quantitatively characterize the pore structure of tight reservoirs in the Lucaogou Formation in the Jimsar Sag, Junggar Basin.
(1)
Tight reservoirs are characterized by diverse lithologies with a wide range of porosities and permeabilities. MICP analyses indicate that pore sizes of tight reservoirs display unimodal distribution patterns, where remarkable differences are observed in the peak width and peak radius. Fractal dimensions are separated by Swanson’s parameter into two segments, where pores with radius less than Rapex have distinct fractal features with Df ranging 2.05–2.37.
(2)
3D pore networks are segmented from X-ray μ-CT images, which are composed of interconnected pores and isolated pores. Individual pores and throats are dominated by irregular shape, and their size distributions are featured by unimodal patterns. Pores are commonly less than 5 μm and pore throats are predominantly less than 1 μm, while the pore volume distribution and maximum values of pore throats show significant differences. Pore network characterized by large average coordination numbers and small tortuosity commonly presents a broad and relatively even distribution of pore volume skewing toward larger pore sizes. Fractal dimension, an indicator of pore network heterogeneity, ranges from 1.66 to 2.32, which is consistent with the results derived from MICP.
(3)
The overall pore size distribution is obtained by combining MICP and X-ray μ-CT analysis, which gives a significant insight into the storage and transport capability of tight reservoirs. In general, pores connected by pore throats larger than Rapex account for up to 50% of storage volume, although they control the dominant flowing pathways. As for tight reservoirs with porosity greater than 5%, transport capability of pores connected by pore throats larger than Rapex increases with the increasing storage capability. The heterogeneity of pore network revealed by fractal dimensions shows a negative correlation with storage capability, suggesting that the less the heterogeneous pore network is, the higher storage capability would be. However, the effect of pore network heterogeneity on the transport capability is more complex, as indicated by weak correlations between fractal dimensions and transport-associated parameters.

Author Contributions

Conceptualization, Y.S., M.Z. and K.L.; data curation, J.Q.; methodology, Y.S. and K.L.; software, X.D. and J.J.; writing—original draft, Y.S. All authors have read and agreed to the published version of the manuscript.

Funding

This work was funded by grants from the Strategic Priority Research Program of the Chinese Academy of Sciences (Grand No. XDA14010305), National Programs for Fundamental Research and Development of China (Grand No. 2014CB239005), China Postdoctoral Science Foundation (Grand No. 2020M672172), Fundamental Research Funds for the Central Universities (Grand No. 20CX06056A).

Institutional Review Board Statement

Not applicable.

Informed Consent Statement

Not applicable.

Data Availability Statement

Not applicable.

Acknowledgments

We would like to extend our appreciation to the Xinjiang Oilfield Company of PetroChina for the provision of core samples. This work was conducted at the CNPC Key Laboratory of Basin Structural & Hydrocarbon Accumulation in the Research Institute of Petroleum Exploration & Development, PetroChina in Beijing.

Conflicts of Interest

The authors declare no conflict of interest.

References

  1. Zou, C.; Zhai, G.; Zhang, G.; Wang, H.; Zhang, G.; Li, J.; Wang, Z.; Wen, Z.; Ma, F.; Liang, Y.; et al. Formation, distribution, potential and prediction of global conventional and unconventional hydrocarbon resources. Pet. Explor. Dev. 2015, 42, 14–28. [Google Scholar] [CrossRef]
  2. Yu, W.; Sepehrnoori, K. Chapter 1—Introduction of Shale Gas and Tight Oil Reservoirs. In Shale Gas and Tight Oil Reservoir Simulation; Yu, W., Sepehrnoori, K., Eds.; Gulf Professional Publishing: Oxford, UK, 2018; pp. 1–10. [Google Scholar]
  3. Song, Z.; Song, Y.; Li, Y.; Bai, B.; Song, K.; Hou, J. A critical review of CO2 enhanced oil recovery in tight oil reservoirs of North America and China. Fuel 2020, 276, 118006. [Google Scholar] [CrossRef]
  4. Loucks, R.G.; Ruppel, S.C. Mississippian Barnett Shale: Lithofacies and depositional setting of a deep-water shale-gas succession in the Fort Worth Basin, Texas. AAPG Bull. 2007, 91, 579–601. [Google Scholar] [CrossRef] [Green Version]
  5. Zou, C.; Tao, S.; Hou, L.; Zhu, R.; Yuan, X.; Zhang, G. Unconventional Petroleum Geology; Geological Publishing House: Beijing, China, 2014. [Google Scholar]
  6. Xi, K.; Cao, Y.; Haile, B.G.; Zhu, R.; Jahren, J.; Bjørlykke, K.; Zhang, X.; Hellevang, H. How does the pore-throat size control the reservoir quality and oiliness of tight sandstones? The case of the Lower Cretaceous Quantou Formation in the southern Songliao Basin, China. Mar. Pet. Geol. 2016, 76, 1–15. [Google Scholar] [CrossRef]
  7. Saraji, S.; Piri, M. The representative sample size in shale oil rocks and nano-scale characterization of transport properties. Int. J. Coal Geol. 2015, 146, 42–54. [Google Scholar] [CrossRef]
  8. Berg, S.; Rücker, M.; Ott, H.; Georgiadis, A.; van der Linde, H.; Enzmann, F.; Kersten, M.; Armstrong, R.T.; de With, S.; Becker, J. Connected pathway relative permeability from pore-scale imaging of imbibition. Adv. Water Resour. 2016, 90, 24–35. [Google Scholar] [CrossRef] [Green Version]
  9. Schmitt Rahner, M.; Fernandes, C.; Wolf, F.; Cunha Neto, J.A.; Rahner, C.; Santos, V. Characterization of Brazilian tight gas sandstones relating permeability and Angstrom-to micron-scale pore structures. J. Nat. Gas Sci. Eng. 2015, 27, 785–807. [Google Scholar] [CrossRef]
  10. Cao, Z.; Liu, G.; Zhan, H.; Li, C.; You, Y.; Yang, C.; Jiang, H. Pore structure characterization of Chang-7 tight sandstone using MICP combined with N2GA techniques and its geological control factors. Sci. Rep. 2016, 6, 36919. [Google Scholar] [CrossRef]
  11. An, S.; Yao, J.; Yang, Y.; Zhang, L.; Zhao, J.; Gao, Y. Influence of pore structure parameters on flow characteristics based on a digital rock and the pore network model. J. Nat. Gas Sci. Eng. 2016, 31, 156–163. [Google Scholar] [CrossRef]
  12. Gao, H.; Cao, J.; Wang, C.; He, M.; Dou, L.; Huang, X.; Li, T. Comprehensive characterization of pore and throat system for tight sandstone reservoirs and associated permeability determination method using SEM, rate-controlled mercury and high pressure mercury. J. Pet. Sci. Eng. 2019, 174, 514–524. [Google Scholar] [CrossRef]
  13. Xiao, D.; Jiang, S.; Thul, D.; Huang, W.; Lu, Z.; Lu, S. Combining rate-controlled porosimetry and NMR to probe full-range pore throat structures and their evolution features in tight sands: A case study in the Songliao Basin, China. Mar. Pet. Geol. 2017, 83, 111–123. [Google Scholar] [CrossRef]
  14. Hemes, S.; Desbois, G.; Urai, J.L.; Schröppel, B.; Schwarz, J.-O. Multi-scale characterization of porosity in Boom Clay (HADES-level, Mol, Belgium) using a combination of X-ray μ-CT, 2D BIB-SEM and FIB-SEM tomography. Microporous Mesoporous Mater. 2015, 208, 1–20. [Google Scholar] [CrossRef]
  15. Zhang, P.; Lee, Y.I.; Zhang, J. A review of high-resolution X-ray computed tomography applied to petroleum geology and a case study. Micron 2019, 124, 102702. [Google Scholar] [CrossRef]
  16. Conroy, G.C.; Vannier, M.W. Noninvasive Three-Dimensional Computer Imaging of Matrix-Filled Fossil Skulls by High-Resolution Computed Tomography. Science 1984, 226, 456. [Google Scholar] [CrossRef] [PubMed]
  17. Long, H.; Swennen, R.; Foubert, A.; Dierick, M.; Jacobs, P. 3D quantification of mineral components and porosity distribution in Westphalian C sandstone by microfocus X-ray computed tomography. Sediment. Geol. 2009, 220, 116–125. [Google Scholar] [CrossRef]
  18. Cnudde, V.; Boone, M.N. High-resolution X-ray computed tomography in geosciences: A review of the current technology and applications. Earth-Sci. Rev. 2013, 123, 1–17. [Google Scholar] [CrossRef] [Green Version]
  19. Remeysen, K.; Swennen, R. Application of microfocus computed tomography in carbonate reservoir characterization: Possibilities and limitations. Mar. Pet. Geol. 2008, 25, 486–499. [Google Scholar] [CrossRef]
  20. Van Geet, M.; Swennen, R.; Wevers, M. Towards 3-D petrography: Application of microfocus computer tomography in geological science. Comput. Geosci. 2001, 27, 1091–1099. [Google Scholar] [CrossRef]
  21. Remeysen, K.; Swennen, R. Beam hardening artifact reduction in microfocus computed tomography for improved quantitative coal characterization. Int. J. Coal Geol. 2006, 67, 101–111. [Google Scholar] [CrossRef]
  22. Peng, S.; Hu, Q.; Dultz, S.; Zhang, M. Using X-ray computed tomography in pore structure characterization for a Berea sandstone: Resolution effect. J. Hydrol. 2012, 472–473, 254–261. [Google Scholar] [CrossRef]
  23. Schlüter, S.; Sheppard, A.; Brown, K.; Wildenschild, D. Image processing of multiphase images obtained via X-ray microtomography: A review. Water Resour. Res. 2014, 50, 3615–3639. [Google Scholar] [CrossRef]
  24. Saif, T.; Lin, Q.; Butcher, A.R.; Bijeljic, B.; Blunt, M.J. Multi-scale multi-dimensional microstructure imaging of oil shale pyrolysis using X-ray micro-tomography, automated ultra-high resolution SEM, MAPS Mineralogy and FIB-SEM. Appl. Energy 2017, 202, 628–647. [Google Scholar] [CrossRef]
  25. Smal, P.; Gouze, P.; Rodriguez, O. An automatic segmentation algorithm for retrieving sub-resolution porosity from X-ray tomography images. J. Pet. Sci. Eng. 2018, 166, 198–207. [Google Scholar] [CrossRef]
  26. Dong, H.; Blunt, M.J. Pore-network extraction from micro-computerized-tomography images. Phys. Rev. E 2009, 80, 036307. [Google Scholar] [CrossRef] [PubMed] [Green Version]
  27. Blunt, M.J. Multiphase Flow in Permeable Media: A Pore-Scale Perspective; Cambridge University Press: London, UK, 2017. [Google Scholar]
  28. Lai, J.; Wang, G.; Cao, J.; Xiao, C.; Wang, S.; Pang, X.; Dai, Q.; He, Z.; Fan, X.; Yang, L.; et al. Investigation of pore structure and petrophysical property in tight sandstones. Mar. Pet. Geol. 2018, 91, 179–189. [Google Scholar] [CrossRef]
  29. Zhao, P.; Wang, Z.; Sun, Z.; Cai, J.; Wang, L. Investigation on the pore structure and multifractal characteristics of tight oil reservoirs using NMR measurements: Permian Lucaogou Formation in Jimusaer Sag, Junggar Basin. Mar. Pet. Geol. 2017, 86, 1067–1081. [Google Scholar] [CrossRef]
  30. Su, Y.; Zha, M.; Ding, X.; Qu, J.; Wang, X.; Yang, C.; Iglauer, S. Pore type and pore size distribution of tight reservoirs in the Permian Lucaogou Formation of the Jimsar Sag, Junggar Basin, NW China. Mar. Pet. Geol. 2018, 89, 761–774. [Google Scholar] [CrossRef]
  31. Schmitt Rahner, M.; Halisch, M.; Peres Fernandes, C.; Weller, A.; Sampaio Santiago dos Santos, V. Fractal dimensions of pore spaces in unconventional reservoir rocks using X-ray nano- and micro-computed tomography. J. Nat. Gas Sci. Eng. 2018, 55, 298–311. [Google Scholar] [CrossRef]
  32. Zhao, Y.; Zhu, G.; Dong, Y.; Danesh, N.N.; Chen, Z.; Zhang, T. Comparison of low-field NMR and microfocus X-ray computed tomography in fractal characterization of pores in artificial cores. Fuel 2017, 210, 217–226. [Google Scholar] [CrossRef]
  33. Kuang, L.; Tang, Y.; Lei, D.; Chang, Q.; Ouyang, M.; Hou, L.; Liu, D. Formation conditions and exploration potential of tight oil in the Permian saline lacustrine dolomitic rock, Junggar Basin, NW China. Pet. Explor. Dev. 2012, 39, 700–711. [Google Scholar] [CrossRef]
  34. Ma, K.; Hou, J.; Liu, Y.; Shi, Y.; Yan, L.; Chen, F. The sedimentary model of saline lacustrine mixed sedimentation in Permian Lucaogou Formation Jimsar sag. Acta Pet. Sin. 2017, 36, 636–648. [Google Scholar]
  35. Jiang, Y.; Liu, Y.; Yang, Z.; Nan, Y.; Wang, R.; Zhou, P.; Yang, Y.; Kou, J.; Zhou, N. Characteristics and origin of tuff-type tight oil in Jimusaer sag, Junggar Basin, NW China. Pet. Explor. Dev. 2015, 42, 810–818. [Google Scholar] [CrossRef]
  36. Liu, C.; Liu, K.; Wang, X.; Zhu, R.; Wu, L.; Xu, X. Chemo-sedimentary facies analysis of fine-grained sediment formations: An example from the Lucaogou Fm in the Jimusaer sag, Junggar Basin, NW China. Mar. Pet. Geol. 2019, 110, 388–402. [Google Scholar] [CrossRef]
  37. Cao, Z.; Liu, G.; Zhan, H.; Kong, Y.; Niu, Z.; Zhao, D. Geological control factors of micro oil distribution in tight reservoirs. Mar. Pet. Geol. 2016, 77, 1193–1205. [Google Scholar] [CrossRef]
  38. Tian, H.; Zhang, S.; Liu, S.; Ma, X.; Zhang, H. Parameter optimization of tight reservoir porosity determination. Pet. Geol. Exp. 2012, 34, 334–339. [Google Scholar]
  39. Tanikawa, W.; Shimamoto, T. Klinkenberg effect for gas permeability and its comparison to water permeability for porous sedimentary rocks. Hydrol. Earth Syst. Sci. Discuss. 2006, 2006, 1315–1338. [Google Scholar]
  40. Pittman, E.D. Relationship of porosity and permeability to various parameters derived from mercury injection-capillary pressure curves for sandstone. Aapg Bull. 1992, 76, 191–198. [Google Scholar]
  41. Lai, J.; Wang, G. Fractal analysis of tight gas sandstones using high-pressure mercury intrusion techniques. J. Nat. Gas Sci. Eng. 2015, 24, 185–196. [Google Scholar] [CrossRef]
  42. Wang, H.; Wu, W.; Chen, T.; Yu, J.; Pan, J. Pore structure and fractal analysis of shale oil reservoirs: A case study of the Paleogene Shahejie Formation in the Dongying Depression, Bohai Bay, China. J. Pet. Sci. Eng. 2019, 177, 711–723. [Google Scholar] [CrossRef]
  43. Li, K.; Horne, R.N. Comparison of methods to calculate relative permeability from capillary pressure in consolidated water-wet porous media. Water Resour. Res. 2006, 42. [Google Scholar] [CrossRef] [Green Version]
  44. Mandelbrot, B.B. The Fractal Geometry of Nature; W.H. Freeman: San Francisco, CA, USA, 1982. [Google Scholar]
  45. Li, K. Analytical derivation of Brooks–Corey type capillary pressure models using fractal geometry and evaluation of rock heterogeneity. J. Pet. Sci. Eng. 2010, 73, 20–26. [Google Scholar] [CrossRef]
  46. Washburn, E.W. The Dynamics of Capillary Flow. Phys. Rev. 1921, 17, 273–283. [Google Scholar] [CrossRef]
  47. Su, P.; Xia, Z.; Qu, L.; Yu, W.; Wang, P.; Li, D.; Kong, X. Fractal characteristics of low-permeability gas sandstones based on a new model for mercury intrusion porosimetry. J. Nat. Gas Sci. Eng. 2018, 60, 246–255. [Google Scholar] [CrossRef]
  48. Buades, A.; Coll, B.; Morel, J.M. A non-local algorithm for image denoising. In Proceedings of the 2005 IEEE Computer Society Conference on Computer Vision and Pattern Recognition (CVPR’05), Washington, DC, USA, 20–25 June 2005; pp. 60–65. [Google Scholar]
  49. Markussen, Ø.; Dypvik, H.; Hammer, E.; Long, H.; Hammer, Ø. 3D characterization of porosity and authigenic cementation in Triassic conglomerates/arenites in the Edvard Grieg field using 3D micro-CT imaging. Mar. Pet. Geol. 2019, 99, 265–281. [Google Scholar] [CrossRef]
  50. Bruns, S.; Stipp, S.L.S.; Sørensen, H.O. Statistical Representative Elementary Volumes of Porous Media determined using Greyscale Analysis of 3D Tomograms. Adv. Water Resour. 2017, 107, 32–42. [Google Scholar] [CrossRef]
  51. Zambrano, M.; Tondi, E.; Mancini, L.; Arzilli, F.; Lanzafame, G.; Materazzi, M.; Torrieri, S. 3D Pore-network quantitative analysis in deformed carbonate grainstones. Mar. Pet. Geol. 2017, 82, 251–264. [Google Scholar] [CrossRef]
  52. Al-Raoush, R.; Papadopoulos, A. Representative elementary volume analysis of porous media using X-ray computed tomography. Powder Technol. 2010, 200, 69–77. [Google Scholar] [CrossRef]
  53. Wu, Y.; Lin, C.; Ren, L.; Yan, W.; An, S.; Chen, B.; Wang, Y.; Zhang, X.; You, C.; Zhang, Y. Reconstruction of 3D porous media using multiple-point statistics based on a 3D training image. J. Nat. Gas Sci. Eng. 2018, 51, 129–140. [Google Scholar] [CrossRef]
  54. Mason, G.; Morrow, N.R. Capillary behavior of a perfectly wetting liquid in irregular triangular tubes. J. Colloid Interface Sci. 1991, 141, 262–274. [Google Scholar] [CrossRef]
  55. Wu, Y.; Tahmasebi, P.; Lin, C.; Zahid, M.A.; Dong, C.; Golab, A.N.; Ren, L. A comprehensive study on geometric, topological and fractal characterizations of pore systems in low-permeability reservoirs based on SEM, MICP, NMR, and X-ray CT experiments. Mar. Pet. Geol. 2019, 103, 12–28. [Google Scholar] [CrossRef]
  56. Wu, H.; Ji, Y.; Liu, R.; Zhang, C.; Chen, S. Insight into the Pore Structure of Tight Gas Sandstones: A Case Study in the Ordos Basin, NW China. Energy Fuels 2017, 31, 13159–13178. [Google Scholar] [CrossRef]
  57. Wang, R.; Chi, Y.; Zhang, L.; He, R.; Tang, Z.; Liu, Z. Comparative studies of microscopic pore throat characteristics of unconventional super-low permeability sandstone reservoirs: Examples of Chang 6 and Chang 8 reservoirs of Yanchang Formation in Ordos Basin, China. J. Pet. Sci. Eng. 2018, 160, 72–90. [Google Scholar] [CrossRef]
  58. Zou, C.; Zhu, R.; Bai, B.; Yang, Z.; Wu, S.; Su, L.; Dong, D.; Li, X. First discovery of nano-pore throat in oil and gas reservoir in China and its scientific value. Acta Petrol. Sin. 2011, 27, 1857–1864. [Google Scholar]
  59. Sun, L.; Wang, X.; Jin, X.; Li, J.; Wu, S. Three dimensional characterization and quantitative connectivity analysis of micro/nano pore space. Pet. Explor. Dev. 2016, 43, 537–546. [Google Scholar] [CrossRef]
  60. Iglauer, S.; Wülling, W. The scaling exponent of residual nonwetting phase cluster size distributions in porous media. Geophys. Res. Lett. 2016, 43, 11253–11260. [Google Scholar] [CrossRef]
  61. Qiao, J.; Zeng, J.; Jiang, S.; Ma, Y.; Feng, S.; Xie, H.; Wang, Y.; Hu, H. Role of pore structure in the percolation and storage capacities of deeply buried sandstone reservoirs: A case study of the Junggar Basin, China. Mar. Pet. Geol. 2020, 113, 104129. [Google Scholar] [CrossRef]
  62. Shao, X.; Pang, X.; Jiang, F.; Li, L.; Huyan, Y.; Zheng, D. Reservoir Characterization of Tight Sandstones Using Nuclear Magnetic Resonance and Incremental Pressure Mercury Injection Experiments: Implication for Tight Sand Gas Reservoir Quality. Energy Fuels 2017, 31, 10420–10431. [Google Scholar] [CrossRef]
  63. Ma, K.; Hou, J.; Yan, L.; Chen, F. Pore-throat structures and their control of terrestrial lacustrine tight reservoir quality: The Permian Lucaogou Formation, Jimsar Sag, northwestern China. Interpretation 2018, 6, T889–T906. [Google Scholar] [CrossRef]
  64. Swanson, B.F. A Simple Correlation Between Permeabilities and Mercury Capillary Pressures. SPE-7837-PA 1981, 33, 2498–2504. [Google Scholar] [CrossRef]
  65. Lai, J.; Wang, G.; Wang, Z.; Chen, J.; Pang, X.; Wang, S.; Zhou, Z.; He, Z.; Qin, Z.; Fan, X. A review on pore structure characterization in tight sandstones. Earth-Sci. Rev. 2018, 177, 436–457. [Google Scholar] [CrossRef]
  66. Huang, W.; Lu, S.; Hersi, O.S.; Wang, M.; Deng, S.; Lu, R. Reservoir spaces in tight sandstones: Classification, fractal characters, and heterogeneity. J. Nat. Gas Sci. Eng. 2017, 46, 80–92. [Google Scholar] [CrossRef]
Figure 1. Location map of the Jimsar Sag and wells investigated, and a generalized stratigraphic column of Well J174 showing the sweet spot sections.
Energies 14 01251 g001
Figure 2. Photomicrographs and X-ray μ-CT images of tight reservoirs from the Lucaogou Formation. (a,b) Tufaceous silty dolomicrite; (c,d) Dolomitic siltstone; (e,f) Silty dolomicrite; (g,h) Tuffaceous siltstone; (i,j) Tufaceous dolomitic siltstone; (k,l) Dolomitic siltstone.
Energies 14 01251 g002
Figure 3. Relationship between helium porosity and permeability of tight reservoirs.
Energies 14 01251 g003
Figure 4. (1) Left plots show capillary curves of the Lucaogou reservoirs; (2) Right plots are the pore-throat size distributions of the Lucaogou reservoirs.
Energies 14 01251 g004
Figure 5. (1) Relationships between mecury saturation (SHg) and ratio of mecury saturation (SHg) to capillary pressure (Pc) aiming to determine the apex characteristics; (2) Fractal characteristics of MICP data.
Energies 14 01251 g005
Figure 6. Two-dimensional X-ray μ-CT slices, segmented pores (blue areas), two-dimensional slices in the XY, XZ, and YZ direction, three-dimensional X-ray μ-CT volume rendering of individual pores, and pore skeleton network of representative samples in the Lucaogou Formation.
Energies 14 01251 g006
Figure 7. Determination of representative elementary volumes (REV) of tight rocks.
Energies 14 01251 g007
Figure 8. Shape factors of pores segmented in two-dimensional slices of X-ray μ-CT.
Energies 14 01251 g008
Figure 9. Pore and throat size distribution of representative elementary volume of tight reservoirs.
Energies 14 01251 g009
Figure 10. (a) Coordination number distribution of typical samples showing the majority of pores are not connected; (b) The relationship between the average coordination number and the tortuosity of pore network of samples indicating complex pore network has a poor connectivity.
Energies 14 01251 g010
Figure 11. The cross-plot of pore size distribution of tight reservoirs following a power-law relationship.
Energies 14 01251 g011
Figure 12. Pore size distribution of tight reservoirs in the Lucaogou Formation.
Energies 14 01251 g012
Figure 13. Reservoir storage capability and reservoir flow potential of representative tight reservoirs in the Lucaogou Formation. (a) sample 2-3; (b) sample 1-2; (c) sample 2-4; (d) sample 2-7.
Energies 14 01251 g013
Figure 14. Relationships of parameters derived from MICP. (a) Relationship between SHgapex/SHgmax and air porosity showing that samples labeled by red triangles are characterized by low porosity less than 5%; (b) Relationship between SHgapex/SHgmax and cumulative permeability contribution, showing a positive correlation (R2 = 0.6347) except for three samples (labeled by red triangles). Note: SHgapex is the mercury saturation corresponding to Rapex; SHgmax is the maximum mercury saturation.
Energies 14 01251 g014
Figure 15. Plots of (a) relationships between fractal dimensions (Df3) calculated from X-ray μ-CT data and fractal dimensions (Df2) of small pores obtained from MICP data showing a weakly positive correlation; (b) relationships between the maximum mercury saturation and Df2 showing a weakly negative correlation; (c) relationships between mercury saturation corresponding to the radius of the apex and Df2 showing a negative correlation; (d) relationships between porosity and Df2 showing a negative correlation; (e) relationships between cumulative permeability contribution and Df2 showing a poor correlation; (f) relationships between permeability and Df2 showing a poor correlation.
Energies 14 01251 g015
Table 1. Physical properties and MICP parameters of tight reservoirs.
Sample
No.
φ
/%
K
/10−3μm2
Pd
/MPa
rmax
/μm
SHgmax
/%
We
/%
Rapex
/μm
SHgapex
/%
PCapex
/MPa
1-A-16.020.000390.70591.041255.2310.270.321333.694.5778
1-A-28.330.002430.072910.083674.691.663.537034.580.4158
1-A-39.060.000590.28410.407486.2533.192.029236.420.7248
1-A-47.790.000290.045516.155289.452.1420.181424.780.07288
1-B-54.480.000860.045516.155277.363.093.576018.120.4113
1-C-615.220.446090.28412.587195.0230.482.029236.420.7248
2-A-13.470.000251.14660.64138.1413.120.20058.267.3341
2-A-21.990.000440.011563.992451.381.9820.18144.570.0729
2-A-34.140.000420.24762.967954.421.632.142015.580.6867
2-B-46.160.000390.71351.030284.0910.340.810832.611.8141
2-D-53.740.000350.431.709342.7624.730.812220.521.8108
2-C-611.260.011930.4381.67863.1815.891.294941.041.1359
2-E-716.170.207420.43651.683898.1611.281.282350.631.1470
Note: φ is porosity; K is permeability; Pd is entry pressure; rmax is maximum pore throat radius; SHgmax is maximum mercury saturation; We is mercury removal efficiency; Rapex is pore throat radius corresponding to the inflection point; SHgapex is mercury saturation corresponding to Rapex; PCapex is intrusion pressure corresponding to Rapex.
Table 2. Fractal dimensions calculated using MICP data.
Sample No.Df1R2Df1Df2R2Df2
1-A-13.84 0.9532.07 0.8194
1-A-24.32 0.99772.08 0.8054
1-A-35.44 0.94522.19 0.8027
1-A-42.91 0.84592.09 0.9401
1-B-53.01 0.97822.14 0.8731
1-C-65.37 0.94952.14 0.8802
2-A-13.14 0.99552.37 0.9202
2-A-23.27 0.97222.34 0.9561
2-A-34.58 0.94792.21 0.9227
2-B-43.45 0.95362.13 0.8574
2-D-53.58 0.96512.11 0.8122
2-C-65.08 0.94032.05 0.8513
2-E-74.46 0.96452.08 0.7132
Table 3. Calculated parameters of the Lucaogou reservoirs obtained from X-ray μ-CT images.
Sample No.TortuosityAverage Coordination NumberDf3
1-A-19.760.00632.03
1-A-24.320.0351.75
1-A-35.610.0111.95
1-A-46.880.00772.06
1-B-56.650.00861.83
1-C-62.760.0581.66
2-A-15.740.00932.01
2-A-26.810.00582.20
2-A-35.600.0112.32
2-B-43.960.0242.04
2-D-55.210.00891.91
2-C-63.030.0541.83
2-E-72.890.0721.77
Publisher’s Note: MDPI stays neutral with regard to jurisdictional claims in published maps and institutional affiliations.

