Abstract
To realize the distributed generation and to make the partnership between the dispatchable units and variable renewable resources work efficiently, accurate and flexible monitoring needs to be implemented. Due to digital transformation in the energy industry, a large amount of data is and will be captured every day, but the inability to process them in real time challenges the conventional monitoring and maintenance practices. Access to automated and reliable data-filtering tools seems to be crucial for the monitoring of many distributed generation units, avoiding false warnings and improving the reliability. This study aims to evaluate a machine-learning-based methodology for autodetecting outliers from real data, exploring an interdisciplinary solution to replace the conventional manual approach that was very time-consuming and error-prone. The raw data used in this study was collected from experiments on a 100-kW micro gas turbine test rig in Norway. The proposed method uses Density-Based Spatial Clustering of Applications with Noise (DBSCAN) to detect and filter out the outliers. The filtered datasets are used to develop artificial neural networks (ANNs) as a baseline to predict the normal performance of the system for monitoring applications. Results show that the filtering method presented is reliable and fast, minimizing time and resources for data processing. It was also shown that the proposed method has the potential to enhance the performance of the predictive models and ANN-based monitoring.
1. Introduction
Driven by numerous factors, such as the requirement of reduction in greenhouse gas emissions, the successful emergence of renewable energy technologies and the inception of a smart paradigm, today’s energy sector is undergoing a profound change. Part of this change is a transition from large-scale centralized generation towards small-scale distributed generation (DG), with a deep penetration of renewable resources. The increasing share of intermittent renewables, such as solar and wind, has become a major challenge for grid flexibility and stability. Using dispatchable DG systems like fuel cells and microturbines, with their low emissions, high efficiency and fuel flexibility, has emerged as one of the promising contributors to address this issue [1]. However, the main concern in these systems is to sustain a high availability and reliability while minimizing the maintenance cost [2]. This concern has become even more critical than before, as these units will more often be operated in transient conditions to balance the variable renewables, which, consequently, will lead to lifetime reduction of the equipment [3]. Accurate monitoring tools as enablers for condition-based maintenance (CBM) can consequently lead to enhancements of the maintenance and shifting from conventional practices to a predictive maintenance and, as a result, can decrease the unexpected breakdowns and downtime. According to GE Power, the inability to identify an impending fault early and the resulting downtime in supply leads to a shortfall of nearly $10B annually to the power industry [4].
Condition monitoring is carried out based on the comparison between the actual condition of a system and its condition in normal (healthy) operations. Therefore, having a reliable model, which can predict the system behavior in healthy conditions, is very important. Primarily, there are two main different approaches to develop a model for monitoring systems, namely the physics-based and data-driven approaches. Physics-based approaches [2,5,6], which are derived from the first principle, are usually complex, and their accuracy decreases as the system complexity and modeling uncertainties increase. Moreover, the increase of the model complexities combined with the limitations of the mathematical techniques decreases their reliability for real-time monitoring tasks. On the other hand, the data-driven or intelligent approaches perform an analysis based only on the measured data from the system. These approaches mainly use AI techniques such as artificial neural networks (ANNs), neuro-fuzzy systems (NFs) and support vector machines [7,8,9]. Of these, ANNs have been the most commonly used tool for monitoring and fault diagnostics applications [10,11]. Essentially, ANN is the interconnected artificial neurons simulating the way that a biological neural network performs. The ANNs learn from the data by modeling a function that relates inputs to outputs. Once learned, such ANN-based models do not require an iterative solution to predict outputs; they are fast in response and can be used for online monitoring in real-time applications. Previous experiences [12,13,14,15,16,17] of the authors have also shown the reliability of ANNs as a flexible tool for the accurate prediction of nonlinear and multidimensional systems based on the data obtained from large and small-scale power plants.
Due to the rapid advancement of sensor and ICT technologies in today’s digital era, one of the most challenging aspects in monitoring that directly affects its success is the availability of a massive amount of data to be processed and filtered appropriately at increased frequencies in order to generate high-quality datasets for modeling and the subsequent condition monitoring task [18]. Data filtering is an important step in data-driven modelling, such as in the ANN, as erroneous and outlier data have significant impacts on the model’s accuracy, resulting in a degraded performance in prediction [19]. In previously published studies of the authors [16,17], the filtration for detecting outliers was carried out manually by screening all input and output data with respect to time. Any data point that was inconsistent with the remainder of the data or had a significant deviation as compared to its neighbours was treated as an outlier and was consequently removed from the dataset for further experimentation with ANN. Despite limited data used for these studies, the manual plotting and screening of real-life noisy data to detect the outliers was a demanding and time-consuming task, which was not thought free from human error. With an ever-growing number of DG installations and the volume of the data that are consequently stored every day in data repositories, such a conventional manual filtering approach is not seemed to be practical anymore. This therefore necessitates an effective and fast data-filtering method to clean contaminated measurements obtained from data lakes in an automated manner, which has rarely been touched in research works. In view of this context, this work aims to address the following questions:
- How can machine-learning techniques help the automated processing of a large amount of operational data in a real-time fashion?
- Can the dataset obtained from an automated data-filtering method be error-free and used to develop reliable predictive models with high prediction accuracy?
- How can an interdisciplinary approach with a combination of domain knowledge from energy systems and computer science pave the way for the successful implementation of this smart solution in energy systems?
Various data-filtering (outlier detection) methods exist in the literature [20,21,22,23,24] using statistics, spatial proximity, etc.—e.g., z-score, Density-Based Spatial Clustering of Applications with Noise (DBSCAN) and isolation forest. To cope with the challenges mentioned earlier, the current study investigates the application of a machine-learning technique using the principles of data clustering to detect and remove outliers in an automated manner. The automated approach has several advantages, as compared to its manual counterpart. The proposed auto-filtering method is not laborious, less time-consuming, fast, error-free (as two similar data points will never give dissimilar decisions in detecting an outlier) and, thereby, can produce better results under real-life uncertain situations. The proposed method explores the capabilities of DBSCAN (Density-Based Spatial Clustering of Applications with Noise) [24], a density-based data clustering model that works well when the distribution of values in the feature space are not known and the dataset is of medium size and multidimensional in nature [21,24,25,26]. The filtered clean datasets are then employed to develop or retrain the data-driven models based on ANNs that can function as a baseline to predict the normal operational conditions of the system. The DG system concerned and the data used in this study were based on a micro gas turbine (MGT) test rig, which was installed at a test facility in Stavanger, Norway [16]. MGTs, which are usually defined as small gas turbines up to a few hundred kilowatts, are considered a lucrative DG technology [27,28,29], providing dispatchable power to match demand and maintain the grid stability.
Neither data-driven energy system modeling nor machine-learning-based data filtration are new. However, the utilization of the huge potential imbedded in interdisciplinary collaboration between different disciplines needs practical examples to demonstrate the benefits of such collaborations. Methods and algorithms developed by AI scientists and engineers need to be applied to specific case studies to shed light on their potential and usefulness. In general, energy engineers’ lack of detailed knowledge about various AI methods, and AI scientists’ lack of domain knowledge in the field of energy technology, are among the hinders for the realization of such potential. This paper has utilized the synergy of the cross-fertilization of domain knowledge from energy engineering and the selection of a suitable data-filtering approach from data science for automation of the data handling and processing for a MGT unit, which can result in considerable time savings and improvement of the accuracy of the monitoring tool.
This study is the extension of the previous attempts of the authors, where they have been investigating and developing ANN-based tools for modeling and monitoring of small and large-scale energy systems [12,15,16,30]. As a part of an ongoing nationally funded project under the Indo-Norwegian Cooperation Program, the main contributions and novelty of this paper lie in the following features:
- In contrast to previous studies, where the manual and demanding data-filtering method was used, this research has proposed an automated data processing that has the capability to filter large amounts of data from outliers in a real-time fashion, providing error-free datasets for data-driven predictive models.
- A machine-learning-based data clustering method, DBSCAN, has been employed to identify the outliers in the raw dataset obtained from the MGT test rig. The filtered datasets were used to train and further test the ANN models. It should be noted that, for a comparative performance assessment between the manual and automated filtering methods, the optimum ANN setup, as it was used in [16], was identically considered in the present study.
- The present investigation has brought together researchers from energy systems, AI and data science to realize the potential of interdisciplinary research, contributing in a smart and reliable automated data-filtering tool that can work in real-time applications. This approach bridges the current knowledge gaps mainly caused by narrow focusing on a certain field of competence rather than an interdisciplinary approach that combines the strengths of different disciplines to solve real-world problems.
- The benefits of the proposed methodology have been demonstrated using available real-life data that allowed the validation of the developed tool to a level that could be suitable for real-life implementations not only in MGT applications but, also, in other types of DG systems.
2. Micro Gas Turbine System
MGT systems are operating on a recuperated Brayton cycle basis, which compromises a centrifugal compressor, a radial flow turbine, a combustion chamber and a recuperator. Figure 1 shows the schematic of a typical MGT. The intake air coming from the ambient is compressed by the compressor. The compressed air passes through a recuperator, where it is preheated by exhaust gas before entering the combustion chamber, in which the air is mixed with fuel and burned. The combustion gases expand through the turbine, delivering power to the shaft to drive the compressor and generator for electricity production. The turbine exhaust gas enters the recuperator and transfers heat to the colder compressed air. Given the high temperature at the recuperator outlet, the MGT is also equipped with a gas-water heat exchanger or economizer, which recovers the exhaust gas heat after the recuperator for heating purposes.
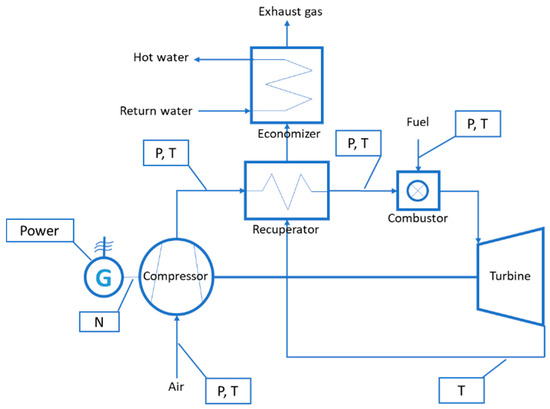
Figure 1.
The schematic of a typical micro gas turbine (MGT). P, T, G and N represent respectively pressure, temperature, generator and rotational speed.
The MGT test rig (Figure 2) used in this study was based on a Turbec T100 MGT with a nominal electrical and thermal power output of 100 kW and 167 kW, respectively. Its electrical efficiency is approximately 30%, but including the recovered heat for district heating, the overall thermal efficiency of the combined heat and power (CHP) T100 reaches about 80% [31]. The test rig was installed at a test facility in Stavanger, Norway to supply part of the local electricity and heat demand. To capture the impacts of changing the operational conditions on the engine performance, the test rig was equipped with additional sensors and data acquisition systems, as described in [16,32]. The test rig was operated at various operational conditions by changing the power demand, and a dataset consisting of 5976 samples was collected [16] to develop and validate the tools and methods.
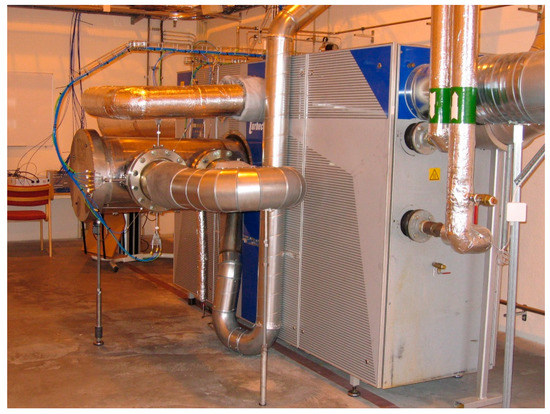
Figure 2.
The MGT test rig.
3. Methodology
The aim of this study is to develop a machine-learning-based methodology to detect outliers in an automated manner from the real data of dispatchable DG systems. The resulting filtered dataset is fed into the ANN-based model as it was developed in [16]. Such a model will act as a fast and accurate baseline for real-time monitoring applications. This is stimulated by the recent rise of DG driven by the global energy transition, which demands an accurate and flexible monitoring tool to improve the reliability of DG systems to help work their partnership with intermittent renewable resources efficiently. However, the major challenge that directly affects the adoption of data-driven monitoring and its success is the growing size of the data, which are not error-free in real life. To develop any data-driven system, data should be free from outliers. In this regard, an auto-filtering method using the DBSCAN algorithm was developed, and its performance was evaluated using the data collected from the MGT test rig, as described in the preceding section.
The collected dataset was initially preprocessed before any further analysis to discard the inconsistencies and anomalies, which was followed by normalization of the remaining data. It is to be noted that the input and output data of various measurements may lie in different ranges. Normalization was performed to avoid that a measurement with a higher range of values may become more dominant than the others. The processed dataset was then analyzed to filter out outliers using the DBSCAN algorithm. Different sets of filtered data representing the normal operational conditions of the MGT were generated by varying the parameters of the algorithm. The filtered datasets were then used to train and test different ANN models to examine the impact of automated filtering on the prediction accuracy. These steps are discussed in detail in the following subsections.
3.1. Preprocessing on the Dataset to Detect Outliers
Initially, the given dataset consisted of 5976 measurements for a total of 38 parameters. Since the present study concentrates on developing a robust ANN model for the prediction of the normal operations of the MGT system at a steady-state condition, any data from the unstable operations with high fluctuations were removed, as it was done in [16]. Moreover, data with missing attribute values due to a failure in the data acquisition system were also discarded from said dataset. This finally resulted into 5663 numbers of samples for further experimentation to detect outliers. This set of samples was first normalized in the following manner.
3.2. Data Normalization
We noticed that, in the given dataset, the values of different parameters (measurements) lie in different ranges. Thus, before executing the DBSCAN algorithm, data normalization (scaling) is performed, which maps all the parameter values (measurements) in the same range (0 to 1). This facilitates us to detect the outliers keeping the parametric values (of minpts and ε, which are explained in the Section 3.4) the same for all the measurements and giving equal priority to all of them. We have used max-min normalization, a commonly used technique, and it is done in the following way:
The normalized value of the ith row (observation) of the jth parameter, denoted as, normalized_dataij, is computed as normalized_dataij = (dataij − min_dataj)/range_dataj), where max_dataj and min_dataj, respectively, represent the maximum and the minimum values of the jth parameter, and range_dataj = max_dataj − min_dataj.
3.3. Data Clustering Approach for Outlier Detection
Clustering is a task of finding the natural groupings of data in an unsupervised manner, i.e., without knowing the class label of the data. It is a process of grouping patterns in a way so that data with similar properties will belong to the same cluster, whereas dissimilar data items will be assigned into different clusters. The scatter plot of a set of data items are shown in Figure 3a, and the generated clusters (two in number) and an outlier (x, red coloured) are shown in Figure 3b.
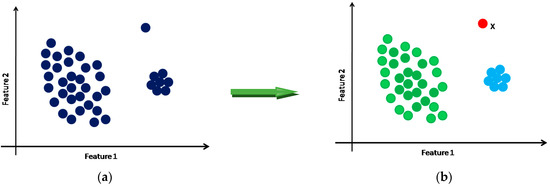
Figure 3.
Clustering of data. (a) Original dataset and (b) clustered data.
Since an outlier deviates substantially from other data points, it will not belong to any of the clusters and will be left out as an isolated point and can thus be detected (point x in Figure 3b). Clustering approaches can be broadly classified into partitioned, hierarchical, density-based, grid-based and model-based ones [21]. The present work exploits the capabilities of DBSCAN, a density-based clustering approach, to automatically detect the outliers from the given dataset. As mentioned in Section 1, the said algorithm is effective and widely used in different applications when the distribution of the feature values is not known a priori, and it is simple too. The algorithm uses two parameters: ε and minpts. The significance of these parameters is mentioned in the following section. At the termination of the algorithm, the data points, which do not belong to any of the clusters, will be treated as outliers. The working principle of the algorithm is given below in more detail.
3.4. DBSCAN Algorithm
DBSCAN is proposed by Ester et al. [24], which could be used to discover clusters of arbitrary shapes. The main concept of the DBSCAN algorithm is to locate regions of high density that are separated from one another by regions of low density. Here, the term “density” refers to the number of data points within an area. Density is measured using two user-specified parameters: ε and minpts. A value of (> 0) is used to specify the radius of the neighbour for each data point. The ε-neighbourhood of a point p, denoted as ε (p), is all the points whose distance from the point p are less than or equal to ε. To determine whether a neighbourhood is dense or not, DBSCAN uses the parameter minpts. If ε (p) contains at least minpts points, then the region covered by ε (p) is defined as a dense region. Following the definition of the dense region, a point can be classified into three categories. A point is a “core” point if the ε-neighbourhood of the point contains at least minpts points and these points are directly reachable from the core point. A “border” point, or a “boundary” point, is a point that has lesser than minpts points in its ε-neighbourhood but the point is in the neighbourhood of the core point. An “outlier” is defined as the one that is neither a core nor a border point.
The DBSCAN algorithm starts with an arbitrary point, and its neighborhood information is retrieved from the ε parameter. If this point contains minpts points within the ε-neighborhood, a cluster formation starts. Otherwise, the point is labeled as an outlier. This point can be later found within the ε-neighborhood of a different point and, thus, can be made a part of the cluster. If a point is found to be a core point, then the points within the ε-neighborhood are also part of the cluster. Therefore, all the points found within the ε-neighborhood are added, along with their own ε-neighborhood, if they are also core points. The above process continues until the density-connected cluster is completely found. Then, the algorithm restarts with a new random point, and the same process continues. The algorithm ends when all of the points have been visited and have been included in a cluster or identified as an outlier. The pseudocode of DBSCAN is given in Algorithm 1.
As an illustration, in Figure 4, with minpts as 5 and ε as 1, point q is found to be in a dense region. Figure 5 gives a visualization on core, border and outlier points. Here, for the ε = 1 unit and minpts = 7, the data point p has been found as a core point, whereas the data point q is a border point, and it is included into the same cluster as of p. The outlier point (denoted as r in Figure 5) is far away from the core and the border point, which does not have sufficient neighbours (minpts number of neighbours) within its ε -neighbourhood.
| Algorithm 1. DBSCAN (a density-based clustering algorithm) |
| Inputs: Dataset having X number of objects with F number of features ε: reachability distance or radius minpts: minimum number of points to form a cluster Outputs: A set of density-based clusters and an outlier set Method of feature-wise outlier detection using DBSCAN: Begin // Start of method let outliers_set = { } // initially null For each feature f in F //Start of 1st For loop let unvisited_set = { } unvisited_set = Dataset //add all objects of Dataset to unvisited_set For each point p in unvisited_set //Start of 2nd For loop unvisited_set = unvisited_set – {p} //remove p from unvisited_set let N = NEIGHBOUR(p, ε, f); //calculate neighbourhood of p If |N| < minpts outliers_set = outliers_set U { p} // include p to outlier_set Else create a new cluster C and add p to cluster C For each point point q in N //Start of 3rd For loop N = N – {q} //remove q from N If q is in unvisited_set remove q from unvisited set let Q = NEIGHBOUR(q, ε, f); If |Q| >= minpts N = N U Q //add all elements of Q to N EndIf EndIf If q is not a member of any Cluster add q to cluster C EndIf If q is in outliers_set outliers_set = outliers_set – {q} //remove q from outliers_set EndIf EndFor //End of of 3rd For loop EndIf EndFor //End of of 2nd For loop EndFor //End of of 1st For loop Return outliers_set End // End of method Method of calculating neighbourhood of a point p: Begin// Start of method let neighbour_set = { } //initially null For each point d in Dataset: If |d[f] – p[f]| is less than or equal to ε neighbour_set = neighbour_set U {d} //include d in neighbour_set EndIf EndFor return neighbor_set End// End of method |
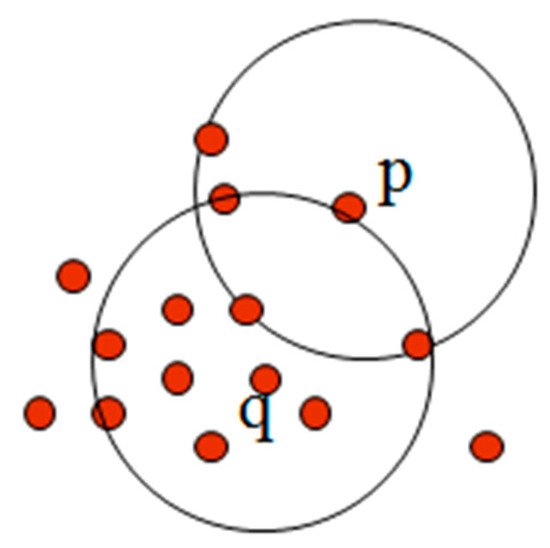
Figure 4.
ε-Neighbourhood and the density of a neighbourhood. Core point (p) and boundary point (q).
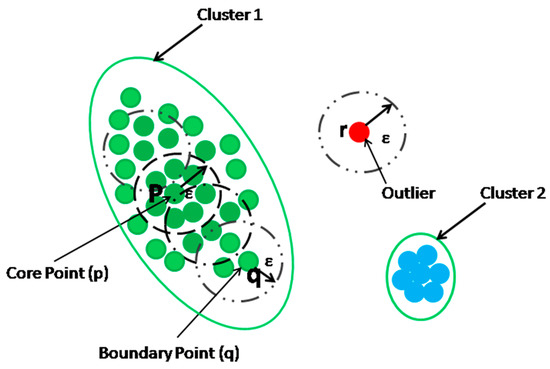
Figure 5.
Core, border and outlier.
3.5. ANN Model Development
The ANN model structure with input and output parameters is shown in Figure 6. A previous work of the authors [16] showed the power set, compressor inlet temperature and pressure as the optimum inputs to predict the performance of the engine with high accuracy. The outputs are the power output and the performance parameters at different parts of the engine. The multilayer perceptron (MLP) (an ANN) with one hidden layer was used and trained with the back-propagation algorithm. The commercial software NeuralSolutions (ver. 07, NeuroDimension, FL, USA) was employed for network training.
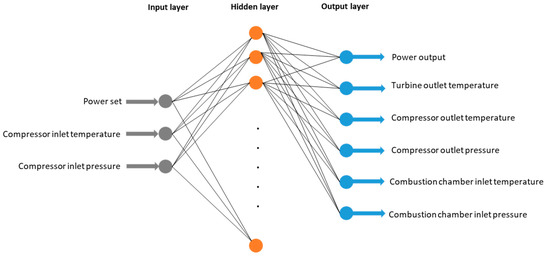
Figure 6.
Artificial neural network (ANN) model structure.
The filtered datasets were divided into two data disjoint sets—namely, training and validation datasets. The former was used to train the network, and the latter tested the predictability of the network, which consisted of unseen data, i.e., never used during the training. The step-by-step development of the ANN model, including the selection of training and validation datasets, training settings have been presented in [16]. The training dataset was randomized and divided itself into two subsets—namely, the training and cross-validation subsets, which contained 85% and 15% of the data, respectively. The training subset was used to adjust the network parameters, so-called weights, through conducting the back-propagation algorithm. The cross-validation subset was used to prevent overfitting, as well as for early stopping, the training process before it reached the maximum number of iterations if no further improvement in the network performance was achieved. During the training process, the number of hidden neurons varied from 8 to 18, with a step size of two, and for each number of hidden neurons, the training was repeated three times with the new initial values of the network parameters. This indeed means that each ANN model was trained 54 times, and the network with the minimum cross-validation error was selected as the best one. Finally, the prediction accuracy of the best network was tested using the validation dataset.
4. Results and Analysis
4.1. DBSCAN for Outlier Detection
As mentioned earlier, the data filtering method is controlled by two parameters: ε and minpts. It should be noted that, the higher the value of ε, the lesser is the detected outliers, while higher minpts values resulted in more outliers. The outliers that are detected with lower minpts or higher ε will also be treated as outliers when the value of the minpts is increased or the value of the ε is reduced. We have used the Euclidean distance measure for the present investigation and experimented with different values of ε (ranging from 0.011 to 0.020) and minpts (ranging from 5 to 100) to obtain different sets of outliers. Table 1 shows a combination of ε and minpts values and the number of detected outliers that were taken into consideration for further evaluation using ANN. These values were considered to work with a varying number of outliers. DATA1, DATA2, DATA3, DATA4 and DATA5 represent the filtered datasets that were generated by five combinations of ε and minpts values.

Table 1.
ε, minpts and the number of detected outliers.
The values of the parameters were chosen in a way so that a wide variation of outliers could be detected, ranging from a few to a large number of outliers, and their impacts on the predictions could be analyzed. However, extensive experimentation is needed to find out a correlation between these parameter values and their corresponding predictive accuracy obtained through ANN.
4.2. ANN Modeling Results
Five datasets, which were formed by removing different numbers of outliers, as shown in Table 1, were used to develop five ANN models to assess the impact of automated data filtering based on DBSCAN on the prediction accuracy of the ANNs. Table 2 shows the prediction errors of the output parameters for five filtered datasets in comparison with the baseline model, for which a manually filtered dataset had been used to develop the ANN model. Considering both the mean and maximum errors, it can be seen that the ANN models developed using DATA2, DATA4 and DATA5 showed accurate predictions, which were comparable with the baseline model.
Table 2.
The prediction errors of the artificial neural networks (ANNs) developed using five datasets obtained from the Density-Based Spatial Clustering of Applications with Noise (DBSCAN) filtering approach in comparison with the baseline ANN developed by the dataset filtered manually. MRE: mean relative error. TOT, COT, COP, CCIT and CCIP represent turbine outlet temperature, compressor outlet temperature, compressor outlet pressure, combustion chamber inlet temperature and combustion chamber inlet pressure, respectively.
The comparison between the prediction accuracy of the three best ANN models developed by automatically filtered datasets—namely, DATA2, DATA4 and DATA5—and the baseline ANN developed by a manually filtered dataset for all output parameters is demonstrated in Figure 7. Figure 7 shows the mean relative error (MRE) together with the maximum error (i.e., worst case) for each output parameter of the ANN models. For each ANN model, the solid-filled columns represent the MRE value, and columns filled with downward diagonal patterns indicate the maximum errors. Comparing to the baseline ANN, we can see from the figure that three ANNs not only predict the performance parameters of the engine with almost the same accuracy but, also, have the potential for further improvement of the errors. Of these three ANNs, the ANN developed based on DATA4, which corresponds to the filtered dataset with 468 detected outliers, has provided the highest accuracy with a minimum average error for all outputs (i.e., 0.22 compared to 0.36 for the baseline model). Except for the turbine outlet temperature and combustion chamber inlet temperature, for which the maximum errors are slightly higher than those of other ANNs are but, still, markedly below 1%, the maximum errors of the other four parameters are the lowest, compared to other ANNs and the baseline model.
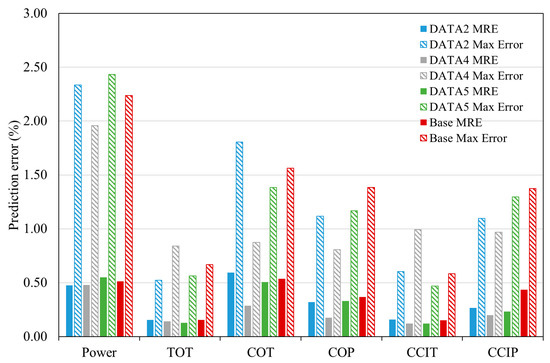
Figure 7.
Comparison between the prediction accuracy of the three best ANN models developed by automatically fileted datasets and the baseline ANN developed by a manually filtered dataset. MRE: mean relative error. TOT, COT, COP, CCIT and CCIP represent turbine outlet temperature, compressor outlet temperature, compressor outlet pressure, combustion chamber inlet temperature and combustion chamber inlet pressure, respectively.
For a better illustration of the positive impact of the automated data-filtering method on the prediction accuracy of the ANN, the distribution of the prediction errors of all outputs for the best ANN (i.e., the ANN developed based on DATA4) and the baseline ANN are compared in Table 3. It can be observed that, apart from the turbine outlet temperature and combustion chamber inlet temperature, for which the accuracy of the two ANNs are almost in the same level, the prediction errors for power output, compressor outlet temperature, compressor outlet pressure and combustion chamber inlet pressure have significantly improved with the use of the auto-filtered dataset for the development of the ANN. For most samples, the prediction error is less than 0.5%.
Table 3.
Distribution of the prediction error for all outputs of the best ANN model and the baseline model.
For visualization of the prediction accuracy, Figure 8 and Figure 9 show the comparison between the measured and predicted values for two engine parameters—namely, power output and combustion chamber inlet temperature, respectively. The error values are represented by dotted lines on the secondary y-axis. These figures demonstrate that the ANN model constructed by the proposed automated filtering method can predict the engine parameters with a very high accuracy, perfectly following variations resulted by changes in the operational conditions. The prediction error for the power output for most samples is below 1%, and the maximum error (i.e., worst case) does not exceed 2%, which is higher for a few samples in the baseline model (refer to Table 3).
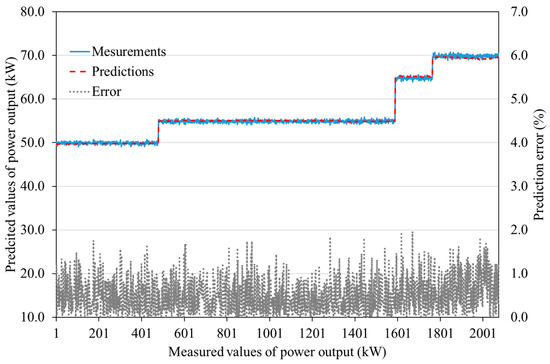
Figure 8.
Power output predictions of the ANN model compared to the measured values.
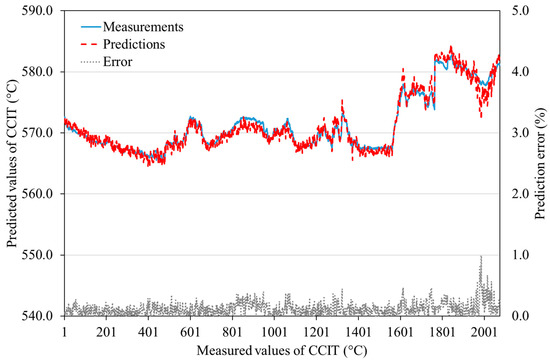
Figure 9.
Combustion chamber inlet temperature predictions of the ANN model compared to the measured values.
5. Conclusions
Handling the ever-growing volume of operational data from distributed generation units and other appliances requires a reliable and fast data-filtering method combined with fast data processing and analysis. Therefore, the objective of this work was to develop and evaluate a machine-learning-based method for the automated filtering of data to detect outliers and provide high-quality datasets for further analysis and data-driven modeling. This was achieved through an interdisciplinary attempt integrating the knowledge from the fields of energy and data science. A density-based clustering algorithm, DBSCAN, was used to identify the outliers in the real-life dataset obtained from an MGT test rig in Norway. To verify the suitability of the proposed method, the filtered datasets were then used to train and test the ANN models. The prediction errors of these ANN models were compared with prediction errors of the baseline ANN model, which had previously been developed by the research group based on the dataset that had been filtered through a manual demanding process. The results showed that the proposed automated method not only can effectively filter the data from outliers but, also, has the potential to enhance the quality of data for data-driven modeling, providing better predictions.
To sum up, the data-filtering method presented in this paper shows that the previously successfully demonstrated ANN models for plant monitoring can be integrated with an automatic and reliable data-filtering method, which enables leapfrogging in the field of condition monitoring for real-time applications. The results show the effectiveness of the automated filtering-based data-driven model and confirm that ANN with an auto-filtering approach can model real-life scenarios in a better way, yielding an improved performance. The proposed algorithm could be extended to other DG conversion technologies as well. Real-life implementations of condition-based maintenance utilizing the machine-learning and AI-based methods presented in this paper will enable speeding up the ongoing energy transition towards clean energy.
Author Contributions
All authors have contributed equally in the work. All authors have read and agreed to the published version of the manuscript.
Funding
This project has received funding from the Directorate for Internationalization and Quality Development in Higher Education (Diku) in Norway. This research is part of an Utforsk project (UTF-2017-two-year/10081) called Sustainable Energy and Environment Solutions: Technology and Policy.
Conflicts of Interest
The authors declare no conflicts of interest.
References
- Perera, A.T.D.; Nik, V.M.; Mauree, D.; Scartezzini, J.L. Electrical hubs: An effective way to integrate non-dispatchable renewable energy sources with minimum impact to the grid. Appl. Energy 2017, 190, 232–248. [Google Scholar] [CrossRef]
- Rahman, M.; Zaccaria, V.; Zhao, X.; Kyprianidis, K. Diagnostics-Oriented Modelling of Micro Gas Turbines for Fleet Monitoring and Maintenance Optimization. Processes 2018, 6, 216. [Google Scholar] [CrossRef]
- Tahan, M.; Tsoutsanis, E.; Muhammad, M.; Karim, Z.A. Performance-based health monitoring, diagnostics and prognostics for condition-based maintenance of gas turbines: A review. Appl. Energy 2017, 198, 122–144. [Google Scholar] [CrossRef]
- Powering the Digital Transformation of Electricity. GE Power. 2016. Available online: https://www.ge.com/digital/sites/default/files/download_assets/Power%20Digital%20Solutions%20Product%20Catalog.pdf (accessed on 1 June 2020).
- Ingimundarson, A.; Stefanopoulou, A.G.; McKay, D.A. Model-based detection of hydrogen leaks in a fuel cell stack. IEEE Trans. Control Syst. Technol. 2008, 16, 1004–1012. [Google Scholar] [CrossRef]
- Mahmood, M.; Martini, A.; Traverso, A.; Bianchi, E. Model Based Diagnostics of AE-T100 Micro Gas Turbine. in ASME Turbo Expo 2016: Turbomachinery Technical Conference and Exposition. Am. Soc. Mech. Eng. 2016, 49828, V006T05A021. [Google Scholar]
- Diez-Olivan, A.; Pagan, J.A.; Khoa, N.L.D.; Sanz, R.; Sierra, B. Kernel-based support vector machines for automated health status assessment in monitoring sensor data. Int. J. Adv. Manuf. Tech. 2018, 95, 327–340. [Google Scholar] [CrossRef]
- Hanachi, H.; Liu, J.; Mechefske, C. Multi-mode diagnosis of a gas turbine engine using an adaptive neuro-fuzzy system. Chin. J. Aeronaut. 2018, 31, 1–9. [Google Scholar] [CrossRef]
- Yoon, J.E.; Lee, J.J.; Kim, T.S.; Sohn, J.L. Analysis of performance deterioration of a micro gas turbine and the use of neural network for predicting deteriorated component characteristics. J. Mech. Sci. Tech. 2008, 22, 2516. [Google Scholar] [CrossRef]
- Talaat, M.; Gobran, M.H.; Wasfi, M. A hybrid model of an artificial neural network with thermodynamic model for system diagnosis of electrical power plant gas turbine. Eng. Appl. Artif. Intell. 2018, 68, 222–235. [Google Scholar] [CrossRef]
- Zabihi-Hesari, A.; Ansari-Rad, S.; Shirazi, F.A.; Ayati, M. Fault detection and diagnosis of a 12-cylinder trainset diesel engine based on vibration signature analysis and neural network. Proc. Inst. Mech. Eng. Part C J. Mech. Eng. Sci. 2019, 233, 1910–1923. [Google Scholar] [CrossRef]
- Fast, M.; Assadi, M.; De, S. Development and multi-utility of an ANN model for an industrial gas turbine. Appl. Energy 2009, 86, 9–17. [Google Scholar] [CrossRef]
- Palme, T.; Breuhaus, P.; Assadi, M.; Klein, A.; Kim, M. New Alstom monitoring tools leveraging artificial neural network technologies. in ASME 2011 Turbo Expo: Turbine Technical Conference and Exposition. Am. Soc. Mech. Eng. 2011, 54631, 281–292. [Google Scholar]
- Palmé, T.; Breuhaus, P.; Assadi, M.; Klein, A.; Kim, M. Early warning of gas turbine failure by nonlinear feature extraction using an auto-associative neural network approach. in ASME 2011 Turbo Expo: Turbine Technical Conference and Exposition. Am. Soc. Mech. Eng. 2011, 54631, 293–304. [Google Scholar]
- Smrekar, J.; Pandit, D.; Fast, M.; Assadi, M.; De, S. Prediction of power output of a coal-fired power plant by artificial neural network. Neural Comput. Appl. 2010, 19, 725–740. [Google Scholar] [CrossRef]
- Nikpey, H.; Assadi, M.; Breuhaus, P. Development of an optimized artificial neural network model for combined heat and power micro gas turbines. Appl. Energy 2013, 108, 137–148. [Google Scholar] [CrossRef]
- Nikpey, H.; Assadi, M.; Breuhaus, P.; Mørkved, P.T. Experimental evaluation and ANN modeling of a recuperative micro gas turbine burning mixtures of natural gas and biogas. Appl. Energy 2014, 117, 30–41. [Google Scholar] [CrossRef]
- Milos Milojevic, F.N. Digital Industrial Revolution with Predictive Maintenance; CXP Group: Nanterre, Île-de-France, 2018. [Google Scholar]
- Khamis, A.; Ismail, Z.; Haron, K.; Tarmizi Mohammed, A. The effects of outliers data on neural network performance. J. Appl. Sci. 2005, 5, 1394–1398. [Google Scholar]
- Das, N.G. Statistical Methods; McGraw Hill Companies: New Delhi, India, 2017. [Google Scholar]
- Han, J.; Pei, J.; Kamber, M. Data mining: Concepts and Techniques; Elsevier: Amsterdam, The Netherlands, 2011. [Google Scholar]
- Liu, F.T.; Ting, K.M.; Zhou, Z.-H. Isolation-based anomaly detection. ACM Trans. Knowl. Discov. Data (TKDD) 2012, 6, 1–39. [Google Scholar] [CrossRef]
- Almeida, J.A.S.; Barbosa, L.M.S.; Pais, A.A.C.C.; Formosinho, S.J. Improving hierarchical cluster analysis: A new method with outlier detection and automatic clustering. Chemom. Intell. Lab. Syst. 2007, 87, 208–217. [Google Scholar] [CrossRef]
- Ester, M.; Kriegel, H.P.; Sander, J.; Xu, X. A density-based algorithm for discovering clusters in large spatial databases with noise. In Proceedings of the KDD, Portland, Oregon, 2–4 August 1996. [Google Scholar]
- Çelik, M.; Dadaşer-Çelik, F.; Dokuz, A.Ş. Anomaly detection in temperature data using DBSCAN algorithm. In Proceedings of the 2011 International Symposium on Innovations in Intelligent Systems and Applications, Istanbul, Turkey, 15–18 June 2011. [Google Scholar]
- Thang, T.M.; Kim, J. The anomaly detection by using DBSCAN clustering with multiple parameters. In Proceedings of the 2011 International Conference on Information Science and Applications, Jeju Island, Korea, 26–29 April 2011. [Google Scholar]
- Bruno, J.; Coronas, A. Distributed generation of energy using micro gas turbines: Polygeneration systems and fuel flexibility. In Proceedings of the International Conference on Renewable Energy and Power Quality, ICREPQ’04, Barcelona, Spain, 31 March–2 April 2004. [Google Scholar]
- Onovwiona, H.I.; Ugursal, V.I. Residential cogeneration systems: Review of the current technology. Renew. Sustain. Energy Rev. 2006, 10, 389–431. [Google Scholar] [CrossRef]
- Pilavachi, P.A. Mini- and micro-gas turbines for combined heat and power. Appl. Therm. Eng. 2002, 22, 2003–2014. [Google Scholar] [CrossRef]
- Razbani, O.; Assadi, M. Artificial neural network model of a short stack solid oxide fuel cell based on experimental data. J. Power Sources 2014, 246, 581–586. [Google Scholar] [CrossRef]
- D10293. Technical Description–T100 Microturbine CHP System, Ver 4.0; Turbec AB: Malmo, Sweden, 2000. (In English) [Google Scholar]
- Nikpey, H.; Assadi, M.; Breuhaus, P. Development of an artificial neural network model for combined heat and power micro gas turbines. In Proceedings of the 2012 International Symposium on Innovations in Intelligent Systems and Applications, Trabzon, Turkey, 2–4 July 2012. [Google Scholar]
© 2020 by the authors. Licensee MDPI, Basel, Switzerland. This article is an open access article distributed under the terms and conditions of the Creative Commons Attribution (CC BY) license (http://creativecommons.org/licenses/by/4.0/).