Abstract
Internal stress in basin insulators of gas-insulated metal-enclosed switchgear (GIS) can lead to cracks, which affects the safe operation of these apparatuses. In this research, we proposed a subsurface internal stress measurement method for GIS epoxy composites. This method is based on an ultrasonic longitudinal critically refracted (LCR) wave technique. In this study, some epoxy composite specimens were synthesized with similar materials and manufacturing processes to those of 252 kV GIS basin insulators. An ultrasonic stress measurement system that utilized the LCR wave technique was set-up to investigate the relationship between stress and LCR wave propagation time, as well as to measure the compressive stress of the epoxy specimen within 0–50 MPa. The results show that LCR wave propagation time linearly decreased when stress increased in the subsurface zone and the acoustoelastic coefficient was −4.95. We found the relative errors of stress measurements to be less than 13%.
1. Introduction
Gas-insulated metal-enclosed switchgear (GIS) is widely used in large-scale hydropower projects, as well as urban high-voltage power grids with complex terrain and small areas. This usage is attributed to the comparative advantages of GIS, including compact size, small ground space requirement, less maintenance workload, low environmental impact, good expansibility, and so on. As crucial components of GIS, basin insulators provide electrical insulation, supporting the gas chamber’s conductor and isolation. Moreover, they determine GIS stability and reliability [1].
Internal stress might be induced in basin insulators during their manufacturing, transportation, installation, and operation. The basin insulators are manufactured by thoroughly mixing epoxy resin, alumina filler, and a curing agent in certain proportions, followed by pouring and curing processes. During their manufacturing, internal stress is caused from unevenly stirring raw materials, shrinking chemicals caused by polymerization reaction (i.e., liquid state to the solid state) [2], shrinking thermal while cooling down to room temperature [2], and large particle precipitation. Additionally, internal stress is induced from transportation friction and vibration. Partial compression in the insulators can be caused by uneven bolt fastening force or an inclined conductor during the installation. Mechanical force results from unbalanced installation and switching operation. Vibration results from short-circuit electrodynamic force during operation. Thermal stress results from the thermal gradient in the insulators due to heating central conductors and different thermal expansion coefficients between the epoxy composite and inserting metal during the operation. The insulators that partition gas chambers are required to do the following: withstand the pressure difference between adjacent gas chambers during normal operation [3]; withstand large pressure differences between the transition chamber and external atmospheric pressure during live GIS maintenance and expansion [3]; withstand extreme unilateral force on insulators during gas charging [4]. It has been reported that the concentration of internal stress can affect the mechanical properties of materials. For example, internal stress might increase fatigue rate or environmental degradation. It can also decrease low-frequency fatigue strength and dimensional stability [5]. Internal stress in basin insulators accumulates due to the external load and until internal stress is greater than mechanical strength, cracks occur [6]. Cracks can lead to the insulator cracking, air leaking, partial discharges, ablation, and flashover.
To check the mechanical strength of the basin insulators, hydraulic tests must be conducted, where failing load values are used as the standard indicator to judge the mechanical strength of the basin insulators. In the hydraulic test, the gradually increasing hydraulic load is applied on one side of the basin insulator. The hydraulic load is recorded at the moment that the basin insulator is damaged [7,8,9]. In order to obtain the stress state of the basin insulator in the hydraulic test, analyze the failure mechanism, and find the stress concentration area, some researchers arranged the stress-strain sensors on the basin insulators to measure the stress and strain at different positions during the hydraulic test. Wu et al. applied right angle bidirectional strain gauges to measure the surface stress of a 252 kV basin insulator [6]. Shi et al. measured the surface stress of a 220 kV basin insulator, by using the foil strain gauges [10]. Fei et al. measured the surface stress of a 126 kV three-phase-in-one tank basin insulator using strain gauges [11]. However, the mass of the strain gauge and connecting lines had effects on the surface stress distribution for basin insulators. Peng et al. arranged fiber Bragg grating sensors on insulators to measure surface strain during the hydraulic test. They pasted fibers on the basin insulator by using adhesive tape. Although the adhesion degree of fibers was different, there was still an influence on the measurements [9]. Currently, most investigations regarding stress measurements in basin insulators are limited on the surface, and thus further research on internal stress measurements are required.
Internal stress measurement methods can be classified as destructive and non-destructive methods. The destructive methods separate a sample partially to release the internal stress, which causes damage to the sample. These include the drilling method, ring core method, slotting method, and layer-stripping method. The non-destructive methods are based on the relation between the material’s physical properties and its internal stress [12]. Previous researchers have come up with five main non-destructive methods. First, there is the X-ray and neutron diffraction method, which measures the strain in the material microstructural crystal lattice arrangement to detect internal stress, requiring testing materials within the crystal structure [13]. Next, the magnetic method is based on the effect of the deformation that a material can produce an electromagnetic field and is suitable for ferromagnetic materials [14]. The photo elastic method is based on the principle of light birefringence and can measure stress in transparent materials [15]. The ultrasonic methods are based on the relation between stress and ultrasonic wave velocity. Previous studies have shown that ultrasonic methods can be applied to measure the internal stress of many composite materials [14].
Internal stress measurements based on ultrasonic wave techniques are mainly focused on metal materials, such as the fastening force of bolts [16,17], residual stress of welded joints [12], and so on. However, there are only a few investigations on non-metallic materials and even less related to epoxy composite materials. Hao et al. used the through-transmission technique, applying ultrasonic longitudinal waves perpendicular of stress to measure the internal compressive stress in GIS epoxy composites within 0–70 MPa. Although the results showed that the measurement absolute errors were less than 12.4 MPa within 0–70 MPa and the relative errors were less than 19.9% within 40–70 MPa, the sensitivity still needed to be improved [18]. Santos et al. investigated the relationship between tensile stress and propagation time of ultrasonic longitudinal critically refracted (LCR) waves, propagating in the subsurface zone in the carbon fibers composites with epoxy matrix. They found that the ultrasonic propagation time linearly increased with internal stress, specifically when the fiber direction was 0°, 45°, and 90°. Yet the propagation time was most sensitive to stress in the direction of 0° [14].
Ultrasonic LCR waves have a great sensitivity to tangential internal stress in the subsurface zone of materials. At present, internal stress measurements using LCR waves are mainly applied in residual stress measurements for metal welding [15] and internal stress induced from mechanical force [13]. LCR waves used to investigate uniaxial stress has been a topic of previous study. Jia et al. investigated the relationships between LCR wave velocities and tensile stresses in some polymers—i.e., polycarbonate, polystyrene, polyamide, and polybuthylene terephthalate—and found that LCR wave velocities linearly decreased with tensile stresses. Based on these relationships, the acoustoelastic coefficients were calculated [19]. Moreover, Jin et al. found that LCR wave propagation time linearly increased with tensile internal stress in a pre-stretched aluminum alloy plate when LCR waves propagated in the stress direction at angles of 0°, 30°, 60°, and 90°. Further, they found that LCR wave propagation time was most sensitive to stress at 0°direction [5].
In this paper, an ultrasonic subsurface stress measurement system using ultrasonic LCR waves was set-up and a subsurface stress measurement method was proposed for GIS epoxy specimens. In addition, the relationship between subsurface stress and ultrasonic LCR wave propagation time was investigated.
2. Detection Principle
2.1. Ultrasonic LCR Wave Generation
When the ultrasonic longitudinal wave L left medium 1 and entered medium 2, the refracted longitudinal waves L and transverse waves S propagated in medium 2. The relationship of incident longitudinal wave velocity V1, the refracted longitudinal wave velocity V2, the longitudinal wave incident angle θ1, and the longitudinal wave refracted angle θ2 conformed to Snell’s law [20], shown in Equation (1):
When the refracted angle of the refracted longitudinal waves was 90°, the refracted longitudinal waves were termed LCR waves. The incident angle was the first critical angle (θCR), as shown in Figure 1.
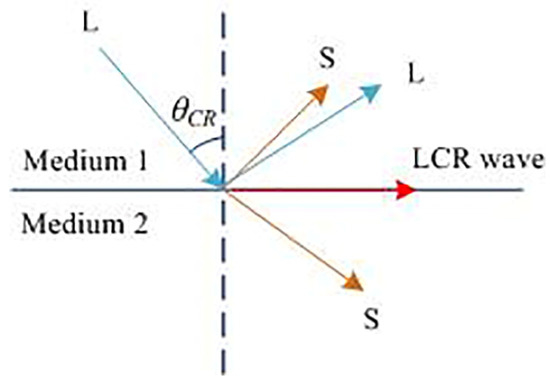
Figure 1.
The mechanism of ultrasonic longitudinal critically refracted (LCR) wave.
2.2. Subsurface Stress Measurement Principle
The schematic diagram of ultrasonic LCR wave propagation is depicted in Figure 2. The longitudinal waves emitted by a transmitting probe, with an incident angle of the first critical angle (θCR), were refracted and propagated as LCR waves in the subsurface zone of the material between two probes. The LCR waves were received by a receiving probe, located at a fixed distance L away from the transmitting probe, and these two probes were the same.
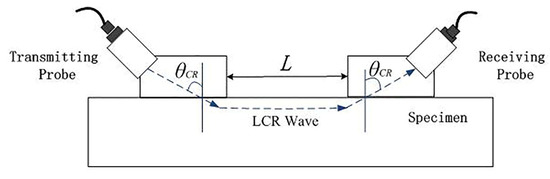
Figure 2.
The schematic diagram of transmitting and receiving an LCR wave.
The principle of ultrasonic internal stress measurement is based on the acoustoelastic effect: the internal stress variations affect ultrasonic wave velocity. The uniaxial internal stress measurements using the LCR wave technique are based on the principle that, under the situation of fixed probe distance, propagation time for LCR waves varies linearly with internal stress in a subsurface zone. By measuring the propagation time of LCR waves, we can calculate the internal stress beneath the surface within a limited depth.
When the LCR method is applied, the relationship between the propagation time T and the internal stress σ, is shown in Equation (2) [14]. Dos Santos et al. used Equation (2) to investigate the relationship between uniaxial tensile internal stress and LCR propagation time in carbon fiber composites with epoxy matrix [14]:
where dσ is the stress variation, which represents the difference between the internal stress σ under the loading stress and initial zero stress σ0 (MPa); T0 is the LCR wave propagation time under initial zero stress, with the unit of μs; dT is the propagation time variation, which represents the difference between the propagation time T under the loading stress and the propagation time T0 under initial zero stress, with the unit of μs; E is the elastic modulus, with the unit of GPa; K is the acoustoelastic coefficient, which represents the sensitivity of the ultrasonic propagation time to stress in the acoustoelastic effect. The acoustoelastic coefficient changed with the material elastic constant, ultrasonic waveform, and ultrasonic frequency.
The ratio of the variation in ultrasonic propagation time dT to the variation in stress dσ is indicated as k0. Combined with Equation (2), k0 can be derived as:
From Equation (3), the acoustoelastic coefficient K can be derived as:
In order to obtain the calculated internal stress σc, the internal stress variation dσ = σ − σ0 and the propagation time variation dT = T − T0 are substituted into the Equation (2). The calculation equation of σc is shown as:
According to Equation (5), if K, E, σ0, and T0 are known, the internal stress σc in the LCR wave propagation region can be obtained by measuring the ultrasonic propagation time T under unknown stress. Under uniaxial stress, the loading stress can be equivalent to the internal stress.
3. Detection Principle
3.1. Specimen
In this study, the epoxy composite specimens were manufactured by a company and their materials and manufacture process were similar to those of the 252 kV GIS single-phase basin insulators. Firstly, the bisphenol A epoxy resin and alumina filler were mixed in a ratio of 1:4. Next, the mixture was subjected to vacuum degassing. Then the anhydride-type curing agent was added to the mixture and thoroughly mixed for 70–80 min to ensure even material distribution. Furthermore, the mixture was again subjected to vacuum degassing. Finally, the liquid mixture was poured into a preheated mold at a rate of 1.5–2 kg/min, followed by two-stage curing. In the first stage of curing, the temperature was raised to 105 °C within two hours and kept constant for 15 h. In the second stage of curing, the temperature was raised to 155 °C and kept constant for 15 h [19].
The specimens have a shape of 350 mm × 35 mm × 18 mm, with 2.23 g/cm3 density and 12.25 GPa elastic modulus [19]. The internal stress in cuboid specimens of GIS basin insulators was verified to be uniform [19]. In this paper, two specimens, A and B, were synthesized with the same materials and manufacture. Specimen A was used to investigate the relationship between stress and LCR wave propagation time. Specimen B was used to measure stress.
3.2. Ultrasonic Measurement System Using LCR Wave
The subsurface stress measurement system for GIS epoxy specimens using the ultrasonic LCR wave included: an ultrasonic pulser/receiver, two ultrasonic probes, a probe connection plate, an oscilloscope, a compression test machine, epoxy specimens, a computer, and connecting lines, as shown in Figure 3.
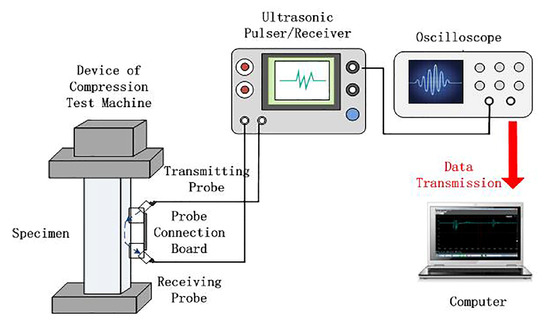
Figure 3.
Subsurface stress measurement system for the gas-insulated metal-enclosed switchgear (GIS) epoxy specimen using the ultrasonic LCR wave.
The ultrasonic pulser/receiver is a CTS-23 analog ultrasonic detector. The frequency bandwidth is 0.5–3 MHz; the rise time of the transmitted pulse is about 30 ns; the scanning mode is A-type. The pitch and catch mode was selected to connect two probes. In order to obtain the original ultrasonic waveforms without rectification, the original signal was taken directly from the point before rectification in the electrical circuit inside of the CTS-23 [19].
The ultrasonic LCR wave probes were two 2.5 MHz longitudinal probes, with adjustable incident angles in the range of 0–90°and an acoustic axial deviation of ≤2°. The dimension of piezoelectric wafer was 10 mm × 16 mm. The transmitting probe and the receiving probe were the same, with a dimension of 5 cm × 4 cm × 3 cm. From conducting the experiments, we found that the LCR wave propagation time did not significantly vary with stress if the two probes were too close. If proves were located far apart, the LCR waves had small amplitudes due to excessive attenuation over a long distance. After adjusting the distance between the two probes, the 3 cm distance provided good experimental results. In order to ensure that the ultrasonic path was fixed during the test, two probes were fixed on the same wooden board (with a length of 9 cm and a width of 3 cm) by using the high-adhesive double-sided tapes. During the tests, two probes and the probe connection board were fixed with tape on one side of the epoxy specimen.
The oscilloscope used to receive and observe the original signal from the ultrasonic pulser/receiver, was a DPO4104, with 500 MS/s test sampling rate, 2 ns sampling period, and a 20 MHz bandwidth.
Unidirectional compression tests were conducted with a microcomputer-controlled universal testing machine (model CMT5105), with an accuracy level of 1 and a capacity of 100 kN. Compression loading was performed on the specimen, at a displacement velocity of 0.5 mm/min with an equal-stress gradient of 5 MPa in the range of 0–50 MPa (stress is the force per unit area and the force cross-section is 35 mm × 18 mm). The LCR wave propagation time was recorded at each 5 MPa stress step within 0–50 MP, 11 times in total. The specimen bowed under stress greater than 50 MPa, so the loading stress was applied up to 50 MPa, corresponding to a pressure of 27 kN, within the capacity of the universal testing machine.
3.3. Numerical Simulation
The numerical simulation was carried out with the finite element software COMSOL, which calculated the stress in the specimen under compressive stress within 0–50 MPa. The dimension and material properties, including density and Yong’s modulus, of the three-dimensional epoxy specimen simulation model, were the same as those of the specimens used in the experiments. To guarantee the precision of simulation results, we selected “extra fine” as the predefined mesh element size. The maximum and the minimum mesh element size were 12.3 mm and 0.525 mm, respectively. The stress values and the applied location of the simulated stress load were set the same as the applied stress in the experiments.
4. Results and Analysis
4.1. First Critical Angle
It has been reported that the ultrasonic longitudinal waves velocity in this epoxy material is 3090 m/s [18] and the ultrasonic longitudinal wave velocity of plexiglass in LCR probes is 2730 m/s [21]. Based on Equation (1), the incident angle was calculated to be 62°. However, the ultrasonic wave velocities of GIS epoxy materials were slightly different due to the different ratios of raw materials and manufacturing processes. It has been found that the amplitudes of the LCR waves achieved maximum when the incident angle is the first critical angle [22]. In the test, the incident angle was first adjusted to 62° and then the incident angle of the two probes were adjusted at the same time, and the amplitudes of the waves were largest in the case of the 63°incident angle. Therefore, it can be known that the first critical angle was 63°for GIS composite material. This 63°first critical angle (incident angle), used through the whole test, was substituted into the Equation (1) and the LCR wave velocity in the epoxy specimens in this paper is calculated to be 3064 m/s. Compared with the longitudinal wave velocity 3090 m/s, the velocity difference was 26 m/s, accounting for 0.85% of 3064 m/s.
4.2. Ultrasonic LCR Detection Waveform
The voltage values u of the LCR electrical waveforms, from the ultrasonic pulser/receiver, for the specimen A under the stress of 0, 20, 30, and 50 MPa, are demonstrated in Figure 4. During the test, the temperature was 15 °C. T was the ultrasonic propagation time in the epoxy specimen, which was the time interval between the peak time of the transmitting wave (Tt) and the peak time of the receiving wave (Tr). From Figure 4, it can be observed that the propagation time T of LCR waves parallel to the stress direction decreased by 0.852 μs in the range of 0 to 50 MPa. The ultrasonic wave amplitudes become smaller with the stress increasing, because the ultrasonic attenuation of the material increased with the increasing stress.
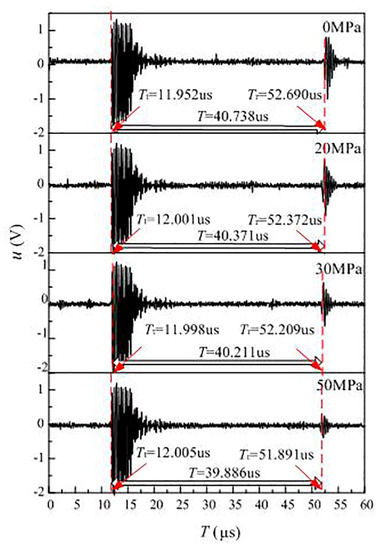
Figure 4.
LCR waveforms of the specimen A under different stresses.
4.3. Acoustoelastic Coefficient of Ultrasonic LCR Wave
In this paper, the relationship between ultrasonic propagation time T of the specimens and the stress σ was obtained based on the subsurface stress measurement system using the ultrasonic LCR waves, shown in Figure 5. The red line in Figure 5 is the linear fitting line of the relationship between the ultrasonic propagation time T and the stress σ by using the least square method.
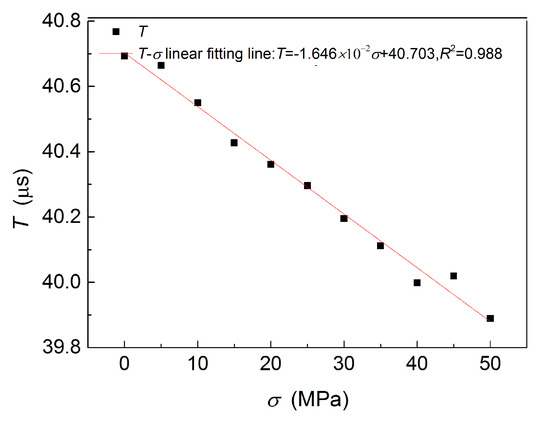
Figure 5.
Propagation time T of the specimen A under 0–50 MPa stress.
Figure 5 shows the linear correlation coefficient R2 of the linear fitting line of T-σ relationship was 0.988, indicating a good linear relationship. The slope of the T-σ linear fitting line was −1.646 × 10⁻² μs/MPa, which was k0 in Equation (3). Based on the Equation (4), the acoustoelastic coefficient was calculated to be −4.95, and its absolute value was smaller than the absolute value of acoustoelastic coefficient (−12.67) of tensile stress in the 0°fiber direction in the carbon fibers composites with epoxy matrix [14].
From Figure 5, it can be observed that, in the case of 3 cm distance between two probes, the ultrasonic propagation time decreased by 0.852 μs within 0–50 MPa, which was about 2.09% of the propagation time 40.738 μs at zero stress. Previous research showed that the ultrasonic longitudinal waves perpendicular to the stress, with the same 2.5 MHz central frequency, were applied to measure the stress in the GIS epoxy specimen. The results show that, in the case of 4.5 cm ultrasonic propagation distance, the ultrasonic longitudinal wave propagation time drops with a span of 0.025 μs, which was about 0.16% of the ultrasonic propagation time 15.708 μs at zero stress [19]. Therefore, the ultrasonic longitudinal waves propagating parallel to stress in GIS epoxy composites are more sensitive to stress than the waves perpendicular to stress. This conclusion was consistent with the case of steel rail [22].
4.4. Simulation Stress
The simulation result in the case of 30 MPa compressive stress is presented in Figure 6. From Figure 6, it can be seen that the volume stress (von Mises stress) was homogeneous in the specimen under 30 MPa compressive stress. Therefore, the simulated stress in the area, where the ultrasonic method measured, was 30 MPa, which was equal to the 30 MPa applied stress. In the range of 0–50 MPa, the simulation results demonstrated the uniformity of the internal stress. Therefore, the simulated stresses for the ultrasonic method were equal to the applied stress. Due to the uniformity of the stress, we concluded that the actual stress in the area, where the ultrasonic method measured, was equal to the applied stress.
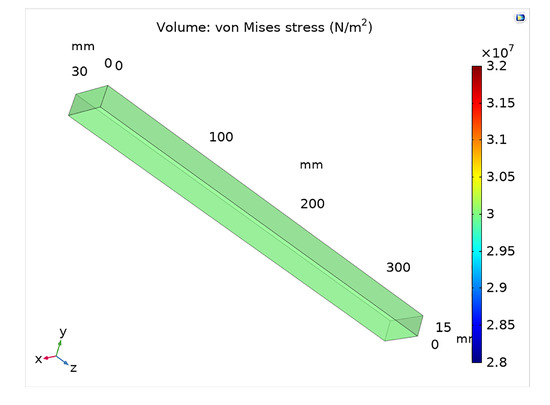
Figure 6.
The simulation result of volume stress in the specimen during the compressive stress state (30 MPa).
4.5. Subsurface Stress Measurements
In this research, specimen B was used for a subsurface internal stress measurement. In order to calculate the internal stress σc, the acoustoelastic coefficient (−4.95) mentioned above, the ultrasonic propagation time T0, and T of the specimen B at initial zero stress, different stresses were respectively substituted into Equation (5). The measurement accuracy was obtained by comparing the calculated internal stress σc with the actual internal stress σa, the value of which was equal to the applied mechanical compressive stress and the simulation stress, due to the uniformity of stress distribution. Three times measurements for σc were made and the average values were calculated. After a comparison between the average value of σc and σa, the absolute error Ea and the relative error Er can be calculated, as shown in Table 1.

Table 1.
The actual internal stress σa, calculated internal stress σc, absolute error Ea, and relative error Er of specimen B.
It can be observed from Table 1 that the maximum absolute error Ea of the subsurface stress of specimen B was 1.4 MPa when the loading stress was 40 MPa. The absolute value of maximum relative error Er was 13% when the loading stress was 10 MPa. The absolute errors of other relative errors were less than 13%, which can satisfy engineering requirements. The relative errors were relatively larger in the stress states of 0–20 MPa, with the value of 6%–13% and became smaller in the stress states of 20–50 MPa, with the value of 0.9%–3.6%.
In this research, the absolute value of the maximum relative error was 13% and the maximum absolute error was 1.4 MPa, which could be considered acceptable after comparing with measurement errors of other ultrasonic stress investigations. Haibo Liu et al. employed ultrasonic LCR waves to measure tensile stress in alumina alloy, finding that the maximum deviation of stress measured relative to the stress simulated was about 20 MPa within 100 MPa tensile stress [23]. Kun Zhou et al. applied the ultrasonic longitudinal and transverse waves to measure the axial stress in bolts, and they found that the relative error was less than 25% in the range of 330 MPa [17].
The measurement errors were mainly induced from the accuracy of the machines that performed the measurements, such as the sampling period of the oscilloscope and applied force errors from the compression test machine.
5. Conclusions
In this paper, we proposed a new method using LCR waves for measuring subsurface stress in GIS epoxy composite. The subsurface stress measurement system for GIS epoxy specimens using the ultrasonic LCR waves was set-up to investigate the relationship between LCR wave propagation time and subsurface stress, as well as to measure the subsurface stress. The main conclusions are as follows:
- (1)
- The first critical angle of 252 kV GIS epoxy composite was found to be 63°.
- (2)
- In GIS epoxy composite, the LCR wave propagation time in stress direction was found to linearly decrease when compressive stress increased. Moreover, the linear correlation coefficient was 0.988, indicating a highly linear relationship. As the variation of LCR wave propagation time was relatively large, i.e., 0.852 μs, LCR wave propagating in the stress direction was sensitive to stress in the GIS epoxy composite. Additionally, the acoustoelastic coefficient was calculated to be −4.95.
- (3)
- In the GIS epoxy composite, the ultrasonic longitudinal waves propagating parallel to the stress in GIS epoxy composites were more sensitive to stress than the longitudinal waves propagating perpendicular to the stress.
- (4)
- The subsurface stress was calculated based on the obtained acoustoelastic coefficient. The absolute value of the maximum relative error of subsurface stress measurements was 13%, which shows that the measurement accuracy was relatively high. The linear acoustoelastic effect can be used to quantitatively estimate the subsurface stress in GIS epoxy composite.
This research shows that this LCR wave technique for subsurface stress measurement in GIS epoxy composites is feasible, which provides the research base for the subsurface stress measurements in basin insulators. This LCR wave technique can be used to measure stress in basin insulators, especially when the basin insulators are subjected to external mechanical stresses, such as withstanding water pressure in the hydraulic test or external atmospheric pressure in the situation of live maintenance and live expansion of a GIS. Moreover, this LCR wave technique can be applied in other epoxy composite components, such as the three-post support insulator.
Author Contributions
Y.H. conceived and designed the experiments, and also provided the guidance in writing the paper; Z.Z. designed and performed the experiments, and also wrote the paper; F.T., Y.Z., and W.H. helped in the experiments; L.Y. guided the writing; L.L. provided guidance on the tests. All authors have read and agreed to the published version of the manuscript.
Funding
This research was funded by Smart Grid Joint Fund Key Project between National Natural Science Foundation of China and State Grid Corporation, grant number U1766220.
Conflicts of Interest
The authors declared that there is no conflict of interest.
References
- Qi, B.; Gao, C.; Li, C.; Xiong, J. The influence of surface charge accumulation on flashover voltage of GIS/GIL basin insulator under various voltage stresses. Int. J. Electr. Power Energy Syst. 2019, 105, 514–520. [Google Scholar] [CrossRef]
- Hein, W.R.; Mahrholz, T.; Wierach, P.; Monner, H.P. Impact of nanoparticles on the process-induced distortions of carbon fiber reinforced plastics: An experimental and simulative approach. J. Appl. Polym. Sci. 2019, 47031. [Google Scholar] [CrossRef]
- Basin Insulator for High-Voltage Alterating Current Gas-Insulated Mental-Enclosed Switchgear; NB/T 42105-2016; National Energy Administration: Beijing, China, 2016.
- Chen, Y.; Cui, Y.; Wang, N.H.; Liu, Y.; Wu, L.Y.; Cheng, P. Study of improving mechanical strength for 1100 kV spacer insulator. High Volt. Appar. 2015, 51, 52–62. [Google Scholar] [CrossRef]
- Jin, C.; Lu, C.; Shi, Y.W.; Liang, J.; Wang, X. Study on relationship between critically refracted longitudinal wave and internal stress in pre-stretched aluminium alloy plate. Mater. Res. Innov. 2015, 19, S1–S14. [Google Scholar] [CrossRef]
- Wu, L.Y.; Wang, C.Y.; Chen, Y.; Cui, B.Y. Test and analysis on mechanical properties of 252 kV basin-type insulator. Insul. Surge Arresters 2017, 132–137. [Google Scholar] [CrossRef]
- Composite Hollow Insulators—Pressurized and Unpressurized Insulators for Use in Electrical Equipment with Rated Voltage Greater than 1000 V—Definitions, Test Methods, Acceptance Criteria and Design Recommendations; IEC 61462; International Electrotechnical Commission: Geneva, Switzerland, 2007.
- Specification for Gas-Insulated Metal-Enclosed Switchgear; DL/T 617-2010; National Energy Administration: Beijing, China, 2010.
- Guo, Z.H.; Wang, H.R.; Li, H.; Wang, C.; Peng, Z.R. Calculation and experimental study on strain and stress distribution of UHV GIS spacer during hydrostatic test. High Volt. Eng. 2018, 44, 993–1002. [Google Scholar] [CrossRef]
- Shi, Y.Z.; Zhang, X.; Li, X.Y.; Huang, R.H.; Wei, J.R.; Yao, S.J. Judgement method of basin insulator rupture process based on the analysis of stress and strain. Insul. Surge Arresters. 2015, 19–22. [Google Scholar] [CrossRef]
- Fei, L.F.; Gong, X.Y.; Chen, W. Factors influencing the water pressure of insulating spacer in GIS/GCB. High Volt. Appar. 2014, 50, 125–130. [Google Scholar] [CrossRef]
- Zhu, Q.M.; Chen, J.; Gou, G.Q.; Li, H.P.; Gao, W. Residual stress measurement and calibration for A7N01 aluminum alloy welded joints by using longitudinal critically refracted (LCR) wave transmission method. J. Mater. Eng. Perfor. 2016, 25, 4181–4189. [Google Scholar] [CrossRef]
- He, J.B.; Li, Z.H.; Teng, J.; Li, M.; Wang, Y. Absolute stress field measurement in structural steel members using the Lcr wave method. Measurement 2018, 122, 679–687. [Google Scholar] [CrossRef]
- dos Santos, A.A.; Ambiel, L.B.; Garcia, R.H.; Rodovalho, T.G. Stress analysis in carbon/epoxy composites using Lcr waves. J. Compos. Mater. 2013, 48, 3425–3434. [Google Scholar] [CrossRef]
- Abbasi, Z.; Ozevin, D. Acoustoelastic coefficients in thick steel plates under normal and shear stresses. Exp. Mech. 2016, 56, 1559–1575. [Google Scholar] [CrossRef]
- Pan, Q.X.; Pan, R.P.; Shao, C.; Chang, M.; Xu, X.Y. Research Review of principles and methods for ultrasonic measurement of axial stress in bolts. Chin. J. Mech. Eng. 2020, 33, 11. [Google Scholar] [CrossRef]
- Zhou, K.; Pan, Q.X.; Shao, C.; Pan, R.P. Reliability evaluation of stress in the direction of thickness based on ultrasonic measurement method. In Proceedings of the IEEE International Conference on Mechatronics and Automation, Changchun, China, 5–8 August 2018; pp. 1481–1485. [Google Scholar] [CrossRef]
- Zou, Z.Y.A.; Hao, Y.P.; Tian, F.Y.; He, W.M.; Yang, L.; Li, L.C. An ultrasonic longitudinal through-transmission method to measure the compressive internal stress in epoxy composite specimens of gas-insulated metal-enclosed switchgear. Energies 2020, 13, 1248. [Google Scholar] [CrossRef]
- Jia, D.W.; Bourse, S.; Chaki, S.; Lacrampe, M.F.; Robin, C.; Demouveau, H. Investigation of stress and temperature effect on the longitudinal ultrasonic waves in polymers. Res. Nondestr. Eval. 2014, 25, 20–29. [Google Scholar] [CrossRef]
- He, L.F. Acoustoelastic Technique; Science Press: Beijing, China, 2002. [Google Scholar]
- Hou, H.S.; Zhao, Q.B.; Fan, Y.Y. Testing of the flaws in inner and outer surfaces of thin wall bearing with transverse wave. Nondestr. Detect. 2008, 30, 304–306. [Google Scholar]
- Egle, D.M.; Bray, D.E. Measurement of acoustoelastic and third-order elastic constants for rail steel. J. Acoust. Soc. Am. 1976, 60, 740–744. [Google Scholar] [CrossRef]
- Liu, H.B.; Li, Y.P.; Li, T.; Zhang, X.; Liu, Y.K.; Liu, K.; Wang, Y.Q. Influence factors analysis and accuracy improvement for stress measurement using ultrasonic longitudinal critically refracted (LCR) wave. Appl. Acoust. 2018, 141, 178–187. [Google Scholar] [CrossRef]
© 2020 by the authors. Licensee MDPI, Basel, Switzerland. This article is an open access article distributed under the terms and conditions of the Creative Commons Attribution (CC BY) license (http://creativecommons.org/licenses/by/4.0/).