Article

Understanding the Multi-Faceted Drivers of Increasing Coal Consumption in Indonesia

by
Robi Kurniawan
1,2,*,
Gregory P. Trencher
1,
Achmed S. Edianto
1,
Imam E. Setiawan
1 and
Kazuyo Matsubae
1
1
Graduate School of Environmental Studies, Tohoku University, Aramaki-aza-Aoba, Aoba-ku, Sendai 980-8579, Japan
2
Ministry of Energy and Mineral Resources of Indonesia, Jl. Pegangsaan Timur No.1, Jakarta 10320, Indonesia
*
Author to whom correspondence should be addressed.
Energies 2020, 13(14), 3660; https://doi.org/10.3390/en13143660
Submission received: 19 June 2020 / Revised: 10 July 2020 / Accepted: 11 July 2020 / Published: 16 July 2020
(This article belongs to the Special Issue Energy Policy and Policy Implications 2020)

Abstract

:
To meet the Paris Agreement’s climate mitigation objectives, there is an urgent global need to reduce coal combustion. Yet coal usage, particularly in the power sector, is rising in many developing countries. Indonesia is a notable example. While government policy is widely considered as the principle driver of Indonesia’s increasing coal consumption, studies have largely overlooked the influence of socioeconomic forces. To understand these effects, we utilize a decomposition analysis to capture the individual effect of five drivers of coal consumption in Indonesia over 1965 to 2017: (1) the energy mix, (2) energy intensity of GDP, (3) population, (4) urbanization, and (5) urban incomes. Results show the energy mix has exerted the largest effect on coal consumption. In addition, by accounting for other socio-economic influences, we found that other less appreciated factors have contributed to rising coal consumption. In order of contribution these were the urban economic effect, the growing relative share of urban population, and the population increase itself in absolute terms. We thus demonstrate that the drivers of growing coal consumption are multi-faced, complex and intertwined. Our findings show that developing nations such as Indonesia share a need to decouple urban population growth and increasing per capita wealth from fossil fuel (and coal) emissions.

1. Introduction

To limit post-industrial warming to either 1.5 or 2 degrees Celsius as stipulated under the Paris Agreement, urgent measures are require to reduce the global fleet of coal-fired power plants (CFPPs) [1,2]. Globally, some 500 GW of CFPPs are currently under planning or construction [3]. If adding this new capacity while allowing existing plants to operate for their full technical lifetimes (typically 40 or more years), the resultant emissions would exhaust the carbon budgets compatible with the Paris Agreement temperature targets [4,5]. Government interventions are therefore required to expedite the early retirement of existing CFPPs and replace new plants currently under planning with cleaner alternatives. Given the amplitude of this governance challenge for countries with currently active CFPP fleets [6,7], much literature has recently appeared on policy strategies to accelerate the reduction of coal power [8,9] and factors that might hamper this transition [10,11,12,13,14].
The lion’s share of new CFPP construction is concentrated in developing Asia, especially China, India, Indonesia and Vietnam [3,4]. This poses a fundamental challenge to the guiding principle of “common but differentiated responsibilities”. As the major source of historical greenhouse gas emissions, industrialized nations bear the first and foremost responsibility to reduce and then eliminate shares of coal power. Meanwhile, it could be argued that developing countries, like their richer peers, have a right to “develop” with fossil fuels [15,16,17]. This is especially so if considering the economic and technical barriers in developing countries that can impede the large-scale deployment of renewables and drive the prioritization of cost effectiveness over carbon intensity when planning energy policy [18]. In this light, fossil fuels like coal offer a tempting solution to various needs such as providing low-cost electricity to tackle poverty and boosting grid accessibility and stability while satisfying the energy requirements of rapidly growing economies [19]. In addition, supplying energy needs from domestic coal reserves also provides other important benefits such as employment creation [20,21], bolstered national energy security [9], reduced account deficit risks and less exposure to foreign currency fluctuation. Coal power, however, is not without negative impacts. As well as hampering climate mitigation by locking-in carbon intensive infrastructure for several decades [18], the operation of existing and newly added CFPPs will exasperate air pollution and associated human health consequences both in local populations and neighboring regions or countries [7,17,22].
Indonesia is one such country grappling with development challenges such as worsening air pollution and a growing energy demand [23]. Although endowed with vast renewable energy potential (especially solar and geothermal) and significant natural gas reserves, coal has increasingly become the principle means of supplying affordable electricity to a rapidly growing economy and population [24,25,26]. Expanding Indonesia’s coal power capacity also mirrors an understandable desire to exploit abundant domestic coal reserves for the sake of energy security and providing employment to mining communities [24]. Holding around 29 GW of capacity, Indonesia’s present fleet of CFPPs produces around 58% of domestic electricity [27,28]. Under current national policy, this is set to increase by around 50%. With 12 GW or so under construction and another 15 GW at varying stages of planning, current objectives are to achieve a total fleet of around 56 GW by the year 2028 [29,30,31]. Indonesia thus own’s the world’s fourth largest pipeline of new CFPP development after China, India and Turkey [3] (although Turkey is not a major coal consuming country today, like Indonesia, it is rapidly increasing the scale of its coal-fired power capacity, with around 33 GW under construction or in active development.).
National government policy is widely problematized as the principle driver of Indonesia’s recent growth in coal power [23,24,31,32]. However, although government policy dictates the nature of the energy mix, socioeconomic change is also a critical variable in explaining the interlinked dynamics behind the growth of energy consumption and coal power [33]. Yet the influence of demographic factors affecting household energy demand is often underemphasized in literature. This tendency is visible not only in studies about coal in Indonesia, but equally in literature on other countries [34,35,36].
The importance of socioeconomic factors for energy consumption in Indonesia can be summarized as follows. First, accounting for 31% (or 382,000 Barrels of Oil Equivalent [BOE]) of the national total, the largest consumer of energy consumption in 2017 was the residential sector [37]. This exceeds the share of the industrial sector, which consumed some 25% (273,000 BOE) during the same year. Second, Indonesia’s growing population is exerting increasing pressure on energy demand. Currently around 267 million in 2018, population is rising at a rate of some 2.5% per year. It is projected to hit 300 million by around 2025 [38]. Third, however, by far the largest factor driving increased energy consumption in the household sector is the rising standard of living and income for urban residents [39]. The percentage of urban dwellers has quadrupled from 8% in 1960 to 32% in 2018. Thus, multiple and interlinked socioeconomic factors are driving Indonesia’s rapidly growing appetite for electricity, which relies on cheap sources like coal. These growing trends pertain to the absolute population, the relative share of urban dwellers and increased opportunities to consume energy when residing in urban areas, and finally, per capita wealth and purchasing power [40].
The objective of this study is thus to investigate the multi-faceted socioeconomic drivers of increasing coal consumption in Indonesia and consider the implications of each, along with policies that might help reduce coal consumption. To this end, we focus on a roughly 50-year period stretching from 1965 to 2017 and perform a decomposition analysis. This breaks down the rising energy consumption trend over this period into five key variables (or “effects”) for which we detect the relative influence of each: (1) coal’s share in the national energy mix, (2) the energy intensity of whole country GDP output, (3) total population, (4) the urban share of total population, and 5) the ratio of whole country GDP to the urban population.
We contribute to the literature in several ways. First, understanding the drivers of coal consumption in the country with the highest growth among the top ten coal consumers in the past decade is an important addition to climate change and energy policy research. Second, our study focuses on a country where the residential sector is the main final consumer of energy. This provides evidence that the drivers of increased coal consumption in some developing contexts are also demographic and related to the process of urbanization. This provides a novel perspective for literature on coal and energy transitions, which has tended to focus on government policy and industrial activity when examining energy mixes. Third, to quantitatively investigate the multiple drivers of increasing coal consumption, we perform a decomposition analysis. We extend the Logarithmic Mean Divisia Index [41], a commonly used tool in this field. While existing studies [42,43] mainly consider three variables when decomposing aggregate energy consumption growth—i.e., activity, structure, and intensity—in our study we incorporate urbanization into the model.
The remainder of this study unfolds as follows: Section 2 delivers a brief overview of growing coal consumption in Indonesia, government policy, and notable environmental and social consequences. Section 3 describes the decomposition analysis approach and the datasets used in this research. Results are summarized in Section 4 while Section 5 discussions key implications. Section 5 then concludes by summarizing key messages and discussing policy recommendations prompted by our findings.

1.1. Overview of Coal Consumption in Indonesia

As indicated in Figure 1, with an average annual growth of 7.5% over the past decade (2008–2017), Indonesia’s increasing appetite for coal is the highest amongst the top ten coal consumers in the world [27]. In the year 2017, domestic annual consumption grew to 57 million tons (MT), nearly doubling from consumption levels in 2008. In terms of primary energy consumption, coal supplies around 30% of total requirements [44]. As presented in Figure 2, the majority of coal combustion (around 80%) is concentrated in the power sector. Meanwhile, coal consumption from steel and cement making is significantly less due to the relatively underdeveloped state of these industries.
Figure 3 depicts the dramatic expansion of electricity generation capacity over the past three decades (1985–2017) in response to Indonesia’s growing population and economy. Particularly striking is the rapidly increasing share of coal.
Most prominent since 2002, coal consumption from power generation has grown almost 10% annually. This rising trend is mostly due to newly commissioned coal power generation capacity, particularly since 2006. As reported by the International Energy Agency [45], coal produced only 5.109 kWh or 32% of total electricity generation in 1985. Then, in 2017, coal grew to make up half of Indonesia’s installed power capacity [44]. Meanwhile, total coal power generation in this year grew over thirty-fold to reach 152 terawatt-hours and 58% of annual total electricity generation. For this entire three-decade period, annual power generation from both coal and renewables have increased at more or less comparable levels (11.4% and 9.2% respectively). In the future, however, coal will remain as the principle source of power generation. This is indicated in the electricity supply business plan of PLN (Indonesia’s state-owned electricity company) that still aims to obtain more than 60% of power generation in 2020 from coal [30]. Furthermore, as an additional driver of increased coal consumption, the bulk of domestic coal reserves are low calorific value (i.e., low rank). Such fuel requires a higher consumption volume per unit of electricity produced.

1.2. Government Policy Landscape

Possessing abundant thermal coal reserves, government policy in Indonesia is highly supportive of expanding both upstream coal production and downstream combustion in the power sector. Beginning upstream, Figure 4 shows that Indonesia has annually produced roughly more than 250 million tons oil equivalent (MTOE) over the last five or so years [27]. This amount consistently exceeds government production targets and has expanded almost five-fold since 2000. National mining and energy policy stipulates that coal production serves primarily the national market [46]. In practice, however, the majority of coal (around 80%) is exported to China, Japan, India and other South East Asian countries as mining companies seek higher profits by ramping up production when international coal prices rise [24]. Recent coal production has focused on low-rank sub-bituminous and lignite coal [31]. The low cost of this fuel as a power source has driven domestic and export demand [47]. Increased production has also been propelled by a dramatic increase in issued mining permits following the transfer of decision-making authority from the national to local level as well as the eagerness for many regional municipalities to support the industry for fiscal benefits [23].
Coal mining is supported through linkages to policies governing the national electricity market. For example, the Ministry of Energy and Mineral Resources has set a regulation (1395/2018) that the price of domestic coal for power generation purchased by the state-owned utility, PLN, must not exceed US $70 per ton [30]. This protects the utility from fluctuating coal prices in the international market and ensures that coal electricity remains affordable for consumers [23]. Additionally, government subsidies are also given to PLN to compensate for higher energy prices, including coal. In 2019, US $4 billion of fuel subsidies were supposedly allocated for this [48]. Coal-fired electricity is thus protected by policy to attain economic competitiveness over other types of fuel such as natural gas or renewables [49]. Coal mining is also heavily subsidized. Government subsidies (e.g., tax exemptions and preferential royalties and tax rates) are estimated to total between US $1-2 a ton [23].
Downstream, government policy is also driving expansion of the national fleet of CFPPs. For example, the “35,000 MW Program” (i.e., 35 GW) introduced in 2015 aims to add this amount of new power capacity over five-years, mostly to the Java and Bali grid. Coal power will make up 50% of this addition [50]. This program is underpinned by predictions that annual electricity demand will increase by around 6.4% per year. In addition, the majority of electricity generation capacity (around 74%) belongs to the aforementioned state-owned utility, PLN [30]. This entity has a distinct preference for coal power and has set a target to fulfil 67% of total power generation in 2022 by CFPPs (see Figure 3). In the longer term, PLN’s relative share of coal power would decline to around 54% in the year 2028 (against a 22% share for gas). However, if all projects currently under planning in Indonesia are constructed, the absolute volume of coal power capacity will almost double to 56 GW from the currently operating fleet of 32 GW [3]. Thus, with these upstream and downstream policy drivers, coal production and coal power generation in Indonesia will continue to grow at least until 2023 [45], and possibly further into the future.
Given the high cost and technological complexity of developing and operating new CFPPs, countries such as China and Japan are playing a key role in facilitating this expansion [47,49]. This is predominantly by supplying finance (through loans, investment and insurance) and technology (e.g., equipment such as boilers and turbines and engineering know-how) as well as engaging in construction, operation and ownership. China is planning to support more than 10,400 MW while Japan is supporting more than 5000 MW of projects [50]. Since the construction of large, modern CFPPs requires several billion dollars, many projects would likely not go ahead without the financial support of foreign private and government banks and export credit agencies in the form of loans and export insurance. The NGO Market Forces [51] has surveyed this trend in Indonesia for 21 new construction projects totaling 13,000 GW and entering financial close between 2010 and 2017. For 15 projects, 85% of finance came from Chinese banks while in another five projects, 90% of finance was issued by Japanese banks.
Under the Paris Agreement, Indonesia has pledged to reduce its greenhouse gas emissions in 2030 from Business as Usual levels by up to 41% with international support, or 29% unconditionally [37]. This is to be achieved through increased energy efficiency and renewable energy. Additionally, the National Energy Policy set in 2017 aims to increase renewables to attain a 23% share of total energy consumption by 2025 and then 31% by 2050 [44].
Yet despite abundant resources of geothermal, solar and wind, the deployment of renewables must contend with multiple barriers. From a cost perspective, firstly, solar PV, wind and geothermal are not forecast to attain cost parity with coal power until around 2030 [23]. Meanwhile government policy set in 2017 requires that electricity purchased from renewable energy projects must retail for between 85–100% of PLN’s production price. Renewables must therefore compete with the economics of PLN’s large capacity of baseload coal power, where prices are further suppressed through regulation and subsidies both upstream and downstream [52]. Second, a further institutional barrier is that PLN is reputed to use its significant political power to oppose the formulation of ambitious renewables policy [24]. Third, given these many obstacles, renewable energy developers often experience difficulties in attracting finance from local banks in Indonesia [53]. It can thus be said that the development of renewable energy in Indonesia currently lies between a rock and a hard place.

1.3. Problems Caused by Rising Coal Consumption

While the growth of coal-fired electricity is aiding Indonesia to power its rapidly growing economy with affordable energy from domestic resources, this exploitation of coal has created significant environmental and social externalities across the entire fuel lifecycle.
Beginning upstream, coal extraction significantly impacts forest cover, eco-systems and water resources since more than 99% of coal is sourced through open-cut surface mining [25]. Indeed, the mining industry is one of the five major contributors to forest loss across Indonesia [54]. Deforestation is growing due to an increase in annual coal production and the number of mining permits issued. National law forbids coal mining in protected forests. However, many permits allow mining in such areas since there are competing land claims and a lack of co-ordination at the national and regional level regarding this [24]. National law also requires that mining companies afforest damaged land upon termination of government leases in accord with stringent government guidelines. Reclamation funds must be set aside for this. In practice, however, policy enforcement is weak [47]. Public data lacks on the extent to which coal mining companies are actually afforesting damaged lands [55]. Meanwhile, many mining companies are not earmarking reclamation guarantee funds [56]. Pollution of water resources from coal mining with heavy metals such as mercury is also reported [57]. For example, in South Kalimantan, a major coal producing region, numerous legal and illegal mines have been observed to be leaking toxic pollutants into watersheds [58].
Downstream impacts are also significant, particularly air pollution. In 2011, air pollutants from CFPPs were estimated to cause some 7500 premature deaths annually across Indonesia in addition to raising incidences of asthma and respiratory illness [22]. This same study projects that premature deaths will more than triple by 2030 as new plants are added. The disease burden from CFPPs in Indonesia is particularly high due to non-stringent air emission regulations relative to other countries [59,60]. Researchers have also problematized a lack of best practice pollution control technologies such as scrubbers on several new plants [61]. Air pollution and health impacts are particularly high in Jakarta, where some 22 plants lie within 100 km of the city. In 2017, there were only 14 days when air in the southern part of the city was classified as “good” according to the US Air Quality Index. Meanwhile, Sanchez and Luan [60] argue that mean annual concentrations for PM 2.5 levels (the main cause of premature deaths) for Jakarta in 2017 were around 65 μg/m3. This is more than six-times the World Health Organization’s recommended limit.
In terms of economic impacts, many researchers have pointed to risks of overcapacity and “stranded assets” from observations that electricity demand is not rising as fast as projected [32,62,63]. However, foreign investors are protected from financial risks in the case that plant capacities fall below expectations. Specifically, contracts for independent power producers typically entail “take or pay” clauses and long-term power purchase agreements for 25-years or more [64]. Thus, even if the recent spate of new CFPP construction leads to grid overcapacity and a subsequent drop in plant utilization rates, long-term purchase contracts will oblige the purchaser (i.e., PLN) to pay for electricity—even if not required. Thus, any financial risks associated with oversupply are passed to the Indonesian utility, and by extension, to the national government and individual electricity consumers. Consequently, the rush of recent coal construction in the Java-Bali grid area therefore carries non-negligible economic risks for the Indonesian state and tax payer, who might be forced to pay billions of dollars in future years for unneeded generation capacity [64]. In addition, CFFP assets would also take up grid space from future additions of renewable energy.

2. Materials and Methods

2.1. Study Design

As explained, due to economic and energy security benefits, coal consumption is expected to continue climbing in Indonesia despite environmental and social externalities. There is, therefore, a strong need to understand the driving factors behind this growth by considering demographic factors (which are difficult to control) as well as government policy (which is somewhat easier to control). The decomposition approach is the ideal tool for this objective. It has been widely adopted in energy and pollutant studies [65,66,67] since it can determine the varying influence of multiple driving forces on a system. In our study, Indonesia’s varying but growing annual coal consumption is decomposed into five main indicators: (1) the energy mix effect, (2) the energy intensity effect, (3) the urban economic effect, (4) the urbanization effect, and (5) the population effect (elaborated in Section 2.3). By accounting for the effect of urbanization, we thus use a more comprehensive approach than literature to date, which has considered only three factors: activity, structure, and intensity effects.

2.2. Review of Decomposition Analysis Literature

There are principally three methods of decomposition analysis [68]: production-theoretical decomposition analysis (PDA), structural decomposition analysis (SDA), and index decomposition analysis-log mean divisia index (IDA-LMDI). The LMDI method was chosen for this study. It has several advantages over PDA and SDA. Necessary data can be easily collected, its modes and implementation are somewhat simple, and it provides additive and multiplicative approaches [69]. Due to such benefits, the LMDI method is more widely utilized for investigating the drivers of energy consumption, emissions, and other pollutants. As we show in Table 1 below, many previous studies have focused on coal consumption in China, which is dominated by the industrial and electricity generation sector. In Indonesia, as mentioned, energy consumption is dominated by the residential sector. A few studies have utilized the decomposition approach to determine the drivers of electricity consumption change [70], energy consumption in the household sector [71] and policy analysis of energy conversion [39]. Since, however, none of the examined studies have explicitly focused on coal consumption in Indonesia, the relative influence of multiple drivers in the fastest growing coal consumer in the world remain unknown.
The PDA decomposition analysis approach is based on production theory, distance functions, and data envelopment analysis. This method has been employed for decomposing the impacts of efficiency and technology-related variables, particularly in China. For instance, it has been used to determine the effect of various technological measures on the CO2 emissions from fossil fuel power plants [72]. In developing the PDA method, one study found that economic growth was the largest factor of increasing CO2 emissions in China during 2005–2010 period [72]. Moreover, another study has found three factors which contributed to reducing emissions: technological efficiency, technological progress, and change in output structure [73]. The PDA approach requires aggregate panel data, which is relatively easy to collect. Utilizing aggregate panel data for the construction industry in China, another study found that emissions have increased in all provinces [74]. Multiple factors have exerting varying influences on this trend. However, in the PDA approach, a number of linear programming equations need to be solved. Moreover, the method can only be performed multiplicatively [68].
The SDA approach is developed based on an input-output analysis, which allows direct and indirect demand effects at a disaggregated level. The SDA method has often been utilized for research related to energy and emission changes over time. For instance, to investigate the drivers of emission changes for Singapore, the structural decomposition analysis has been performed [75]. The SDA approach was also utilized to find the driving forces behind the direct, indirect and total CO2 emissions in Beijing [76]. Meanwhile, in another study focusing on energy intensive industry, the method was performed to understand the patterns of the emission change in China from both a production and consumption point of view [77]. The main advantage of the SDA method is that it can uncover the influence of both direct and indirect causes as well as distinguish a range of technological and final demand effects [78]. However, the SDA method has three main drawbacks when used for decomposition analysis: (1) it requires input-output tables (which are not constructed annually in many countries), (2) it requires a relatively more complex economic model than other approaches (e.g., IDA), (3) it can only can perform an additive decomposition form of analysis [79].
As a third approach to decomposition analysis, IDA was developed based on the index number theory. Over the PDA and SDA approach, the IDA method has several advantages. First, required data are typically easy to obtain. Second, its modes and implementation are relatively simple. Third, it can be used for additive and multiplicative analysis. The IDA method generally consists of two main approaches: (1) Laspeyres decomposition analysis and (d) divisia index decomposition analysis.
In the first approach, Rüstemoğlu and Andrés [80] refined the Lasprayres analysis method to decompose both aggregated and sectoral changes of CO2 emissions in Brazil and Russia. However, since the Laspeyres decomposition analysis carries the problem of resulting in residual values, Sun’s method has been proposed to solve this efficiently [81]. For example, utilizing this method for a study on energy consumption across various industries in India, Reddy and Ray [82] found that the energy intensity effect has reduced energy consumption in all industry studied except textiles. The main drawback of the method is the decomposition equation becomes overly complicated when there are more than three factors to examine [79].
The second approach, the divisia index decomposition, can be generally classified in to two main methods: (1) the arithmetic mean divisia index method [38], which employs arithmetic mean weight function, and (2) the logarithmic mean Divisia index method (LMDI), which utilizes a logarithmic mean weight function. LMDI has two main advantages compared to AMDI since it can provide a residual-free decomposition and accommodate the presence of zero values in the data [69]. Having these advantages, the LMDI method is more widely utilized than other approaches for investigating energy consumption, emissions, and other pollutants.
Many previous studies utilizing the LMDI approach have focused on coal consumption, particularly for the case of China. In this country, the industrial sector is the largest final user of coal, while power generation is the biggest consumer among all transformation sectors [83]. One study has shown that the main driver of changing coal consumption intensity has been the economic output of secondary industry [36]. This is supported by other studies showing that the expansion of heavy industry in China is the primary driving force behind rising coal consumption [84]. Conversely, the LMDI approach has revealed that the shifting of industrial structure has inhibited the increase of coal consumption significantly since 2012 [65].

2.3. Method in This Study and Data Sources

Annual data covering the period 1965–2017 are utilized in this study (the authors will share the dataset utilized in this study with those who wish to replicate or build on our results). Data for economic growth, urbanization rates and population growth are derived from statistics collected by the World Development Indicators [38]. For annual coal consumption, we utilized the BP Statistical Review of World Energy [27].
In applying the decomposition approach, coal consumption at time t ( C O t ) in Indonesia (in both power generation and industrial use) during 1965–2017 is broken down into five factors: the energy mix effect at time t ( C T t ), the energy intensity effect at time t ( E G t ) , the urban economic effect at time t ( G U t ), the urbanization effect at time t ( U T t ), and the population effect at time t ( P t ). Then, to analyze the varying significance of these multiple drivers of increasing coal consumption, we extended the LMDI model of Ang [41] into the following Equation (1):
C O = C O T E T E G D P G D P U R U R P P
Following this approach, coal consumption can be expressed as Equation (2):
C O t = C T t   E G t   G U t   U T t   P t
The changes in the ratio of coal consumption to total energy consumption are captured by C T t w. This represents the composition of the national energy mix as measured by the share of coal consumption ( C O ) relative to total energy consumption ( T E ) . The energy intensity effect ( E G t ) captures the ratio of total national energy consumption relative to GDP. The ratio of national GDP to the urban population   ( U R ) refers to the urban economic effect ( G U t ). This ratio shows the contribution of urban population to Indonesia’s GDP and allows us to specifically capture the effect of the improving income of the urban population. Additionally, the urbanization effect ( U T t ) reflects changes in the share of urban population relative to the total population. Finally, the population effect ( P t ) captures the influence of annual changes in the total population. Accordingly, this equation can be expressed as Equation (3), as follows:
Δ C O t = C O t C O t 1 = Δ C O C T + Δ C O E G + Δ C O G U + Δ C O U T + Δ C O P
Each effect in the right-hand side of Equation (3) is derived from the following equations:
Δ C O C T = C O t C O t 1 l n C O t l n C O t 1 l n C T t C T t 1 Δ C O E G = C O t C O t 1 l n C O t l n C O t 1 l n E G t E G t 1 Δ C O G U = C O t C O t 1 l n C O t l n C O t 1 l n G U t G U t 1 Δ C O U T = C O t C O t 1 l n C O t l n C O t 1 l n U T t U T t 1 Δ C O P = C O t C O t 1 l n C O t l n C O t 1 l n P t P t 1

3. Results

This section may be divided by subheadings. It should provide a concise and precise description of the modelling results, their interpretation as well as conclusions from the model that can be drawn.

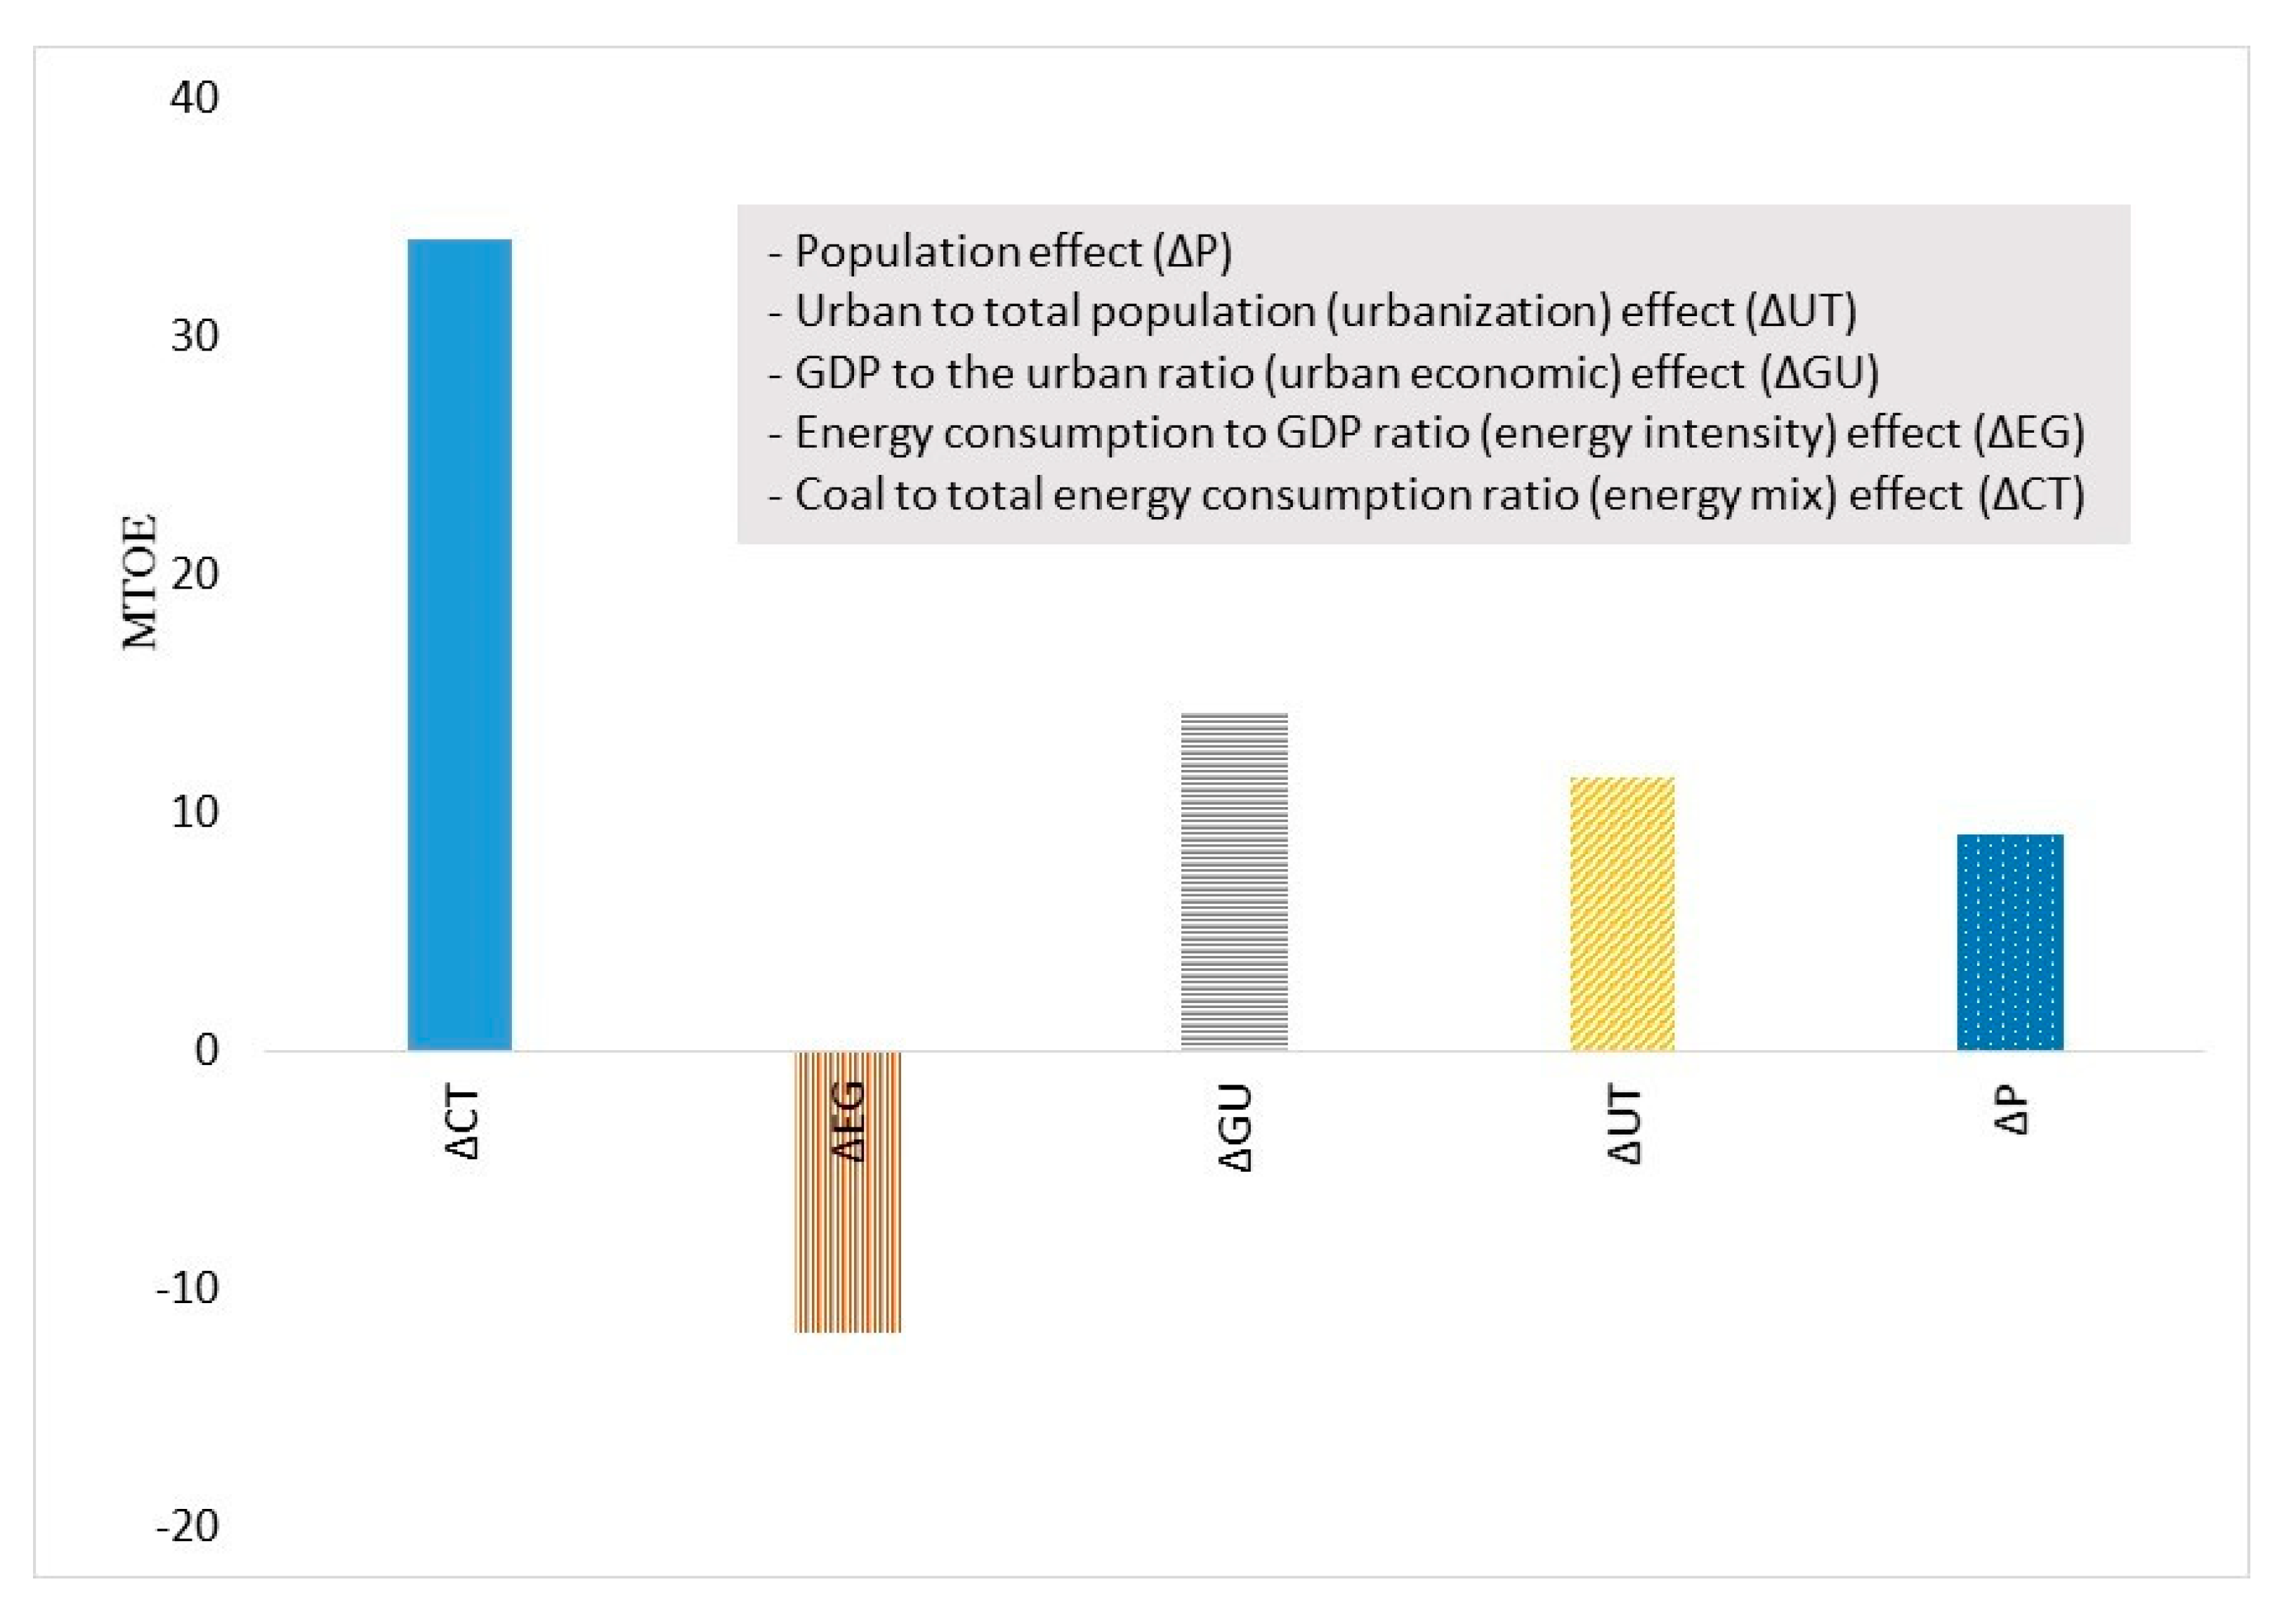
3.1. Drivers of Changes in Aggregate Coal Consumption

Figure 5 shows the ratio of coal consumption to total energy consumption and urban population against the total population in Indonesia over the period 1965 to 2017. As indicated, from 1965 to 1984, coal made up only around 1% of total energy consumption. A three-decade period of rapid growth, however, starts from 1985, with coal consumption increasing from 0.9 MTOE to 57.16 MTOE in 2017. Consequently, the ratio of coal relative to total energy consumption has soared from 1% to 33% over this period. Incidentally, the speed by which coal consumption has increased far exceeds that of other fossil fuels. Figure 5 also reveals a continuous and increasing pattern of urbanization. While only 16% of Indonesia’s population lived in rural areas in 1965, urban dwellers swelled to more than 54% in 2017. To understand the differing effect of various drivers, an LMDI decomposition analysis was performed to add to this picture the influence of energy intensity, urbanization and population in addition to the economic and energy mix effect.
Figure 6 indicates the accumulated effect of the five influencing factors on Indonesia’s coal consumption during our study period (1965–2017).
In aggregate, the energy mix, urbanization, and the population contribute a positive influence on annual coal usage. The combined effect of these four drivers amounts to an increase of coal consumption by 57.03 MTOE. Among these, the energy mix effect (capturing the ratio of coal to total energy consumed in the national energy mix) exerts the largest influence (34.03 MTOE). This is followed by the urban economic effect (14.31 MTOE), which captures the influence of the increasing ratio of GDP to the urban population. Conversely, energy intensity exerts an inhibitory effect (−11.88 MTOE). The energy intensity effect captures the amount of energy required to produce a unit of GDP. Thus, improvement in energy efficiency can decrease coal consumption. In other words, if there is no intensity effect, coal consumption would have increased by 11.88 MTOE in 2017.
The already mentioned ratio of GDP to the urban population (i.e., the economic effect) has contributed to 25% of the observed change in coal consumption during the study period. Concretely, the ratio has increased from US $4214 (all dollar amounts are in constant values fixed at 2010) per capita of urban population in 1965 to US $7557 in 2017. The change in ratio reflects the improving income of the urban population, which as we show, is a major driver of increasing coal consumption. Thus, not only has Indonesia’s economy grown and caused an increase in coal consumption, but the demographic composition of society itself has also changed. This is exerting a new pressure on energy demand.
In contrast to the urban economic effect, which has a sharply fluctuating pattern each year, Figure 7 shows that the urbanization effect and population effect have increased at a steady and continuous pace. Each contributed 11.52 MTOE and 9.08 MTOE respectively to Indonesia’s increased coal consumption. In 1966, the contribution of urbanization and population growth were relatively less significant and around 8% and 13% respectively. Meanwhile, in 2017 these shares and influence grew to reach 18% and 16% respectively. Increasing population during the study period also triggers coal consumption by 9.08 MTOE. Given that electricity is the main source of coal consumption and that most electricity is consumed by households rather than industry, Indonesia’s growing share of urban residents are the largest albeit final “consumers” of coal in Indonesia.

3.2. Figures, Tables and Schemes

Based on the annual changes indicated in Figure 7, we divided Indonesia’s coal consumption into three phases. The first stretches for two decades from 1965 to 1984. During this phase, coal consumption did not change significantly. In aggregate, it increased by only 0.14 MTOE to which the economic effect contributed 0.05 MTOE, the urbanization effect 0.09 MTOE, and the population effect 0.09 MTOE. Meanwhile increased energy efficiency (i.e., the energy intensity effect) and the decreasing portion of coal in the energy mix effect offset 0.06 MTOE and 0.15 MTOE of consumption respectively. With a much lower ratio of coal to the total energy consumption relative to later phases, the energy mix during Phase 1 exhibited an overall inhibiting effect on coal consumption (−0.15 MTOE).
The second phase begins from 1985. This continues just over a decade, until 1997, when the Asian Financial Crisis hit Indonesia. During this period, Indonesia experienced much faster growth in coal consumption, with the primary driver being the energy mix effect. This contributed more than half of coal consumption during the period, from 4.1 MTOE to 7.08 MTOE. Conversely, the effects of other variables were much less pronounced. Specifically, the contributions of the coal intensity effect, economic effect, urbanization effect, and population effect were 0.48 MTOE, 0.57 MTOE, 1.25 MTOE, and 0.67 MTOE respectively.
The third phase depicts a period of rapid growth in coal consumption, extending from 1998 to 2017. During this phase, coal consumption increased to 48.60 MTOE. This represents a seven-fold expansion in the space of two decades. The main drivers during this period came from the urban economic effect (9.25 MTOE), urbanization effect (8.25 MTOE), and population effect (6.38 MTOE). While the urban economic effect exerted a positive influence for the majority of this period, it served to inhibit coal consumption in 1998, when the Asian Financial Crisis caused a significant but temporary economic downturn. As for the energy intensity effect, this has exerted a hampering but somewhat smaller effect, reducing coal consumption by 5.55 MTOE. In fact, while the energy intensity effect contributed to an increase in coal consumption until 2004, it takes on a fluctuating pattern after this year.
Since the power generation industry is the largest direct consumer of coal, the expansion of Indonesia’s fleet of CFPPs is the principle influencing factor for Phase Three. This significant change is largely contributed from the first electricity Fast-Track program, which added 10 GW of capacity by 2013, mostly through coal. Owing to this increased capacity, actual coal-fired generation has risen from 5.109 kWh in 1985 (32% of total electricity generation) and 22 kWh in 1998 (29% of total electricity generation) to become 152 kWh in 2017 (58% of total electricity generation). Relative to 1985, this represents a more than four-fold increase in coal working hours in 1998 and a 30-fold increase in 2017.

4. Discussion

Annual coal consumption in Indonesia has increased roughly 443-fold over our study period, from 0.13 MTOE in 1965 to 57.2 MTOE in 2017. The results of our decomposition analysis show a somewhat intuitive result; that the energy mix effect (i.e., coal’s share of total annual energy consumption) has exerted by far the largest impact on this trend. This variable accounts for 34.03 MTOE or roughly 60% of total coal consumption change in aggregate over this five-decade period.
The expansion of Indonesia’s CFPP fleet is responsible for this change—most particularly in the last two decades. While coal-fired power generation provided only 5 TWh for 1985 (providing 32% of total electricity generation in this year) it has grown to 152 TWh in 2017 (providing 58% of total generation). As already discussed, the current national government is committed to expanding power generation mostly through coal. Consequently, although the relative share of coal power will decrease in coming years, the absolute volume of generation will increase significantly, possibly even doubling (see Section 1.2). Having abundant surface reserves, Indonesia is one of the lowest-cost coal producers globally [49]. With government policy and subsidies further suppressing associated costs, coal has become the most attractive choice for expanding power generation capacity to increase electricity access, facilitate economic growth, and contribute to poverty eradication.
Although outside the scope of our analysis, other factors too have triggered the increased coal consumption we captured via the energy mix effect. First, a major issue concerns the utilization of low-rank sub-bituminous and lignite coal. Since Indonesia must burn more coal per unit of electricity than other nations with higher calorie reserves, this results in a sub-optimal efficiency of coal-fired generation [31]. With an average thermal efficiency of around 31%, CFPPs in Indonesia have a much lower efficiency compared to another developing countries such as China (39%), Malaysia (35%), and Vietnam (35%) and developed economies such as Japan (41%) [89]. While there are some higher calorie reserves in locations such as central Kalimantan, underdeveloped transport infrastructure poses a significant barrier to their exploitation [24]. Although increasing the availability of higher calorie coal throughout the supply chain would aid this, it is notable that some ultra-supercritical plants in Germany have gained a net efficiency of 43%, even using low-grade coal [25]. Second, however, most of Indonesia’s coal power fleet is inefficient and poorly maintained [49]. Many existing plants are aged while the vast majority uses older and inefficient subcritical technology [28]. These plants have a much lower thermal efficiency than more recent technologies such as supercritical and ultra-supercritical (where efficiency gains are achieved via higher temperature and pressure). The first supercritical power plant was just commissioned in 2011 [25] while the first ultra-supercritical plant, the Cirebon coal-fired power plant expansion, is scheduled to start commercial operations in 2022. Since it is likely that many more plants will be planned and constructed in Indonesia, it is vital that future emissions be reduced as much as possible by replacing older plants with high-efficiency upgrades and carrying out adequate maintenance. For example, newly built plants by Chinese contracts are reputed to be also performing at low efficiency, presumably from engineering faults [23].
Another factor impacting coal’s domination in Indonesia’s energy mix is the slow development of renewables [52]. Although growing in absolute terms, the relative share of renewable energy sources has grown much slower (see Figure 3). Particularly with regard to geothermal energy, despite possessing an estimated 40% of the global reserve, Indonesia is yet to fully exploit this resource as a carbon-free baseload power. Multiple barriers explain this [90,91]. First, most geothermal resources are located in off-grid and protected forested areas such as national parks. Second, limited funding opportunities are available in spite of the high costs and investment risks involved with exploration drilling [92]. Nevertheless, developing geothermal resources along with other forms of renewable energy are an important way to decouple CO2 emissions from population and economic growth and thus escape the unsustainable development pathway depicted in the Kuznet’s environmental curve hypothesis [93].
Considering these hurdles, it has been suggested to consider the utilization of natural gas until geothermal resources are more ready to develop from a cost and technical perspective [21]. Increasing Indonesia’s share of gas power would not be without disadvantages. Indonesia has important natural gas reserves that are already developed (although not as widely as coal). Also, gas-fired plants are faster to build and require less capital than their coal counterparts [24]. This is not to mention the immense health benefits (i.e., reduced premature deaths and disease burden) that would ensue from avoided air pollution when reducing coal combustion in the power sector [22]. Incidentally, it is interesting to note that Indonesia has a proven track-record in transitioning to cleaner fuels on a large scale. This is apparent when considering that the national government has previously guided a nationwide switch from kerosene to liquid petroleum gas in household cooking practices over the period 2007 to 2018 [39]. The success of this program is recognized internationally [94].
The decomposition analysis demonstrated that the second most significant driver was the urban economic effect. This contributed around 25% to the total increase in coal consumption, mostly since the year 1998. This variable captures not only the increasing share and volume of the urban population (discussed below), but moreover, rising levels of income and overall living standards. Increasing incomes and standards of living (e.g., larger living areas per capita etc.) have important implications for coal consumption since the residential sector is the most significant consumer of electricity in Indonesia. As such, a large portion of Indonesia’s increased energy consumption can be attributed to the usage of electrical appliances in individual households. Research has shown that the bulk of residential electricity consumption (92%) is due to four appliances (listed in order of energy demand): air-conditioning, lighting, refrigerator, and televisions [95]. Since ownership of these appliances is related to income and purchase prices, improving the economic situation of a country encourages people to own more of these electrical goods [96]. In Indonesia’s case, improved incomes for urban residents has in particular generated an increase of purchases of air conditioning systems and refrigerators [97]. Thus, increased demand for electricity from the household sector due to improved living standards also needs to be seen as a key driver of growing coal consumption. This corresponds with observations from other countries such as China [98].
In contrast to the urban economic effect, which fluctuates sharply from year to year, both the urbanization effect and population effect exhibit a continuously increasing trend. Each contributed 11.52 MTOE (20%) and 9.08 MTOE (16%) respectively to Indonesia’s total change in coal consumption. Both these variables reflect a consistently growing urban population in both absolute and relative terms. However, the contribution of both to the increased coal consumption observed over the study period implies that the inward flow of persons moving from rural areas to urban areas is driving increased per capita energy consumption, even without accounting for increased per capita GDP. This is largely due to the per capita living space, which is much larger than in rural areas, and the ready availability of energy consuming appliances such as household electrical goods. Although Indonesia’s share of urban dwellers in 2018 comprised just over half of the population (55%), this level is still far inferior to many industrialized nations such as Japan (92%), North America (82%) and the European Union (76%) [38]. Yet multiple trends suggest that the urban population will continue to grow, both in share and volume [99]. This is due to Indonesia’s rapidly growing population (currently around 270 million and increasing over 1% annually) and the continuing rising GDP [38]. The effects of growing urbanization on energy consumption are widely noted in other developing countries. This is most particularly in China, where this trend has likewise contributed to an increase in coal consumption [83]. Thus, while industrialized and urbanized wealthy nations are faced with a common need to decouple industrial activity (which drives economic growth) from carbon emissions, our data shows that developing nations such as Indonesia share a need to decouple urban population growth from increased coal (and fossil fuel) emissions.
The sole variable to have produced a long-term inhibitory effect on the aggregate growth of coal consumption was energy intensity. Thus, the increasing efficiency by which Indonesia has been able to produce a unit of GDP relative to the amount of energy consumed is linked to a reduction of 21% (−11.88 MTOE) in coal consumption over the study period. This improvement in energy intensity has resulted from shifting energy-intensive sectors to economic activities with lower energy demands such as high-end manufacturing and services [100]. Incidentally, Indonesia’s industrial sector has the highest coverage of mandatory energy efficiency policies as stipulate9 in Government Regulation 70/2009. Conversely, however, the residential sector has one of the lowest levels of coverage. While it is important that the decarbonization of industrial activities continue, as implied from our discussion above, is also critical that policies are formulated to curtail future demand for household energy by raising energy efficiency in this sector.
Finally, in terms of methodological limitations, this study was only able to consider GDP at the national level due to the unavailability of regional data. Consequently, we were not able to incorporate provincial heterogeneity into the decomposition of coal consumption. If this panel data were to become available, some provincial heterogeneity related factors could also be uncovered in future research.

5. Conclusions and Policy Recommendations

5.1. Key Findings

Of the world’s top ten coal consumers, the rapidly developing country of Indonesia has demonstrated the highest growth rate for the past decade. Until now, however, knowledge has lacked on the precise contributions of various policy, economic and demographic drivers to this increasing reliance on coal, particularly in the power sector. This study thus used a decomposition analysis to determine the relative influence of each over the past five decades.
We found that the composition of the energy mix has exerted the largest driving force on coal consumption. While this is an intuitive and expected finding, by accounting for other socio-economic factors such as urbanization and the increasing wealth of the urban population, we also found that other less appreciated factors have contributed to an increased demand for energy (and coal by extension). In order of contribution, these were the urban economic effect (the ratio of the urban population to GDP) followed by the growing relative share of the urban population (the urbanization effect) in addition to the population increase itself in absolute terms (the population effect). We thus demonstrated that the drivers of increased coal consumption are multi-faced, complex and intertwined. While traditional energy policy, which dictates the energy mix, is essential for reducing coal consumption, broader socio-economic and demographic drivers are also important. Decoupling these driving forces from CO2 emissions thus requires policies beyond the narrow field of energy policy. To this end, we make several policy recommendations below, based on our findings.

5.2. Policy Recommendations

Indonesia’s rising appetite for coal—especially in the power sector—will likely prove a significant challenge for the global task of reducing coal consumption for climate mitigation and other health and environmental benefits. Given the multi-faceted drivers we have revealed, a multi-pronged approach is required to decouple rising wealth and urbanization from coal combustion.
The first set of policy recommendations relate to the finding that the energy mix is the principle driver of increased coal consumption in Indonesia over the last five-decades. Since the bulk of coal is consumed in power generation, multiple measures are needed to curb this rising trend. With large additions of power generation capacity planned for coming years, it is important that cleaner alternatives to coal (i.e., gas and geothermal) are prioritized by government leaders through the formulation of a less coal-intensive energy mix targets for the future. Since it is likely that many additions of CFPPs will go ahead due to existing commitments, it is essential that future emissions are reduced by building high-efficiency plants that replace older, less-efficient counterparts. Given that the majority of new CFPPs are being built with technical and financial assistance from China and Japan, it is also essential that government policy in these countries directs this bilateral assistance to the goal of decarbonizing Indonesia’s electricity mix—and not just on building cheap power sources. Emissions limits for CO2 could be imposed on the state-owned utility PLN that could only be met with plants using ultra-supercritical technology or cleaner sources of coal than the current market preference for cheap lignite. Yet encouraging the addition of cleaner power sources would also require measures to reduce the economic advantage currently enjoyed by coal over other energy sources through upstream and downstream subsidies and institutional arrangements that suppress the true cost of coal-fired electricity. Finally, for existing plants, it is essential that coal consumption be reduced as much as possible through adequate plant maintenance, and that early retirements are prioritized for the most polluting facilities.
The second set of policy recommendations stems from the finding that the growing share and wealth of the urban population is also exerting a significant pressure on Indonesia’s rising coal consumption. This points to a need to decouple increasing urbanization and household income from energy demand. Although both electricity and liquid petroleum gas each contribute a roughly equal share to household CO2 emissions, demand for electricity consumption is rising faster than gas [39]. Thus, both demand-side and supply-side measures are required to reduce the energy consumption of electrical appliances.
On the supply-side, effective measures might involve policies to increase the energy efficiency of locally manufactured and imported electrical appliances. Raising the minimum energy performance standards for a variety of appliance categories such as air conditioning, lighting, refrigerators, and televisions could provide an important step in this direction. Manufacturers and retailers could be given economic incentives to achieve higher production or sales volumes of energy efficient models. Spurring the manufacturing and diffusion of high-efficiency air-conditioners (currently the largest single consumer of household energy) is particularly important. Sales of household air-conditioning units in Indonesia are growing around 10–15% a year, mostly as a result of urbanization and rising income levels [101]. However, minimum energy performance standards are currently lower than other ASEAN countries. This points to an opportunity to raise efficiency standards and performance indicators in line with best international practices.
On the demand-side, more efforts are required to inform and incentivize consumers to choose energy efficient appliances (particularly air-conditioners). This would be important to maximize the energy saving effects of the existing national energy efficiency labelling program for electrical appliances. Finally, we also perceive a future need to design and implement codes and regulations to lower the energy consumption of new residential buildings. This is important for avoiding the “rebound effect” observed in other nations, whereby greater energy efficiency in appliances is offset by a growth in per capita flooring area in households [102].

Author Contributions

All persons who meet authorship criteria are listed as authors, and all authors certify that they have participated sufficiently in the work to take public responsibility for the content, including participation in the conceptualization (R.K., G.P.T., and K.M.), methodology (R.K.), analysis (R.K., G.P.T., and K.M.), writing (R.K., G.P.T., A.S.E., I.E.S.), data curation (R.K.), visualization (A.S.E.), funding acquisition (K.M.). All authors have read and agreed to the published version of the manuscript.

Funding

This work was supported by KAKENHI 20H00648, 18KT0010.

Conflicts of Interest

The authors declare no conflict of interest.

References

  1. IPCC. Global Warming of 1.5 °C: Summary for Policy Makers. 2018. Available online: http://report.ipcc.ch/sr15/pdf/sr15_spm_final.pdf (accessed on 10 October 2018).
  2. Yanguas Parra, P.; Ganti, G.; Brecha, R.; Hare, B.; Schaeffer, M.; Fuentes, U. Global and Regional Coal Phase-Out Requirements of the Paris Agreement: Insights from the IPCC Special Report on 1.5 °C. 2019. Available online: https://climateanalytics.org/publications/2019/coal-phase-out-insights-from-the-ipcc-special-report-on-15c-and-global-trends-since-2015/ (accessed on 10 October 2019).
  3. Shearer, C.; Myllyvirta, L.; Yu Aitken, G.; Mathew-Shah, N.; Dallos, G.; Nace, T. Boom and Bust 2020: Tracking the Global Coal Pipeline. 2020. Available online: https://endcoal.org/wpcontent/uploads/2020/03/BoomAndBust_2020_English.pdf (accessed on 10 July 2020).
  4. Cui, R.Y.; Cui, R.Y.; Hultman, N.; Edwards, M.R.; He, L.; Sen, A.; Surana, K.; Nace, T. Quantifying operational lifetimes for coal power plants under the Paris goals. Nat. Commun. 2019, 10, 1–9. [Google Scholar] [CrossRef] [PubMed] [Green Version]
  5. Edenhofer, O.; Steckel, J.C.; Jakob, M.; Bertram, C. Reports of coal’s terminal decline may be exaggerated. Environ. Res. Lett. 2018, 13, 24019. [Google Scholar] [CrossRef]
  6. Blondeel, M.; de Graaf, T.V.; Haesebrouck, T. Moving beyond coal: Exploring and explaining the Powering Past Coal Alliance. Energy Res. Soc. Sci. 2020, 59, 101304. [Google Scholar] [CrossRef]
  7. Oberschelp, C.; Pfister, S.; Raptis, C.E.; Hellweg, S. Global emission hotspots of coal power generation. Nat. Sustain. 2019, 2, 113. [Google Scholar] [CrossRef]
  8. Newell, P.; Simms, A. Towards a fossil fuel non-proliferation treaty. Clim. Policy 2019, 19, 1–12. [Google Scholar] [CrossRef] [Green Version]
  9. Garg, A.; Steckel, J.C. Chapter 2: Bridging the Gap—Phasing Out Coal; The Emissions Gap Report 2017; United Nations Environment Programme (UNEP): Nairobi, Kenya, 2017. [Google Scholar]
  10. Jewell, J.; Vinichenko, V.; Nacke, L.; Cherp, A. Prospects for powering past coal. Nat. Clim. Chang. 2019, 9, 592–597. [Google Scholar] [CrossRef]
  11. Rentier, G.; Lelieveldt, H.; Kramer, G.J. Varieties of coal-fired power phase-out across Europe. Energy Policy 2019, 132, 620–632. [Google Scholar] [CrossRef]
  12. Trencher, G.; Healy, N.; Hasegawa, K.; Asuka, J. Discursive resistance to phasing out coal-fired electricity: Narratives in Japan’s coal regime. Energy Policy 2019, 132, 782–796. [Google Scholar] [CrossRef]
  13. Spencer, T.; Colombier, M.; Sartor, O.; Garg, A.; Tiwari, V.; Burton, J.; Caetano, T.; Green, F.; Teng, F.; Wiseman, J. The 1.5°C target and coal sector transition: At the limits of societal feasibility. Clim. Policy 2018, 18, 335–351. [Google Scholar] [CrossRef]
  14. Zhao, S.; Alexandroff, A. Current and future struggles to eliminate coal. Energy Policy 2019, 129, 511–520. [Google Scholar] [CrossRef]
  15. Riahi, K.; Dentener, F.; Gielen, D.; Grubler, A.; Jewell, J.; Klimont, Z.; Krey, V.; McCollum, D.L. Chapter 17: Energy pathways for sustainable development. In Global Energy Assessment: Toward a Sustainable Future; GEA Writing Team, Ed.; Cambridge University Press: Cambridge, UK; IIASA: Laxenburg, Austria, 2012; pp. 1203–1306. [Google Scholar]
  16. Winkler, H.; Spalding-Fecher, R.; Tyani, L. Comparing developing countries under potential carbon allocation schemes. Clim. Policy 2002, 2, 303–318. [Google Scholar] [CrossRef]
  17. Kalkuhl, M.; Steckel, J.C.; Montrone, L.; Jakob, M.; Peters, J.; Edenhofer, O. Successful coal phase-out requires new models of development. Nat. Energy 2019, 4, 897–900. [Google Scholar] [CrossRef]
  18. Steckel, J.C.; Edenhofer, O.; Jakob, M. Drivers for the renaissance of coal. Proc. Natl. Acad. Sci. USA 2015, 112, E3775–E3781. [Google Scholar] [CrossRef] [PubMed] [Green Version]
  19. Cornot-Gandolphe, S. The Role of Coal in Southeast Asia’s Power Sector and Implications for Global and Regional Coal Trade. 2016. Available online: https://www.oxfordenergy.org/wpcms/wp-content/uploads/2016/12/The-role-of-coal-in-Southeast-Asias-power-sector-CL-4.pdf (accessed on 15 September 2019).
  20. Betz, M.R.; Partridge, M.D.; Farren, M.; Lobao, L. Coal mining, economic development, and the natural resources curse. Energy Econ. 2015, 50, 105–116. [Google Scholar] [CrossRef]
  21. Dutu, R. Challenges and policies in Indonesia’s energy sector. Energy Policy 2016, 98, 513–519. [Google Scholar] [CrossRef]
  22. Koplitz, S.N.; Jacob, D.J.; Sulprizio, M.P.; Myllyvirta, L.; Reid, C. Burden of disease from rising coal-fired power plant emissions in Southeast Asia. Environ. Sci. Technol. 2017, 51, 1467–1476. [Google Scholar] [CrossRef] [Green Version]
  23. Arinaldo, D.; Adiatma, J.C. Indonesia’s Coal Dynamics: Toward A Just Energy Transition. 2019. Available online: http://iesr.or.id/wp-content/uploads/2019/08/Indonesias-Coal-Dynamics_Toward-a-Just-Energy-Transition.pdf (accessed on 15 October 2019).
  24. Atteridge, A.; Aung, M.T.; Nugroho, A. Contemporary Coal Dynamics in Indonesia. 2018. Available online: https://www.sei.org/wp-content/uploads/2018/06/contemporary-coal-dynamics-in-indonesia.pdf (accessed on 17 June 2019).
  25. IEA. Coal Medium-Term Market Report 2015. Available online: https://webstore.iea.org/medium-term-coal-market-report-2015 (accessed on 17 August 2019).
  26. Wu, X.; Chen, G. Coal use embodied in globalized world economy: From source to sink through supply chain. Renew. Sustain. Energy Rev. 2018, 81, 978–993. [Google Scholar] [CrossRef]
  27. BP. BP Statistical Review of World Energy. 2018. Available online: https://www.bp.com/en/global/corporate/energy-economics/statistical-review-ofworld-energy.html (accessed on 3 February 2019).
  28. GEM. Global Coal Plant Tracker. 2019. Available online: https://endcoal.org/global-coal-plant-tracker/ (accessed on 18 September 2019).
  29. EEFA. Indonesia: 2019 Energy Plan Falls Short. 2019. Available online: https://ieefa.org/ieefa-indonesia-2019-energy-plan-falls-short/ (accessed on 24 September 2019).
  30. PLN. Electricity Supply Business Plan 2019–2028. 2019. Available online: http://alpha.djk.esdm.go.id/pdf/RUPTL/RUPTL%20PLN%202019-2028.pdf (accessed on 25 March 2019).
  31. Hamdi, E. The Case for System Transformation in Indonesia. 2019. Available online: https://ieefa.org/wp-content/uploads/2019/11/IEEFA_The-Case-for-System-Transformation-in-Indonesia_November-2019.pdf (accessed on 25 November 2019).
  32. Tumiwa, F.; Pujantoro, M.; Godron, P. A Roadmap for Indonesia’s Power Sector: How Renewable Energy Can Power Java-Bali and Sumatra. 2019. Available online: http://iesr.or.id/wp-content/uploads/2019/04/COMS-PUB-0021_A-Roadmap-for-Indonesia_s-Power-Sector.pdf (accessed on 24 October 2019).
  33. Kim, H.-M.; Yoo, S.-H. Coal consumption and economic growth in Indonesia. Energy Sources Part B Econ. Plan. Policy 2016, 11, 547–552. [Google Scholar] [CrossRef]
  34. Boulle, M. The hazy rise of coal in Kenya: The actors, interests, and discursive contradictions shaping Kenya’s electricity future. Energy Res. Soc. Sci. 2019, 56, 101205. [Google Scholar] [CrossRef]
  35. Kuchler, M.; Bridge, G. Down the black hole: Sustaining national socio-technical imaginaries of coal in Poland. Energy Res. Soc. Sci. 2018, 41, 136–147. [Google Scholar] [CrossRef]
  36. Wang, Q.; Li, R. Journey to burning half of global coal: Trajectory and drivers of China’s coal use. Renew. Sustain. Energy Rev. 2016, 58, 341–346. [Google Scholar] [CrossRef]
  37. MEMR. Handbook of Energy and Economic Statistics of Indonesia 2016; Ministry of Energy and Mineral Resources Indonesia: Jakarta, Indonesia, 2017. [Google Scholar]
  38. World-Bank. World Bank Data: Urban Population. 2019. Available online: https://data.worldbank.org/indicator/SP.URB.TOTL.in.zs (accessed on 3 February 2019).
  39. Kurniawan, R.; Sugiawan, Y.; Managi, S. Cleaner energy conversion and household emission decomposition analysis in Indonesia. J. Clean. Prod. 2018, 201, 334–342. [Google Scholar] [CrossRef]
  40. Avtar, R.; Tripathi, S.; Aggarwal, A.K.; Kumar, P. Population–Urbanization–Energy Nexus: A Review. Resources 2019, 8, 136. [Google Scholar] [CrossRef] [Green Version]
  41. Ang, B.W. LMDI decomposition approach: A guide for implementation. Energy Policy 2015, 86, 233–238. [Google Scholar] [CrossRef]
  42. Zhu, C.; Du, W. A Research on driving factors of carbon emissions of road transportation industry in six Asia-Pacific countries based on the LMDI Decomposition method. Energies 2019, 12, 4152. [Google Scholar] [CrossRef] [Green Version]
  43. Zhang, S.; Yang, F.; Liu, C.; Chen, X.; Tan, X.; Zhou, Y.; Guo, F.; Jiang, W. Study on global industrialization and industry emission to achieve the 2 °C goal based on MESSAGE model and LMDI approach. Energies 2020, 13, 825. [Google Scholar] [CrossRef] [Green Version]
  44. NEC. National Energy Policy in Indonesia and Its Alignment to SDGs and Paris Agreement; National Energy Council: Jakarta, Indonesia, 2019. [Google Scholar]
  45. IEA. Coal 2018: Analysis and Forecasts to 2023. 2018. Available online: https://www.iea.org/coal2018/ (accessed on 27 August 2019).
  46. MEMR. Handbook of Energy and Economic Statistics of Indonesia 2018. 2018. Available online: https://www.esdm.go.id/assets/media/content/content-handbook-of-energy-and-economic-statistics-of-indonesia-2018-final-edition.pdf (accessed on 3 March 2019).
  47. Cornot-Gandolphe, S. Indonesia’s Electricity Demand and the Coal Sector: Export or Meet Domestic Demand? 2017. Available online: https://www.oxfordenergy.org/publications/indonesias-electricity-demand-coal-sector-export-meet-domestic-demand/ (accessed on 26 October 2019).
  48. Chawla, Y.; Kowalska-Pyzalska, A.; Widayat, W. Consumer willingness and acceptance of smart meters in Indonesia. Resources 2019, 8, 177. [Google Scholar] [CrossRef] [Green Version]
  49. Suharsono, A.; Gencsu, I. G20 Coal Subsidies: Indonesia. 2019. Available online: https://www.odi.org/sites/odi.org.uk/files/resource-documents/12746.pdf (accessed on 30 November 2019).
  50. ADB. Republic of Indonesia: Sustainable and Inclusive Energy Program. 2018. Available online: https://www.adb.org/sites/default/files/project-documents/48323/48323-001-tacr-en_0.pdf (accessed on 29 October 2019).
  51. Market-Forces. Foreign Finance to Indonesian Coal. 2019. Available online: https://www.marketforces.org.au/research/indonesia/public-finance-to-indonesian-coal/ (accessed on 20 August 2019).
  52. Bridle, R. Missing the 23 Per Cent Target: Roadblocks to the Development of Renewable Energy in Indonesia. 2018. Available online: https://www.iisd.org/library/missing-23-cent-target-roadblocks-development-renewable-energy-indonesia (accessed on 25 November 2019).
  53. IRENA. Renewable Energy Prospects: Indonesia. In REmap 2030. 2017. Available online: https://www.irena.org/publications/2017/Mar/Renewable-Energy-Prospects-Indonesia (accessed on 20 September 2019).
  54. Abood, S.A.; Lee, J.S.H.; Burivalova, Z.; Garcia-Ulloa, J.; Koh, L.P. Relative contributions of the logging, fiber, oil palm, and mining industries to forest loss in Indonesia. Conserv. Lett. 2015, 8, 58–67. [Google Scholar] [CrossRef] [Green Version]
  55. Muhdar, M. Law aspect of coal mining reclamation in east Kalimantan Forestry. Mimb. Huk. Fak. Hukum Univ. Gadjah Mada 2015, 27, 472–486. [Google Scholar] [CrossRef] [Green Version]
  56. Arvirianty, A. 3000 Companies Have Not Submitted the Post-Mining Guarantee Fund. Consumer News and Business Channel Indonesia 2019. Available online: https://www.cnbcindonesia.com/news/20190711182742-4-84301/esdm-3000-perusahaan-belum-kasih-jaminan-pasca-tambang (accessed on 20 September 2019).
  57. Dwiki, S. Development of environmental policy in Indonesia regarding mining industry in comparison with the United States and Australia: The lesson that can be learned. Evergreen 2018, 5, 50–57. [Google Scholar] [CrossRef]
  58. Brigden, K.; Santillo, D.; Johnston, P. Metals in Coal Mining & Processing Wastewaters from Indonesia. 2014. Available online: https://www.greenpeace.org/archive-indonesia/PageFiles/645408/FULL%20REPORT%20Coal%20Mining%20Polluting%20South%20Kalimantan%20Water_Lowres.pdf (accessed on 27 September 2019).
  59. Son, M.; Anhäuser, A.; Sivalingam, N.; Farrow, A.; Myllyvirta, L. Double Standard: How Japan’s Financing of Highly Polluting Overseas Coal Plants Endangers Public Health. 2019. Available online: https://www.greenpeace.org/southeastasia/publication/2887/double-standard-how-japans-financing-of-highly-polluting-overseas-coal-plants-endangers-public-health/ (accessed on 25 October 2019).
  60. Sanchez, L.; Luan, B. The Health Cost of Coal in Indonesia. 2018. Available online: https://www.iisd.org/sites/default/files/publications/health-cost-coal-indonesia.pdf (accessed on 27 August 2019).
  61. Chen, H.; Doukas, A.; Schmidt, J.; Vollmer, S.L. The Carbon Trap: How International Coal Finance Undermines the Paris Agreement. Available online: https://www.nrdc.org/resources/carbon-trap-how-international-coal-finance-undermines-paris-agreement (accessed on 25 March 2019).
  62. Chung, Y. Overpaid and Underutilized: How Capacity Payments to Coal-Fired Power Plants Could Lock Indonesia into a High-Cost Electricity Future. 2017. Available online: http://ieefa.org/wp-content/uploads/2017/08/Overpaid-and-Underutilized_How-Capacity-Payments-to-Coal-Fired-Power-Plants-Could-Lock-Indonesia-into-a-High-Cost-Electricity-Future-_August2017.pdf (accessed on 25 March 2019).
  63. Hakko, H.; Lou, M. Uncertain and Harmful: Japanese Coal Investments in Indonesia. 2018. Available online: https://www.greenpeace.org/japan/sustainable/publication/2018/12/06/6544/ (accessed on 23 March 2019).
  64. PWC. Power in Indonesia: Investment and Taxation Guide November 2018. 2018. Available online: https://www.pwc.com/id/en/publications/assets/eumpublications/utilities/power-guide-2018.pdf (accessed on 17 September 2019).
  65. Tang, X.; Jin, Y.; McLellan, B.C.; Wang, J.; Li, S. China’s coal consumption declining—Impermanent or permanent? Resour. Conserv. Recycl. 2018, 129, 307–313. [Google Scholar] [CrossRef]
  66. De Oliveira-De Jesus, P.M. Effect of generation capacity factors on carbon emission intensity of electricity of Latin America & the Caribbean, a temporal IDA-LMDI analysis. Renew. Sustain. Energy Rev. 2019, 101, 516–526. [Google Scholar]
  67. Fujii, H.; Managi, S. Decomposition of toxic chemical substance management in three US manufacturing sectors from 1991 to 2008. J. Ind. Ecol. 2013, 17, 461–471. [Google Scholar] [CrossRef] [Green Version]
  68. Yang, J.; Zhang, W.; Zhang, Z. Impacts of urbanization on renewable energy consumption in China. J. Clean. Prod. 2016, 114, 443–451. [Google Scholar] [CrossRef]
  69. Ang, B.W.; Liu, N. Handling zero values in the logarithmic mean Divisia index decomposition approach. Energy Policy 2007, 35, 238–246. [Google Scholar] [CrossRef]
  70. Tanoto, Y.; Praptiningsih, M. Factors decomposition of Indonesia’s household electricity consumption. Eng. J. 2013, 17, 19–28. [Google Scholar] [CrossRef] [Green Version]
  71. Chen, J.J.; Pitt, M.M. Sources of change in the demand for energy by Indonesian households: 1980–2002. Energy Econ. 2017, 61, 147–161. [Google Scholar] [CrossRef] [Green Version]
  72. Wang, H.; Zhou, P.; Xie, B.C.; Zhang, N. Assessing drivers of CO2 emissions in China’s electricity sector: A metafrontier production-theoretical decomposition analysis. Eur. J. Oper. Res. 2019, 275, 1096–1107. [Google Scholar] [CrossRef]
  73. Chen, L.; Duan, Q. Decomposition analysis of factors driving CO2 emissions in Chinese provinces based on production-theoretical decomposition analysis. Nat. Hazards 2016, 84, 267–277. [Google Scholar] [CrossRef]
  74. Wang, M.; Feng, C. Exploring the driving forces of energy-related CO2 emissions in China’s construction industry by utilizing production-theoretical decomposition analysis. J. Clean. Prod. 2018, 202, 710–719. [Google Scholar] [CrossRef]
  75. Su, B.; Ang, B.W.; Li, Y. Input-output and structural decomposition analysis of Singapore’s carbon emissions. Energy Policy 2017, 105, 484–492. [Google Scholar] [CrossRef]
  76. Wei, J.; Huang, K.; Yang, S.; Li, Y.; Hu, T.; Zhang, Y. Driving forces analysis of energy-related carbon dioxide (CO2) emissions in Beijing: An input–output structural decomposition analysis. J. Clean. Prod. 2017, 163, 58–68. [Google Scholar] [CrossRef]
  77. Yuan, R.; Zhao, T. Changes in CO2 emissions from China’s energy-intensive industries: A subsystem input–output decomposition analysis. J. Clean. Prod. 2016, 117, 98–109. [Google Scholar] [CrossRef]
  78. Jeroen, R. Comparing structural and index decomposition analysis. Energy Econ. 2003, 25, 39–64. [Google Scholar]
  79. Ang, B.W.; Zhang, F.Q. A survey of index decomposition analysis in energy and environmental studies. Energy 2000, 25, 1149–1176. [Google Scholar] [CrossRef]
  80. Rüstemoğlu, H.; Andrés, A.R. Determinants of CO2 emissions in Brazil and Russia between 1992 and 2011: A decomposition analysis. Environ. Sci. Policy 2016, 58, 95–106. [Google Scholar] [CrossRef]
  81. Sun, J. Changes in energy consumption and energy intensity: A complete decomposition model. Energy Econ. 1998, 20, 85–100. [Google Scholar] [CrossRef]
  82. Reddy, B.S.; Ray, B.K. Understanding industrial energy use: Physical energy intensity changes in Indian manufacturing sector. Energy Policy 2011, 39, 7234–7243. [Google Scholar] [CrossRef] [Green Version]
  83. Zhang, M.; Bai, C.; Zhou, M. Decomposition analysis for assessing the progress in decoupling relationship between coal consumption and economic growth in China. Resour. Conserv. Recycl. 2018, 129, 454–462. [Google Scholar] [CrossRef]
  84. Chong, C.; Ma, L.; Li, Z.; Ni, W.; Song, S. Logarithmic mean Divisia index (LMDI) decomposition of coal consumption in China based on the energy allocation diagram of coal flows. Energy 2015, 85, 366–378. [Google Scholar] [CrossRef]
  85. Lan, J.; Malik, A.; Lenzen, M.; McBain, D.; Kanemoto, K. A structural decomposition analysis of global energy footprints. Appl. Energy 2016, 163, 436–451. [Google Scholar] [CrossRef]
  86. Wang, Q.; Zeng, Y.-E.; Wu, B.-W. Exploring the relationship between urbanization, energy consumption, and CO2 emissions in different provinces of China. Renew. Sustain. Energy Rev. 2016, 54, 1563–1579. [Google Scholar] [CrossRef]
  87. Yeo, Y.; Shim, D.; Lee, J.D.; Altmann, J. Driving Forces of CO2 Emissions in Emerging Countries: LMDI Decomposition Analysis on China and India’s Residential Sector. Sustainability 2015, 7, 16108–16129. [Google Scholar] [CrossRef] [Green Version]
  88. Chong, C.H.; Tan, W.X.; Ting, Z.J.; Liu, P.; Ma, L.; Li, Z.; Ni, W. The driving factors of energy-related CO2 emission growth in Malaysia: The LMDI decomposition method based on energy allocation analysis. Renew. Sustain. Energy Rev. 2019, 115, 109356. [Google Scholar] [CrossRef]
  89. OECD. Coal-Fired Heat and Electricity Generation Efficiency. 2015. Available online: https://www.oecd-ilibrary.org/economics/oecd-economic-surveys-indonesia-2015/coal-fired-heat-and-electricity-generation-efficiency-2011_eco_surveys-idn-2015-graph50-en (accessed on 17 April 2019).
  90. Pambudi, N.A. Geothermal power generation in Indonesia, a country within the ring of fire: Current status, future development and policy. Renew. Sustain. Energy Rev. 2018, 81, 2893–2901. [Google Scholar] [CrossRef]
  91. Fan, K.; Nam, S. Accelerating Geothermal Development in Indonesia: A Case Study in the Underutilization of Geothermal Energy. Consilience 2018, 19, 103–129. [Google Scholar]
  92. Rakhmadi, R.; Haesra, A.; Wijaya, M.E. Climate Policy Initiative Energizing Renewables in Indonesia: Optimizing Public Finance Levers to Drive Private Investment. 2018. Available online: https://climatepolicyinitiative.org/publication/energizing-renewables-in-indonesia-optimizing-public-finance-levers-to-drive-private-investment/ (accessed on 5 November 2019).
  93. Sugiawan, Y.; Managi, S. The environmental Kuznets curve in Indonesia: Exploring the potential of renewable energy. Energy Policy 2016, 98, 187–198. [Google Scholar] [CrossRef] [Green Version]
  94. World-Bank. Indonesia: Toward Universal Access to Clean Cooking. 2013. Available online: http://documents.worldbank.org/curated/en/105441468044144806/Indonesia-Toward-universal-access-to-clean-cooking (accessed on 27 August 2019).
  95. Sukarno, I.; Matsumoto, H.; Susanti, L.; Kimura, R. Urban energy consumption in a city of Indonesia: General overview. Int. J. Energy Econ. Policy 2015, 5, 360–373. [Google Scholar]
  96. Tewathia, N. Determinants of the household electricity consumption: A case study of Delhi. Int. J. Energy Econ. Policy 2014, 4, 337–348. [Google Scholar]
  97. Batih, H.; Sorapipatana, C. Characteristics of urban households’ electrical energy consumption in Indonesia and its saving potentials. Renew. Sustain. Energy Rev. 2016, 57, 1160–1173. [Google Scholar] [CrossRef]
  98. Bloch, H.; Rafiq, S.; Salim, R. Coal consumption, CO2 emission and economic growth in China: Empirical evidence and policy responses. Energy Econ. 2012, 34, 518–528. [Google Scholar] [CrossRef]
  99. Jones, G.W. Migration and Urbanization in China, India and Indonesia: An Overview. In Contemporary Demographic Transformations in China, India and Indonesia; Springer: Cham, Switzerland, 2016; pp. 271–276. [Google Scholar]
  100. IEA. Reducing Emissions from Fossil-Fired Generation Indonesia, Malaysia and Viet Nam. 2016. Available online: https://webstore.iea.org/insights-series-2016-reducing-emissions-in-fossil-fired-generation-indonesia-malaysia-and-viet-nam (accessed on 4 May 2019).
  101. Campbell, I.; Kalanki, A.; Sachar, S. Solving the Global Cooling Challenge. Available online: http://rmi.org/wp-content/uploads/2018/11/Global_Cooling_Challenge_Report_2018.pdf (accessed on 7 December 2019).
  102. Thomas, S.; Thema, J.; Brischke, L.A.; Leuser, L.; Kopatz, M.; Spitzner, M. Energy sufficiency policy for residential electricity use and per-capita dwelling size. Energy Effic. 2019, 12, 1123–1149. [Google Scholar] [CrossRef] [Green Version]
Figure 1. Annual coal consumption growth of the top ten coal consumers (2008–2017), adapted from: BP [27].
Energies 13 03660 g001
Figure 2. Shares of domestic coal consumption in Indonesia in 2016.
Energies 13 03660 g002
Figure 3. Actual and projected total electricity generation in Indonesia by source. Adapted from: [30,45].
Energies 13 03660 g003
Figure 4. Coal production and consumption, adapted from: BP [27].
Energies 13 03660 g004
Figure 5. Ratios of coal consumption (relative to total energy consumption) and urban population (relative to total population).
Energies 13 03660 g005
Figure 6. The accumulated effect of coal consumption drivers in Indonesia 1965–2017.
Energies 13 03660 g006
Figure 7. Decomposition of annual coal consumption growth.
Energies 13 03660 g007
Table 1. Key studies employing the decomposition approach in the energy sector.
Authors [Reference]MethodPeriodsScopeFinding
Wang et al. [72]PDA2005–2010ChinaPower plant emissions have been reduced by varying degrees due to different technologies.
Wang and Feng [74]PDA2000–2014ChinaEmissions of the construction industry have increased in all provinces.
Chen and Duan [73]PDA2001–2010ChinaThe factors contributing to a reduction in CO2 emissions growth are technical efficiency, technological progress, and change in the output structure.
Wei et al. [76]SDA2000–2010China (Beijing)Increased emissions in Beijing were mainly caused by the metal and non-metal mining industries, power plants/utility sector and the construction industry.
Yuan and Zhao [77]SDA2000–2010ChinaThe main driver of decreasing emission in energy intensive industries is the technological effect.
Lan et al. [85]SDA1990–2010GlobalPopulation and affluence are the main driving forces of the energy footprint.
Wang et al. [86]SDA1997–2012ChinaIndustrial sector enhancement can significantly reduce coal consumption.
Tang et al. [65]IDA: LMDI1997–2014ChinaIndustrial structure shifting has compacted coal consumption significantly since 2012.
Zhang et al. [83]IDA: LMDI1991–2013ChinaThe industrial sector was the largest final user of coal, while power generation was the biggest coal consumer among all transformation sectors.
Yang et al. [68]IDA: LMDI1990–2012ChinaThe energy mix effect increased renewable energy consumption.
Chong et al. [84]IDA: LMDI2001–2011ChinaCoal consumption has primarily been driven by the expansion of heavy industry.
Yeo et al. [87]IDA: LMDI1990–2011China and IndiaThe energy intensity effect is the main driving force of CO2 emissions reduction in the household sectors.
Chong et al. [88]IDA: LMDI1978–2014MalaysiaEnd-use fuel-mix changes increased CO2 emissions in Malaysia
Reddy and Ray [82]IDA: Sun’s method1991–2005IndiaThe energy intensity effect has reduced energy consumption in all industries, except textiles.

