Article

Acoustic Emission Characteristics and Damage Evolution of Rock under Different Loading Modes

1
State Key Laboratory of Hydraulics and Mountain River Engineering, Sichuan University, Chengdu 610065, China
2
College of Water Resource & Hydropower, Sichuan University, Chengdu 610065, China
3
MOE Key Laboratory of Deep Earth Science & Engineering, Sichuan University, Chengdu 610065, China
*
Authors to whom correspondence should be addressed.
Energies 2020, 13(14), 3649; https://doi.org/10.3390/en13143649
Submission received: 17 June 2020 / Revised: 11 July 2020 / Accepted: 13 July 2020 / Published: 15 July 2020
(This article belongs to the Section H: Geo-Energy)

Abstract

:
To study the evolution of acoustic emission (AE) parameters and the differences in the fracturing and failure process of rocks under different loading modes, AE signals of marble were detected during uniaxial compression tests (UCTs), direct tensile tests (DTTs) and indirect tensile tests (ITTs) in this paper. Then, the temporal and spatial evolution of the AE parameters and damage development of rock under different loading modes were analyzed. The results showed that the sequence of total AE events and AE counts under different loading modes was UCT > DTT > ITT. In the DTT and ITT, the energy release of AE signals was concentrated at the peak stress and weakened rapidly afterward, whereas in the UCT, there were still a large number of AE signals accompanied by violent AE energy release during the postpeak stage. The generation mechanism of AE sources in rock and the corresponding failure modes were different under different loading modes. In the UCT, the multiple cleavage fractures were mainly caused by compression-induced fracturing. In the DTT, the single fracture surface was generated by tensile stress, whereas in the ITT, compressive-tensile stress was applied to the fracture surface. In addition, the stress levels at which the b-value and the spatial fractal dimension Ds of AE events decreased dramatically were consistent under the different loading modes, and the sequence was UCT < DTT < ITT. According to the changes in AE parameters during the whole process of rock deformation and failure, the first and second precursor points before failure were defined to distinguish the development of microfracture damage and failure processes in rocks under the different loading modes. The above results have certain significance for future studies on the monitoring of surrounding rock instability and failure prediction.

Graphical Abstract

1. Introduction

Acoustic emission (AE) is a phenomenon in which a material releases local transient elastic waves due to the rapid release of energy. Caused by a nonuniform stress distribution, AE is a stress relaxation phenomenon that occurs when a material transitions from an unstable high-energy state to a stable low-energy state [1]. In engineering practice, AE monitoring is widely used in indoor and engineering-scale microfracture monitoring because it enables continuous, real-time monitoring of the generation, expansion and penetration of microfractures in rocks [2,3].
Many studies have been carried out on the factors that influence AE characteristics, wherein the research methods include both laboratory experiments [4,5,6] and numerical simulations [7,8,9]. Existing research mainly focuses on the AE characteristics of rock under a single loading mode, such as uniaxial compression, triaxial compression, indirect tensile and cyclic loading. However, in reality, rock masses are often subjected to different loading modes at the same time, resulting in differences in damage, deformation and failure modes. Accordingly, there are significant differences in the AE characteristics of rock masses. Therefore, it is necessary to systematically study the effects of different loading methods on the AE characteristics of rock.
Liu et al. [10] studied the spatial and temporal variations in the AE characteristics of Beishan granite during a direct tensile test (DTT) and an indirect tensile test (ITT). They postulated that because of the existence of both tension and compression zones, the number of AE events during ITT was much greater than that during DTT. Wang et al. [11] studied the AE characteristics of karst limestone during a uniaxial compression test (UCT) and a triaxial compression test and considered that the AE activity gradually increased as the external load increased under uniaxial compression, whereas under triaxial compression, the effect of the confining pressure increased the integrity and stiffness of the rock sample, and the AE activity decreased sharply before reaching the peak stress. Zhang et al. [12] studied the fractal characteristics of the spatial and temporal distributions of AE events in rock subjected to uniaxial and triaxial compression, wherein they found that the fractal dimension of the AE spatial distribution exhibited an increasing trend and the fractal dimension of the AE temporal distribution exhibited an increasing-decreasing trend. Chmel et al. [13] analyzed the AE characteristics of granite samples under uniaxial compression and uniaxial impact loading. Their results showed that the AE distribution was similar under the two loading conditions; however, the AE amplitude was lower and the number of AE events was greater under impact loading.
The AE phenomena generated by rock represent the process of internal microvoids and microfractures growing or merging under an external load; hence, these phenomena are associated with the development of rock damage. There is an inseparable correlation between AE and rock damage, and AE events can be used to characterize the microdamage evolution in rock [14]. Some studies have been carried out to explore the correlation between AE and damage evolution in rock masses. Obtsu [15] and Dai [16] analyzed AE phenomenon in brittle materials and proposed a model for evaluating and diagnosing material damage based on AE experiments. By studying the results of uniaxial and triaxial compression tests of Beishan granite, Zhao et al. [17] proposed a correlation between the change in the number of AE hits and damage degradation of rock. On the basis of continuum damage mechanics (CDM), Tang et al. [18] suggested that damage in rock was consistent with the cumulative number of AE events; moreover, they constructed a damage model to explain the AE events and the Kaiser effect in rock under uniaxial compression by assuming that the strength of local elements in rock follows a Weibull distribution. Currently, much research has been carried out upon the damage evolution characteristics and fracturing behavior of rock [19,20,21,22] and rock-like materials, such as concrete [23,24].
Although many studies have been performed on the AE characteristics of rock under various loading methods, there is still a lack of systematic research on the comparison of AE characteristics between the two main stress states—tension and compression—and the corresponding damage evolution. Therefore, in this paper, AE signals of marble were detected during tests under three different loading modes: a UCT, a DTT and an ITT. The AE spatial and temporal characteristics, position distribution and energy release parameters of rock under the different loading modes were analyzed, and the damage evolution and failure precursor information of rock under the different loading modes were explored and revealed. The research results provide some reference for the monitoring of AE stability of surrounding rock and the prediction of rock failure.

2. Experimental Methods and Techniques

2.1. Sample Preparation

The rock samples used in this study are pure white marble acquired from the same block. The main component of the marble is calcite. Moreover, the marble has a uniform fine-grained structure with an average density of 2.66 g/cm3. Photographs of the test samples are shown in Figure 1.
According to the recommendations of the International Society for Rock Mechanics (ISRM), a cylindrical specimen with dimensions of Φ 50 mm × 100 mm was selected for the uniaxial compression test (UCT). A “dog-bone” sample with an outer diameter of 50 mm, an inner diameter of 25 mm and a height of 100 mm was adopted for the direct tensile test (DTT). The Brazil splitting test method was used for the indirect tensile test (ITT), for which a cylindrical sample with dimensions of Φ 50 mm × 25 mm was adopted. The parallelism, flatness and perpendicularity of each sample were in accordance with the experimental regulations, and the strength of test samples under one loading mode is close to each other, so that the similarity of the samples under different loading modes could be ensured and checked. The details of the test samples are shown in Table 1.

2.2. Testing Equipment

The MTS815 rock mechanics testing system was adopted in this paper. This system can carry out the entire testing process, namely the conventional compression tests, triaxial compression tests, three-point bending tests, DTTs and ITTs of brittle materials, including rocks. This system can provide a maximum compressive force of 4600 kN, a maximum tensile force of 2300 kN, and an axial displacement of up to 100 mm.
The acoustic emission (AE) acquisition system produced by Physical Acoustics was adopted as the AE measurement system. This system has an 18-bit A/D converter and a 1 kHz–3 MHz bandwidth frequency range and can continuously record waveforms at 10 MS/s. Moreover, in this system, the maximum signal amplitude is 100 dB, and the dynamic range is greater than 85 dB. This system enabled the AE parameters and waveforms to be continuously collected and analyzed.

2.3. Testing Method

In this paper, UCTs, DTTs and ITTs were performed under AE monitoring. To consider the influence of the different loading modes, the other experimental conditions were kept as constant as possible.
In the UCT, axial and circumferential deformation was monitored by extensometers, and the loading rate was 30 kN/min until the rock sample failed. Before the experiment, six AE sensors were attached to the surface of the rock sample, as shown in Figure 2a, and the AE threshold was set to 40 dB.
In the DTT and ITT, the maximum load was set to 25 kN, and the displacement rate was 0.005 mm/min until the rock sample failed. In the DTT, six AE sensors were attached to the surface of the rock sample, as shown in Figure 2a, and the AE threshold was set to 40 dB.
In the ITT, the Brazilian splitting test method recommended by the ISRM test standard was adopted. During the experiment, a concentrated load was applied along the diameter of the cylindrical sample. After the sample was stressed, it may crack along the diameter. The radial deformation of the specimen was measured by a linear variable differential transformer (LVDT) placed at the bottom of the test bench. According to elastic mechanics, the tensile strength of the sample and the maximum compressive stress at the center of the cylindrical sample can be calculated as follows:
σ t = 2 P π D h [ sin 2 α α 1 ] 2 P π D h
σ c = 2 P π D h [ sin 2 α α + 1 ] 6 P π D h
where σ t is the indirect tensile strength, MPa; σ c is the maximum compressive stress in the center of the cylindrical sample, MPa; P is the peak load of the failed sample, N; D is the sample diameter, mm; and h is the sample height, mm. The entire experimental process was controlled by the machine displacement, and the displacement rate was set to 0.005 mm/min until the rock sample failed. Six AE sensors were attached to the surface of the rock sample. The spatial locations of the sensors are shown in Figure 2b, and the AE threshold was set to 40 dB.

3. Temporal and Spatial Evolution of Acoustic Emission (AE) Parameters under Different Loading Modes

3.1. Temporal Evolution of AE Parameters under Different Loading Modes

The AE parameters are used to characterize AE variation. In this paper, a typical sample is selected for each loading method and analyzed by four parameters—AE ring count, AE ring count rate, cumulative AE energy and AE energy rate—to reveal the influence of different loading modes on AE characteristic parameters and their mechanism, as shown in Figure 3.
(1) In the uniaxial compression test (UCT), direct tensile test (DTT) and indirect tensile test (ITT), the damage acceleration points of rock characterized by AE are different. The sequence of the damage acceleration points of the three different loading modes is UCT < DTT < ITT. As shown in Figure 4, there are 1059 AE events at a 20% stress level in the UCT, there are 483 AE events at a 70% stress level in the DTT and there are only 208 AE events at a 70% stress level in the ITT.
This phenomenon could be explained as follows. Due to the lack of primary fracture closure at the beginning of loading in the DTT, the AE events appeared later in the DTT than in the UCT. In the ITT, the loading area of the sample was much smaller; therefore, a small range of compression-induced fractures will first occur at the end of the specimen [10]. At high stress levels, the fractures eventually continued to propagate forward, resulting in the latest large-scale damage acceleration among the three loading conditions.
(2) In the DTT and ITT, the marble exhibited more obvious brittle fracture behavior at the peak load, and the AE count rate and energy rate showed a single peak, which appeared at the tensile stress peak. However, in the UCT, the AE count rate showed multiple peaks, the AE energy rate showed two peaks, and the AE peak appeared mainly after the stress peak. In the UCT, there were still large numbers of AE signals after the peak, which were accompanied by violent AE energy release. In the DTT and ITT, the stress peak was also the point of AE energy accumulation and release, and the AE signals rapidly weakened after the peak.
These findings indicated that in tensile and compression experiments of marble, the “time” that large numbers of microfractures coalesce and form a macrofracture surface is different. In tensile tests, this “time” mainly occurs at the peak stress, whereas it is mainly located in the postpeak section where stress is decreasing in compression tests. By observing the change in AE energy over time in the DTT and ITT, it was found that the AE energy in the ITT exhibited multiple steps before the peak, and the first step appeared at a 50% stress level. At this moment, due to the uneven internal stress distribution in the marble, a large number of microcracks propagated in the stress concentration area. The calcite grains fractured and released the accumulated energy. Later, due to the unstable penetration of the microfractures, many small steps appeared before the peak. The AE energy in the DTT exhibited a large single release near the peak load, indicating that the failure of marble during the DTT was more sudden, the energy release was more concentrated and the crack propagation was more rapid.
(3) Different loading modes resulted in different energy release characteristics within the rock, and the AE events, AE counts and AE energy varied greatly. For this fine-grained homogeneous marble, the sequence of total AE events and AE counts during failure under different loading modes was UCT > DTT > ITT, as shown in Figure 4. The sequence of the rock strength under the different loading methods was also UCT > DTT > ITT. The average uniaxial compression strength was 79.15 MPa, which is approximately 14 times the direct tensile strength and 52 times the indirect tensile strength. These findings indicated that the energy release calculated by AE counts exhibited a trend consistent with that of the rock strength under the different loading modes. The sequence of accumulated AE energy under the different loading modes was UCT > ITT > DTT. This phenomenon occurred because transgranular fracture was the main failure mode during the ITT, which requires much more energy than intergranular fracture, which is the main failure mode in the DTT [25].

3.2. Differences in the Spatial Evolution of AE Events and Their Failure Patterns under Different Loading Modes

AE activity is essentially a statistical law, which is consistent with the statistical distribution of the internal defects within the material, and this activity could characterize the evolution of material deformation and damage. In this paper, the spatial distribution and evolution of AE events of marble under different loading modes were located and acquired by six sensors with different locations to determine the internal damage evolution, as shown in Figure 5.
It can be seen that in early-stage loading (0–40% stress level), the number of AE events was the largest in the UCT. According to the AE counts and AE energy in Figure 3 and Figure 4, it was found that in early-stage loading, most of the AE events in the UCT were small-energy events, for which the number was large and steadily increasing, whereas the number of AE events was relatively small in the DTT and ITT. This phenomenon occurred because the deformation in the DTT and ITT was mostly dominated by elastic compression and early-stage loading, whereas in the UCT, the deformation was the combined effect of primary microcrack healing and elastic compression during this period.
When the axial loading entered middle-stage loading (40–100% stress level), the number of AE events in the UCT showed an obvious “quiet period” with fewer AE events and less energy, indicating that an internal stress redistribution occurred in this period after experiencing elastic energy accumulation in early-stage loading. However, when the axial load was near the peak, the AE events in the DTT and ITT mostly occurred near the primary damage position. The nucleation effect was obvious, and the microcracks expanded rapidly.
There were still many AE events in the postpeak stage. In the UCT, the energy accumulated during the prepeak stage was released after the peak load. At this time, the quantity of AE events was decreasing while the energy per event was increasing. In the DTT and ITT, when the postpeak stress level reached 90%, the quantity of AE events decreased sharply, most of the energy was released, and the rock was completely destroyed.
By selecting a typical rock sample under each loading mode and comparing its macroscopic failure morphology with the three-dimensional AE distribution, it was found that in the experiments where the failure mode was relatively simple (i.e., in the DTT and ITT), the concentrated area of AE events was coincident with the macroscopic fracture, indicating that AE events were a clear indication of fracture under these loading modes. However, in the UCT, as macroscopic failure was generated by multiple compression-induced fracture surfaces parallel to the loading direction, the spatial location of the microfractures could not accurately reflect the eventual failure mode of the rock, and there was no clustering of AE events.
Therefore, according to the amount of energy released from each AE event, the spatial positioning points of AE events were represented by different colors and sizes, as shown in Figure 6a. The larger the size was, the greater the energy released by this AE event. The information in this figure was used to determine the spatial location of the AE event corresponding to the main macroscopic fracture direction in the UCT. It is known from the localization diagram in Figure 6a that the spatial distribution of AE events shown in red with maximum released energy matches the macroscopic fracture of the marble. This shows that exploring the law of AE energy and finding the AE event corresponding to the main macroscopic fracture are of great significance to tracking crack propagation, tracing macroscopic fracture formation and predicting rock failure.
The abovementioned analysis showed that for the same rock, due to the different loading modes, the stress state and the failure mode were different. In the UCT, multiple cleavage fractures were mainly caused by compression-induced fracture. In the DTT, the fracture surface was subjected to tensile stress, whereas in the ITT, compressive-tensile stress was applied to the fracture surface. Due to the difference in stress state and failure mode, the generation mechanism and parameters of the AE signals will be different and will be manifested as significant differences in characteristics such as the AE energy. It was revealed that under different loading modes, the rock strength was consistent with the variation in the AE energy release. This finding shows that AE, a phenomenon associated with rock damage and failure, is an inherent property and a mechanical parameter of the rock.

3.3. AE b-Value Analysis Based on AE Amplitude under Different Loading Modes

The AE amplitude represents the maximum amplitude of a single AE event and is directly related to the strength of the AE event. Since the AE amplitude is not affected by the threshold, studying the distribution of the AE amplitude under different loading modes can enhance the understanding of the damage and fracture mechanisms of rocks under different loading modes.
The b-value, which originated from B. Gutenberg and C. F. Richter in 1944 and was originally designed to characterize the correlation between earthquake magnitude and frequency, can be used to describe the AE amplitude distribution [26]. The magnitude-frequency correlation has always been recognized as a regional indicator of seismicity, which exhibits linear growth, and the absolute value of the slope is the b-value [2]. Previous studies have extended the applicability of the b-value beyond seismology. If a microfracture generated in rock is regarded as a microseismic event, the seismic magnitude can be replaced by the logarithm of the AE amplitude. Therefore, it is possible to study the evolution of the b-value during rock deformation and failure under different loading modes and calculate the b-value by using the following equation [21]:
lg N ( A ) = a b lg A
where A is the amplitude (dB) of the AE event during loading and N(A) is the total number of AE events greater than (and including) amplitude A during loading.
Currently, the AE b-value has been widely adopted in both rock materials [27,28] and concrete [29] for micro-fracture evaluation. And by using Equation (3) and the AE data obtained in the experiments, the AE b-values could be calculated, and the results are shown in Figure 7. Existing studies found that the AE b-value is closely related to the size of microfractures inside the rock. A larger b-value usually indicates that the rock is mainly dominated by small-scale microfractures, whereas a smaller b-value usually indicates that the rock is dominated by large-scale microfractures [3]. Therefore, the b-value can be used to describe the microfracture evolution in marble at different stress stages and under different loading modes.
Generally, the AE b-value of marble in the UCT was significantly larger than that in the DTT and ITT. This finding indicated that in the UCT, small-amplitude AE events were dominant, whereas under the tensile stress state, large-amplitude AE events were dominant. The main reason for this difference was that under compressive stress conditions, a large number of microfractures contributed to macroscopic failure, whereas under tensile stress conditions, high-energy microfractures led to a rapid failure process.
From the overall trend, the AE b-value of marble under the three different loading modes decreased as the stress level increased. This trend indicated that with the increase in stress level, the high-amplitude AE events increased substantially, showing that low-amplitude microfracture events occurred first in the marble under the three different loading modes. When the stress increased to a certain level, the amplitude of the microfracture events increased, and the fractures penetrated to form the macroscopic failure.
The AE b-values all experienced a significant decrease period in all three loading modes. Zeng et al. and Lei et al. showed that a decrease in b-value indicates the intense interaction of fractures within the rock, indicating that the rock is about to destabilize and failure may occur soon [30,31]. The stress level at which the AE b-value began to decrease substantially under three loading modes was 30% in the UCT, 40% in the DTT and 50% in the ITT, reflecting the process of microfracture development and rock instability.

3.4. Spatial Fractal Dimension Ds of AE Events Based on The Column Covering Method under Different Loading Modes

The failure of the rock under loading was mainly related to the generation and expansion of fractures. By analyzing the spatial distribution of AE events, the fracture and damage law of rock could be determined. In this paper, the column covering method was adopted to calculate the fractal dimension Ds of the AE events. Specifically, by taking the center of the cylindrical rock sample as the base point and choosing a small cylinder proportional to the aspect ratio (height-to-diameter ratio) of the specimen, the number of AE events covered in each cylinder could be counted by proportionally expanding the radius r and height h of the small cylinder at the same time. The fractal dimension of AE events can be calculated by Equation (4).
lg M ( r ) = lg C + D lg r
where r is the radius of the small cylinder and M(r) is the number of AE events within the small cylinder. By drawing the curve in logarithmic coordinates and fitting the linear segment by the least-squares method, the correlation between the spatial fractal dimension Ds of AE events and the stress level under different loading modes could be obtained, as shown in Figure 8.
Figure 8 shows that under the three different loading modes, the spatial fractal dimensions all exhibited a decreasing trend accompanied by a steep drop. Zhang et al. [12] showed that an obvious decrease in Ds indicates that new microfractures are generated parallel to the loading axis and that the original isolated random microfractures gradually concentrated to a certain domain (fracture surface), indicating the critical state of rock instability. The stress levels where the spatial fractal dimension Ds of AE events dropped dramatically under the three loading modes were 30% in the UCT, 40% in the DTT and 60% in the ITT. This sequence was coincident with the sequence of damage acceleration points in Section 3.1, indicating that the change in the fractal dimension under the different loading modes can reflect the damage evolution inside the rock to a certain extent. Therefore, the spatial fractal dimension Ds could be adopted to characterize and predict rock damage and failure.

4. Discussion and Precursor Information of Failure under Different Loading Modes

Based on the analysis of the acoustic emission (AE) parameters, the precursor information of rock under the different loading modes could be obtained, and the rock failure could be predicted accordingly.
First, according to the temporal and spatial evolution of the AE parameters in Section 3, in the uniaxial compression test (UCT), a peak occurred in both the AE count rate and the energy rate during the prepeak loading stage. Therefore, the first precursor point before failure could be defined for the UCT, and it was at a stress level of approximately 30%, as shown in Table 2. By comparison with the stress level of the rock at the volumetric dilatation point, it was found that in UCT, the first precursor point before failure was earlier than the rock volumetric dilatation point.
Second, as few fractures were compacted in the direct tensile test (DTT), when the stress level was low (0–40%), no high AE count rate or energy rate was observed. According to Figure 3(b2) and Figure 3(b4), at a higher stress level, a more obvious “active period” phenomenon appeared in both the AE count rate and the AE energy rate. This indicated that the internal microfractures penetrated and began to release energy centrally, which could also be recognized as damage exacerbation. Therefore, the first precursor point of rock before failure in the DTT was defined as the starting stress level of the “active period” of the AE count rate (or energy rate); the definition was similar in the indirect tensile test (ITT). Additionally, in the ITT, the first precursor point of rock before failure could reflect the local tensile stress concentration and the stress level of the initial damage zone formation, which have obvious physical significance.
By calculating the stress level at which the AE b-value and the fractal dimension Ds decreased dramatically (Table 3) and comparing the first precursor points in Table 2, it was found that the first precursor point defined by the AE parameters under the three loading modes was within the great change range of the AE b-value and the fractal dimension Ds and could therefore indicate the unstable growth of rock microfracture. The first precursor point was one of the landmark events in the whole process of rock damage and failure.
In addition, when the sample was about to reach the peak stress level, the AE spatial and temporal parameters had obvious characteristic events. The initial stress of this event was defined as the second precursor point of rock failure (Table 4). In the DTT and ITT, near the peak load, a peak occurred in both the AE count rate and the AE energy rate. This peak in AE parameters represented impending failure in the rock sample. Therefore, the second precursor point of rock in the DTT and ITT could be defined as the peak value of the AE count rate or energy rate in the prepeak stage. However, in the UCT, when the stress level was about to reach the peak, the AE count rate and energy rate showed a “quiet period”, indicating that a large number of microfractures were generated and accumulated in the prepeak compression stage. At this moment, the internal stress field was further adjusted to reach a new equilibrium state, and the internal energy of the sample will soon be released. Therefore, in the UCT, the second precursor point could be defined as the starting stress level of the quiet period of the AE count rate/AE energy rate.
Table 2 and Table 4 show that the first precursor point of rock failure corresponds to the turning point of the internal fracture growth from stable to unsteady expansion, whereas the second precursor point of rock failure corresponds to the internal fracture from unsteady expansion to macroscopic failure. The two precursor points can reflect the whole process of damage development within the rock. The abovementioned conclusions were only based on the experimental results of marble in this paper, and the universal conclusions need to be further verified.

5. Conclusions

In this paper, the MTS815 rock mechanics experiment system and the PCI-2 AE monitoring system were adopted to perform UCTs, DTTs and ITTs on marble under AE monitoring experiments. The spatial and temporal evolution of the AE parameters under the three different loading modes were revealed. On this basis, the first and second precursor points of rock failure based on the AE parameters were defined.
The main conclusions were as follows:
(1)
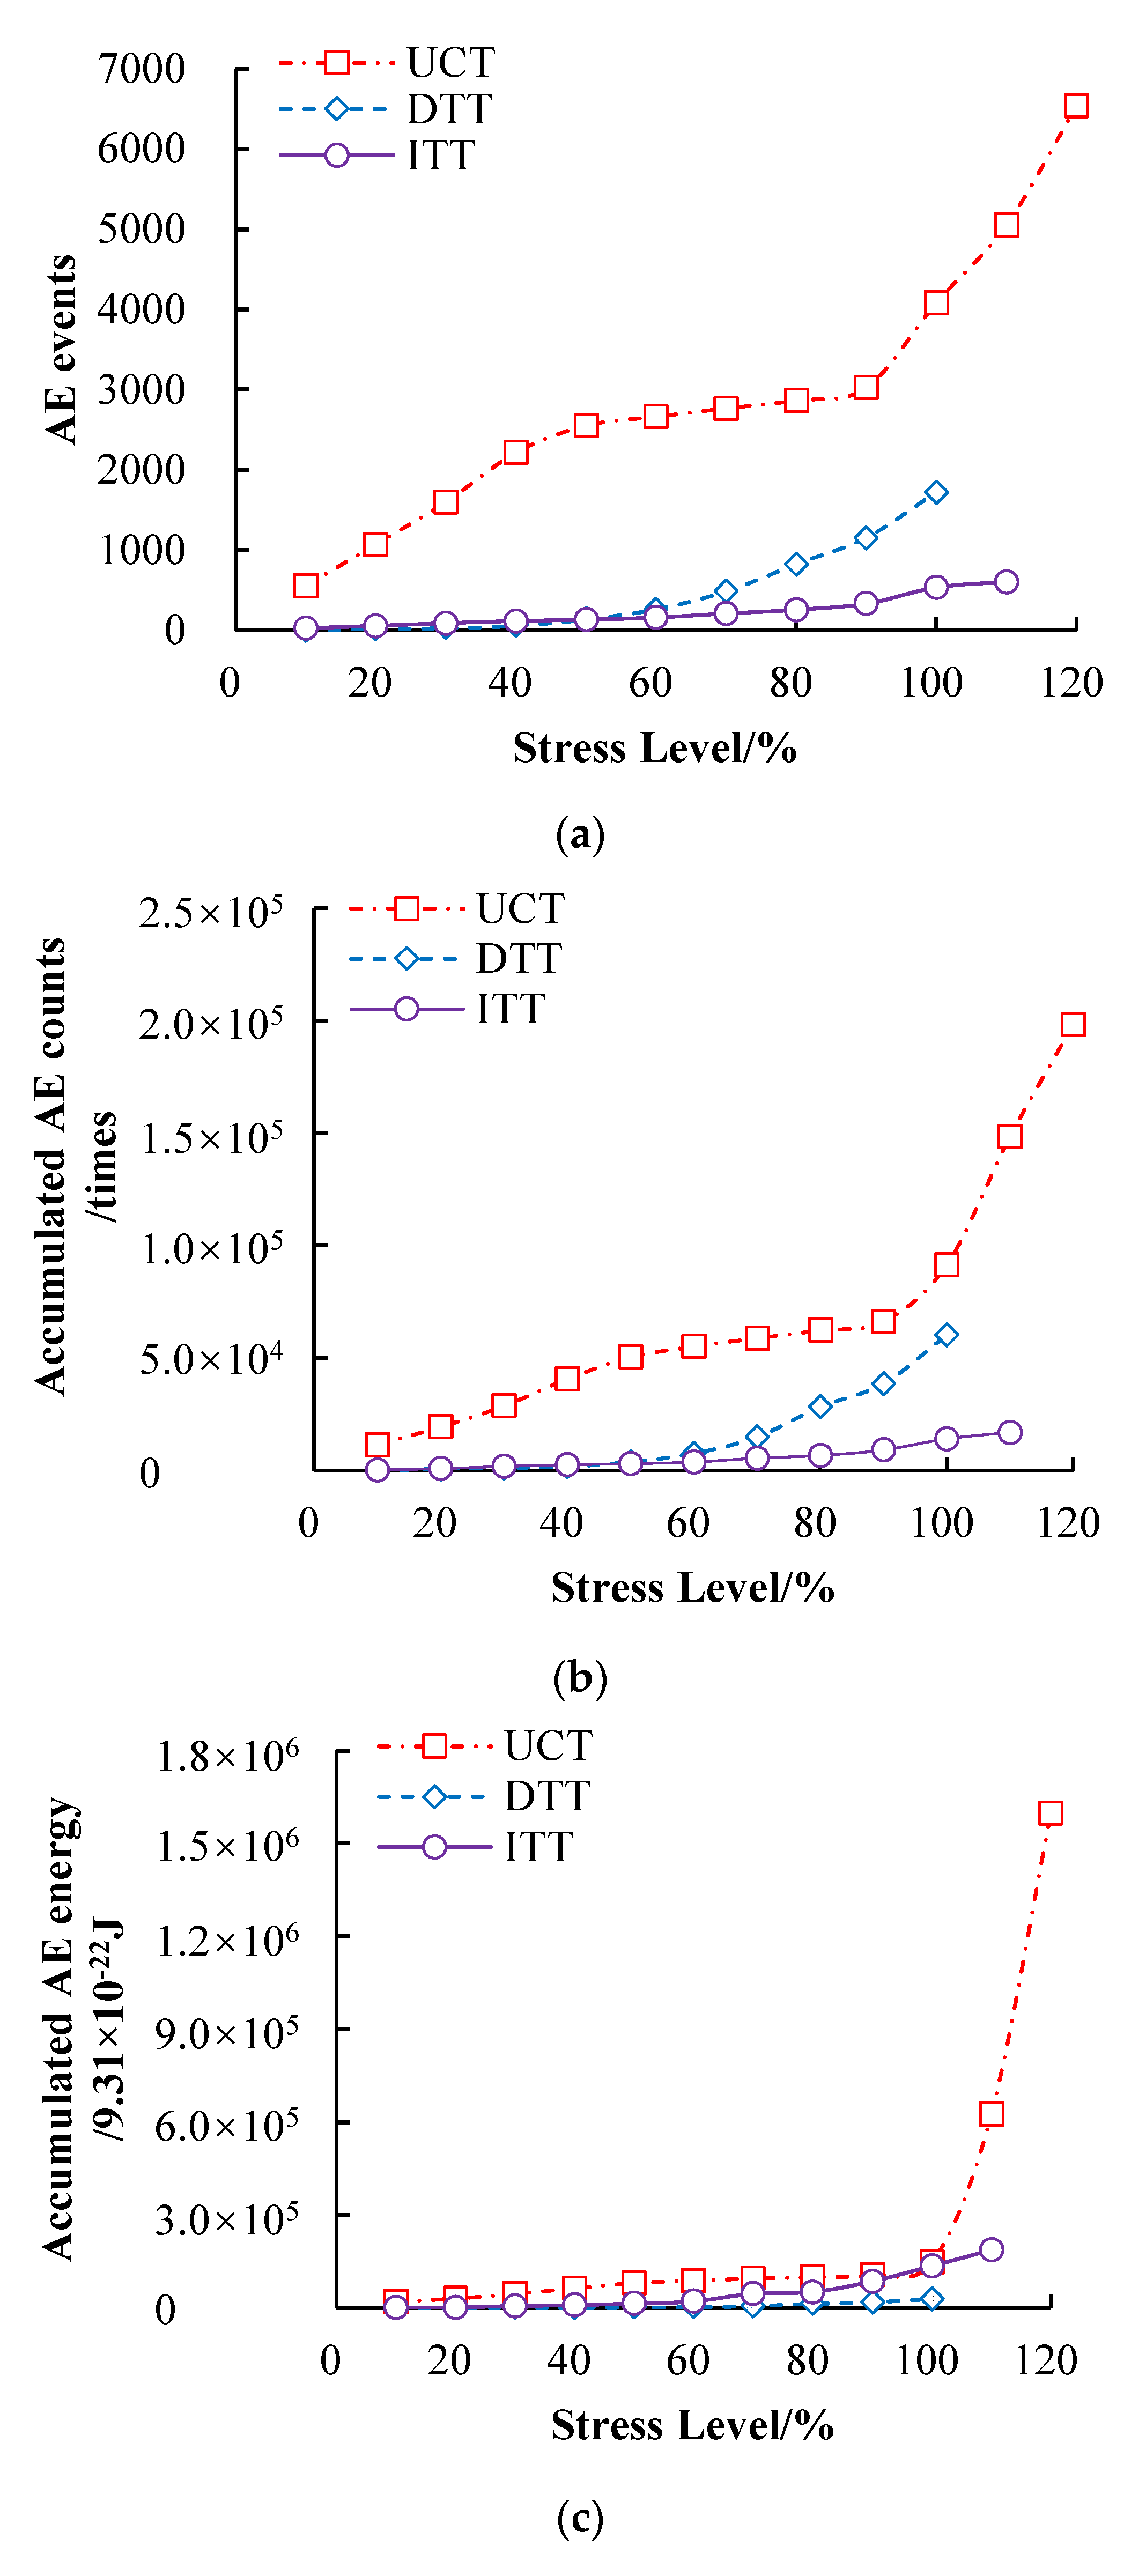
The stress states and failure modes of rocks under different loading modes were different, resulting in substantial differences in the temporal evolution of the AE parameters. The AE experiment results showed that the sequence of total AE events and AE counts was UCT > DTT > ITT. The AE energy release in the DTT and ITT was concentrated at the peak stress, and the AE signal rapidly weakened after the peak. However, there were still a large number of AE signals generated after the peak in the UCT accompanied by violent AE energy release.
(2)
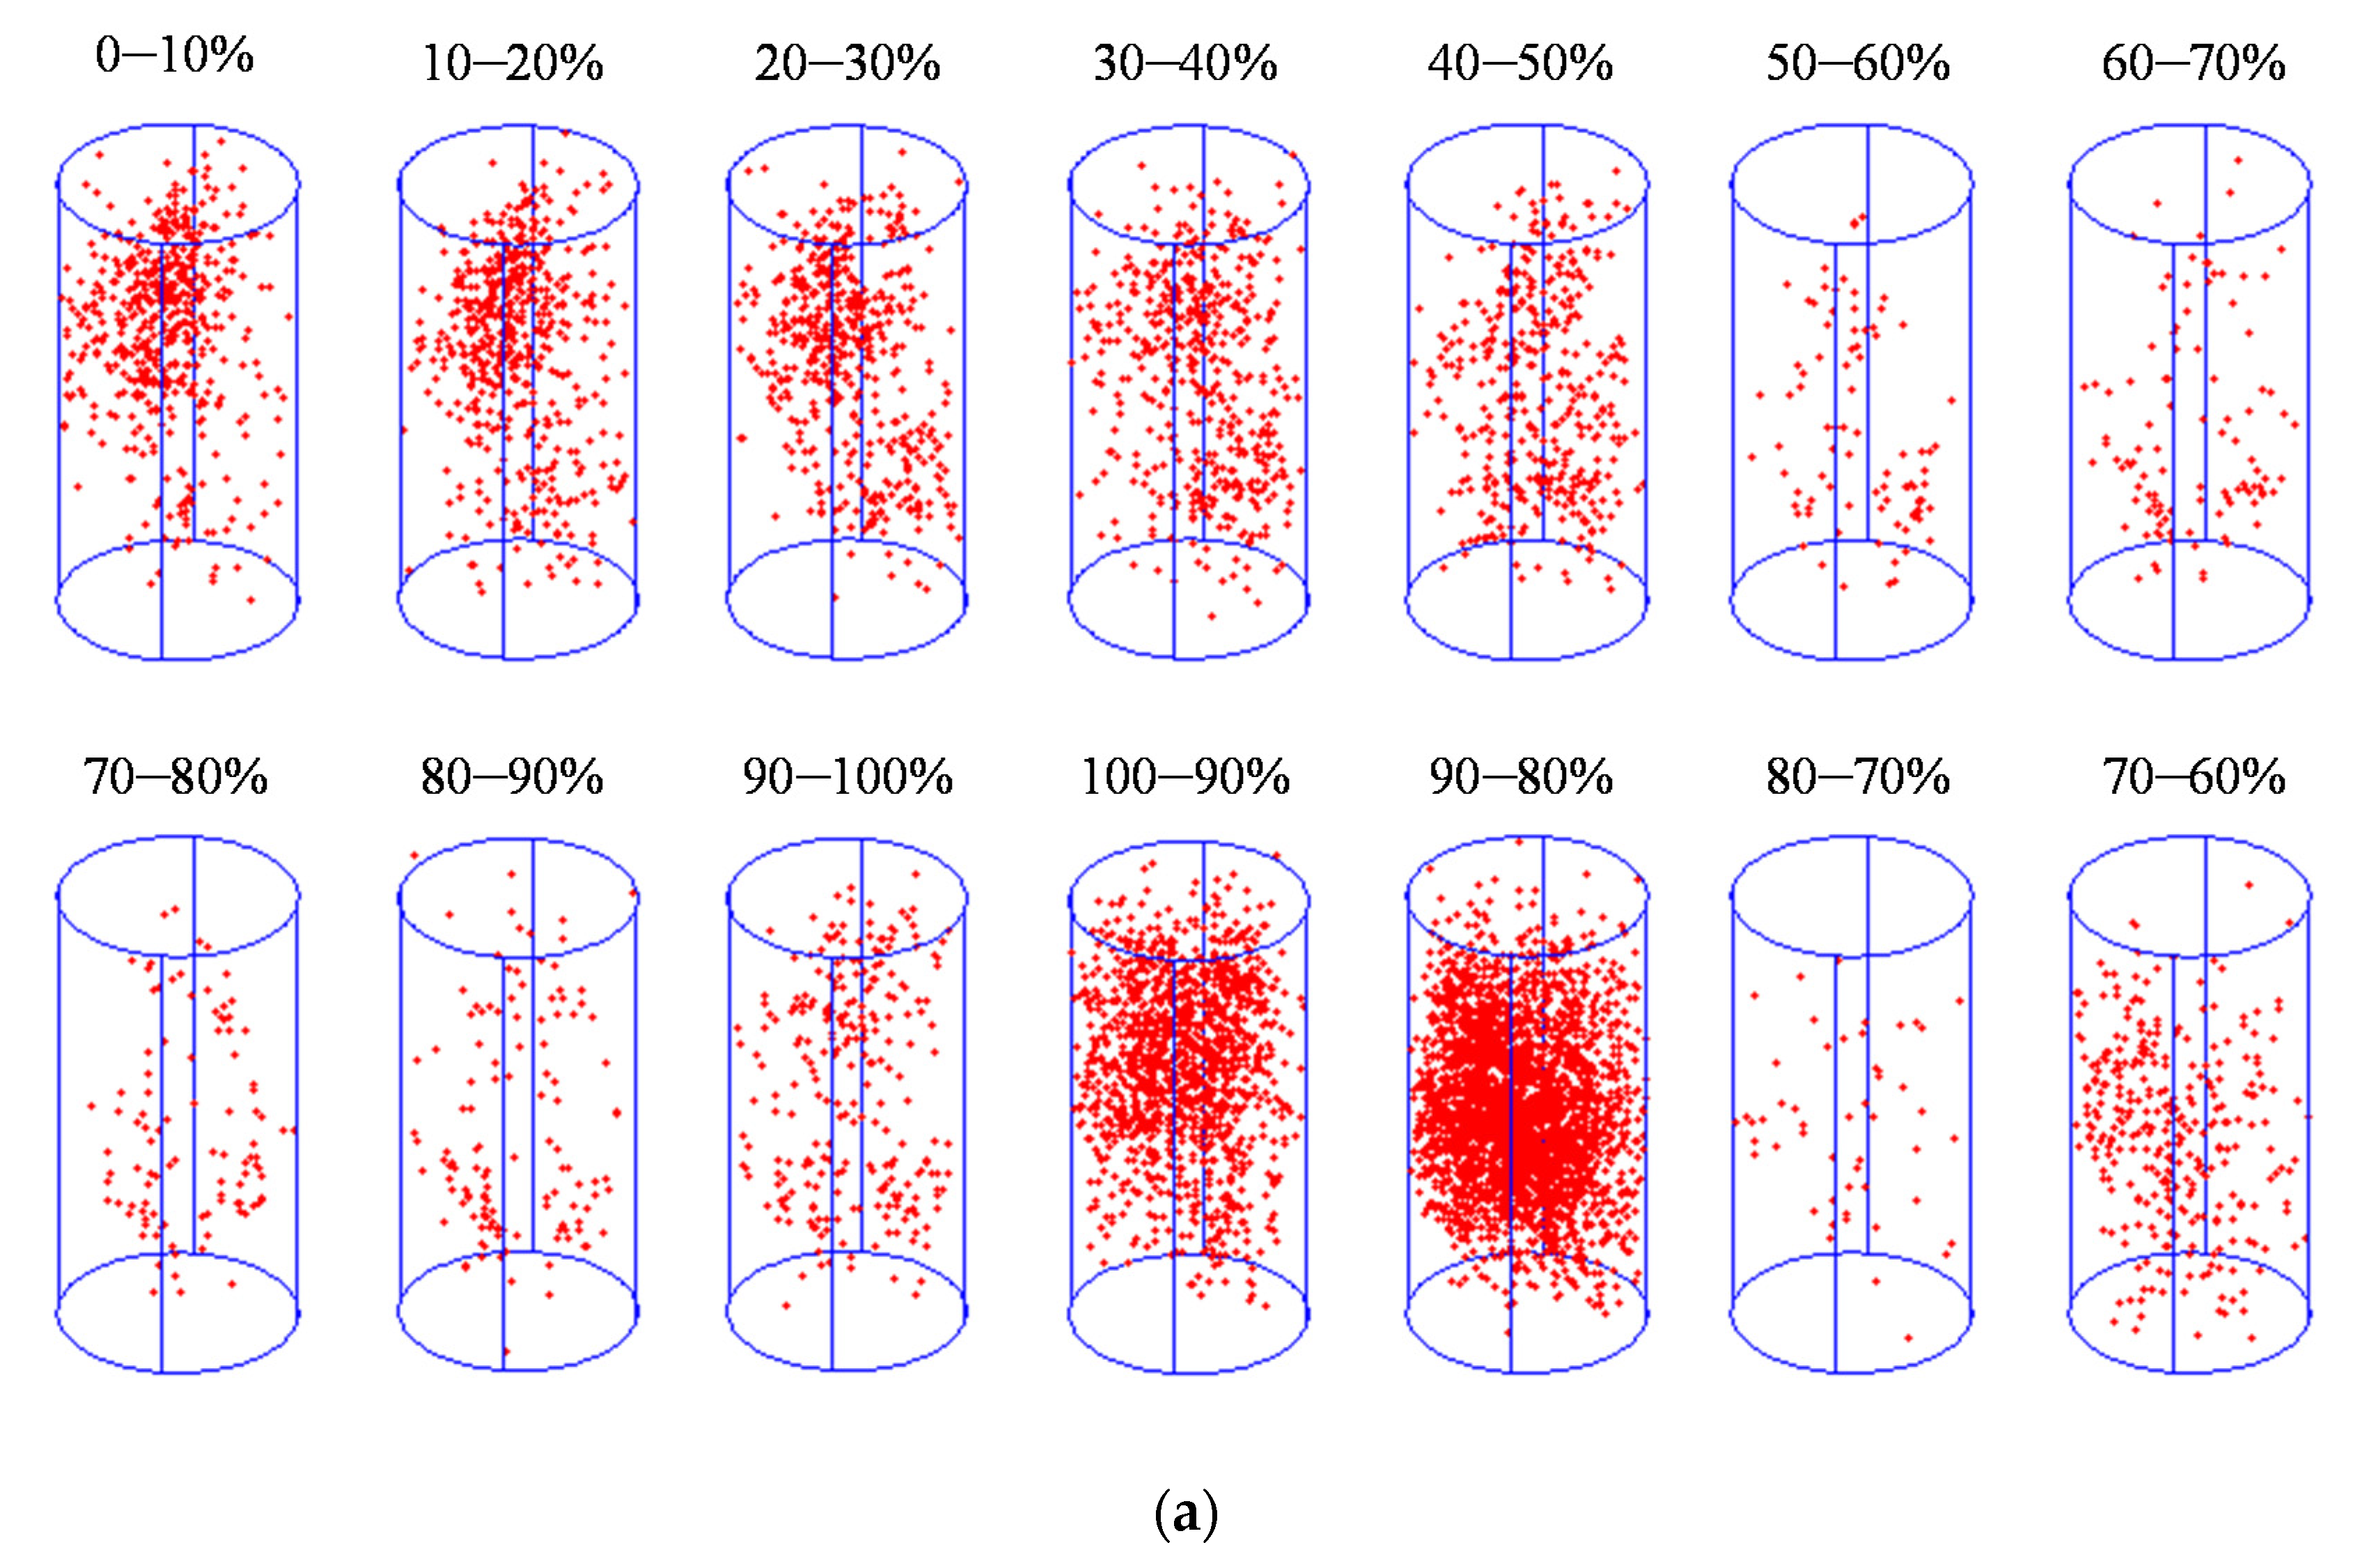
Due to different loading methods of the same rock, the microfracture mechanism and macroscopic failure mode of the rocks were different. For example, in the UCT, the multiple cleavage failure surfaces were mainly caused by compression-induced fracture. In the DTT, the fracture surface was subjected to tensile stress, whereas in the ITT, the fracture surface was in a compressive-tensile stress state. In the DTT and ITT, the spatial distribution of AE events coincided with the damage accumulation zone and the macroscopic failure surface, whereas in the UCT, the failure surface was composed of multiple compression-induced fractures parallel to the loading direction.
(3)
The stress level at which the b-value and the spatial fractal dimension Ds substantially decreased were consistent, and the sequence was UCT < DTT < ITT. These two AE parameters could reflect the development of microfractures and overall damage inside the rock.
(4)
In the UCT, the first precursor point of rock failure was defined as the stress level of the AE count rate peak (or energy rate peak) during prepeak loading, whereas in the DTT and ITT, the first precursor point was defined as the starting stress level of the active period of the AE count rate (or energy rate). This characteristic point can reflect the internal fracture growth from stable to unsteady expansion and had a corresponding relationship with the b-value and other AE parameters. In the UCT, the second precursor point of rock failure was defined as the starting stress level of the quiet period of the AE count rate (or energy rate), whereas in the DTT and ITT, the second precursor point was defined as the stress level of the AE count rate peak (or energy rate peak) during prepeak loading. This characteristic point can reflect the internal fracture growth from unsteady expansion to macroscopic failure.

Author Contributions

Conceptualization, E.Z., R.Z. and Z.Z. (Zetian Zhang); Methodology, R.Z.; Validation, T.A. and L.R.; Data curation and visualization, Z.Z. (Zhaopeng Zhang); Formal analysis, E.Z.; Writing—original draft preparation, E.Z. and C.L.; Writing—review and editing, R.Z. and Y.L. All authors have read and agreed to the published version of the manuscript.

Funding

This research was funded by the National Natural Science Foundation of China (No. U1965203, No. 51827901, No. 51804204), the China Postdoctoral Science Foundation (No. 2019T120841) and the Applied Basic Research Programs of Sichuan Province (No. 2019YJ0136).

Conflicts of Interest

The authors declare no conflict of interest.

References

  1. Nazarchuk, Z.; Serhiyenko, O.; Skalskyi, V. Acoustic Emission: Methodology and Application; Springer: New York, NY, USA, 2017. [Google Scholar]
  2. Lockner, D.A.; Byerlee, J.D.; Kuksenko, V.; Ponomarev, A.; Sidorin, A. Quasi-static fault growth and shear fracture energy in granite. Nature 1991, 350, 39–42. [Google Scholar] [CrossRef]
  3. Lockner, D.A. The role of acoustic emission in the study of rock fracture. Int. J. Rock Mech. Min. Sci. Geomech. Abstr. 1993, 30, 883–899. [Google Scholar] [CrossRef]
  4. Meng, Q.B.; Zhang, M.W.; Han, L.J.; Pu, H.; Nie, T.Y. Effects of acoustic emission and energy evolution of rock specimens under the uniaxial cyclic loading and unloading compression. Rock Mech. Rock Eng. 2016, 49, 3873–3886. [Google Scholar] [CrossRef]
  5. Yang, S.Q.; Wang, S.Y. Experimental investigation on the strength, deformability, failure behavior and acoustic emission locations of red sandstone under triaxial compression. Rock Mech. Rock Eng. 2012, 45, 583–606. [Google Scholar] [CrossRef]
  6. Li, L.R.; Deng, J.H.; Zheng, L.; Liu, J.F. Dominant frequency characteristics of acoustic emissions in white marble during direct tensile tests. Rock Mech. Rock Eng. 2017, 50, 1337–1346. [Google Scholar] [CrossRef]
  7. Cai, M.; Kaiser, P.K.; Morioka, H.; Minami, M.; Maejima, T.; Tasaka, Y.; Kurose, H. FLAC/PFC coupled numerical simulation of AE in large-scale underground excavations. Int. J. Rock Mech. Min. Sci. 2007, 44, 550–564. [Google Scholar] [CrossRef]
  8. Lisjak, A.; Liu, Q.; Zhao, Q.; Mahabadi, O.K.; Grasselli, G. Numerical simulation of acoustic emission in brittle rocks by two-dimensional finite-discrete element analysis. Geophys. J. Int. 2013, 195, 423–443. [Google Scholar] [CrossRef] [Green Version]
  9. Zhu, W.C.; Zhao, X.D.; Kang, Y.M.; Wei, C.H.; Tian, J. Numerical simulation on the acoustic emission activities of concrete. Mater. Struct. 2010, 43, 633–650. [Google Scholar] [CrossRef]
  10. Liu, J.F.; Chen, L.; Wang, C.P.; Man, K.; Wang, L.; Wang, J.; Su, R. Characterizing the mechanical tensile behavior of Beishan granite with different experimental methods. Int. J. Rock Mech. Min. Sci. 2014, 69, 50–58. [Google Scholar] [CrossRef]
  11. Wang, Q.S.; Chen, J.X.; Guo, J.Q.; Luo, Y.B.; Wang, H.Y.; Liu, Q. Acoustic emission characteristics and energy mechanism in karst limestone failure under uniaxial and triaxial compression. Bull. Eng. Geol. Environ. 2017, 78, 1427–1442. [Google Scholar] [CrossRef]
  12. Zhang, R.; Dai, F.; Gao, M.Z.; Xu, N.W.; Zhang, C.P. Fractal analysis of acoustic emission during uniaxial and triaxial loading of rock. Int. J. Rock Mech. Min. Sci. 2015, 79, 241–249. [Google Scholar] [CrossRef]
  13. Chmel, A.; Shcherbakov, I. A comparative acoustic emission study of compression and impact fracture in granite. Int. J. Rock Mech. Min. Sci. 2013, 64, 56–59. [Google Scholar] [CrossRef]
  14. Chen, Z.H.; Tang, C.A.; Fu, Y.F. Effect of stiffness load on rock samples in AE test. J. China Coal Soc. 1996, 21, 364–369. [Google Scholar]
  15. Ohtsu, M. Acoustic emission characteristics in concrete and diagnostic applications. J. Acoust. Emiss. 1987, 6, 99–108. [Google Scholar]
  16. Dai, S.T.; Labuz, J.F. Damage and failure analysis of brittle materials by acoustic emission. J. Mater. Civ. Eng. 1997, 9, 200–205. [Google Scholar] [CrossRef]
  17. Zhao, X.G.; Cai, M.; Wang, J.; Ma, L.K. Damage stress and acoustic emission characteristics of the Beishan granite. Int. J. Rock Mech. Min. Sci. 2013, 64, 258–269. [Google Scholar] [CrossRef]
  18. Tang, C.A.; Xu, X.H. Evolution and propagation of material defects and Kaiser Effect Function. J. Seismol. Res. 1990, 13, 203–213. [Google Scholar]
  19. Ji, M. Damage evolution law based on acoustic emission and weibull distribution of granite under uniaxial stress. Acta Geodyn. Geomater. 2014, 175, 269–274. [Google Scholar] [CrossRef]
  20. Ai, T.; Zhang, R.; Liu, J.F.; Ren, L. Space-time evolution rules of acoustic emission location of unloaded coal sample at different loading rates. Int. J. Min. Sci. Technol. 2012, 22, 847–854. [Google Scholar] [CrossRef]
  21. Zhang, Z.P.; Zhang, R.; Xie, H.P.; Liu, J.F.; Patrick, W. Differences in the acoustic emission characteristics of rock salt compared with granite and marble during the damage evolution process. Environ. Earth Sci. 2015, 73, 6987–6999. [Google Scholar] [CrossRef]
  22. Zhang, R. Research on AE Properties of Rock Damage Evolution Process and Rockburst Integrated Prediction. Ph.D. Thesis, Sichuan University, Chengdu, China, 2010. [Google Scholar]
  23. Carpinteri, A.; Lacidogna, G.; Corrado, M.; di Battista, E. Cracking and crackling in concrete-like materials: A dynamic energy balance. Eng. Fract. Mech. 2016, 155, 130–144. [Google Scholar] [CrossRef]
  24. Vidya, S.R.; Raghu, P.B.K. Damage limit states of reinforced concrete beams subjected to incremental cyclic loading using relaxation ratio analysis of AE parameters. Constr. Build. Mater. 2012, 35, 139–148. [Google Scholar] [CrossRef]
  25. Liu, J.F.; Xu, J.; Yang, C.H.; Hou, Z.M.M. Mechanical characteristics of tensile failure of salt rock. Chin. J. Geotech. Eng. 2011, 33, 580–586. [Google Scholar]
  26. Gutenberg, B.; Richter, C.F. Frequency of earthquakes in California. Bull. Seismol. Soc. Am. 1944, 34, 185–188. [Google Scholar]
  27. Xue, Y.; Dang, F.N.; Cao, Z.Z.; Du, F.; Ren, J.; Chang, X.; Gao, F. Deformation, permeability and acoustic emission characteristics of coal masses under mining-induced stress paths. Energies 2018, 11, 2233. [Google Scholar] [CrossRef]
  28. Zhou, Z.L.; Wang, H.Q.; Cai, X.; Chen, L.; Yude, E.; Cheng, R.S. Damage evolution and failure behavior of post-mainshock damaged rocks under aftershock effects. Energies 2019, 12, 4429. [Google Scholar] [CrossRef] [Green Version]
  29. Carnì, D.L.; Scuro, C.; Lamonaca, F.; Olivito, R.S.; Grimaldi, D. Damage analysis of concrete structures by means of acoustic emissions technique. Compos. Part B Eng. 2017, 115, 79–86. [Google Scholar] [CrossRef]
  30. Zeng, Z.W.; Ma, J.; Liu, L.Q.; Liu, T.C. AE b-value dynamic features during rockmass fracturing and their significances. Seismol. Geol. 1995, 17, 7–12. [Google Scholar]
  31. Lei, X.L.; Kusunose, K.; Rao, M.V.M.S.; Nishizawa, O.; Satoh, T. Quasi-static fault growth and cracking in homogeneous brittle rock under triaxial compression using acoustic emission monitoring. J. Geophys. Res. Atmos. 2000, 105, 6127–6139. [Google Scholar] [CrossRef]
Figure 1. Typical photographs of rocks before and after testing under different loading modes [22] Reproduced from [22], Sichuan University: 2010. (a) Before the uniaxial compression test (UCT), (b) After the UCT, (c) Before the direct tensile test (DTT), (d) After the DTT, (e) Before the indirect tensile test (ITT), (f) After the ITT.
Energies 13 03649 g001
Figure 2. Acoustic emission (AE) sensors setup for tests under different loading methods: (a) AE sensors placement in the DTT, (b) AE sensors locations in the ITT, (c) Overall arrangement of the experiment (a UCT is shown as an example).
Energies 13 03649 g002aEnergies 13 03649 g002b
Figure 3. Temporal variation in the AE parameters of typical marble samples under different loading modes: (a1) UCT (AE counts), (a2) UCT (AE count rate), (a3) UCT (AE energy), (a4) UCT (AE energy rate), (b1) DTT (AE counts), (b2) DTT (AE count rate), (b3) DTT (AE energy), (b4) DTT (AE energy rate), (c1) ITT (AE counts), (c2) ITT (AE count rate), (c3) ITT (AE energy), (c4) ITT (AE energy rate).
Energies 13 03649 g003aEnergies 13 03649 g003b
Figure 4. Average values of AE parameters of the marble samples under different loading modes: (a) AE events, (b) AE counts, (c) AE energy.
Energies 13 03649 g004
Figure 5. AE event spatial evolution in a typical marble sample under different loading modes: (a) UCT, (b) DTT, (c) ITT.
Energies 13 03649 g005aEnergies 13 03649 g005b
Figure 6. Comparison of the AE event spatial distributions and macroscopic failure patterns under different loading modes: (a) UCT, (b) DTT, (c) ITT.
Energies 13 03649 g006
Figure 7. AE b-value evolution under different loading modes.
Energies 13 03649 g007
Figure 8. Comparison of the spatial fractal dimension of AE events under different loading modes.
Energies 13 03649 g008
Table 1. Details of the test specimens.
Sample NumberHeight (mm)Diameter (mm)Compressive or Tensile Strength (MPa)Test Method
A7-2100.0649.3172.28UCT
A7-3100.2149.5386.01
A5-9102.8049.155.29DTT
A5-10105.4649.265.72
A5-P124.6849.141.39ITT
A5-P225.1249.141.63
Table 2. First precursor point before failure according to the AE parameters under different loading modes.
Sample NumberTest TypeStress Level of AE Count Rate PeakStress Level of AE Energy Rate PeakStress Level of Volumetric DilatationStarting Stress Level of Active Period in AE Count RateStarting Stress Level of Active Period in AE Energy Rate
A7-2UCT34.45%29.66%56.54%--
A7-334.08%34.08%48.34%--
A5-9DTT---68.10%68.10%
A5-10---42.26%45.06%
A5-P1ITT---68.75%62.17%
A5-P2---56.94%56.94%
Note: In the UCT, the first precursor point was the stress level of the AE count rate peak (or energy rate peak) during prepeak loading, whereas in the DTT and ITT, the first precursor point was the starting stress level of the “active period” of the AE count rate (or energy rate).
Table 3. Precursor information before failure under the different loading modes.
Sample NumberTest TypeStress Level where b-Value Decreases DramaticallyStress Level where Ds Decreases Dramatically
A7-2UCT20–30%10–30%
A7-330–50%30–60%
A5-9DTT60–90%50–80%
A5-1040–60%, 70–80%40–60%
A5-P1ITT50–70%60–70%, 90–100%
A5-P240–70%20–60%, 90–100%
Note: Only precursor information in the prepeak stage was analyzed here.
Table 4. Second precursor point before failure according to the AE parameters under the different loading modes.
Sample NumberTest TypeStress Level of AE Count Rate PeakStress Level of AE Energy Rate PeakStarting Stress Level of Quiet Period in AE Count RateStarting Stress Level Range of Quiet Period in AE Energy Rate
A7-2UCT--97.27%99.79%
A7-3--99.92%99.92%
A5-9DTT93.00%93.00%--
A5-1063.67%63.67%--
A5-P1ITT99.70%99.70%--
A5-P297.96%99.00%--
Note: In the UCT, the second precursor point was the starting stress level of the quiet period of the AE count rate (or energy rate), whereas in the DTT and ITT, the second precursor point was the stress level of the AE count rate peak (or energy rate peak) during prepeak loading.

