Article

A Stackelberg Game-Based Approach for Transactive Energy Management in Smart Distribution Networks

1
Faculty of Electrical and Computer Engineering, University of Tabriz, Tabriz 51368, Iran
2
E.T.S. de Ingeniería Industrial, University of Castilla–La Mancha, 13071 Ciudad Real, Spain
*
Authors to whom correspondence should be addressed.
Energies 2020, 13(14), 3621; https://doi.org/10.3390/en13143621
Submission received: 14 June 2020 / Revised: 4 July 2020 / Accepted: 10 July 2020 / Published: 14 July 2020
(This article belongs to the Section F: Electrical Engineering)

Abstract

:
Recently, with the penetration of numerous Distributed Energy Resources (DER) in Smart Distribution Networks (SDN), Local Transactive Markets have emerged. Exchanging energy between all participants of local markets results in the satisfaction of producers and consumers. Based on these issues, this study provides a novel framework for the participation of SDN-independent entities in wholesale and local electricity markets simultaneously. In this regard, the considered system’s players, namely Distribution System Operator (DSO) and DER Aggregator (AG), take part within local as well as wholesale markets in two-day ahead and real-time stages. Moreover, to deal with the inherent conflict between the existing players’ interests, a Stackelberg game-based technique is proposed. In the raised competition, the leader, DSO, attempts to minimize its operating costs, while the follower, DER AG, tends to maximize its profit. Therefore, actors’ actions choices within both markets are made non-cooperatively. On the other hand, to handle the uncertain nature of stochastic parameters in the depicted problem, Monte Carlo Simulation (MCS), together with a fast backward/forward scenario reduction approach, is exploited. Ultimately, to evaluate the efficiency of the proposed scheme, two different case studies, with and without considering the competitive environment, are implemented on a modified IEEE-33 bus SDN.

1. Introduction

Currently, the number of Distributed Energy Resources (DERs) is increasing dramatically in Smart Distribution Networks (SDNs). Accordingly, although the presence of these resources at the distribution level leads to the improvement of reliability, flexibility, voltage profile, etc., Distribution System Operators (DSOs) are confronted with various dilemmas in terms of optimal scheduling and energy management of their networks. This is because, on one hand, a large number of small-scale DERs must be managed by the DSO due to their inability to participate in wholesale markets. On the other hand, with the privatization of ownership in SDNs, the DSO has to interact and trade with private DERs in an economic and effective way [1]. The reason for this is that existing independent entities have a tendency to promote their own interests through participating in the DSO’s energy management program. Based on these facts, one promising solution for the efficient participation of these emerging entities in the optimal operation of novel distribution systems is designing a Local Electricity Market (LEM) in a Transactive Energy (TE) environment. The existence of the LEM helps local DERs to have the TE exchange with other units at the distribution level. In addition, these small-scale DERs are able to take part in the Wholesale Electricity Market (WEM), cooperating with one another and defining a virtual operator or Aggregator (AG). As a result, this article focuses on the involvement of both DSO and DER AG in the WEM and LEM simultaneously. In this case, the design of one local transactive market and the determination of the contribution of various players in this market are attempted. Furthermore, since there are inherent conflicts between interests of the system’s decision-makers, namely DSO and AG, a Stackelberg game-based approach is presented in this study [2]. In this framework, players’ decisions are made in a way to eventually reach the equilibrium point [3]. In the mentioned leader–follower game-theoretic approach, the DSO tries to reduce its operating as well as market transaction costs, while the AG tends to maximize its expected profit. On the contrary, due to the fact that the decision makers encounter a variety of uncertainties for participating in the Day-Ahead (DA) and Real-Time (RT) markets, a scenario-based two-stage stochastic programming method is provided. In this regard, to model the unknown character of stochastic parameters like market prices, load demands, and output power of renewable units, a considerable number of scenarios is generated by the Monte Carlo Simulation (MCS) technique [4]. Afterwards, the generated scenarios are reduced to a reasonable number by employing a combined backward/forward scenario reduction method [5].

1.1. Literature Review

In recent years, several research works have been conducted on the transactive market-based scheduling of SDNs. They are explained as follows.
In [6], the authors define a new platform for DSOs, aggregating various types of dispersed DERs at the local distribution level in order to participate in the WEM. In this framework, each DSO schedules its local DERs and minimizes its payoff through running a mixed-integer-linear programming model. A stochastic mixed-integer-linear programming model has been proposed in [7] for the participation of an AG of DERs in the DA WEM. In this case, the AG manages financial and energy interactions between the DA WEM and DERs. The objective function of the AG is to maximize its profit from trading power with the market and by using its resources. A two-stage programming scheme has been introduced in [8] for the optimal involvement of local DERs coordinated by a Virtual Power Plant (VPP) in the DA and RT WEM. In the first stage of this problem, the hourly commitment of DERs is determined to maximize the total profit of the VPP in the DA market. On the other hand, in the second stage, the output power of these resources is adjusted in order to diminish the imbalance costs of the VPP in the RT market. A new energy sharing mechanism has been introduced in [9], in which an AG exploited local DERs for peak shaving and load balance. In this paper, an incentive-based method, according to asymmetric Nash bargaining, has been designed to guarantee that electricity users share and invest in DERs. A bi-level programming framework has been provided in [10] to model the participation of a DER AG in the LEM. In this case, the AG, as a mediator, aggregates the production/consumption requirements of various DERs in order to submit their offers/bids to the LEM operator. At the upper level of the proposed method, the AG minimizes its total operating costs, which include costs of traded energy with DERs and LEM, whereas, at the lower level, the market operator clears the LEM.
A DA LEM has been modeled in [11] for the optimal scheduling of SDNs. The LEM is cleared by the DSO in order to improve the social welfare of market players and to meet the technical constraints of the system. Accordingly, the DSO receives bids/offers from the retailer, microgrids, and various types of load AGs. In this framework, the retailer is able to sell its purchased energy from the WEM to the LEM. A LEM has been designed in [12] for energy exchange in community microgrids. In this framework, a community microgrid operator, a non-profit entity, maximizes social welfare by the effective allocation of resources. The mentioned problem has been formulated using bi-level programming, in which the upper level redistributes the optimal profit of the community among entities, while the lower level clears the local market. Furthermore, in this study, the LEM is connected to the upstream grid and can trade energy with the WEM. An agent-based TE market in SDNs has been investigated in [13]. In this work, market participants, namely autonomous microgrids, are able to sell and purchase energy in a local TE market. Moreover, these players can trade their imbalance power with the utility grid. This inter-microgrid auction-based market manages surplus supply or demand of microgrids by exploiting the dual-phase comprehensive energy management technique. A mixed-integer-linear programming framework has been utilized in [14] in order to design a local TE market by the DSO. For this goal, the DSO receives price signals from the WEM as well as bids from several DERs to clear the DA LEM with the minimum operating cost. One integrated TE network has been investigated in [15], in which different participants, including microgrids, are able to take part in both local and wholesale markets. Accordingly, the LEM is settled after the WEM clearing process. In this work, a two-stage stochastic programming approach was run to solve the market transactions as well as the DA energy management problem of the existing market players.
A robust optimization model has been presented in [16], in which a DER AG takes part in the DA and RT WEM as well as LEM. In this regard, the AG interacts with the WEM and the LEM operator in order to minimize its total operating costs. The interaction between the AG and the operator of the local market is carried out in such a way to provide flexibility requirements of market participants at the local level. A linear programming model has been presented in [17], in which the DER AG is able to maximize its profit by interacting with the DSO in a TE environment as well as participating in the WEM. In other words, an AG integrates a wide range of generation and storage units to not only maintain the reliable operation of the DSO but also to take part in the DA WEM. In the provided framework, the scheduling has been implemented only from the AG’s perspective. A novel operational problem has been raised in [18], in which a Distribution Company (Disco) interacts and trades energy with both WEM and LEM at the same time. In this framework, the WEM and LEM are managed by the independent system operator and the microgrid owner, respectively. To solve the mentioned model, bi-level programming has been suggested, in which the upper level minimizes the risk of the Disco, whereas two separate lower levels clear the DA WEM and LEM. Finally, a multi-leader-one-follower bi-level model has been proposed in [19] to optimize the bidding strategy of multi-microgrid owners that are competing in a LEM. In this framework, multi-microgrids, as leaders, submit the prices of their bids/offers to the DSO in such a way to minimize operating costs. On the contrary, the DSO, as the follower, collects the presented bids/offers in order to clear the LEM. In the market-clearing procedure, the DSO is able to trade energy with the WEM as well. One stochastic bi-level programming approach has been suggested in [20] to manage the optimal interaction between the DSO and microgrid owners in a LEM at the distribution level. Accordingly, at the upper level, the DSO, as an operator of the LEM, minimizes the total market-clearing costs, which include the operating cost of its own local resources, interaction costs with microgrid owners as well as market transaction costs with the WEM. On the other hand, at the lower level, each microgrid owner minimizes their total operating costs, including the cost of energy trading with the DSO and other microgrids. A LEM has been designed in [21], in which the DSO and various microgrid owners are able to trade energy with one another in a TE-based environment. In this framework, each of these market players is taken into account as an autonomous agent that promotes its own benefit through participating in both LEM and WEM. Hence, the DSO, as an operator of the LEM, sends dynamic pricing signals to microgrids and settles the market by receiving bids/offers from microgrids. To solve the raised model, a robust bi-level optimization method was used in this study. A brief comparison between the reviewed research studies is provided in Table 1.

1.2. Novelty and Contributions

Analyzing the introduced works indicates that, generally, the optimal scheduling of SDNs has not been investigated in the presence of both WEM and LEM at the same time. Indeed, in these studies, some participants of distribution networks have not been allowed to be involved in the WEM. On the other hand, independent financial entities have not been considered to take part in various markets as strategic operators. Hence, these studies have not been able to present a solution for modeling a competitive environment among all market players. Furthermore, in several models, a suitable platform has not been provided for the coordination and collaboration of decentralized DERs. As a result, since this research is conducted to fill the entire aforementioned gaps and weaknesses, the main contributions of the article are summarized as follows:
  • Designing a distinct LEM to create a novel platform for the TE exchange at the distribution level.
  • Presenting a Stackelberg game-based approach to model a TE environment in which the exchanged energy between autonomous financial entities and the DSO results in the equilibrium of the system.
  • Providing a novel framework in which all participants of the distribution network are able to take part in separate markets that have no exchange between each other.
  • Determining an AG of decentralized DERs to establish an appropriate cooperative environment between various energy sources for the purpose of trading energy in both WEM and LEM.
The rest of this article is organized as follows: The raised problem, utilized framework, and its formulations are described in Section 2. The numerical studies are provided in Section 3. Finally, the article is concluded in Section 4.

2. Materials and Methods

In this part, firstly, the presented approach for the optimal scheduling of SDNs, as well as the structure and characteristics of the available markets, are explained in more detail. Afterwards, the uncertainty modeling and mathematical formulations of the problem are stated.

2.1. Proposed Methodology and Markets Structure

As mentioned earlier, the primary goal of this research is to study the optimal scheduling of SDNs in the TE environment by considering both LEM and WEM. The studied SDN has two autonomous players, namely DSO and DER AG. In this regard, the DSO is responsible for providing the required electricity demand of customers, maintaining the security and stability of the system. In contrast, the AG, as a mediator, aggregates and coordinates local distributed resources in order to participate in both markets effectively. As for the WEM, it is assumed that this market is a spot market, and its clearing mechanism is based on the double auction [22]. Hence, for each timeslot t, a tuple ( t , q , p ) is presented to the market, in which q is the bid/offer of participants for the energy, and p is the proposed price of that bid/offer. On the other hand, it is presumed that the pricing mechanism in the WEM is the uniform pricing in which all winners are paid at a market-clearing price regardless of their actual bids [23]. As a result, the mentioned players bid at the market cap price and offer at the zero price in order to be sure of the acceptance of their proposals by the market operator [24]. Concerning the LEM, owing to the presence of autonomous financial entities with different objective functions, and the necessity of interaction with one another at the distribution level, a Stackelberg game-based approach is selected to model the TE trading between independent players of the market. That is due to the fact that with a game-based method, the selfish behavior of all the agents can be satisfied, and a win-win situation is established among them [25]. In this market, for the sake of simplicity, the price of traded energy is assumed to be constant. This assumption is highly prevalent (albeit relatively coarser). On the other hand, generally, the exchange mechanism between the WEM and LEM can be categorized into three different types: Neutral Link, Competition Link, and finally, No Link [26]. Based on these, in this research, it is assumed that there is no direct link between these two kinds of markets. The outline of the considered scheme and the interaction between the introduced players in various markets are illustrated in Figure 1.
According to this figure, the DSO and AG have the ability to be involved in existing markets simultaneously. This condition and this capability lead to the improvement of players’ flexibility in their decision-making stages. On the other hand, the existence of local energy trading could decrease voltage fluctuations, increase the utilization of renewable-based resources, reduce the amount of purchased power from the upstream grid during peak hours, and promote the efficiency of the network as well as the welfare of market participants [27]. In this game, the DSO, as the leader of the problem, seeks to minimize its total operating costs by exchanging power in both local and wholesale markets. In turn, the AG, as the follower of the problem, maximizes its profit by making the connection with DER producers and market operators. In this procedure, the exchanged power between agents in the LEM acts as linking variables of the upper and lower levels. As a result, based on the local and wholesale market prices, the DSO sends its bids/offers for purchasing/selling energy in the LEM to the DER AG. These proposals enter into the optimization problem of the DER AG as input parameters and, according to these values, the AG decides on its own decision variables, including the traded energy in the WEM, generated power of dispatchable units as well as charged/discharged power of the compressed air energy storage (CAES). Then, the DSO optimizes its objective function and evaluates the total operating costs by taking into account decisions that are returned from the follower to the leader.
Nevertheless, in the provided scheme, each independent organization is faced with a large number of uncertainties, including market prices, electricity demand, wind speed, and solar irradiance. In order to cope with these types of uncertain factors, a scenario-based two-stage stochastic programming method is used. In two-stage models, normally, two kinds of decisions are made: here-and-now or first-stage decisions and wait-and-see or second-stage decisions [28]. Based on the latter reference and the above descriptions, in the first stage of this paper, existing players determine their optimal involvement in the DA WEM and DA LEM, as well as the output power of their dispatchable sources prior to the realization of stochastic variables. In the next stage, after learning the actual value of uncertain parameters, these entities decide on their participation in the RT WEM and RT LEM, as well as power adjustments of available units.

2.2. Uncertainty Characterization

As mentioned previously, in the depicted model, there are five uncertain parameters, namely, RT WEM price, RT LEM price, wind speed, solar radiation, and three types of electric demand. For the realization of these random variables, the primary issue is to generate scenarios in such a way as to represent the probabilistic nature of them. To this end, a large number of scenarios is generated by the MCS technique. In the first step of this method, the Normal Probability Distribution Function (PDF) for the error of each parameter is constructed by exploiting historical data. Then, according to the established PDFs, the value of the forecasted parameter, and Equation (1) the desired number of scenarios is created [29].
x t , s = x t For . + x t , s Err . ,           t , s
Based on the above expression, for each stochastic factor, scenario x t , s is obtained from the summation of its forecasted value, x t For . , and a positive or negative error, x t , s Err . . It is noteworthy that x t , s Err . is extracted from the PDF of errors using random numbers. Afterwards, the scenario tree is used to combine the discrete outcome of random variables and form the integrated set of scenarios. The constructed tree comprises stages and nodes where each stage displays the time step of the problem, whereas each node expresses the state of parameters at a specific time interval. In this tree, paths among nodes are defined as intended scenarios [30]. Nonetheless, since solving the problem with a variety of scenarios results in the complexity of the model and a computational burden, the generated scenarios should be reduced to an adequate number by implementing a proper scenario reduction algorithm. According to these explanations, in this work, the combination of a fast backward/forward algorithm in the SCENRED2 tool of the GAMS software [31] is used to diminish the initial number of scenarios to 10. The reduction algorithm tries to retain a set of probable scenarios by minimizing the Kantorovich distance between the primary set of scenarios and the reduced ones [32]. The probabilities of the reduced scenarios are reported in Table 2.

2.3. Problem Formulation

Based on the explanations of the previous section, in the following, each player’s objective function and its related constraints are formulated mathematically.

2.3.1. Objective Function and Constraints of the Leader: DSO

The DSO, as the operator of the SDN, procures electricity from both wholesale and local markets simultaneously. Therefore, the objective function of this level is to minimize the expected cost of the DSO, which consists of the market transaction as well as operating costs using two-stage stochastic programming. Accordingly, the exchanged energy in the DA WEM and the DA LEM, as well as the output power of dispatchable units, are here-and-now variables, whereas the exchanged energy in both RT markets and the power adjustment of the local resources are wait-and-see decisions.
Generally, the DSO supplies most of the customers’ demand from both WEM and LEM. However, this entity is able to provide some demand requirements from its local units as well. Hence, the objective function of the DSO comprises three main parts, involvement in the WEM, involvement in the LEM, and operating costs of local resources. These three parts are valid for the DA and RT stages.
O . F upper-level = Min     t T { ( P buy , DSO DA , WEM ( t ) P sell , DSO DA , WEM ( t ) ) λ DA , WEM ( t ) + ( P buy DA , LEM ( t ) P sell DA , LEM ( t ) ) λ DA , LEM ( t ) + i I a i , DSO P i , DSO ( i , t ) + b i , DSO . U i , DSO ( i , t ) + SU i , DSO ( i , t ) + SD i , DSO ( i , t ) + s S ρ ( s )   [ ( P buy , DSO RT , WEM ( t , s ) P sell , DSO RT , WEM ( t , s ) ) λ RT , WEM ( t , s ) + ( P buy RT , LEM ( t , s ) P sell RT , LEM ( t , s ) ) λ RT , LEM ( t , s ) + i I ( a i , DSO up P i , DSO up ( i , t , s ) a i , DSO dn P i , DSO dn ( i , t , s ) ) ]   } ,
The first, second, and third lines of Equation (2) are related to the first stage of the problem. The first and second terms are the costs of exchanged energy in the DA WEM and the DA LEM, respectively. The third term is the generation, start-up, and shut-down costs of dispatchable units. The rest of the lines are associated with the second stage of the problem. The first two terms are the costs of exchanged energy in the RT WEM as well as the RT LEM, respectively. The last term is the upward/downward power adjustment costs of dispatchable resources. As it is clear in Equation (2), it is assumed that the RT markets are cleared every hour [33].
subject to:
1. AC power flow constraints:
In this study, an AC power flow is applied to the SDN, in which the voltage magnitudes, current flows, and active powers are decision variables. According to the depicted branch in Figure 2, the technical constraints of a distribution network are modeled as follows [18]:
P α β From ( t ) = R α β Z α β 2 V α ( t ) ( V α ( t ) V β ( t ) ) ,     ( α , β ) Λ , t
P α β To ( t ) = R α β Z α β 2 V β ( t ) ( V β ( t ) V α ( t ) ) ,     ( α , β ) Λ , t
P α β From ( t ) P α β To ( t ) = R α β Z α β 2 ( V α 2 ( t ) V β 2 ( t ) ) ,     ( α , β ) Λ , t
P α β From ( t ) + P α β To ( t ) = R α β I α β 2 ( t ) ,     ( α , β ) Λ , t
I α β ( t ) = V α ( t ) V β ( t ) Z α β   ,     ( α , β ) Λ , t
I α β max I α β ( t ) I α β max ,     ( α , β ) Λ , t
V α min V α ( t ) V α max ,     ( α , β ) Λ , t
P α β flow ( t ) = P α β From ( t ) P α β To ( t ) ,     ( α , β ) Λ , t
P α β loss ( t ) = P α β From ( t ) + P α β To ( t ) ,     ( α , β ) Λ , t
Equations (3) and (4) model the injected power from buses α and β to the line, respectively. Equations (5) and (6) calculate the active power flows and power losses, respectively. Equations (7) and (8) express the amount of current flow and its limitation. Finally, Equation (9) limits the amount of voltage fluctuation. As it is clear, Equations (5) and (6) contain non-linear terms, namely I α β 2 ( t , s ) and V α 2 ( t , s ) , that are linearized by the piecewise linearization method, as described in [34]. It should be noted that the same set of expressions are valid for the RT as well.
2. Power balance constraints:
In general, the exchanged power of the DSO with both markets and its local production should satisfy the demand. Accordingly, the DA power balance of the DSO at the slack bus and other buses in each period of time are formulated in Equations (12) and (13), respectively. In Equation (12), index α = 1 refers to the substation node, which is the interface between the transmission and the distribution systems and, therefore, the link with the WEM. It is notable that, since the AG trades energy with the WEM through the SDN platform and the slack bus, the purchased and sold powers of the AG are also considered in the power balance of the DSO.
  ( P buy , DSO DA , WEM ( t ) + P buy , AG DA , WEM ( t ) ) ( P sell , DSO DA , WEM ( t ) + P sell , AG DA , WEM ( t ) ) = β   :   ( α , β )         Λ 0.5 ( P α β flow ( t ) + P α β loss ( t ) ) ,     α = 1 , t
  w : ( w , α ) Ω W W P w , DSO ( w , t ) + v : ( v , α ) Ω V V P v , DSO ( v , t ) + i : ( i , α ) Ω I I P i , DSO ( i , t ) + w : ( w , α ) Ω W W P w , AG ( w , t ) + v : ( v , α ) Ω V V P v , AG ( v , t ) + i : ( i , α ) Ω I I P i , AG ( i , t ) + j : ( j , α ) Ω J J ( P jdis , AG ( j , t ) P jch , AG ( j , t ) ) l : ( l , α ) Ω L L P Load , DSO ( l , t ) = β : ( α , β ) Λ 0.5 ( P α β flow ( t ) + P α β loss ( t ) ) ,     α 1 , t
On the other hand, after the realization of uncertain variables, the DSO has to compensate for its shortage or supply its excess energy by participating in the RT markets. As a result, the RT power balance of the DSO at the slack bus and other buses in each period of time and each scenario can be expressed by Equations (14) and (15), respectively.
  ( P buy , DSO DA , WEM ( t ) + P buy , AG DA , WEM ( t ) ) ( P sell , DSO DA , WEM ( t ) + P sell , AG DA , WEM ( t ) ) = β : ( α , β ) Λ 0.5 ( P α β flow ( t ) + P α β loss ( t ) ) ,     α = 1 , t
  w : ( w , α ) Ω W W ( P w , DSO ( w , t , s ) P w , DSO ( w , t ) ) + v : ( v , α ) Ω V V ( P v , DSO ( v , t , s ) P v , DSO ( v , t ) ) + i : ( i , α ) Ω I I P i , DSO up ( i , t , s ) i = 1 I P i , DSO dn ( i , t , s ) + w : ( w , α ) Ω W W ( P w , AG ( w , t , s ) P w , AG ( w , t ) ) + v : ( v , α ) Ω V V ( P v , AG ( v , t , s ) P v , AG ( v , t ) ) l : ( l , α ) Ω L L ( P Load , DSO ( l , t , s ) P Load , DSO ( l , t ) ) = β : ( α , β ) Λ 0.5 ( P α β flow ( t , s ) + P α β loss ( t , s ) P α β flow ( t ) P α β loss ( t ) ) ,     α 1 , t , s
3. Constraints of the exchanged power with the markets:
Purchased/sold power from/to available markets are non-negative variables that are limited by the power balance and operational constraints of the network. Moreover, in order to prevent arbitrage opportunity between the WEM and LEM, the sold and purchased power of the DSO in both stages cannot occur at the same time. Hence, Equations (16) and (17) are provided to restrict the DSO from simultaneous selling and buying of energy. Without these limitations, the DSO, as the leader of the game, makes the AG purchase energy from the WEM at a high price and sell it to the LEM at a low price. Thus, the AG is harmed significantly by this.
( P sell , DSO DA , WEM ( t ) + P sell DA , LEM ( t ) ) ( P buy , DSO DA , WEM ( t ) + P buy DA , LEM ( t ) ) = 0 ,     t
( P sell , DSO RT , WEM ( t , s ) + P sell RT , LEM ( t , s ) ) ( P buy , DSO RT , WEM ( t , s ) + P buy RT , LEM ( t , s ) ) = 0 ,     t , s
Nevertheless, since the above constraints are non-linear, they are linearized by using the Big-M method [35], as shown in Equations (18) and (21).
P sell , DSO DA , WEM ( t ) + P sell DA , LEM ( t ) M 1 Y 1 ( t ) ,     t
P buy , DSO DA , WEM ( t ) + P buy DA , LEM ( t ) M 1 ( 1 Y 1 ( t ) ) ,     t
P sell , DSO RT , WEM ( t , s ) + P sell RT , LEM ( t , s ) M 2 Y 2 ( t , s ) ,     t , s
P buy , DSO RT , WEM ( t , s ) + P buy RT , LEM ( t , s ) M 2 ( 1 Y 2 ( t , s ) ) ,     t , s
4. Non-dispatchable resources constraints:
Based on the wind speed forecast as well as solar irradiance forecast at each period of time, the produced power of the WT and PV can be determined as follows [36]:
P w , DSO ( w , t ) = { 0 ,   V ( t ) < V w , DSO ci   or   V ( t ) > V w , DSO co P w , DSO R V ( t ) V w , DSO ci V w , DSO R V w , DSO ci ,   V w , DSO ci V ( t ) V w , DSO R P w , DSO R ,   V w , DSO R V ( t ) V w , DSO co ,
P v , DSO ( v , t ) = P v , DSO R ( G ( t ) G Ref ) [ 1 + Ψ ( T ( t ) T Ref ) ] ,
The same expressions are valid for the various generated scenarios as well. It is noteworthy that the above expressions are part of the data preprocessing, where the values of wind speed, solar irradiation, and temperature are converted into power values; hence, they act as input parameters of the optimization problem.
5. Dispatchable resources constraints:
The generation capacity and the upward/downward reserve capacity of the DSO’s local dispatchable units are limited by Equations (24) and (25) [37].
P i , DSO ( i , t ) + P i , DSO up ( i , t , s ) P i , DSO max U i , DSO ( i , t ) ,     i , t , s
P i , DSO ( i , t ) P i , DSO dn ( i , t , s ) P i , DSO min U i , DSO ( i , t ) ,     i , t , s
Moreover, the linear model for minimum up/down-time constraints of these resources is stated in the following equations [38].
U i , DSO ( i , t ) U i , DSO ( i , t 1 ) U i , DSO ( i , t + UT i , DSO ( i , d ) ) ,     i , t
U i , DSO ( i , t 1 ) U i , DSO ( i , t ) 1 U i , DSO ( i , t + DT i , DSO ( i , d ) ) ,     i , t
UT i , DSO ( i , d ) = { d ,   d MUT i , DSO ( i ) 0 ,   d > MUT i , DSO ( i ) ,     i
DT i , DSO ( i , d ) = { d ,   d MDT i , DSO ( i ) 0 ,   d > MDT i , DSO ( i ) ,     i
Equations (26) and (28) are associated with the minimum up-time, in which when the state of the unit changes from “off” to “on”, and that unit must be “on” for the minimum up time (MUT) duration. In contrast, Equations (27) and (29) are related to the minimum down-time, in which when the state of the unit changes from “on” to “off”, and that unit must be “off” for the minimum down time (MDT) duration. Finally, the start-up and shut-down costs of the resources are formulated in Equations (30) and (31).
SU i , DSO ( i , t ) su i , DSO ( i ) [ U i , DSO ( i , t ) U i , DSO ( i , t 1 ) ]   ,     i , t
SD i , DSO ( i , t ) sd i , DSO ( i ) [ U i , DSO ( i , t 1 ) U i , DSO ( i , t ) ]   ,     i , t

2.3.2. Objective Function and Constraints of the Follower: DER Aggregator

In the SDN, numerous decentralized DERs cooperate with one another in order to participate in the WEM and LEM effectively. For this purpose, these resources form a coalition and define a virtual operator, namely the DER AG, for their coalition. This platform aids owners of these units to obtain more profit since they do not have to sign a take-or-pay contract at a lower price than the market price [39]. Based on the presented issues, the objective function of this level is to maximize the expected profit of the AG by taking part in the available markets through two-stage stochastic programming. Similar to the DSO, the traded energy of the AG in the DA WEM and the DA LEM, as well as the output power of dispatchable sources, are here-and-now decisions, while the traded energy in both RT markets is a wait-and-see variable.
Since the objective function of the AG is the maximization of the benefit, it is defined as the difference between the incomes and expenses of this entity. The AG’s revenue includes the price of the energy sold to the existing markets, whereas its expenses include the price of the energy bought from both markets as well as the operating costs of DERs.
O . F lower-level = Max     t T { ( P sell , AG DA , WEM ( t ) P buy , AG DA , WEM ( t ) ) λ DA , WEM ( t ) + ( P buy DA , LEM ( t ) P sell DA , LEM ( t ) ) λ DA , LEM ( t ) i I c i , AG P i , AG ( i , t ) j J P jdis , AG ( j , t ) ( HR λ Gas + OM exp . ) j J P jch , AG ( j , t ) OM com . + s S ρ ( s )   [ ( P sell , AG RT , WEM ( t , s ) P buy , AG RT , WEM ( t , s ) ) λ RT , WEM ( t , s ) + ( P buy RT , LEM ( t , s ) P sell RT , LEM ( t , s ) ) λ RT , LEM ( t , s ) ] } ,
The first, second, third, and fourth lines of Equation (32) are related to the first stage of the problem. The first and second terms are the costs of exchanged energy in the DA WEM and DA LEM, respectively. The third term is the marginal generation cost of dispatchable units. The fourth term is the operating cost of the CAES systems. The last two lines are associated with the second stage of the problem that illustrates the costs of exchanged energy in the RT WEM and the RT LEM, respectively.
subject to:
1. Power balance constraints:
Clearly, the exchanged power of the AG in both existing markets must be equal to its generation and consumption. Thus, the DA power balance of this autonomous agent in each period of time can be represented by Equation (33).
          w W P w , AG ( w , t ) + v V P v , AG ( v , t ) + i I P i , AG ( i , t ) + j J ( P jdis , AG ( j , t ) P jch , AG ( j , t ) ) = ( P sell , AG DA , WEM ( t ) + P buy DA , LEM ( t ) ) ( P buy , AG DA , WEM ( t ) + P sell DA , LEM ( t ) ) ,           t           λ 1 ( t )
It should be noted that P buy DA , LEM ( t ) is the purchased power of the DSO from the AG in the DA LEM; hence this parameter acts as sold power of the AG in this market. The same concept is valid for P sell DA , LEM ( t ) as well. On the contrary, after learning the stochastic parameters, the AG is able to compensate for its shortage or supply its surplus energy by taking part in the RT markets. This matter is illustrated in Equation (34).
          w W ( P w , AG ( w , t , s ) P w , AG ( w , t ) ) + v V ( P v , AG ( v , t , s ) P v , AG ( v , t ) ) = ( P sell , AG RT , WEM ( t , s ) + P buy RT , LEM ( t , s ) ) ( P buy , AG RT , WEM ( t , s ) + P sell RT , LEM ( t , s ) ) ,           t , s           λ 2 ( t , s )
Similarly, P buy RT , LEM ( t , s ) is the purchased power of the DSO from the AG in the RT LEM; hence this parameter acts as sold power of the AG in this market. The same concept is valid for P sell RT , LEM ( t , s ) as well.
2. Constraints of the exchanged power with the markets:
Similar to the leader, in order to avoid arbitrage opportunity between markets, the sold and purchased power of the follower in both stages cannot take place at the same time as well. Consequently, Equations (35) and (36) are used to limit the AG from simultaneous selling and buying of energy.
( P sell , AG DA , WEM ( t ) + P buy DA , LEM ( t ) ) ( P buy , AG DA , WEM ( t ) + P sell DA , LEM ( t ) ) = 0 ,           t           μ 1 ( t ) , μ 2 ( t )
( P sell , AG RT , WEM ( t , s ) + P buy RT , LEM ( t , s ) ) ( P buy , AG RT , WEM ( t , s ) + P sell RT , LEM ( t , s ) ) = 0   ,           t , s           μ 3 ( t , s ) , μ 4 ( t , s )
However, inasmuch as these constraints are non-linear, they should be linearized, as displayed in the following expressions.
P sell , AG DA , WEM ( t ) + P buy DA , LEM ( t ) M 3 Y 3 ( t ) ,             t
P buy , AG DA , WEM ( t ) + P sell DA , LEM ( t ) M 3 ( 1 Y 3 ( t ) ) ,             t
P sell , AG RT , WEM ( t , s ) + P buy RT , LEM ( t , s ) M 4 Y 4 ( t , s ) ,             t , s
P buy , AG RT , WEM ( t , s ) + P sell RT , LEM ( t , s ) M 4 ( 1 Y 4 ( t , s ) )   ,             t , s
3. Non-dispatchable resources constraints:
Equations (41) and (42) are provided to formulate the forecasted power of the AG’s WT and PV.
P w , AG ( w , t ) = { 0 , V ( t ) < V w , AG ci   or   V ( t ) > V w , AG co P w , AG R V ( t ) V w , AG ci V w , AG R V w , AG ci , V w , AG ci V ( t ) V w , AG R P w , AG R , V w , AG R V ( t ) V w , AG co ,
P v , AG ( v , t ) = P v , AG R ( G ( t ) G Ref ) [ 1 + Ψ ( T ( t ) T Ref ) ] ,
These equations are also used to calculate the output power of these units in different scenarios.
4. Dispatchable resources constraints:
The output power of the AG’s dispatchable units is limited by Equation (43).
P i , AG min P i , AG ( i , t ) P i , AG max ,           i , t           μ 5 ( i , t ) , μ 6 ( i , t )
Additionally, the operational constraints of these sources can be modeled as follows [40]:
P i , AG ( i , t ) P i , AG ( i , t 1 ) RU i , AG ,           i , t           μ 7 ( i , t )
Equations (44) and (45) limit the maximum increase and decrease in the power of dispatchable resources at each time interval, respectively. Furthermore, owing to the fact that, normally, the majority of the generated energy is traded in the DA markets, it is assumed that the offers of the AG’s generation units are only presented in the DA WEM as well as the DA LEM.
5. Compressed Air Energy Storage systems constraints:
The mathematical model and technical requirements of the AG’s CAES systems are presented in Equations (46) and (51). In this regard, the injected power as well as the produced power of the CAES are limited by Equations (46) and (47) [41].
P jch , AG min P jch , AG ( j , t ) P jch , AG max ,           j , t           μ 9 ( j , t ) , μ 10 ( j , t )
P jdis , AG min P jdis , AG ( j , t ) P jdis , AG max ,           j , t           μ 11 ( j , t ) , μ 12 ( j , t )
The amount of stored energy in the system and its related limitations are expressed in the following equations:
E j , AG ( j , t )   =   E j , AG init . ,           j , t   =   1           λ 3 ( j , t )
E j , AG ( j , t + 1 )   =   E j , AG ( j , t ) + P jch , AG ( j , t ) η inj P jdis , AG ( j , t ) / η pro ,           j , t   <   24           λ 4 ( j , t )
E j , AG fin .   =   E j , AG ( j , t ) + P jch , AG ( j , t ) η inj   P jdis , AG ( j , t ) / η pro ,           j , t   =   24           λ 5 ( j , t )
E j , AG min E j , AG ( j , t ) E j , AG max ,           j , t           μ 13 ( j , t , s ) , μ 14 ( j , t )
Accordingly, the initial amount of stored energy at the beginning of the first-time interval, as well as the final amount of stored energy at the end of the last time interval, are modeled by Equations (48) and (50), respectively. Additionally, the variation of stored energy and its limitation at each time interval are formulated by Equations (49) and (51), respectively. Similar to dispatchable units of the DER AG, bids and offers of the CAES systems are assumed to be provided only in the DA markets.

2.3.3. Bi-Level Programming Outline

In conclusion, to better clarify the provided leader–follower model, linking and non-linking variables of existing players are depicted in Figure 3. As it is shown in this figure, the DSO submits P sell DA , LEM , P sell RT , LEM and P buy DA , LEM , P buy RT , LEM as its offers and bids to the DER AG. Based on these proposals that act as parameters, the AG decides on P sell , AG DA , WEM , P sell , AG RT , WEM , P buy , AG DA , WEM , P buy , AG RT , WEM , P i , AG , P jdis , AG , P jch , AG . Then, these decision variables are sent back to the leader as the reaction of the follower to optimize the objective function of the DSO and to evaluate its expected operating costs. It should be emphasized that since the variables of the follower, namely P sell , AG DA , WEM , P sell , AG RT , WEM , P buy , AG DA , WEM , P buy , AG RT , WEM , P i , AG , P jdis , AG , P jch , AG are directly present in the power balance expressions of the leader, i.e., Equations (12) and (15), the proposed framework can be considered as a bi-level leader–follower problem.

2.3.4. Reformulation of the Proposed Model to a Single Level

One of the most prevailing techniques to solve leader–follower game-theoretic problems is the Karush–Kuhn–Tucker (KKT) formulation. Generally, if the problem of the follower is linear and continuous, the global optimality can be guaranteed by using this method [42]. On the other hand, owing to the presence of complementary constraints, a non-linear single-level problem is produced from KKT conditions. In this study, to linearize the non-linear problem with these kinds of limitations, the Big-M approach is suggested. The general mathematical formulation of the mentioned framework was described in more detail in [43]. According to the aforementioned explanations, the single-level model of the considered problem is formulated as follows:
O . F Ξ single-level = Min     t T { ( P buy , DSO DA , WEM ( t ) P sell , DSO DA , WEM ( t ) ) λ DA , WEM ( t ) + ( P buy DA , LEM ( t ) P sell DA , LEM ( t ) ) λ DA , LEM ( t ) + i I a i , DSO P i , DSO ( i , t ) + b i , DSO . U i , DSO ( i , t ) + SU i , DSO ( i , t ) + SD i , DSO ( i , t ) + s S ρ ( s )   [ ( P buy , DSO RT , WEM ( t , s ) P sell , DSO RT , WEM ( t , s ) ) λ RT , WEM ( t , s ) + ( P buy RT , LEM ( t , s ) P sell RT , LEM ( t , s ) ) λ RT , LEM ( t , s ) + i I ( a i , DSO up P i , DSO up ( i , t , s ) a i , DSO dn P i , DSO dn ( i , t , s ) ) ]   } ,
In the above equation, Ξ is a set for decision variables of the single-level problem that includes: { P buy , DSO DA , WEM , P buy , DSO RT , WEM , P sell , DSO DA , WEM , P sell , DSO RT , WEM , P buy , AG DA , WEM , P buy , AG RT , WEM , P sell , AG DA , WEM , P sell , AG RT , WEM , P buy DA , LEM , P buy RT , LEM , P sell DA , LEM , P sell RT , LEM , P i , DSO , P i , DSO up , P i , DSO dn , P i , AG , P jdis , AG , P jch , AG } .
subject to:
1. Constraints of the leader:
Equations (3)–(15), (18)–(21), (24)–(27), (30) and (31)
2. Primal equality constraints of the follower:
Equations (33), (34) and (48)–(50)
3. Stationary constraints:
λ DA , WEM ( t ) λ 1 ( t ) μ 1 ( t ) = 0 ,             t
λ DA , WEM ( t ) + λ 1 ( t ) μ 2 ( t ) = 0 ,             t
ρ ( t ) λ RT , WEM ( t , s ) λ 2 ( t , s ) μ 3 ( t , s ) = 0 ,             t , s
ρ ( s ) λ RT , WEM ( t , s ) + λ 2 ( t , s ) μ 4 ( t , s ) = 0   ,             t , s
c i , AG + λ 1 ( t ) + μ 5 ( i , t ) μ 6 ( i , t ) μ 7 ( i , t ) + μ 8 ( i , t ) = 0 ,             i , t
OM com . λ 1 ( t ) + μ 9 ( j , t ) μ 10 ( j , t ) λ 4 ( j , t ) η inj | t   < 24 λ 5 ( j , t ) η inj | t   = 24 = 0 ,             j , t
( HR λ Gas + OM exp . ) + λ 1 ( t ) + μ 11 ( j , t ) μ 12 ( j , t ) + λ 4 ( j , t ) / η pro | t   < 24 + λ 5 ( j , t ) / η pro | t   = 24 = 0 ,             j , t
4. Primal inequality, complementary, and dual constraints:
0 M 3 Y 3 ( t ) ( P sell , AG DA , WEM ( t ) + P buy DA , LEM ( t ) )                     μ 1 ( t ) 0 ,
0 M 3 ( 1 Y 3 ( t ) )     ( P buy , AG DA , WEM ( t ) + P sell DA , LEM ( t ) )                     μ 2 ( t ) 0 ,
0 M 4 Y 4 ( t , s ) ( P sell , AG RT , WEM ( t , s ) + P buy RT , LEM ( t , s ) )                     μ 3 ( t , s ) 0 ,
0 M 4 ( 1 Y 4 ( t , s ) ) ( P buy , AG RT , WEM ( t , s ) + P sell RT , LEM ( t , s ) )                     μ 4 ( t , s ) 0 ,
0 P i , AG ( i , t ) P i , AG min                   μ 5 ( i , t ) 0 ,
0 P i , AG max P i , AG ( i , t )                     μ 6 ( i , t ) 0 ,
0 RU i , AG P i , AG ( i , t ) + P i , AG ( i , t 1 )                     μ 7 ( i , t ) 0 ,
0 RD i , AG P i , AG ( i , t 1 ) + P i , AG ( i , t )                     μ 8 ( i , t ) 0 ,
0 P jch , AG ( j , t ) P jch , AG min                     μ 9 ( j , t ) 0 ,
0 P jch , AG max P jch , AG ( j , t )                     μ 10 ( j , t ) 0 ,
0 P jdis , AG ( j , t ) P jdis , AG min                     μ 11 ( j , t ) 0 ,
0 P jdis , AG max P jdis , AG ( j , t )                     μ 12 ( j , t ) 0 ,
0 E j , AG ( j , t ) E j , AG min                     μ 13 ( j , t ) 0 ,
0 E j , AG max E j , AG ( j , t )                     μ 14 ( j , t ) 0 ,
λ 1 ( t )     ,     λ 2 ( t , s )     ,     λ 3 ( j , t )     ,     λ 4 ( j , t )     ,     λ 5 ( j , t )           Unrestricted ,
5. Linearization of complementary constraints:
Complementary constraints in Equations (62)–(75) are linearized by using the following expression, in which M is a large value, and X is a binary variable.
0 κ         ν 0           κ 0     ,     ν 0           { κ M X ν M ( 1 X ) ,

3. Numerical Results and Discussion

In this section, the proposed methodology is examined and validated in two case studies. In this regard, first, the studied system and its input data are introduced. Afterwards, analyses of the simulation results are discussed thoroughly.

3.1. Input Data

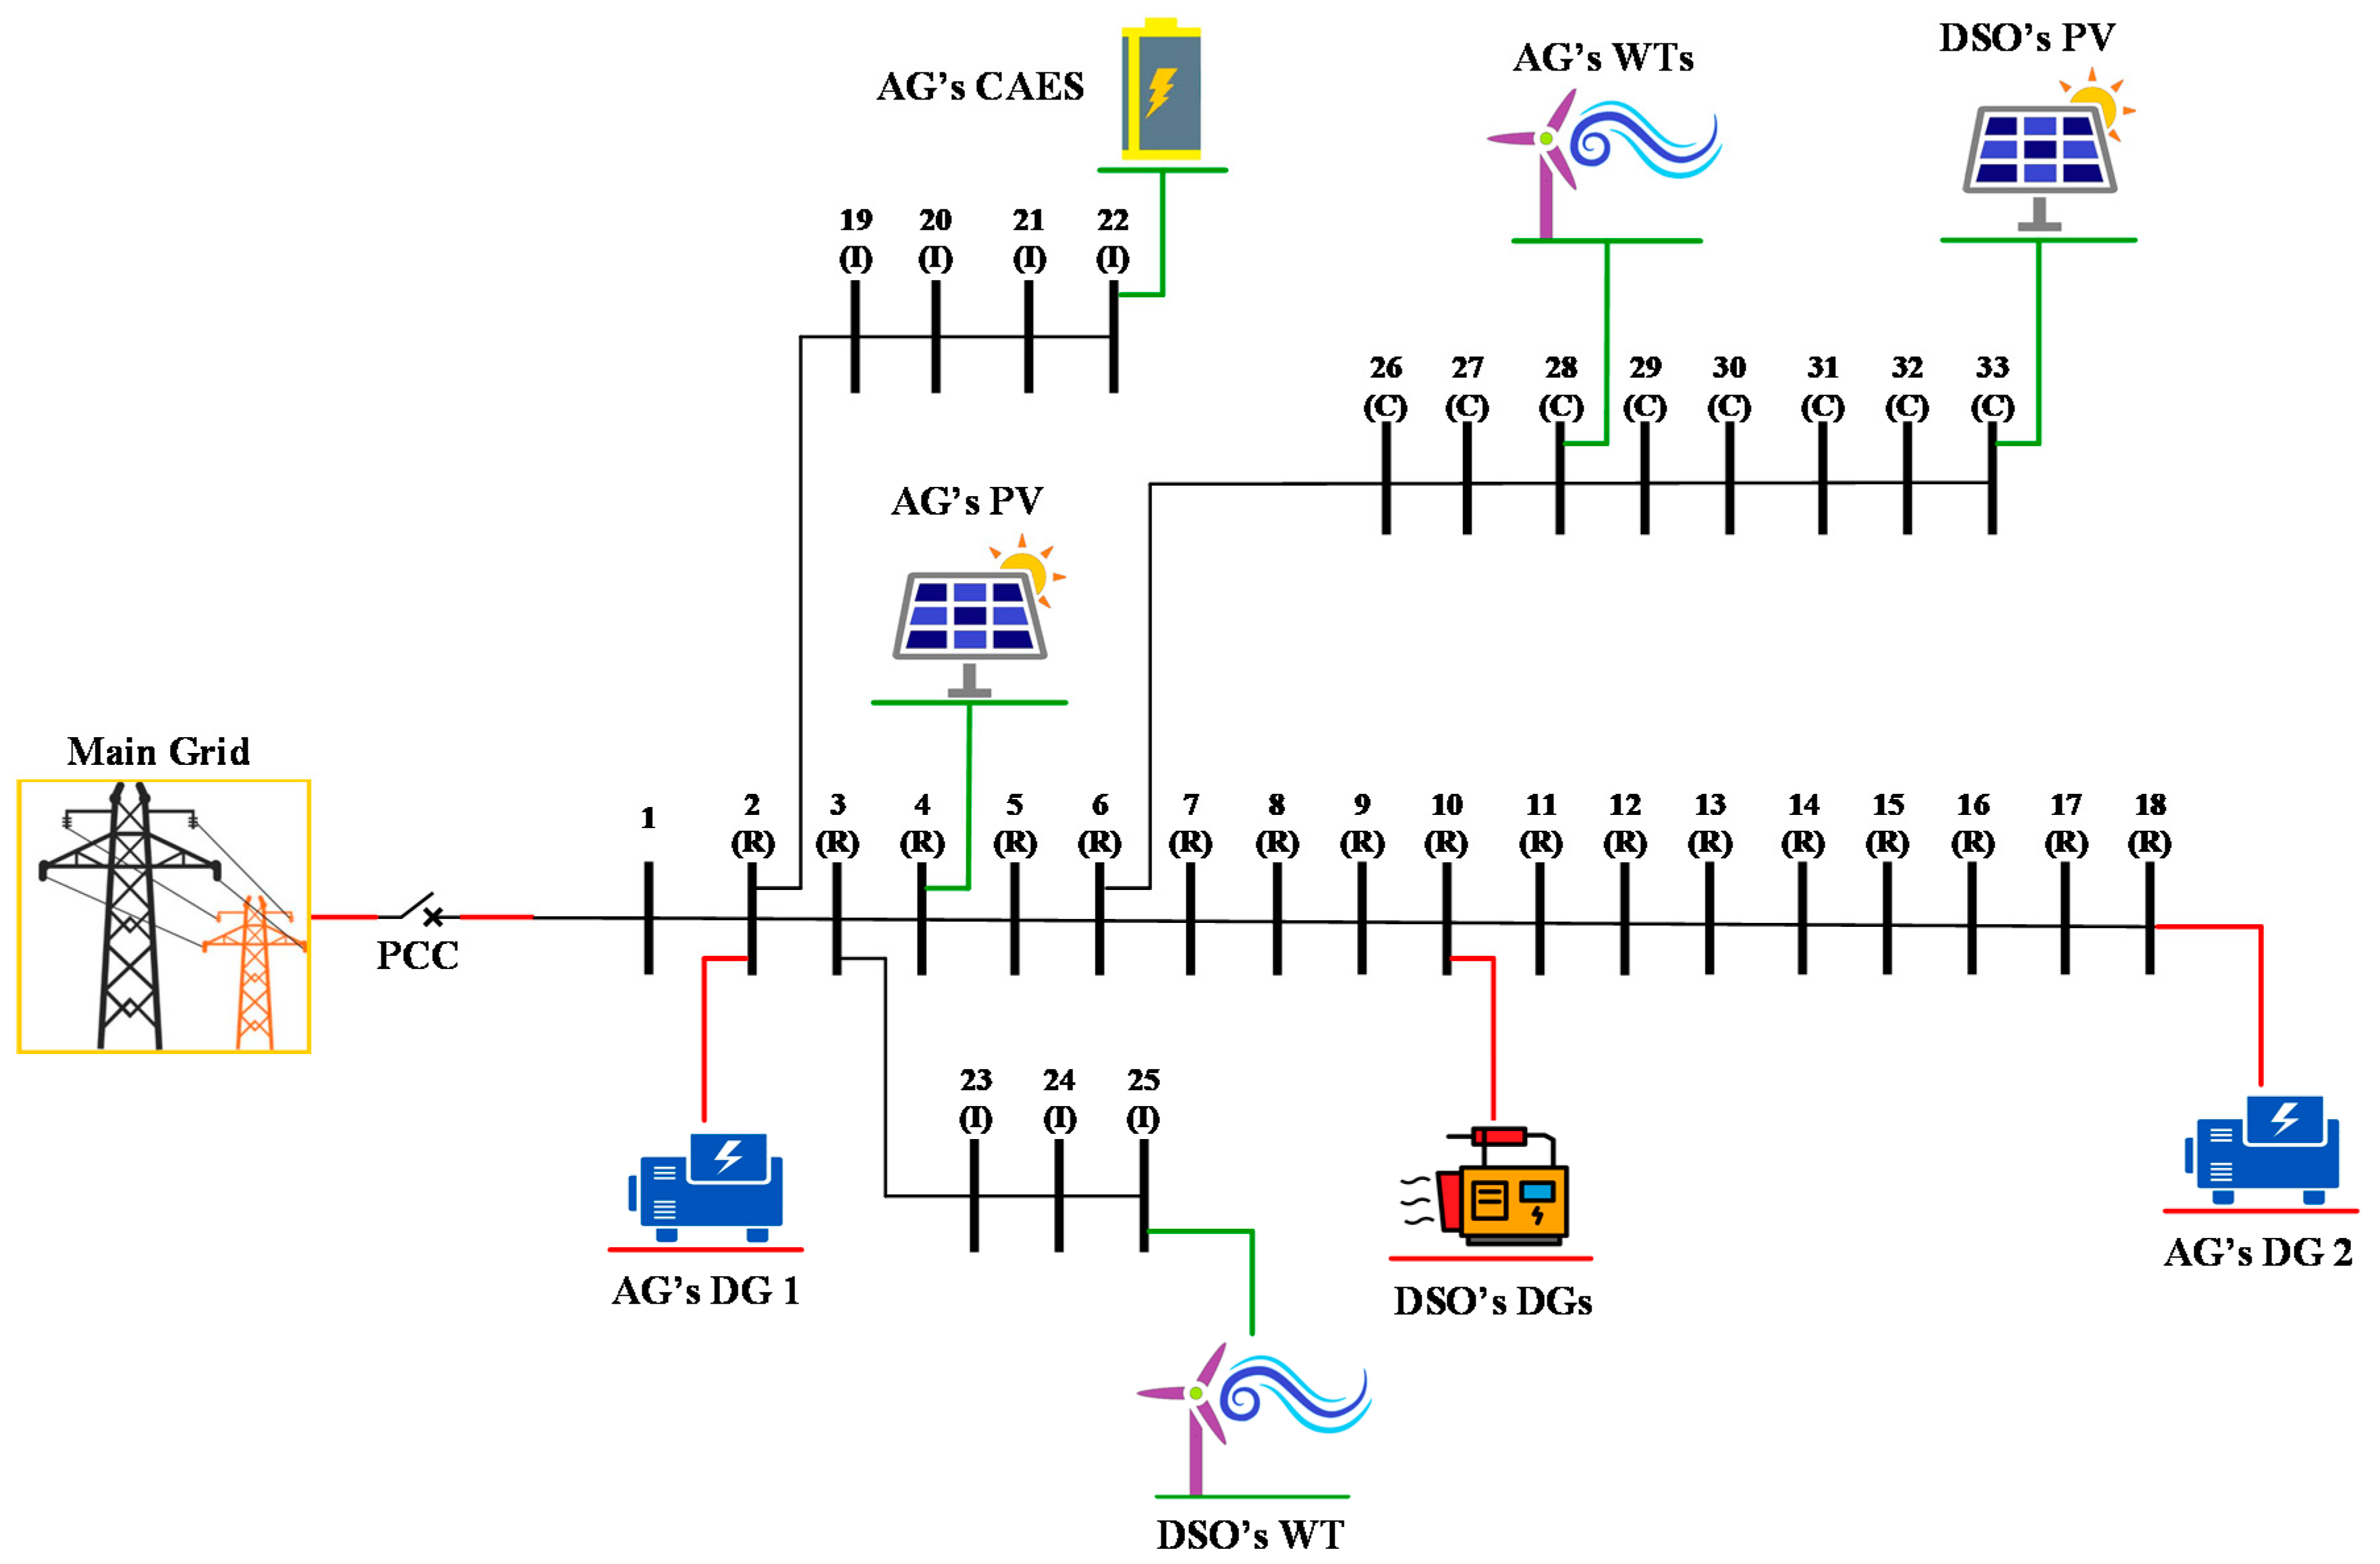
A modified IEEE 33-Bus SDN was selected in order to test the provided framework. Figure 4 illustrates the one-line diagram of the distribution system. As it is shown in this figure, the SDN has three types of loads: Commercial (C), Industrial (I), and Residential (R).
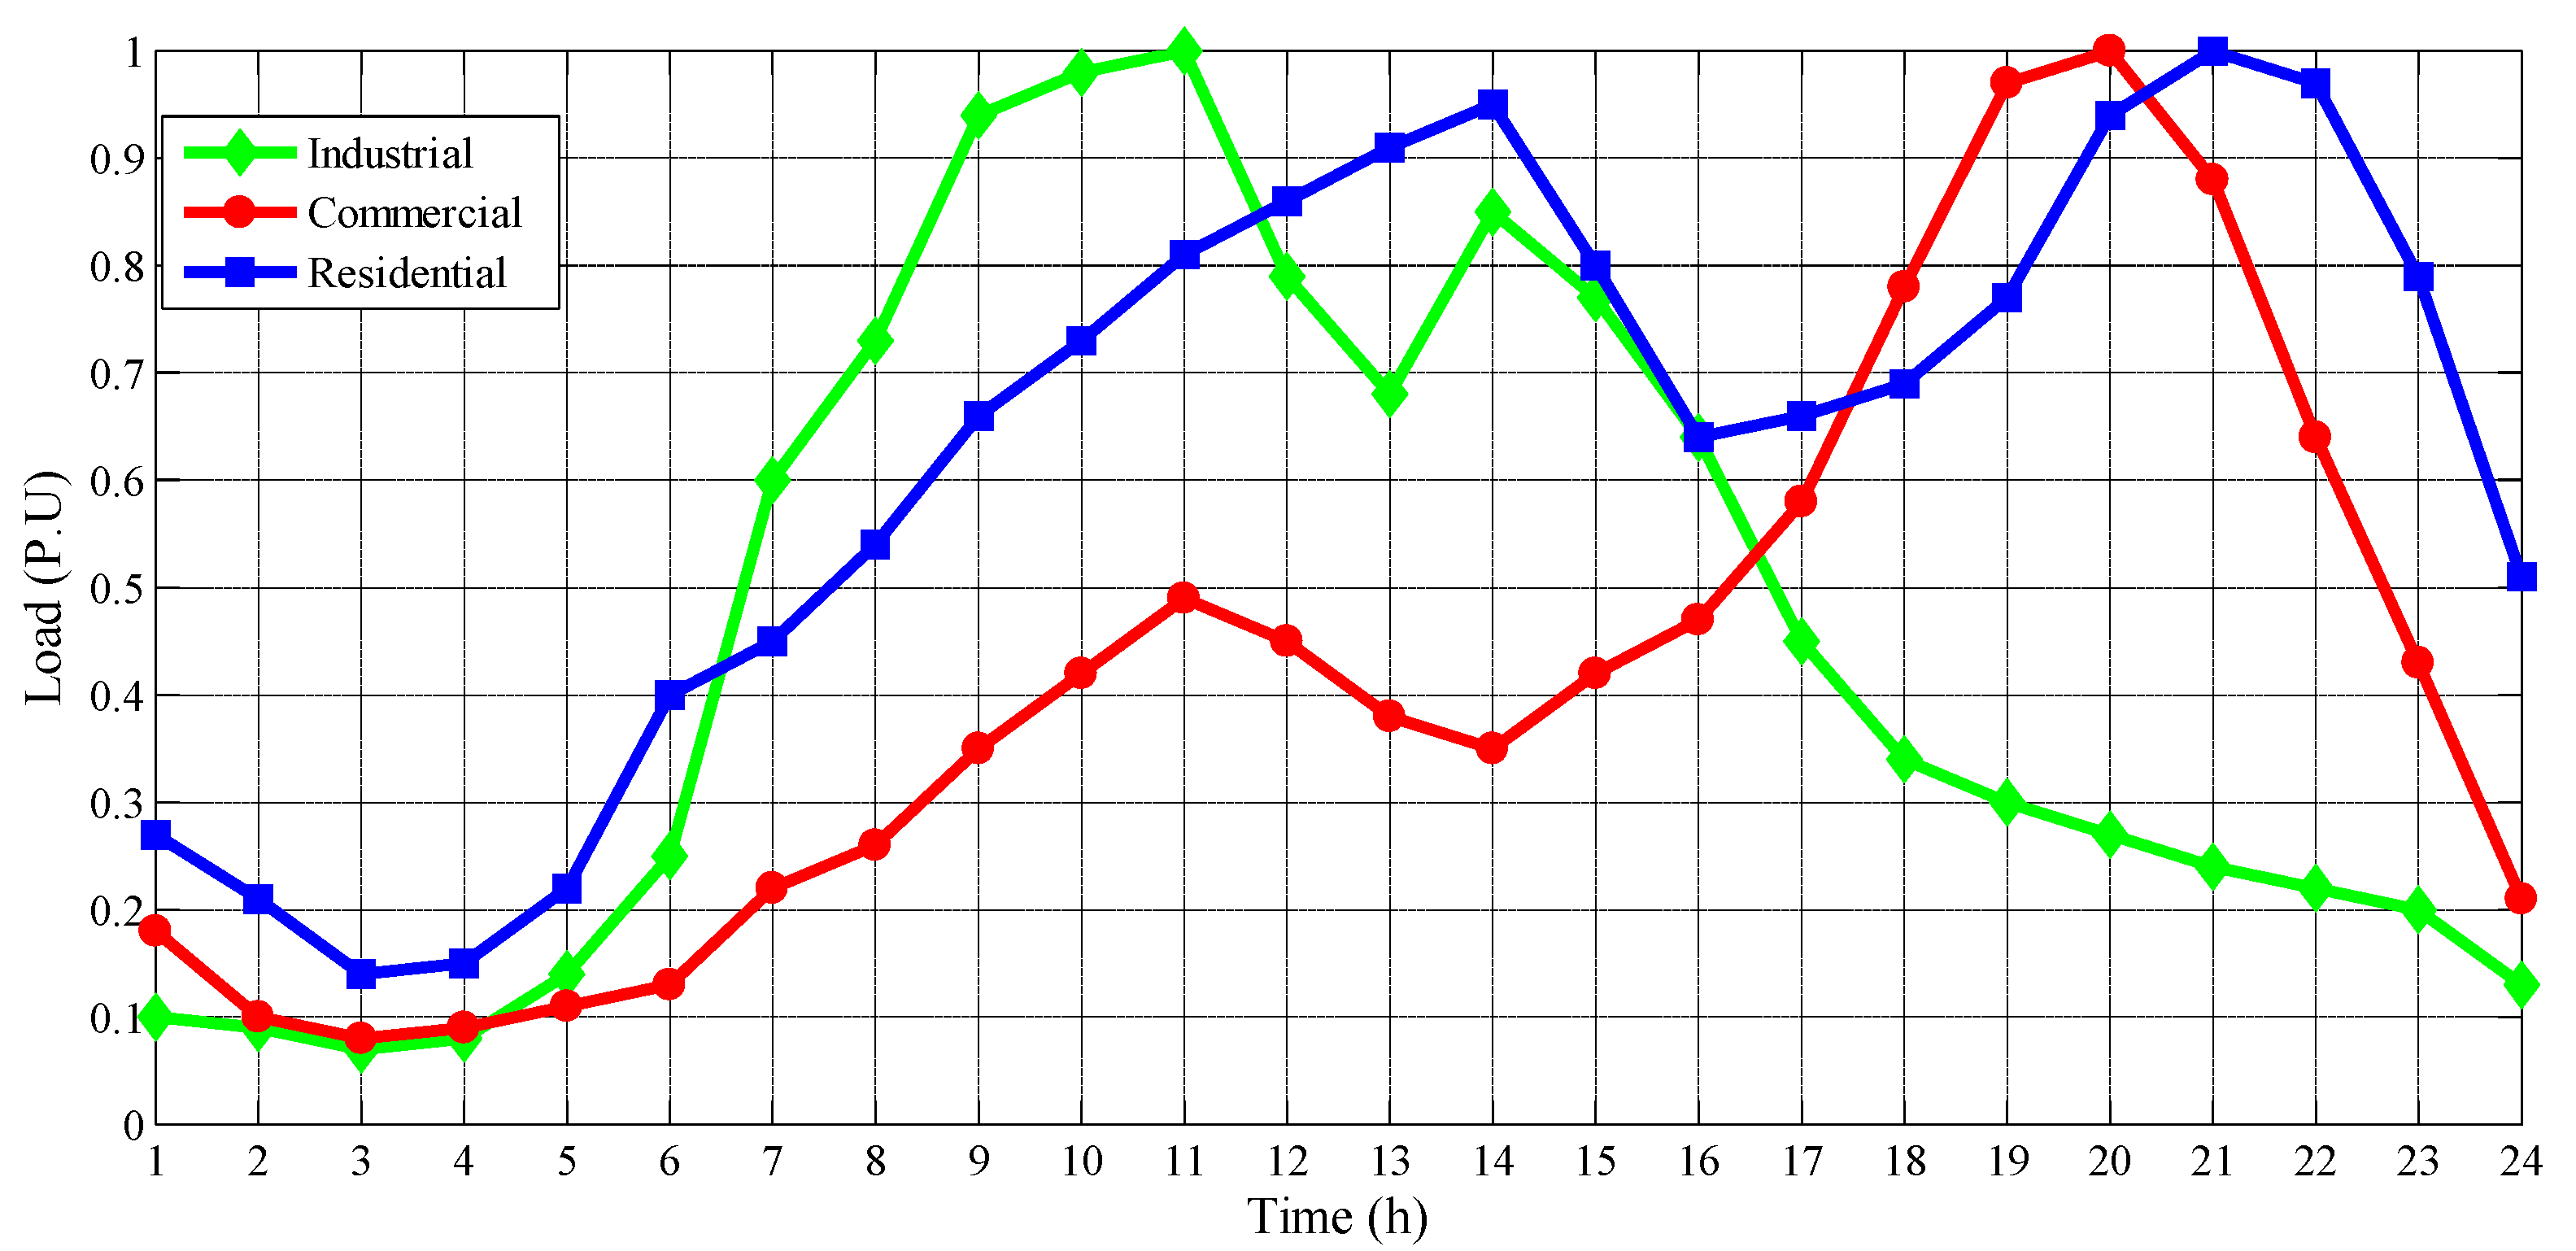
The forecasted load profiles of the network in the p.u. (per-unit) form are displayed in Figure 5. In addition, the peak demand of each load is reported in Table 3.
As it is observed, the forecasted demand of each bus during the day is obtained by multiplying its peak demand by the p.u. load profiles. Additionally, based on the explained methods as for the scenario generation and reduction, 10 profiles are obtained for each type of load. By multiplying these profiles by the peak demands, the RT load demands are modeled.
According to Figure 4, the DSO has three kinds of local resources at buses 10, 25, and 33. In contrast, the AG’s decentralized DERs are located at buses 2, 4, 18, 22, and 28. The input data and characteristics of these units are summarized in Table 4, Table 5 and Table 6. Additionally, the temperature profile of the studied area was taken from [44].
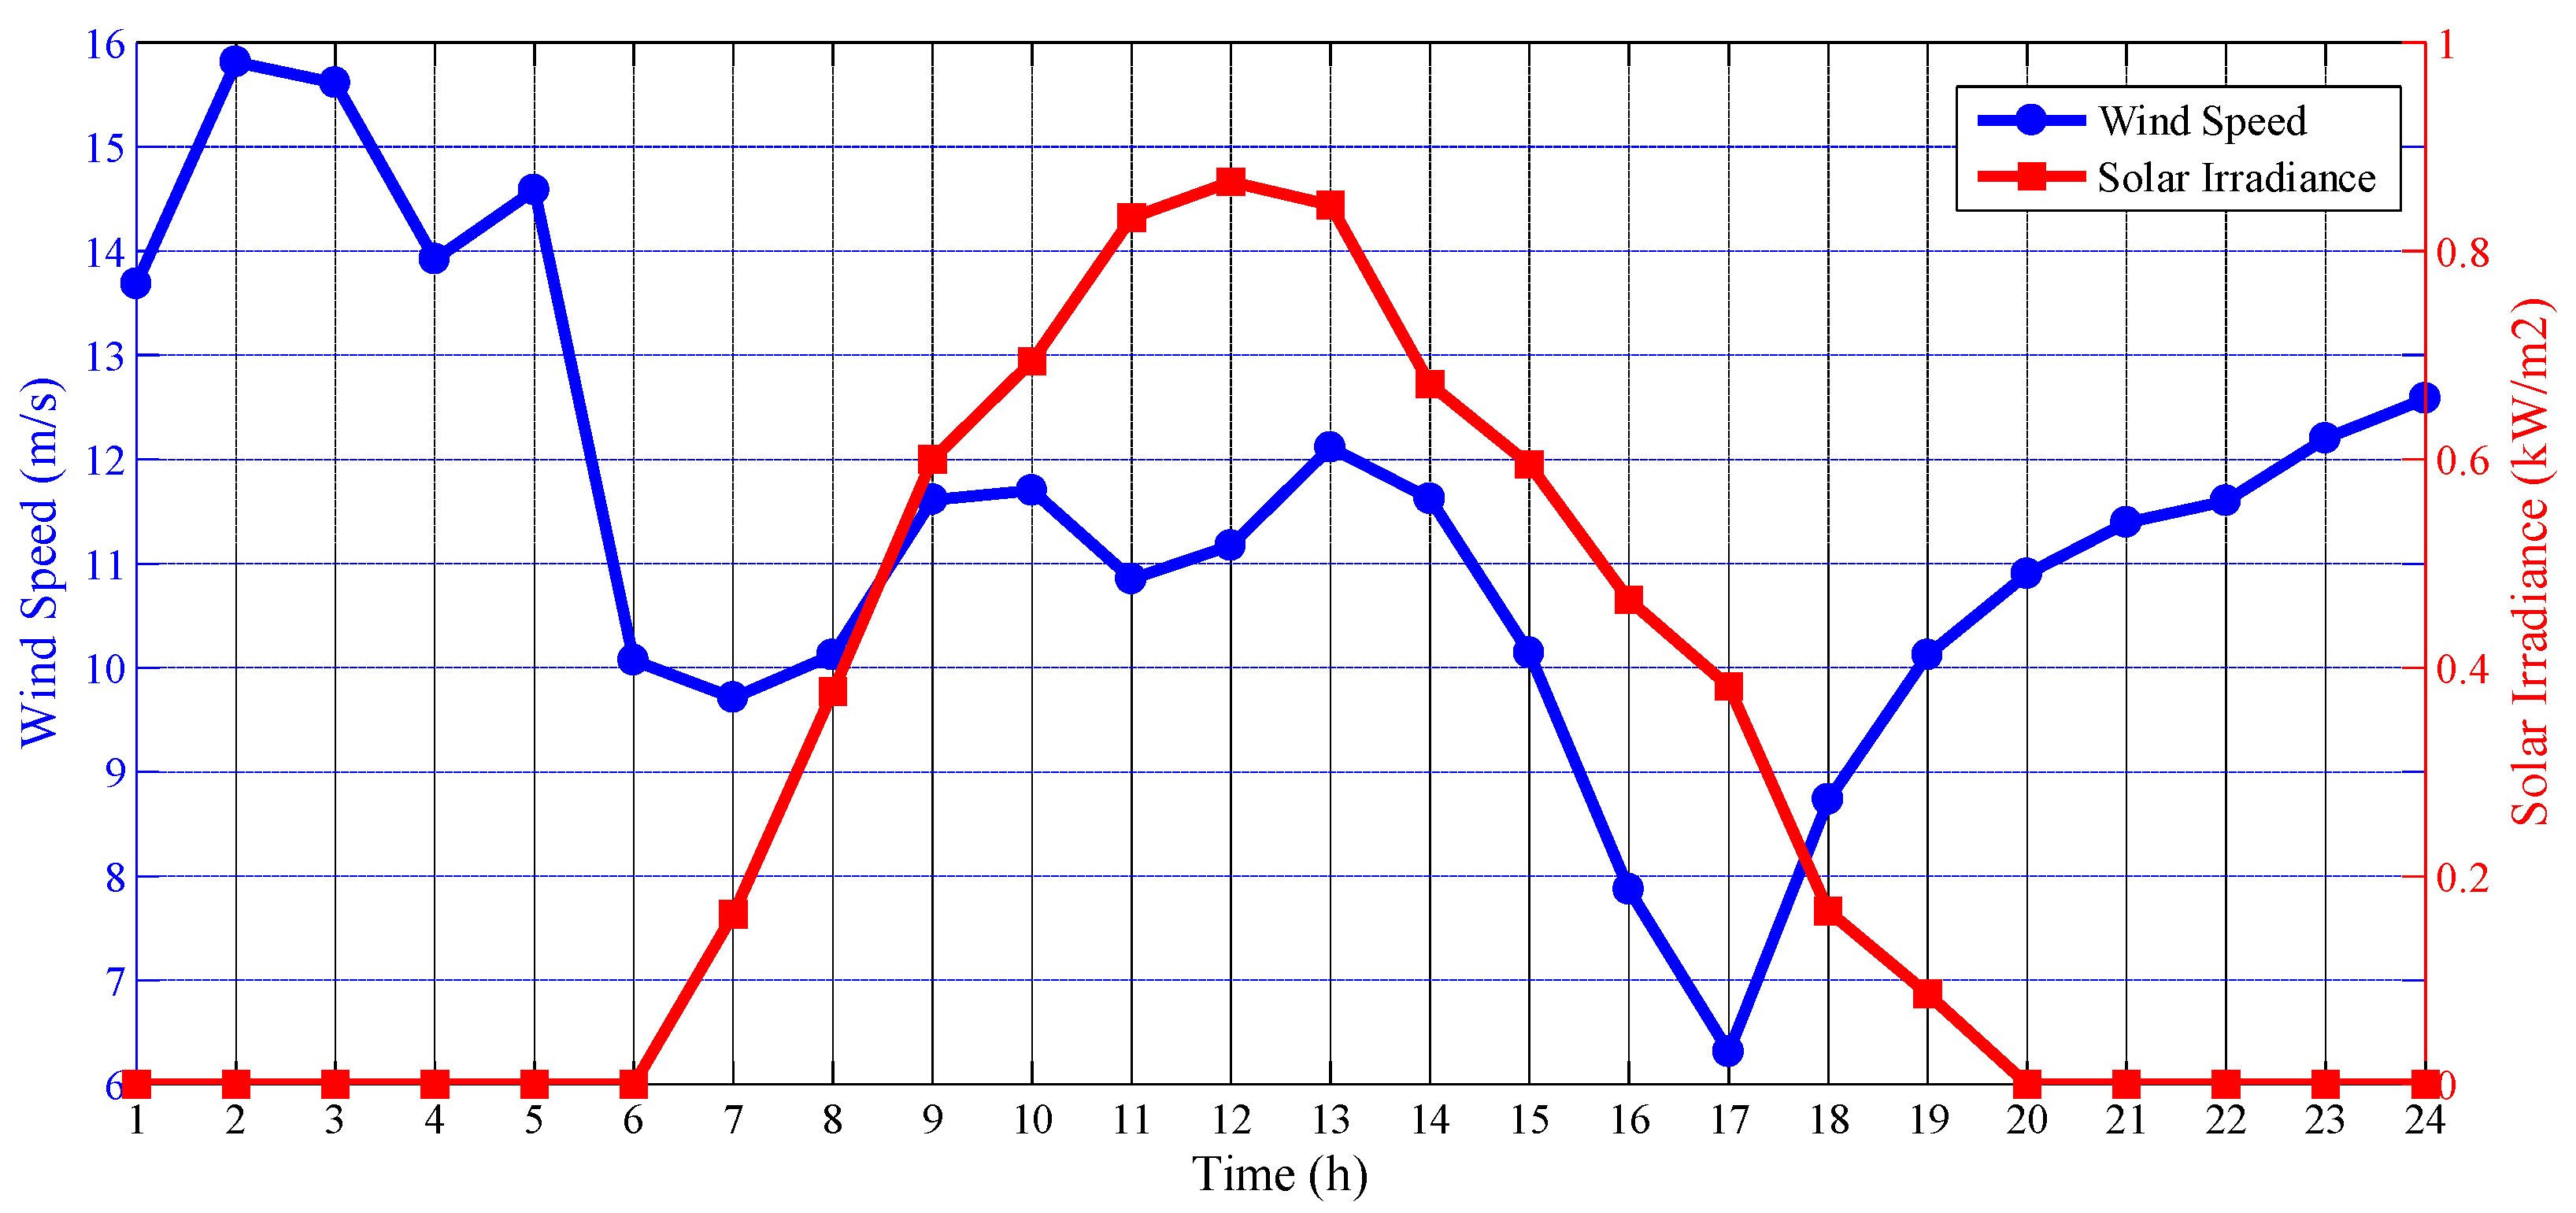
Moreover, the wind speed and solar irradiance forecast during a typical day are shown in Figure 6. Similar to the demand, for the uncertainty modeling of wind speed and solar radiation in the RT, 10 different scenarios are used based on the aforementioned procedures.
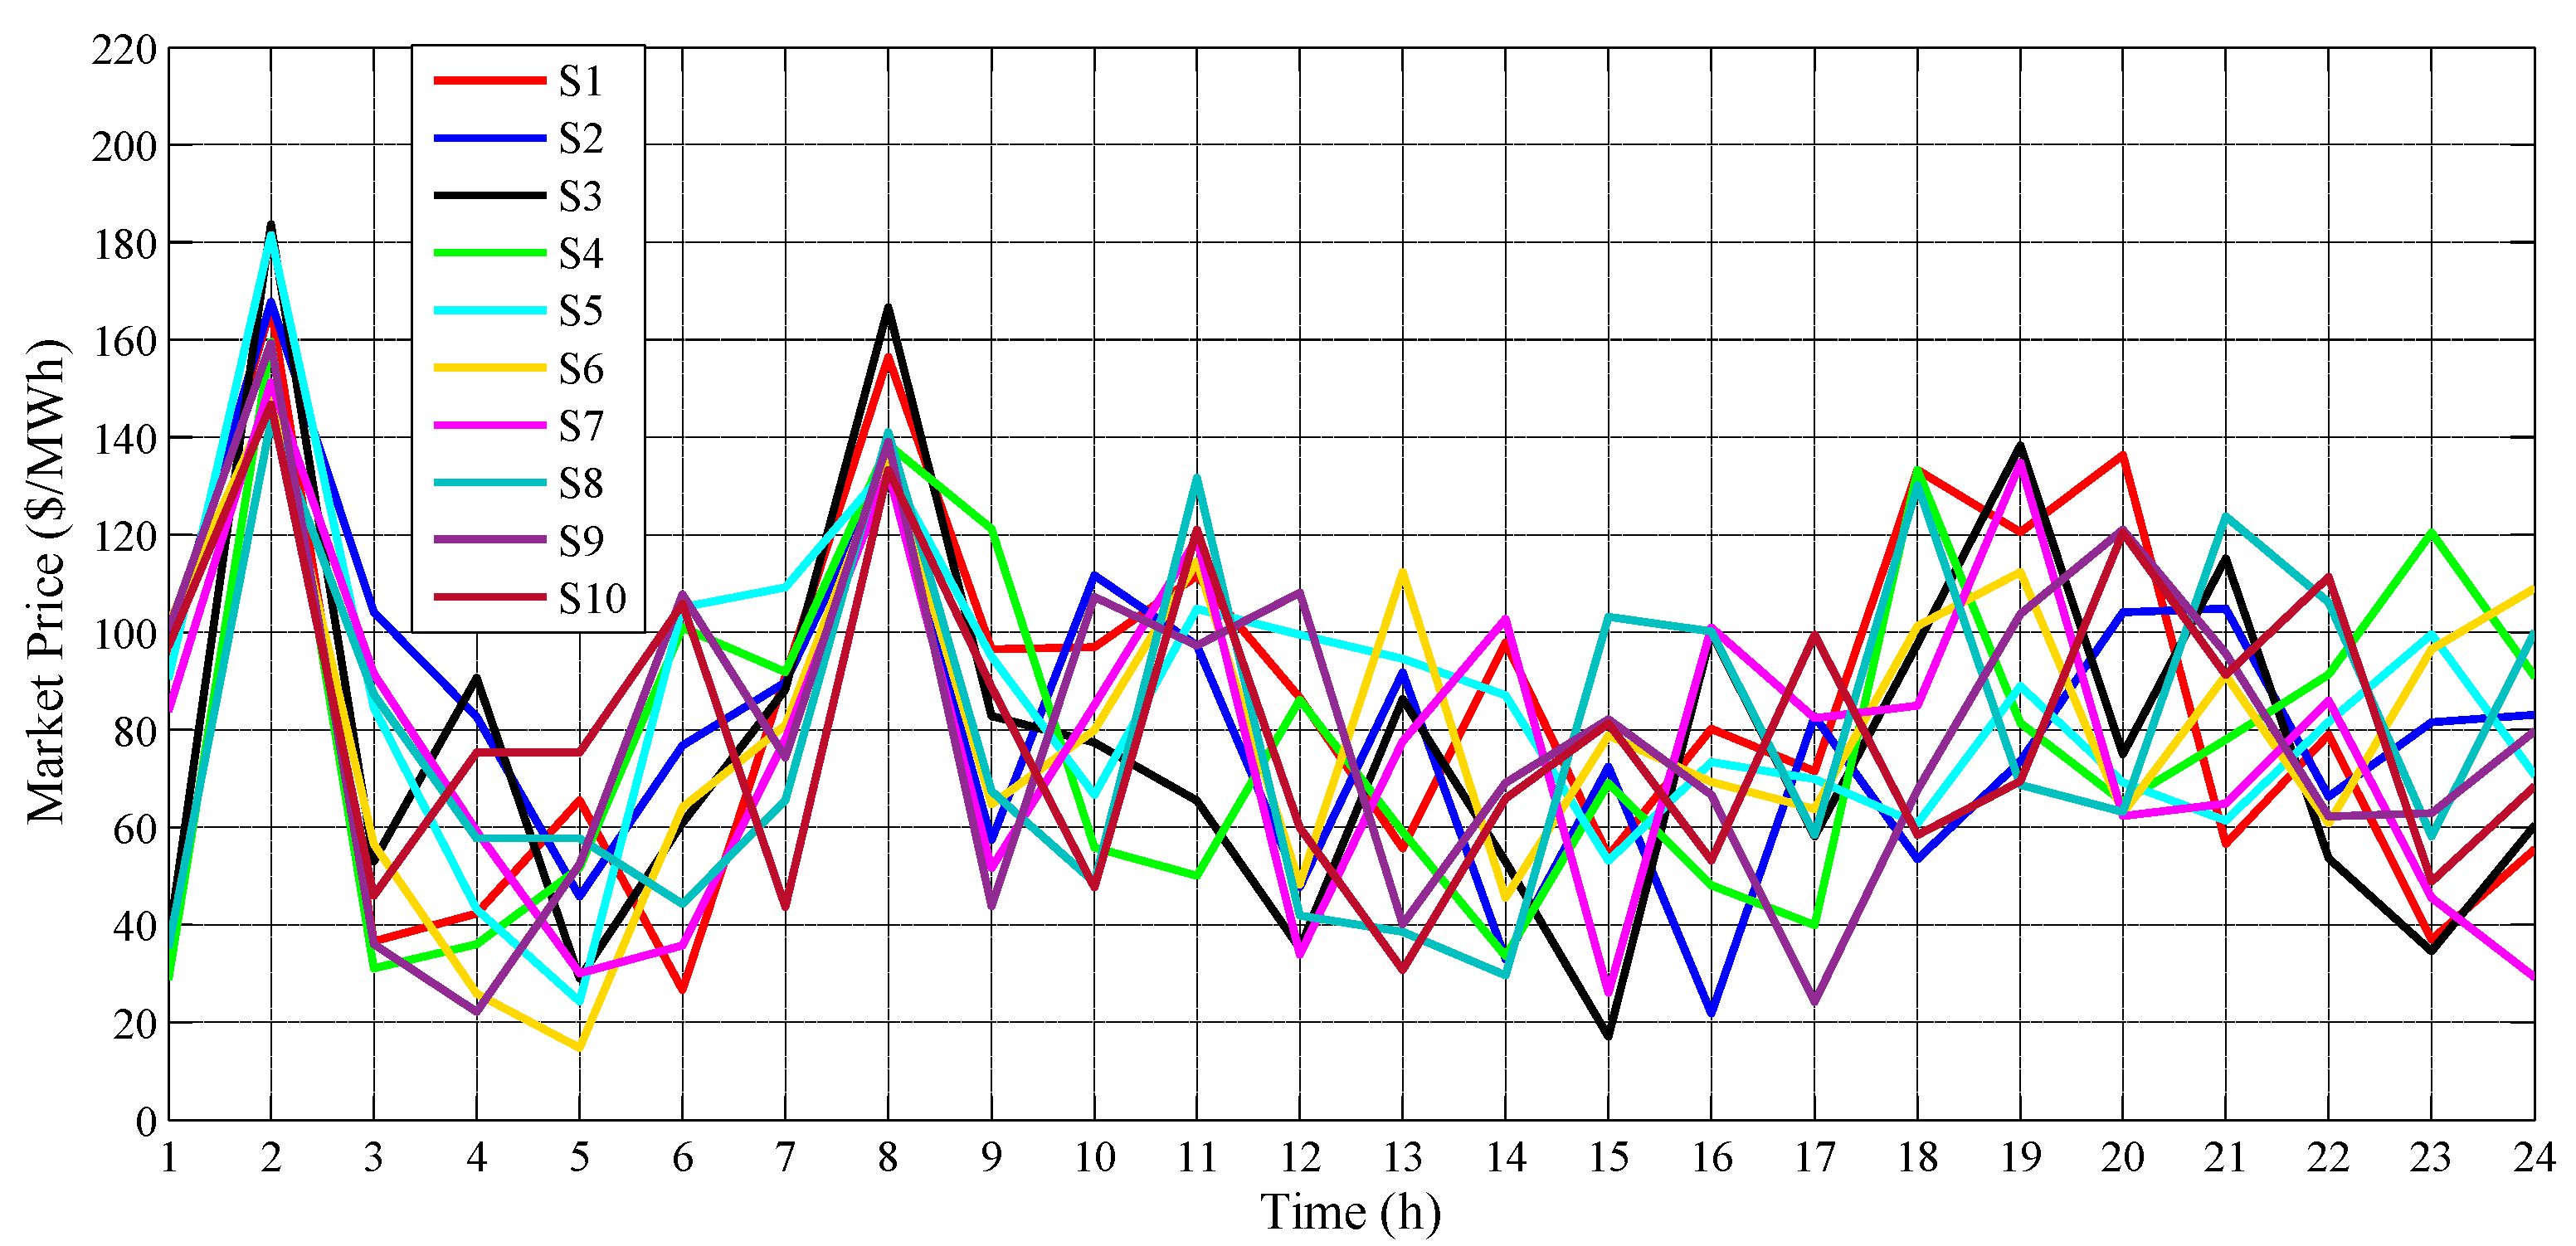
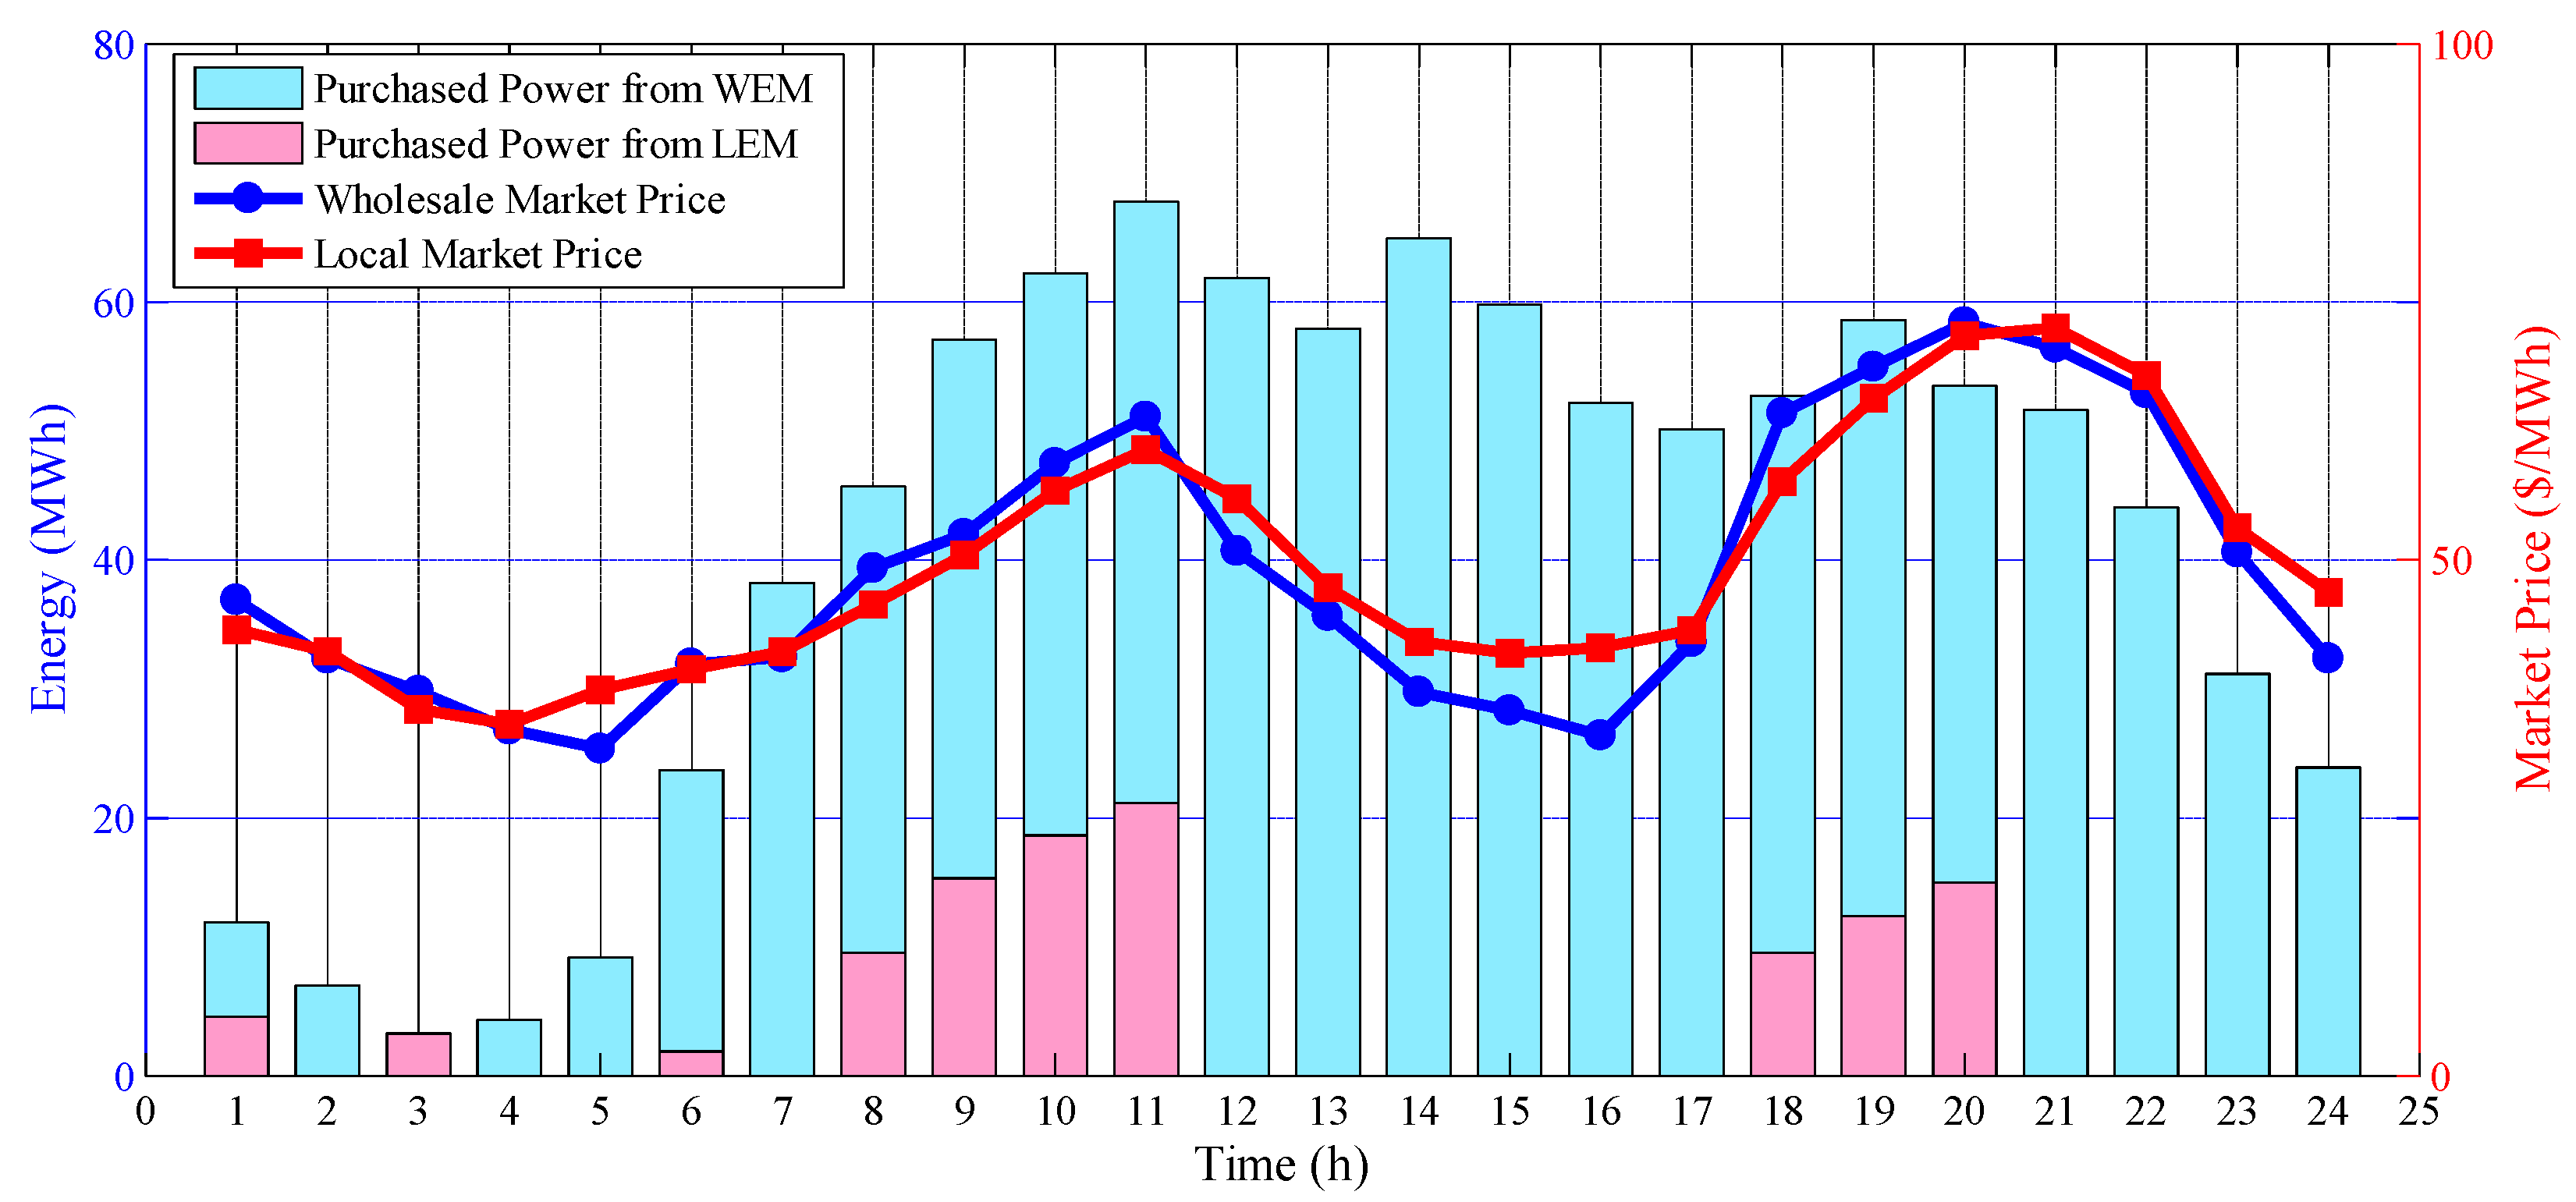
Furthermore, the DA market prices were predicted based on Figure 7. Note that the price of the LEM in the early hours of the day is lower than the price of the WEM. This issue ensues from the existence of the solar-based production at these hours. By considering the forecasted values as well as the normal PDF of errors, 10 reduced scenarios are used for the uncertainty modeling of the RT market prices. For instance, the RT WEM prices are shown in Figure 8.

3.2. Analysis of Simulation Results

To examine the effectiveness of the suggested algorithm, two case studies are implemented, and their outputs are compared with one another. The considered model stated by Equations (52)–(77) is a mixed-integer linear programming problem, which is solved by the CPLEX solver in the General Algebraic Modeling System software. The optimality gap of the optimization model is set to 0.0, and the running time of it is less than 100 s. The personal computer used for simulation has an Intel Core i7-4510U CPU (2.60-GHz) and 8 GB of RAM.

3.2.1. Case Study 1: Considering the Game-Theoretic Approach

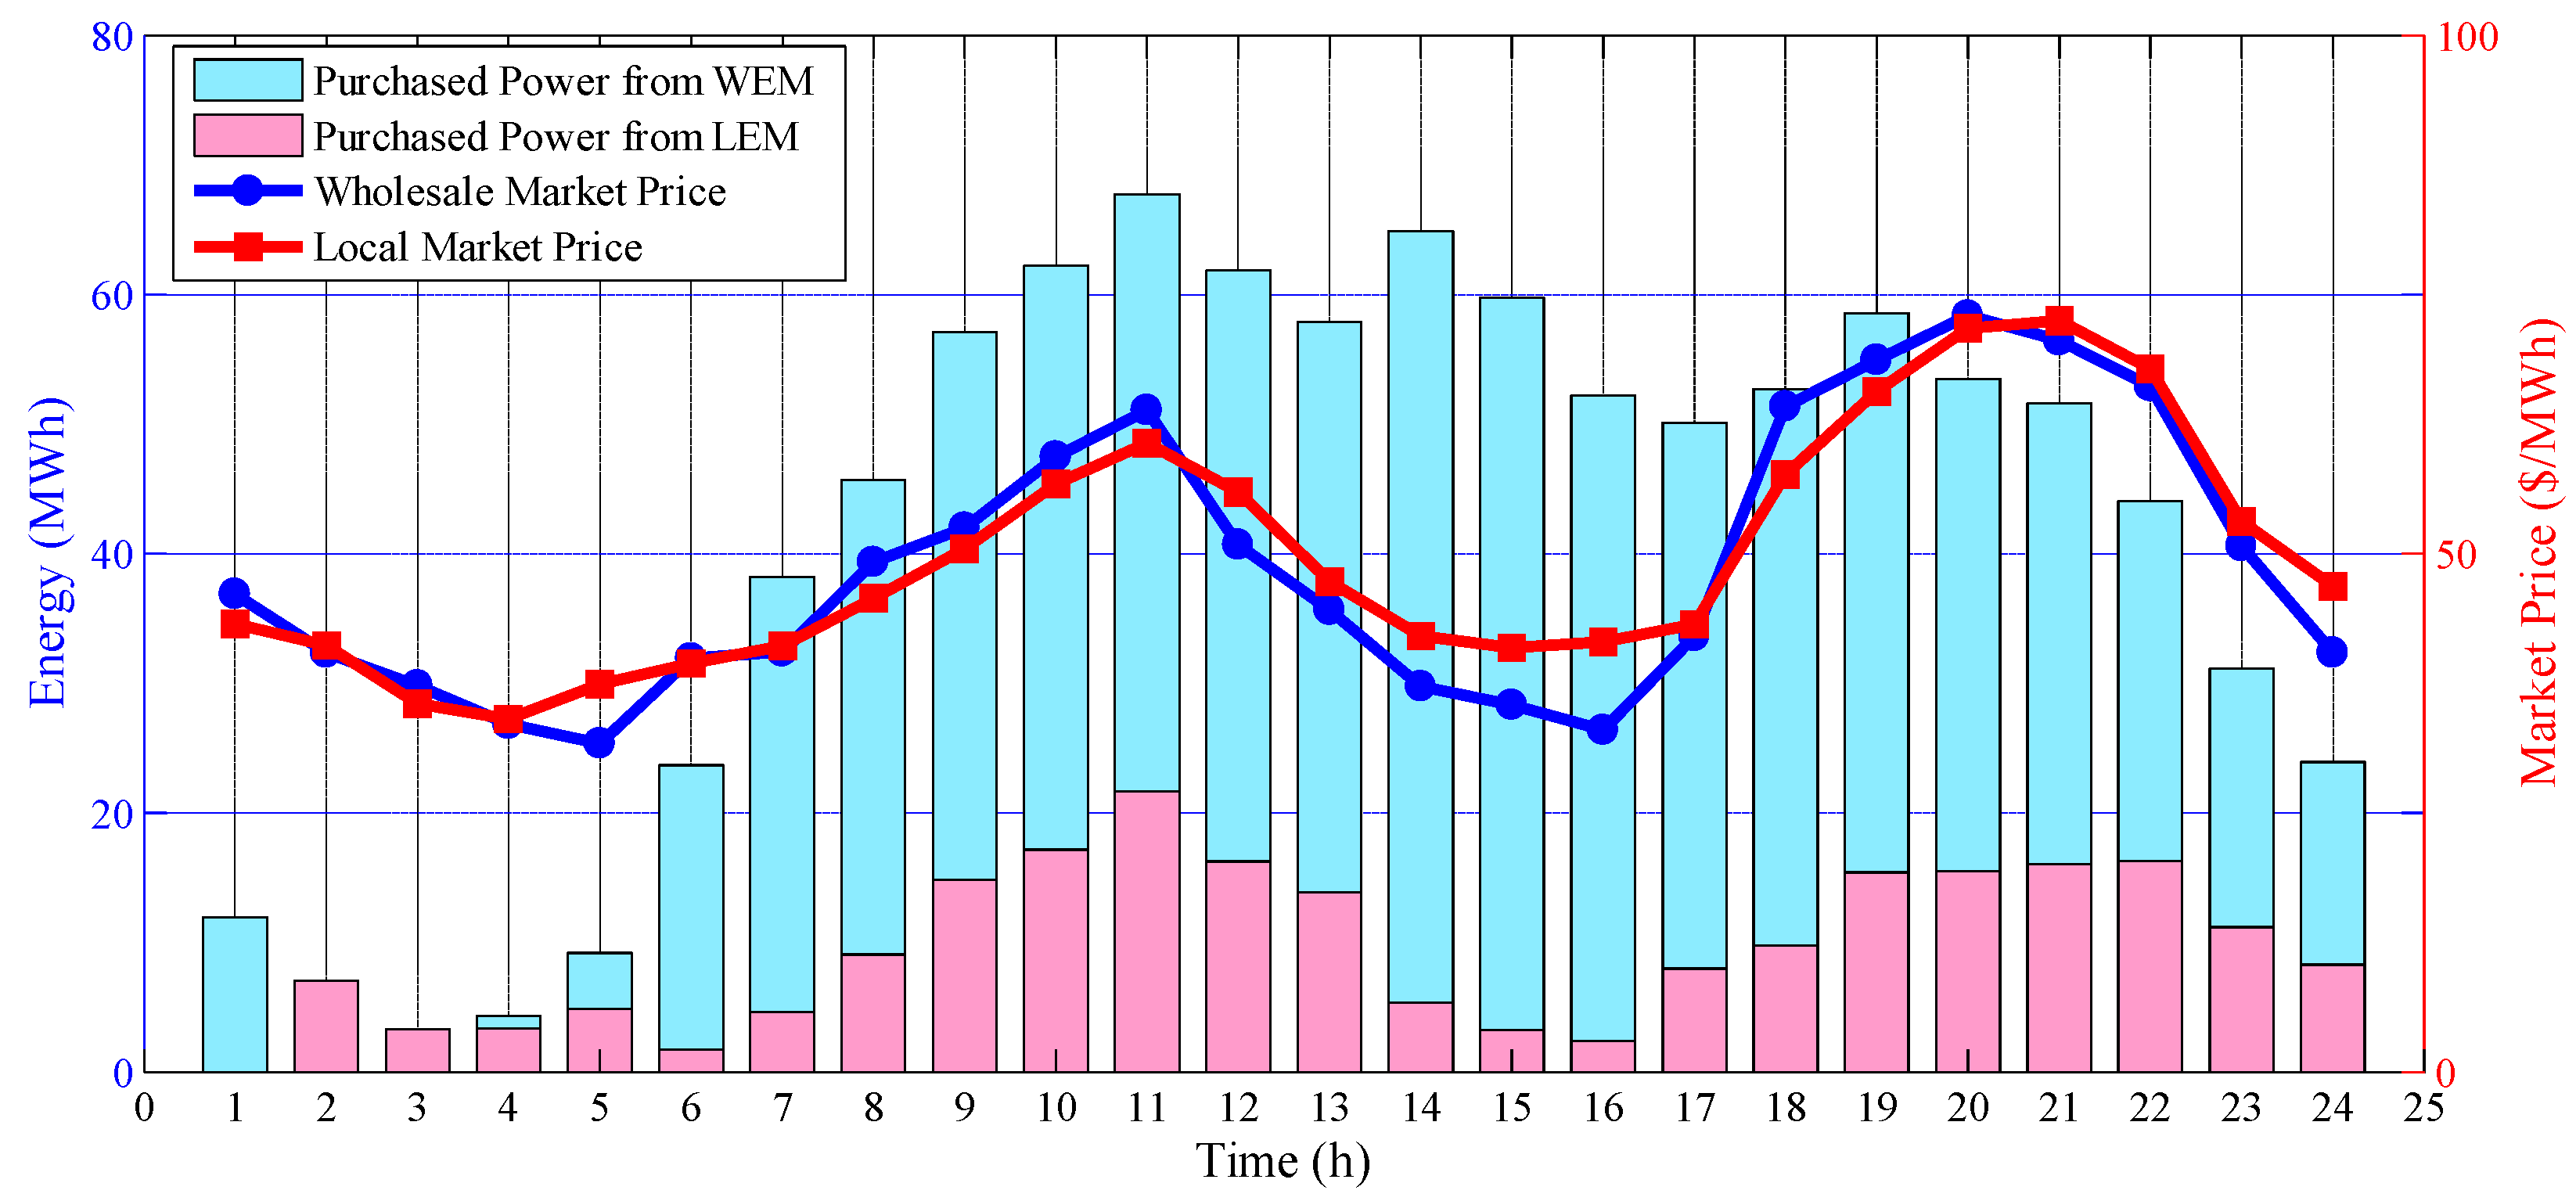
In this case, existing players of the SDN are able to optimize their objective functions independently through the proposed Stackelberg game-based framework. The exchanged energy of the DSO with available markets in the DA stage is displayed in Figure 9.
To better investigate the pattern of energy exchange, forecasted prices of markets are illustrated in the above figure. Clearly, the DSO procures its required energy from the LEM when the price of this market is lower than the price of the WEM. Furthermore, in the here-and-now stage, the DSO is not inclined to sell its energy to both markets. On the other hand, the optimal operating points of the DSO’s non-dispatchable as well as dispatchable local resources are shown in Figure 10. According to this figure, the DSO’s dispatchable units were exploited at their minimum capacities in the early hours of the day, so that the DSO is able to utilize the reserve capacity of these sources in the RT stage. However, during hours 20 to 23, the simultaneous peak of the DA market prices and demand makes the DSO use its own dispatchable units at their maximum capacities.
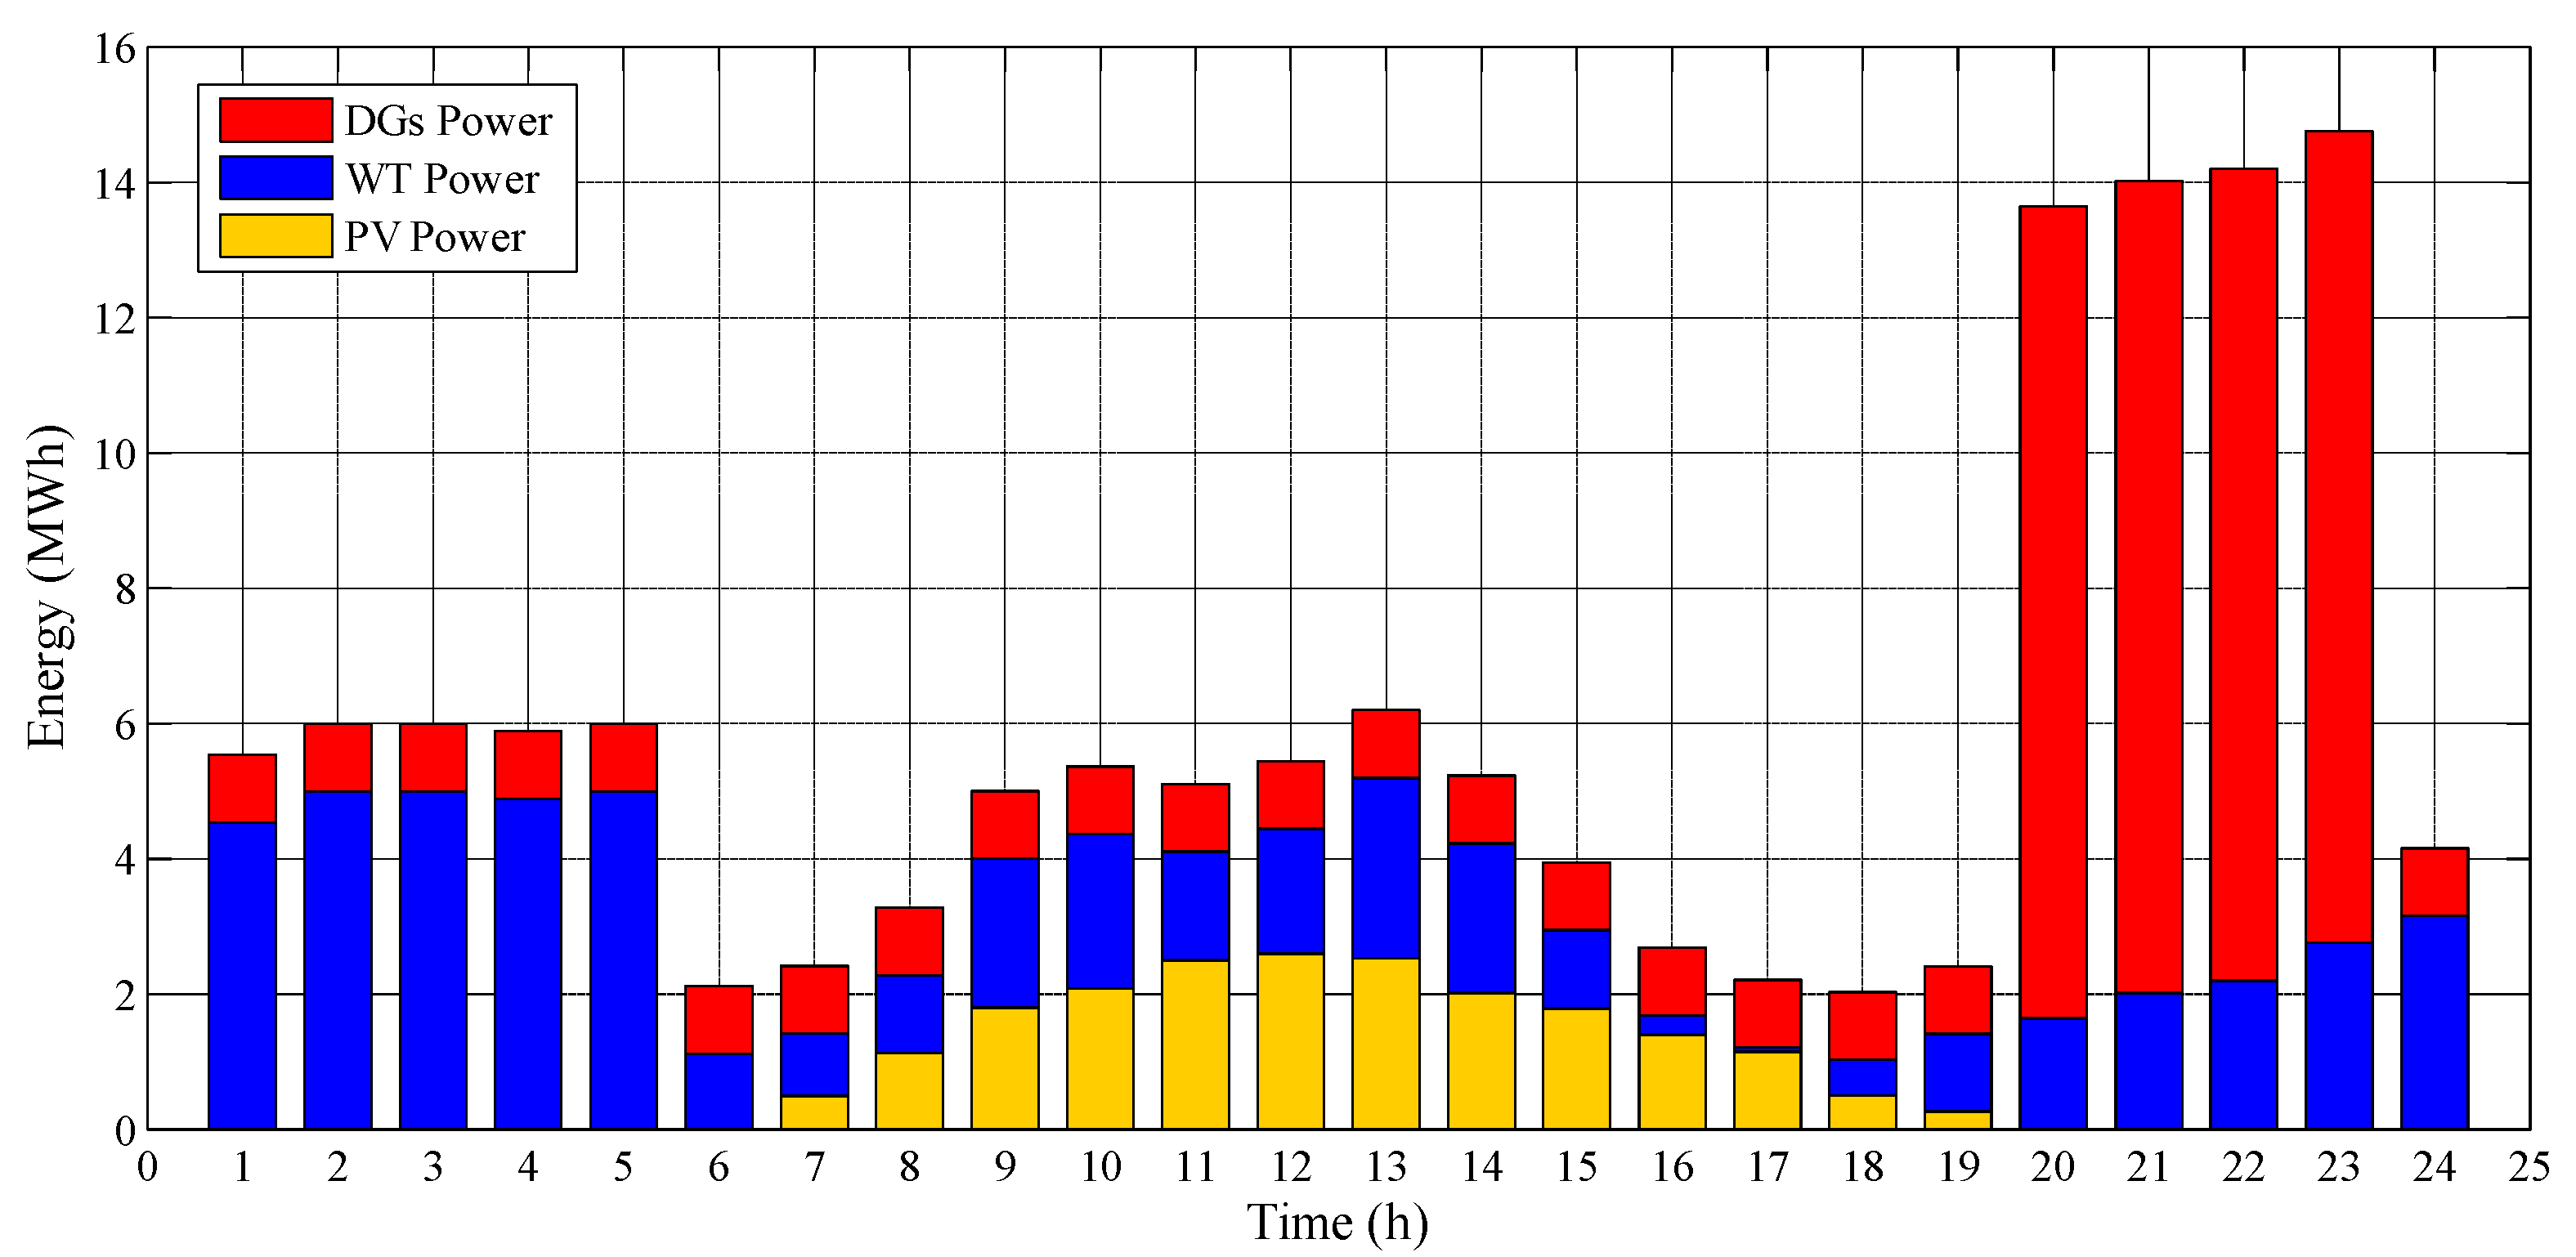
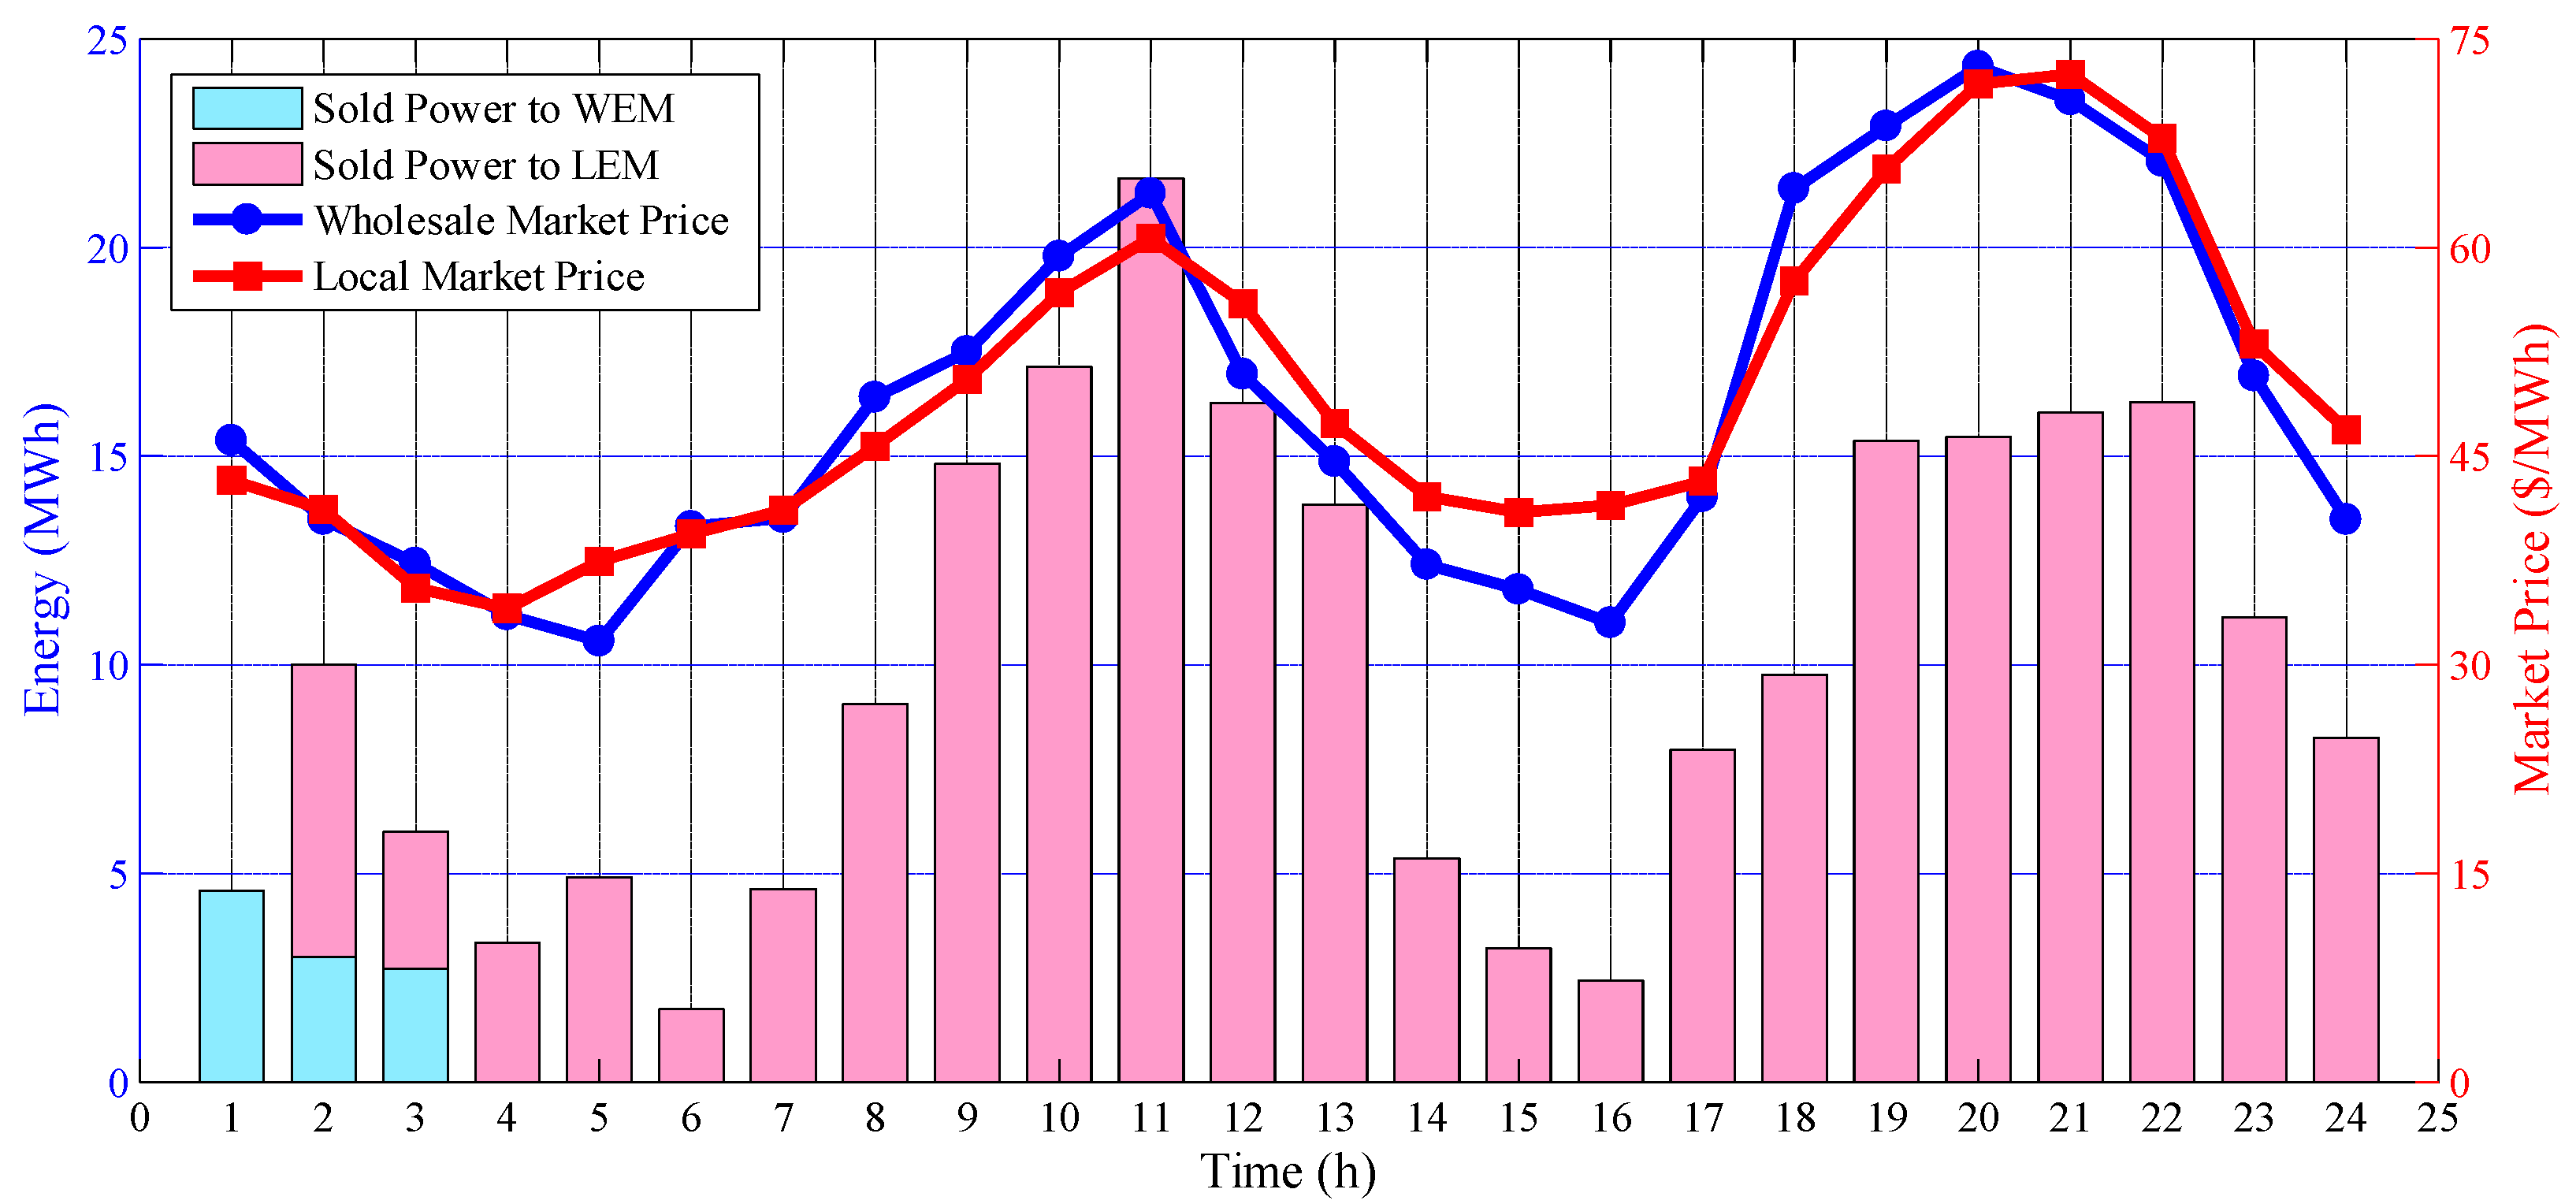
On the contrary, the optimal participation of the DER AG in the WEM and LEM is shown in Figure 11.
Based on the above figure, when the price of the LEM is lower than the price of the WEM, the DSO makes the AG sell its produced power to the local market. In addition, since the WEM’s price is slightly lower than the LEM’s price at hour 7, the DER AG has purchased nearly 1.4 MWh from the WEM in order to charge its local CAES system. It is noteworthy that insofar as the considered local TE market consists of only two participants, the amount of sold energy by the AG at a specific hour is equal to the amount of purchased energy by the DSO. Additionally, Figure 12 depicts the optimal operating points of the AG’s dispatchable as well as renewable-based resources. As it is shown, the DER AG not only sells its generated energy to the DA markets, but also utilizes this energy for its consumption. For instance, at hour 7, the AG bought only 1.4 MWh from the WEM to charge the CAES unit, hence, the rest of the required energy for charging, approximately 2.6 MWh, was provided by local renewable resources.
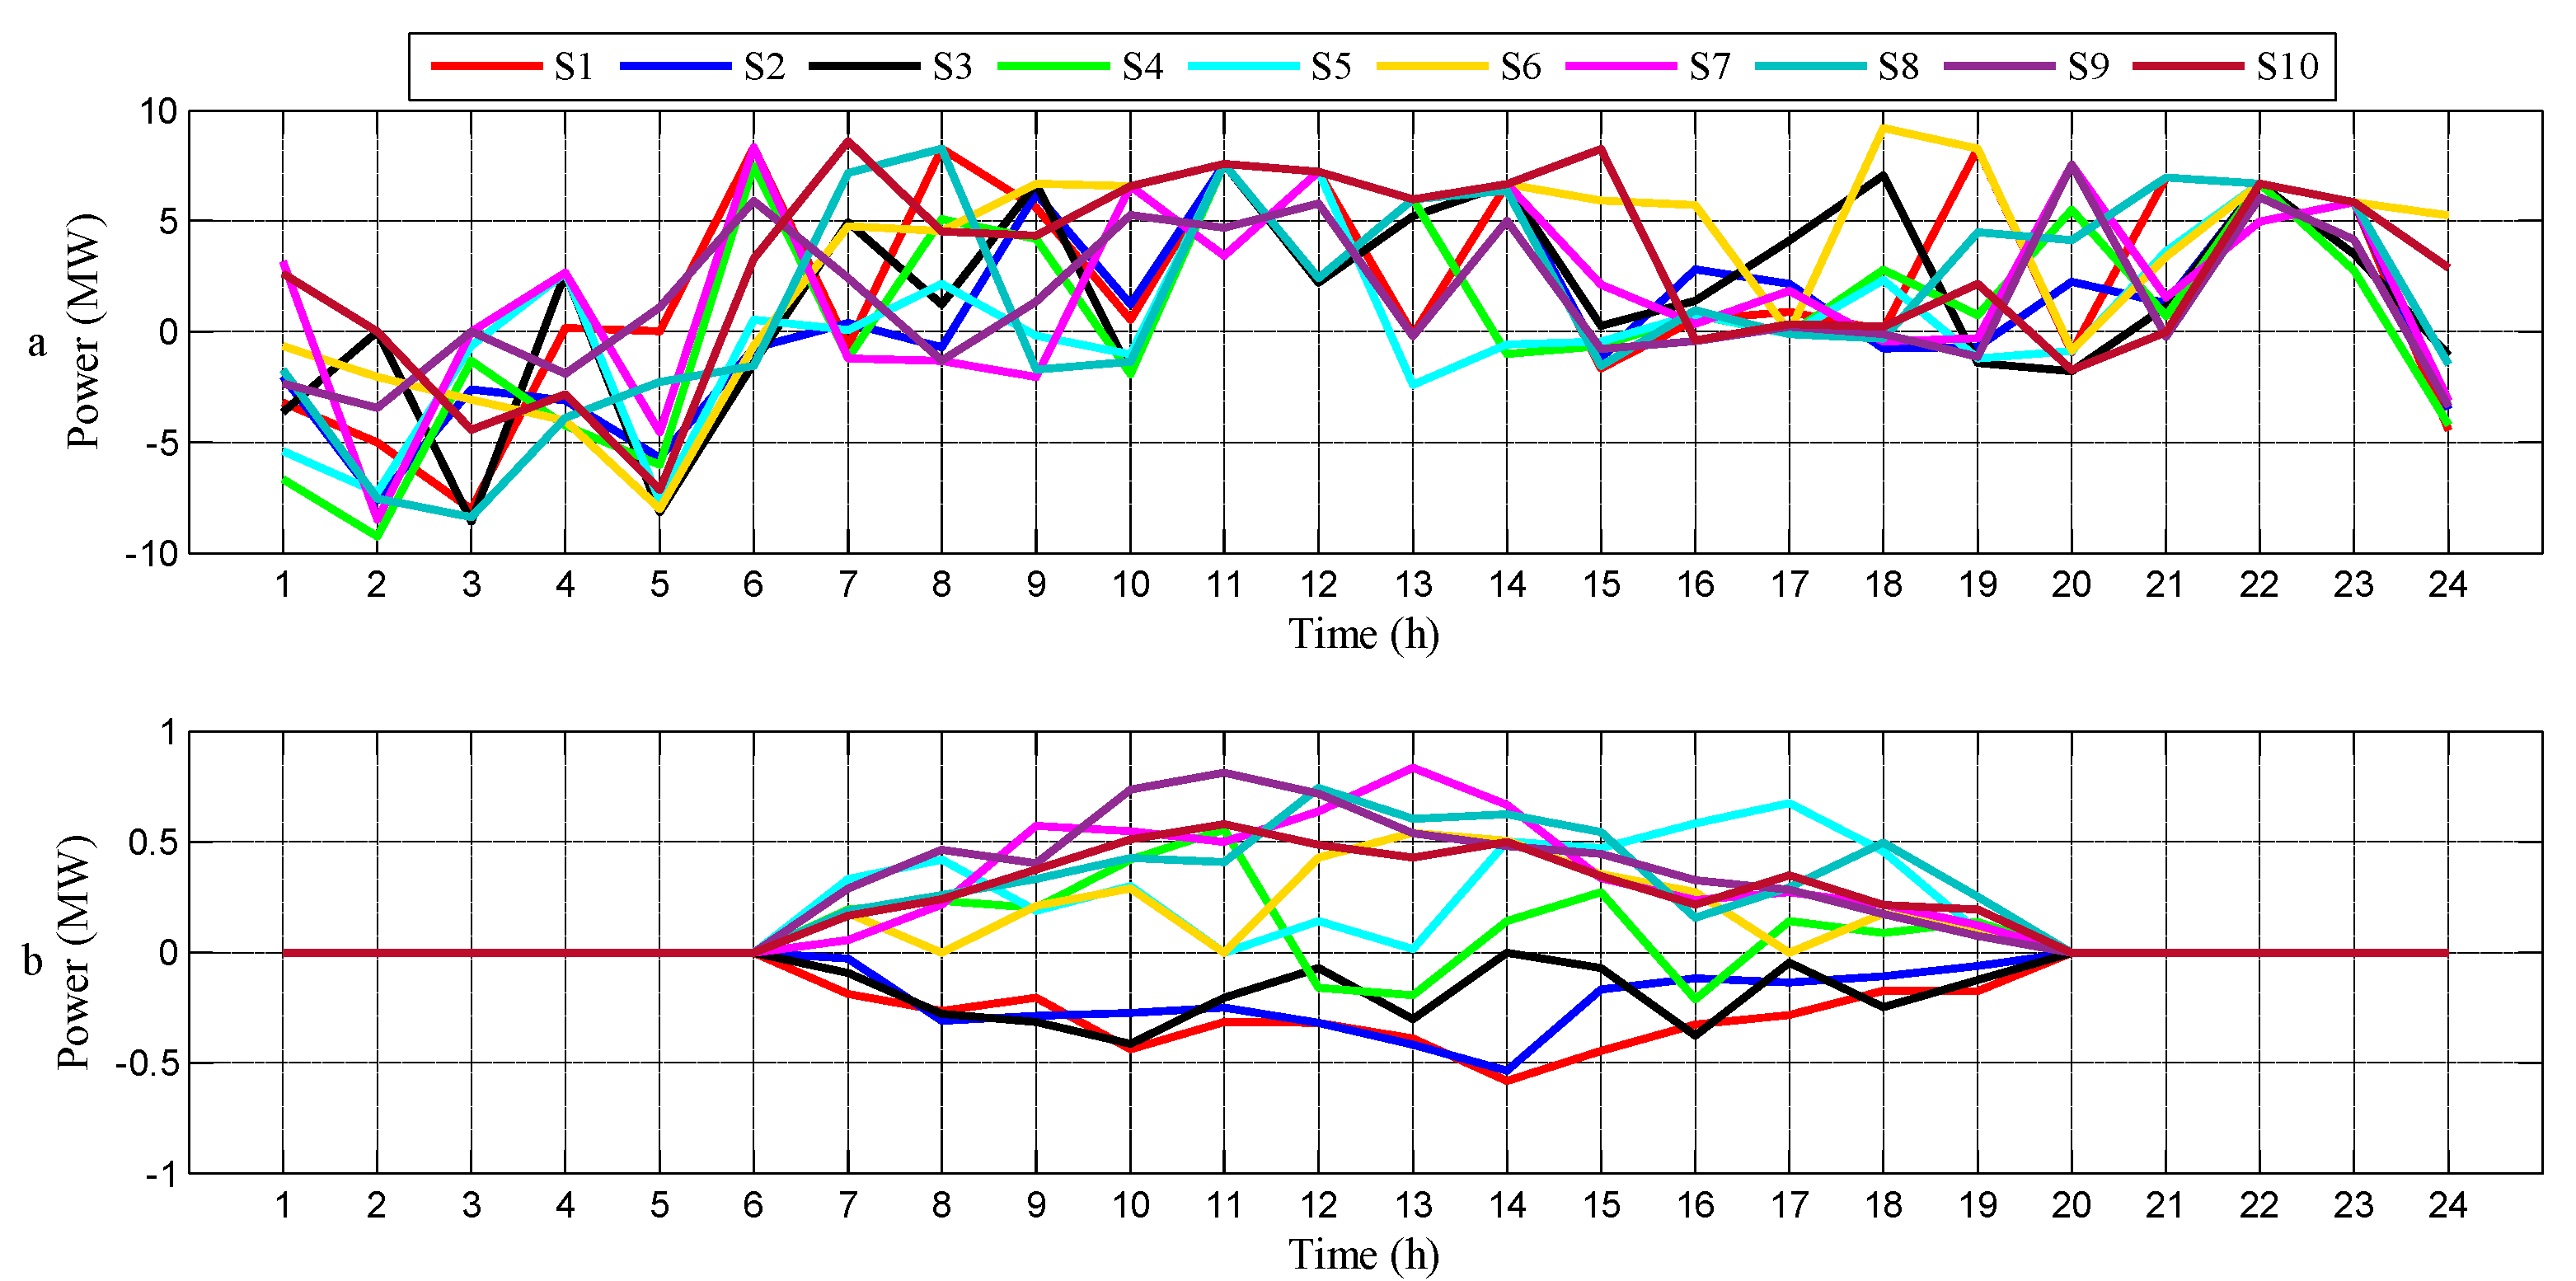
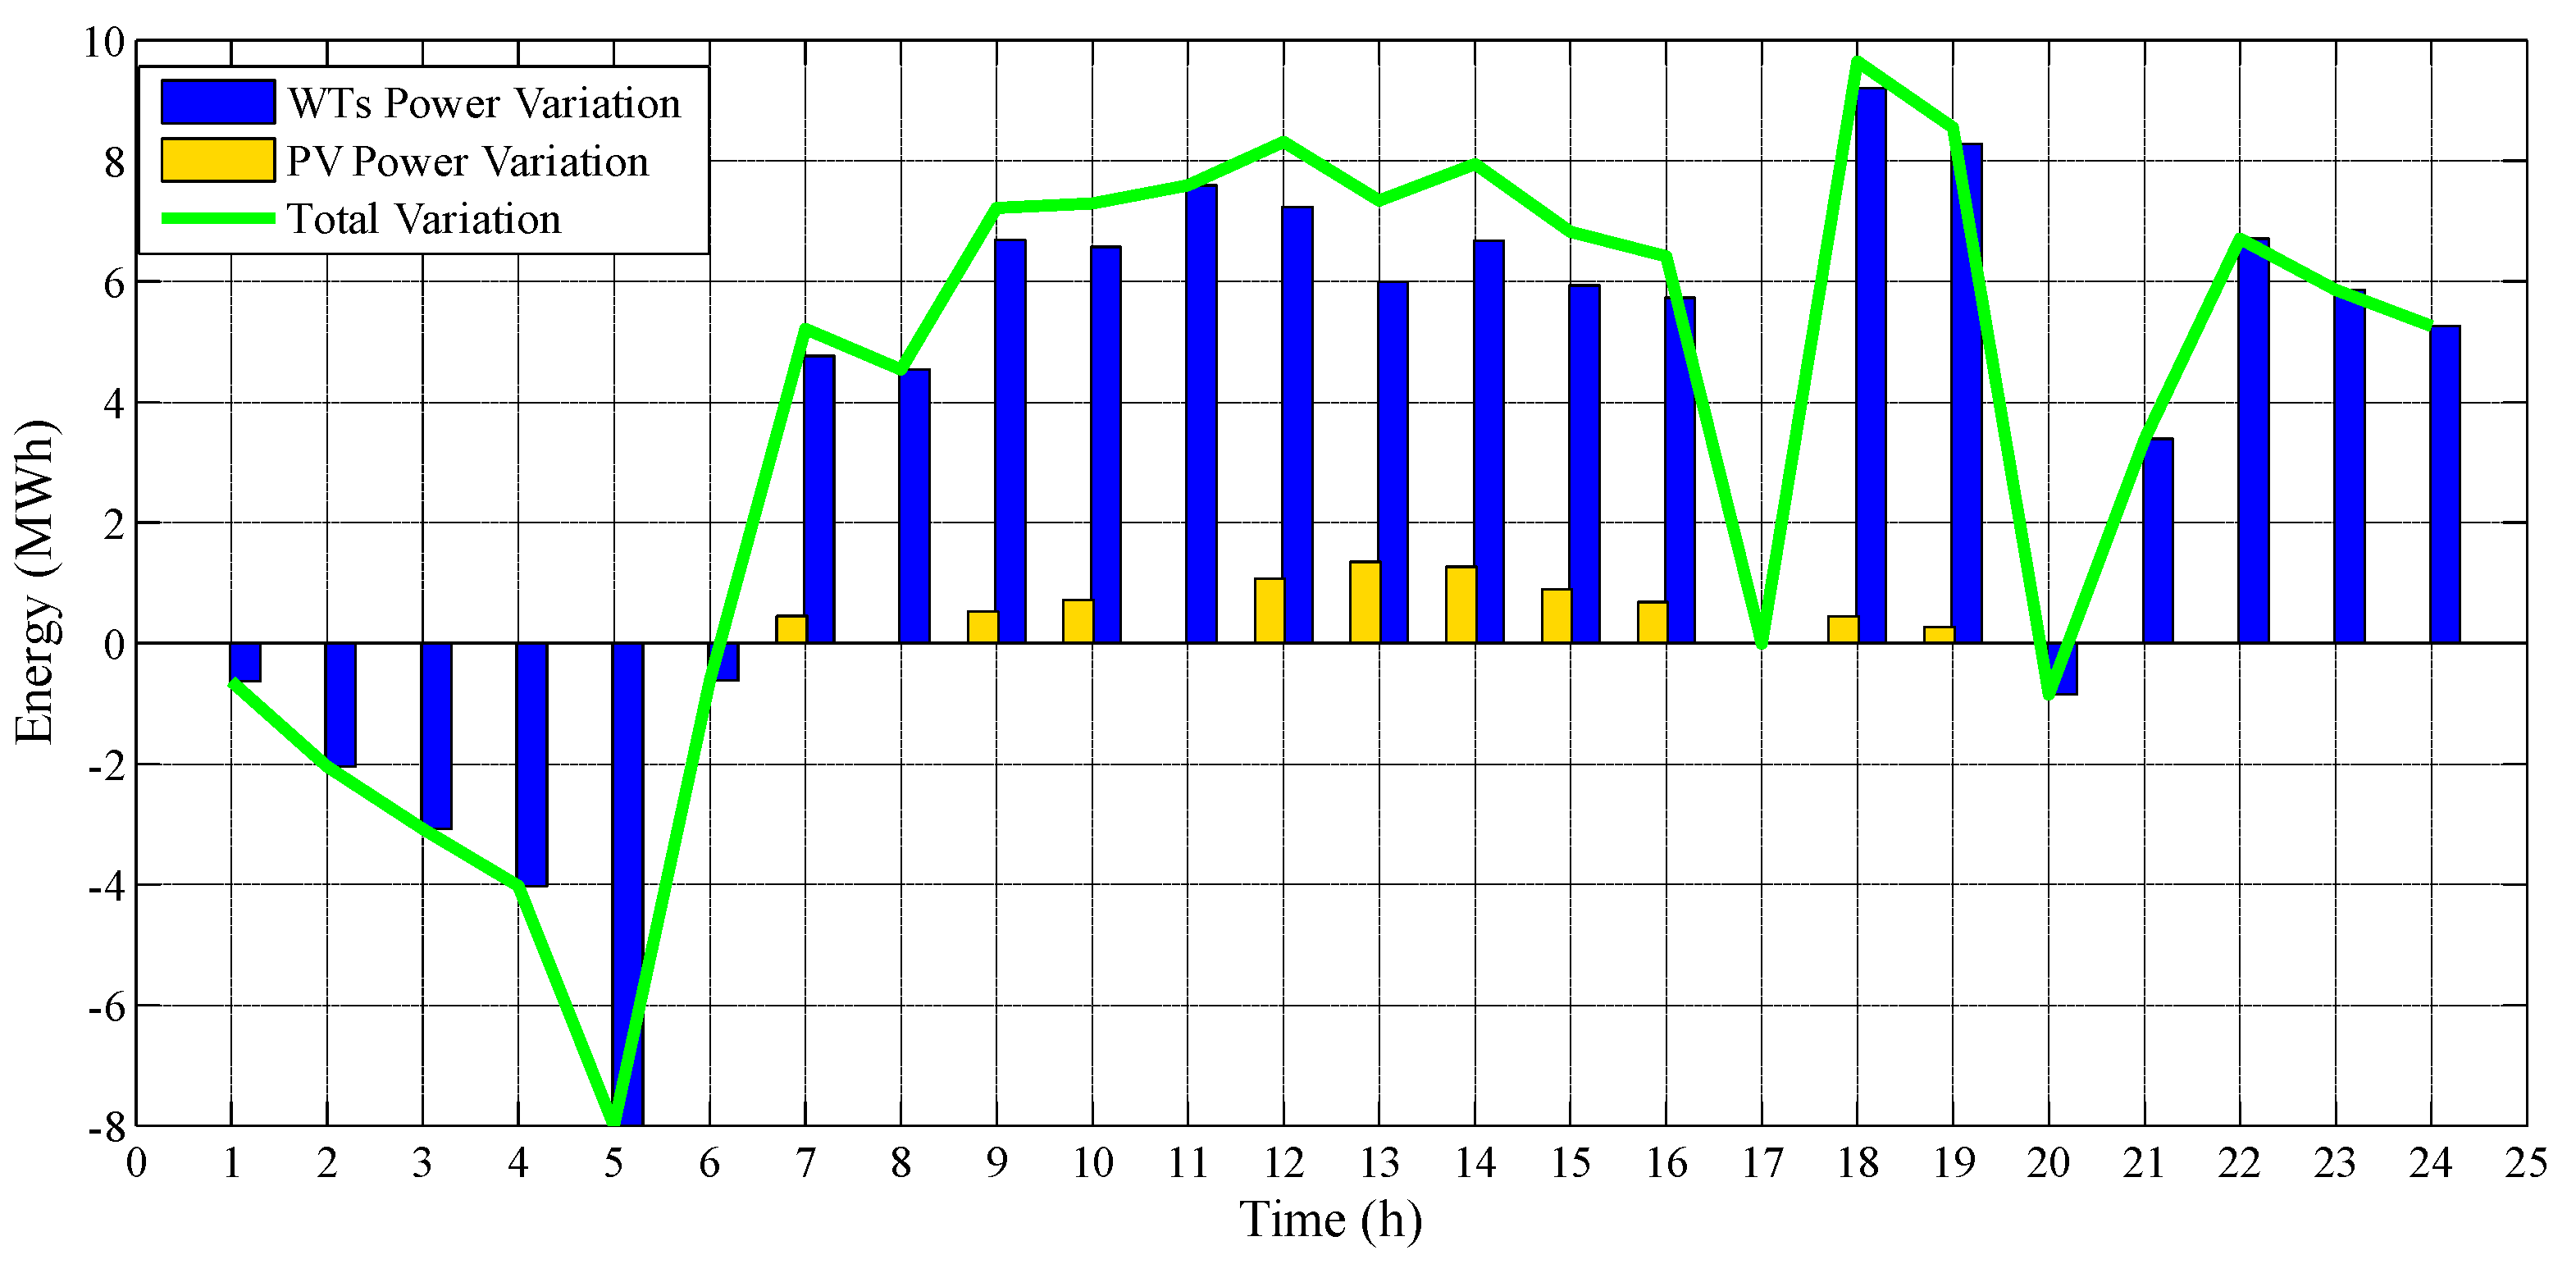
As mentioned previously, in the wait-and-see phase, after the realization of stochastic variables, the aforementioned entities make their decisions as to the exchanged energy in the RT WEM and RT LEM. At this stage, optimum decisions are made according to generated scenarios. These scenarios represent the changes of uncertain parameters from the forecasted values. For the sake of clarity, the WT and PV power variations of the AG during a day and in the entire set of scenarios are displayed in Figure 13.
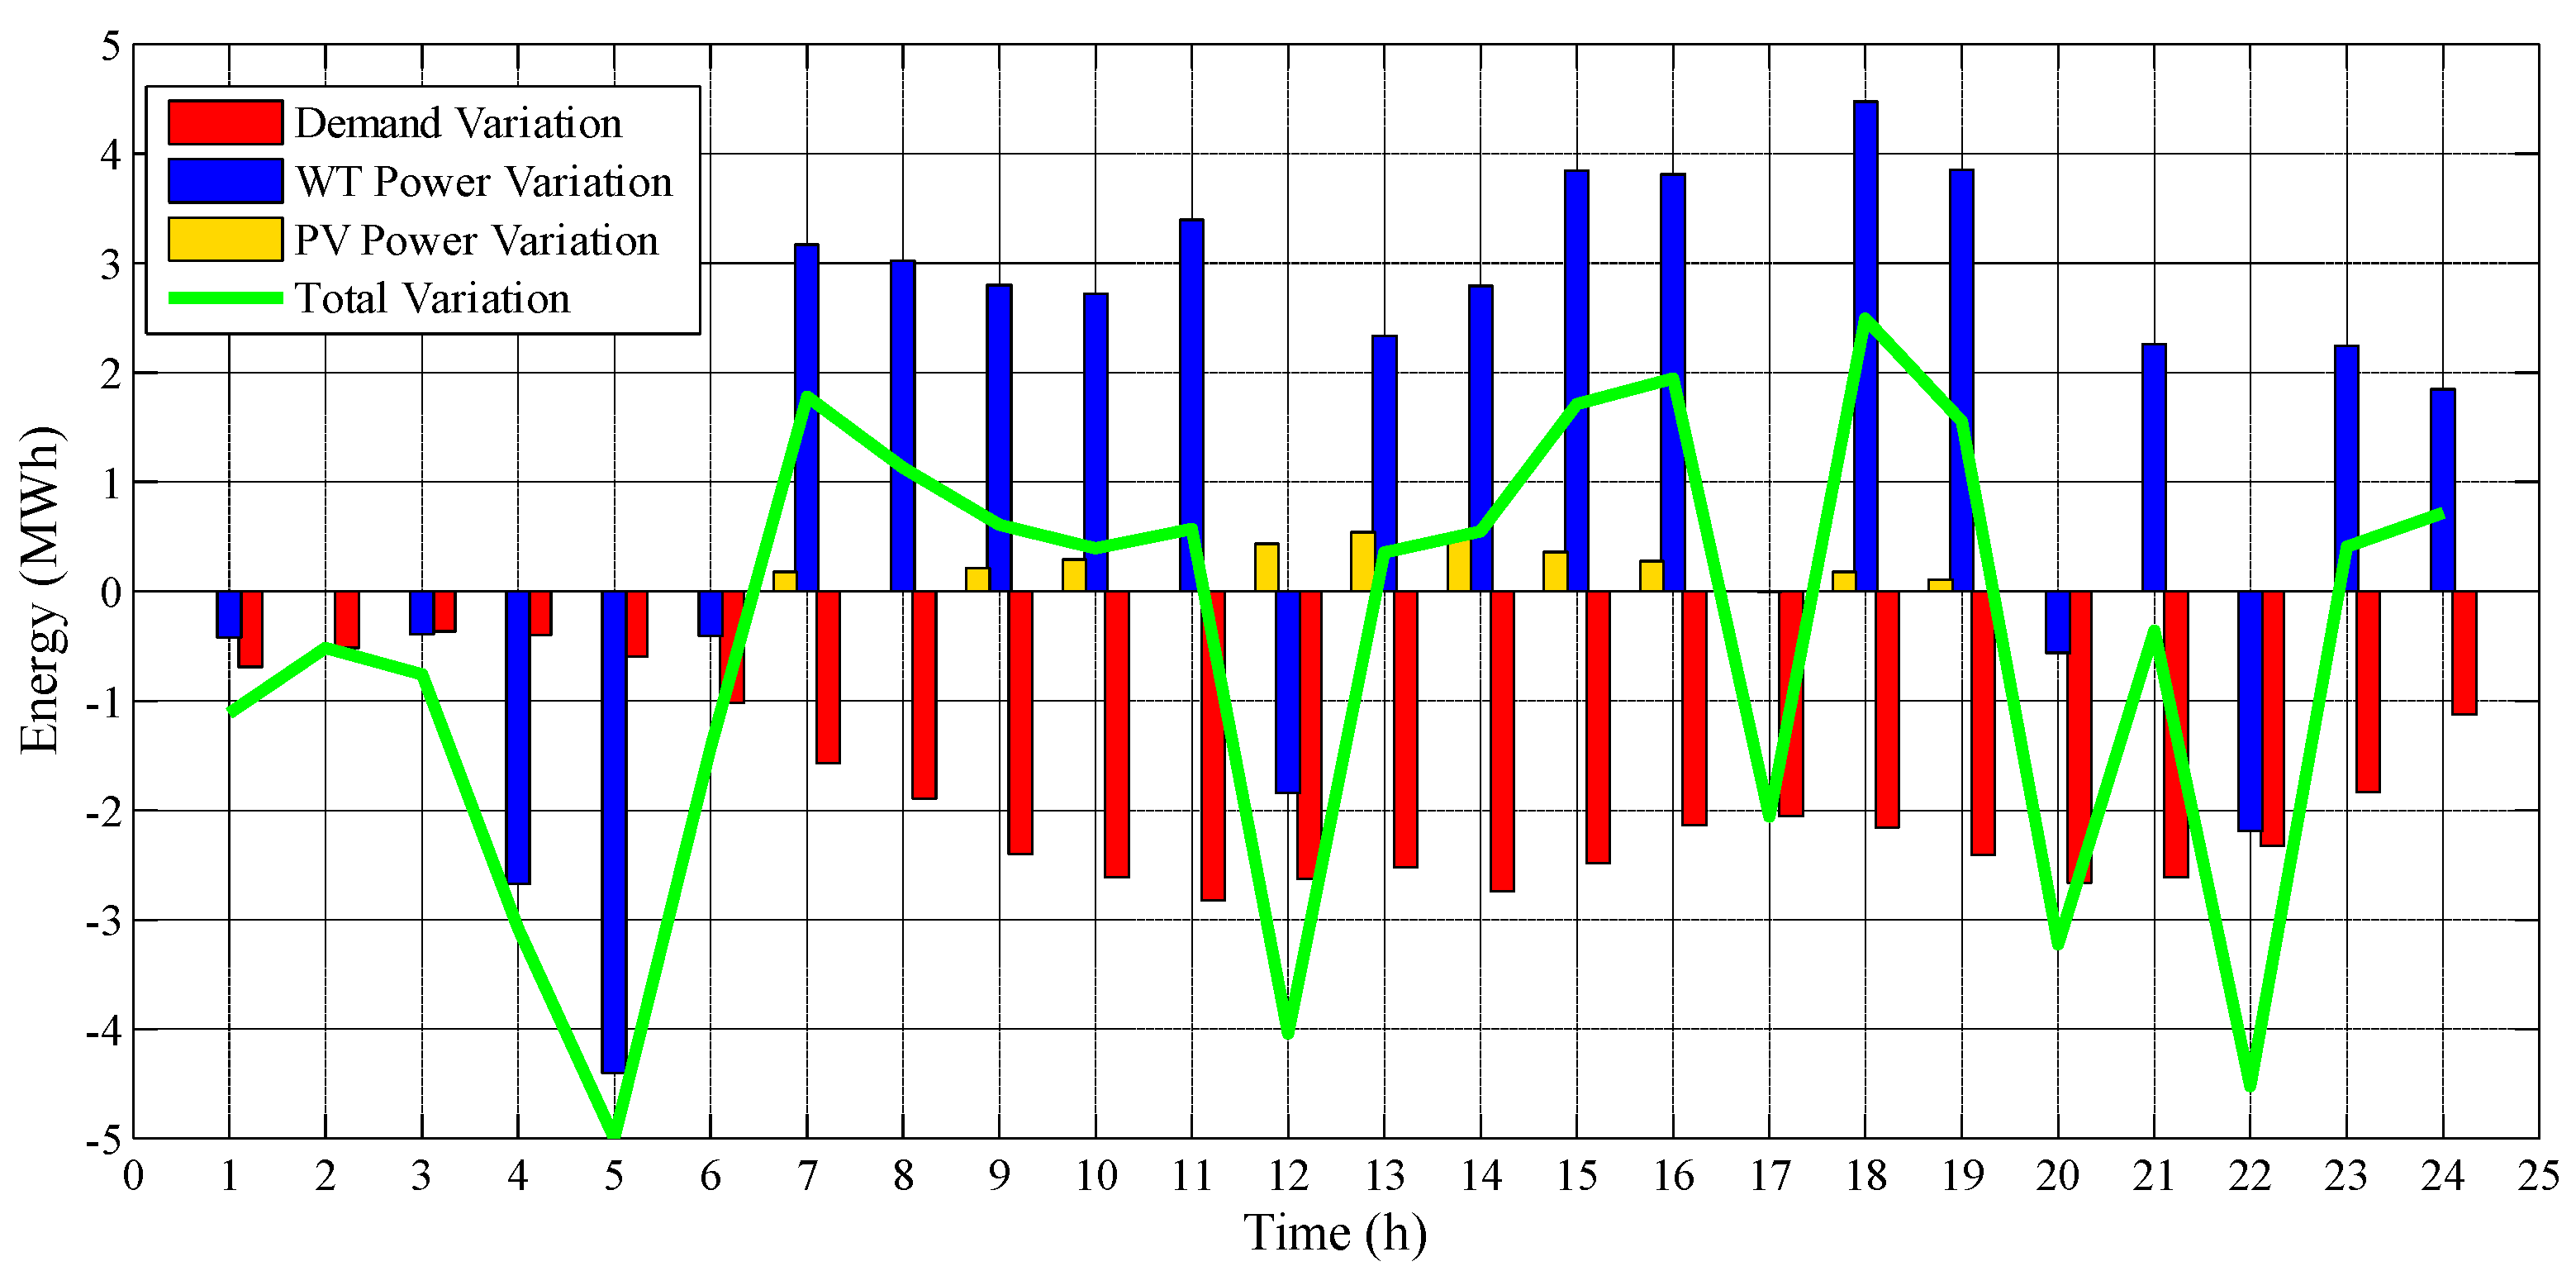
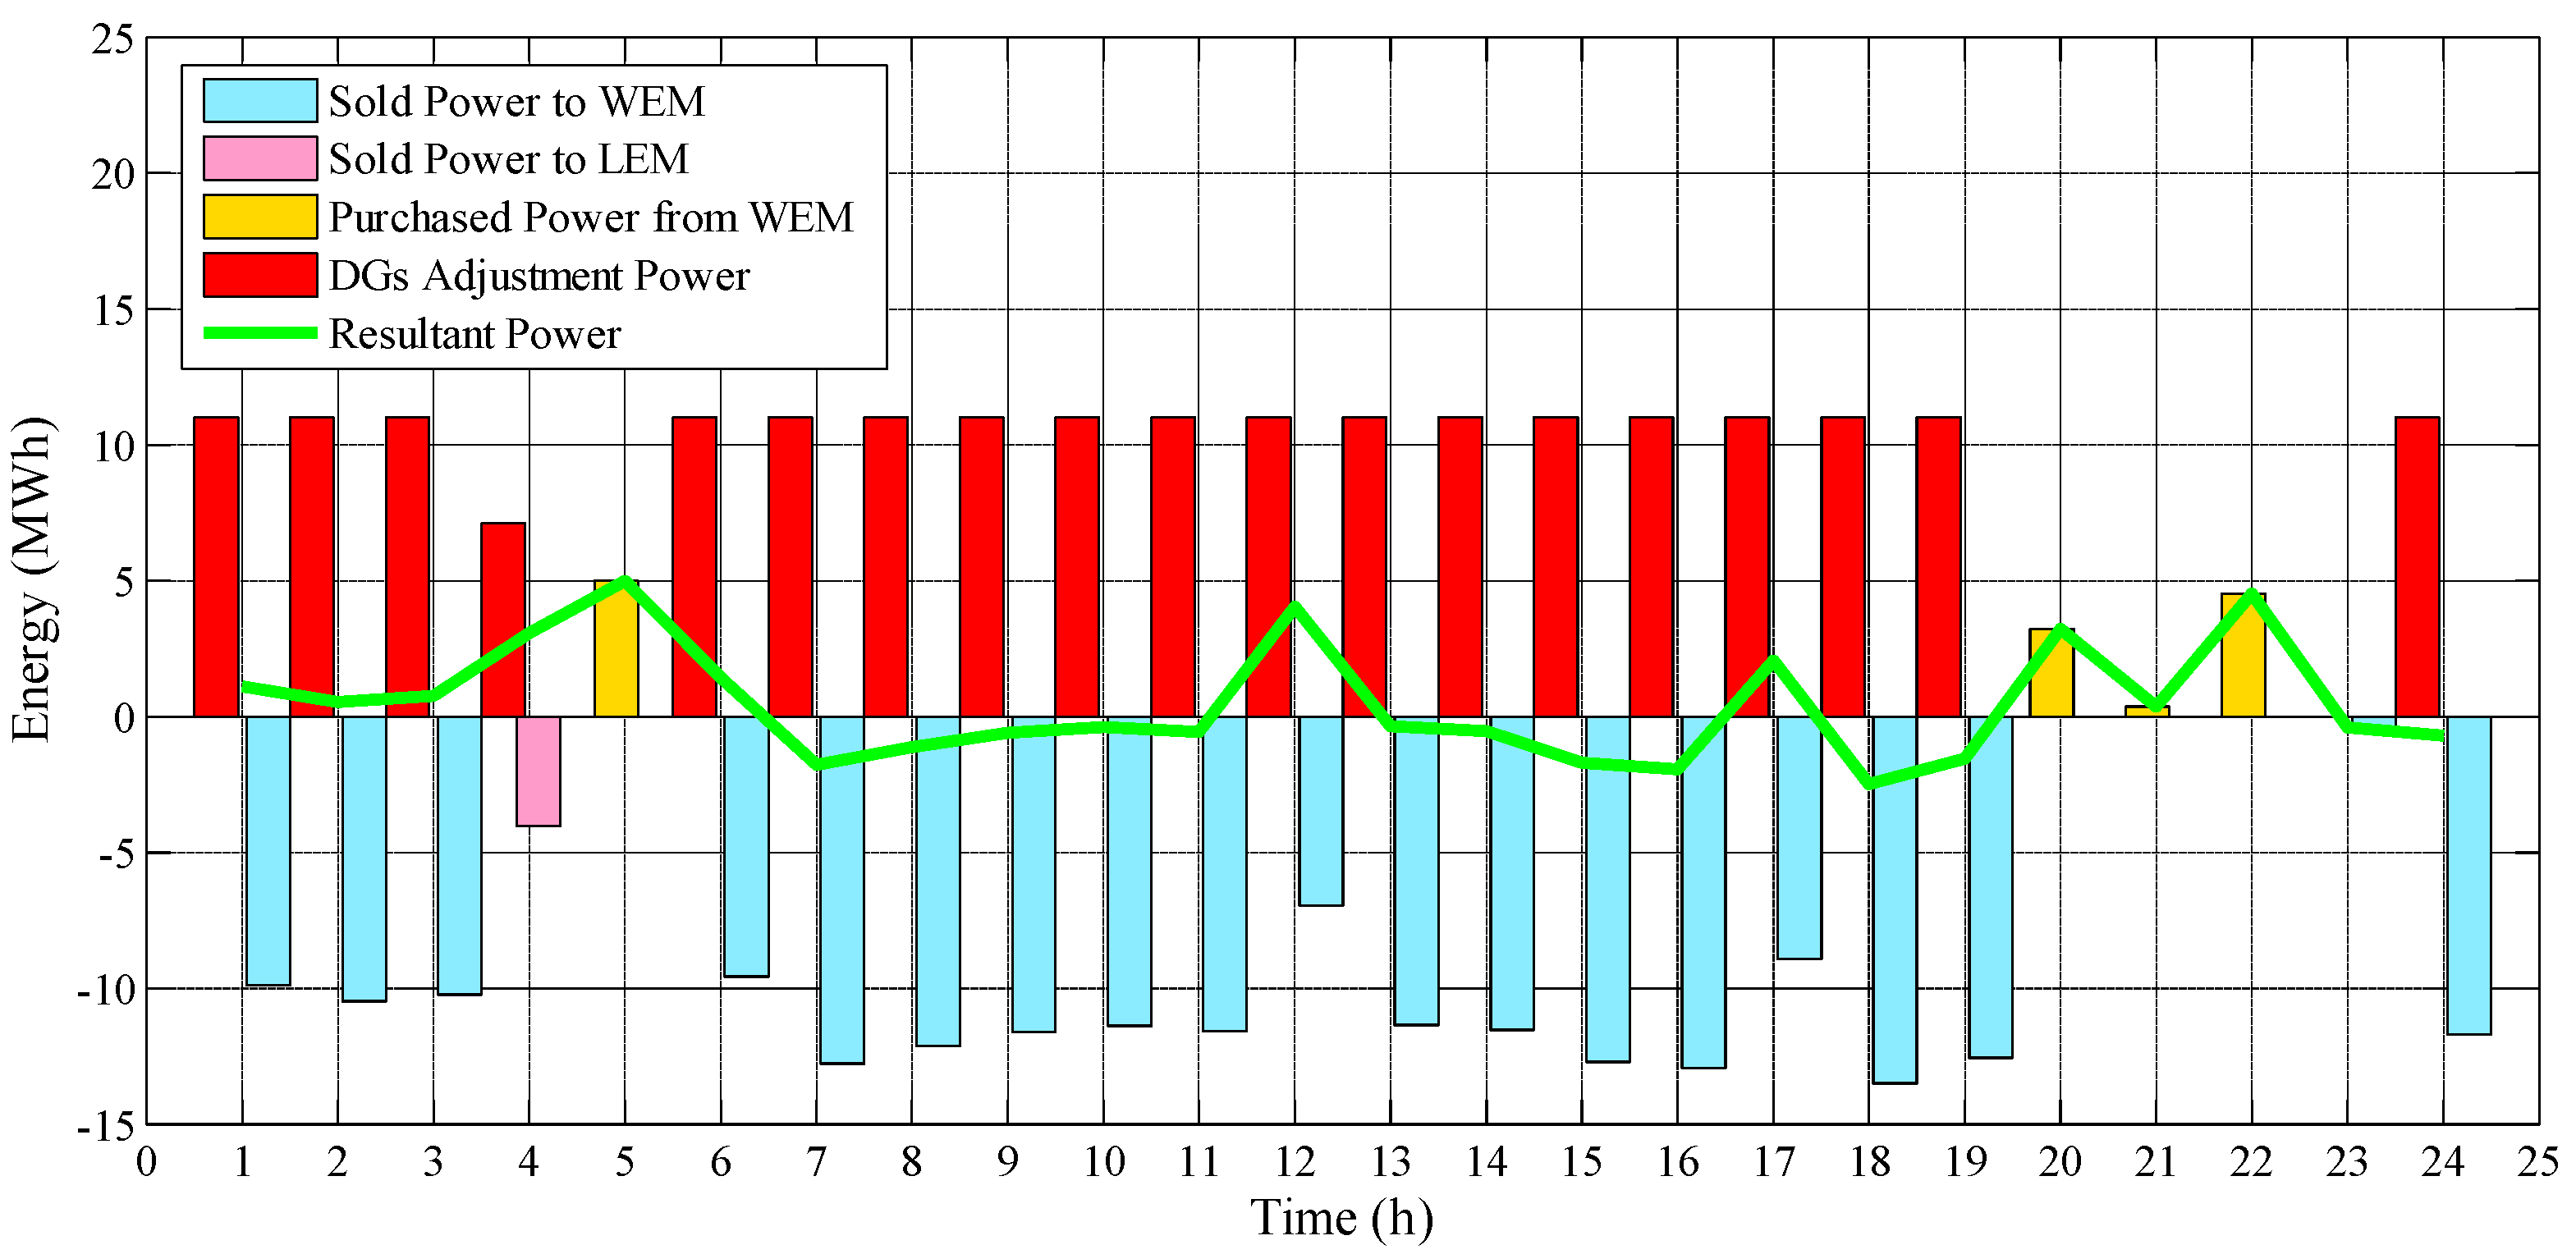
In this step, on one hand, the DSO could compensate for its shortage or supply its excess energy by taking part in both RT markets. On the other hand, this agent is able to increase or diminish its production through the reserve capacity of dispatchable resources. To better investigate the impact of stochastic factors on the performance of the DSO, the change of demand and output power of renewable units for a sample scenario, scenario 6, is shown in Figure 14.
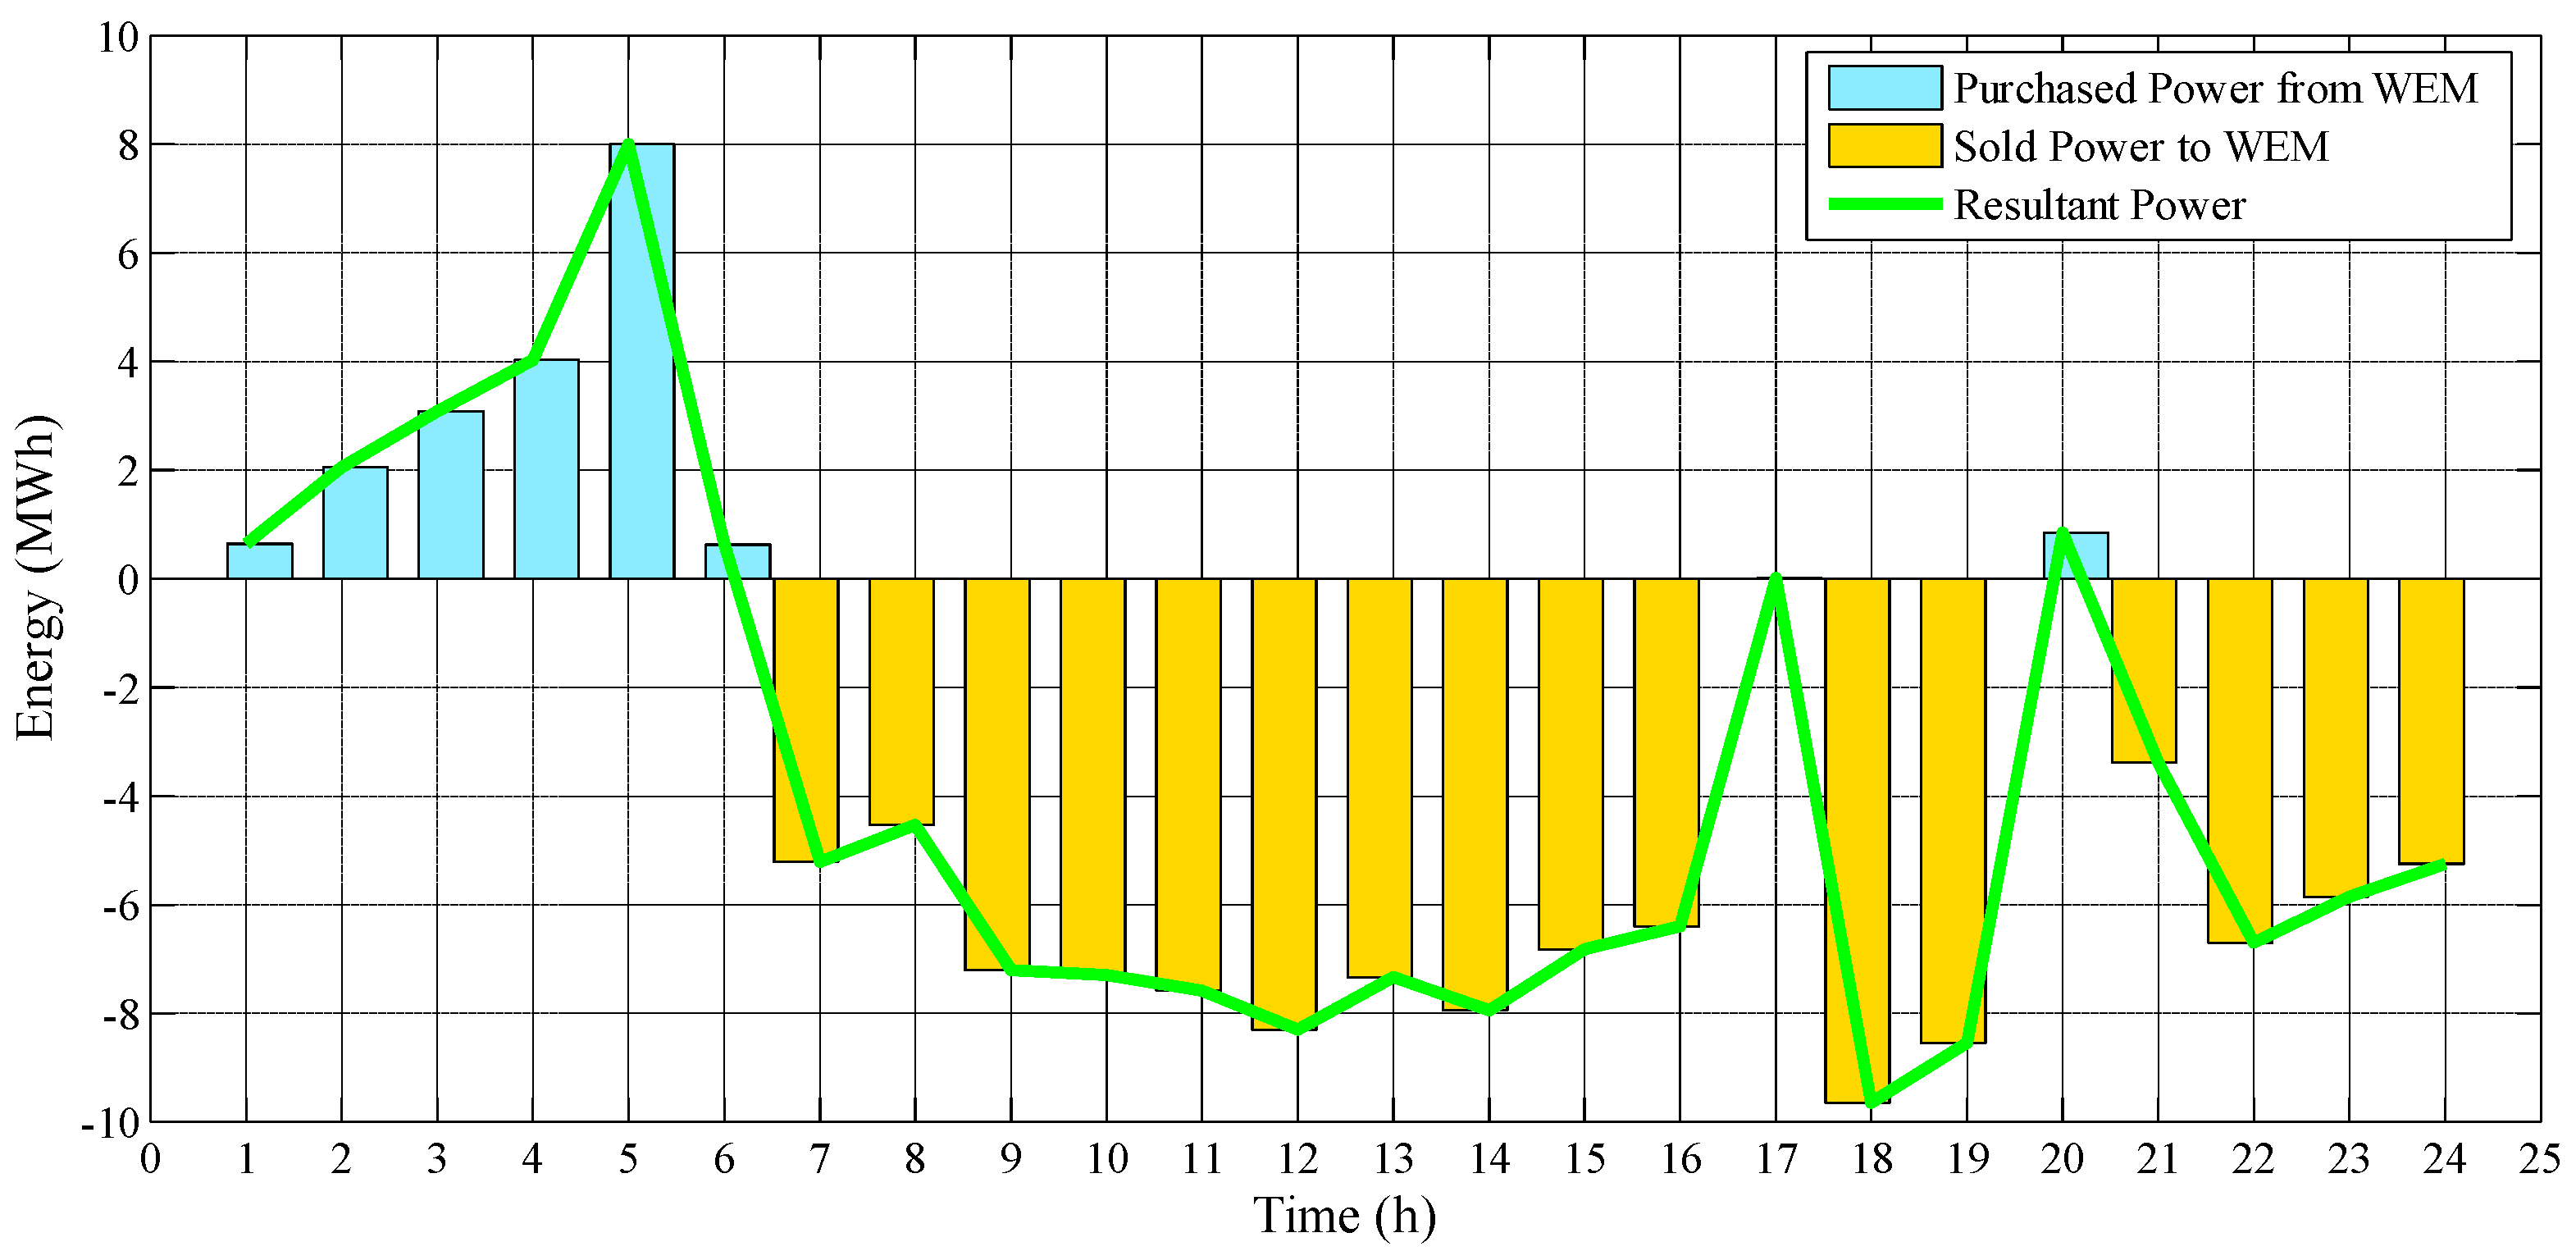
It must be noted that, in the above figure, the increase in demand was portrayed by negative bars, whereas the increase in power generation was depicted by positive bars. Additionally, the total variation was determined by the line graph. Accordingly, if the total change is positive, the DSO should sell its excess energy to the RT markets or activate the downward reserves. In contrast, if the total change is negative, the DSO must buy the required energy from these electricity markets or activate the upward reserves. Moreover, it is possible that the DSO adjusts its reserve capacity to not only satisfy the variation but also exchange energy with available markets. Figure 15 indicates these matters in more detail. For example, at hour 4, the total variation of the DSO’s stochastic parameters is equal to −3.1 MWh. As a result, the DSO needs about 3.1 MWh energy to compensate for this shortage. However, since the cost of dispatchable units for providing upward power is lower than the LEM’s RT price, the DSO prefers to produce 7.1 MWh to not only provide its requirement, but to also sell 4 MWh to the RT local market. Finally, for scenario 6, changes in the DER AG’s renewable resources as well as the optimal involvement of this player in the RT markets are shown in Figure 16 and Figure 17, respectively.
Similar to the situation of the DSO, at hour 4, the total variation of the AG’s uncertain factors is equal to −4 MWh. Therefore, based on Figure 17, the AG bought 4 MWh from the LEM to compensate for the lack of energy. In this regard, it is worth noting that since the local TE market includes just two participants, the sold power by the DSO at this hour was purchased by the AG.
In the remainder of this section, to evaluate the total cost of the DSO during the day and also to determine the role of each market and each scenario in this operating cost, the revenue distribution and cost distribution of this player in the DA and RT markets are presented in detail in Table 7. In addition to costs, in this table, the sold/purchased powers of the DSO to/from available markets during the 24-h period are expressed as well.
Based on the above table, the minimum operating cost of the DSO during the studied day is equal to 45,143.2 USD, which is calculated by adding up all costs (first, second, and last columns) subtracting all incomes (fifth and sixth columns). Note that, to calculate the cost or income in each scenario, the scenario’s probability of occurrence was taken into account as well. Furthermore, in this study, the operating cost of non-dispatchable resources was neglected, hence the last column of the table is only related to the operating cost of dispatchable units.
The same study can also be executed for the DER AG. In this regard, the revenue distribution, cost distribution, and exchanged energy of this entity in two stages of the LEM and WEM are summarized in Table 8. The last column of the mentioned table reflects the total operating cost of the AG’s dispatchable units as well as the CAES system. Based on the provided figures, the maximum benefit of the DER AG during the studied day is equal to 10,149.7 USD, which is calculated by adding up all of the incomes (fifth and sixth columns) and subtracting all of the costs (first, second and last columns).
At the end of this section, the DSO’s total costs as well as the AG’s total profits that result from taking part in local and wholesale markets are reported in Table 9. By considering the operating cost of DERs, the last row of this table indicates the DSO’s daily operating cost and the AG’s daily benefit.

3.2.2. Case Study 2: Without Considering the Game-Theoretic Approach

In the second case, the objective functions of both players are optimized at the same level without considering the competitive environment. Equation (78) states the objective function of the considered model.
O . F Case 2 = Min { O . F DSO O . F DER   AG }
Accordingly, it is assumed that a benevolent planner attempts to optimize the objectives of entities and redistribute costs or incomes among them. This perspective is merely raised to validate the obtained results from the previous case study. This is because, based on the competition between actors as well as the privatization of ownership, the only practical solution for solving the considered problem is the game-based model. In the following figure, the optimal participation of the DSO in the DA LEM and the DA WEM is presented.
According to Figure 18, in the peak hours, due to the high amount of electricity demand and the DA market prices, the DSO purchased more power from the AG and limited its trades with the WEM. Additionally, unlike the previous case study, in this condition, the DSO has more of a tendency to exchange energy with the AG in the LEM platform.
On the other hand, the optimal involvement of the AG in the DA markets is portrayed in Figure 19. As expected, except for hours 1 to 3, the AG sold the entire produced energy to the DSO.
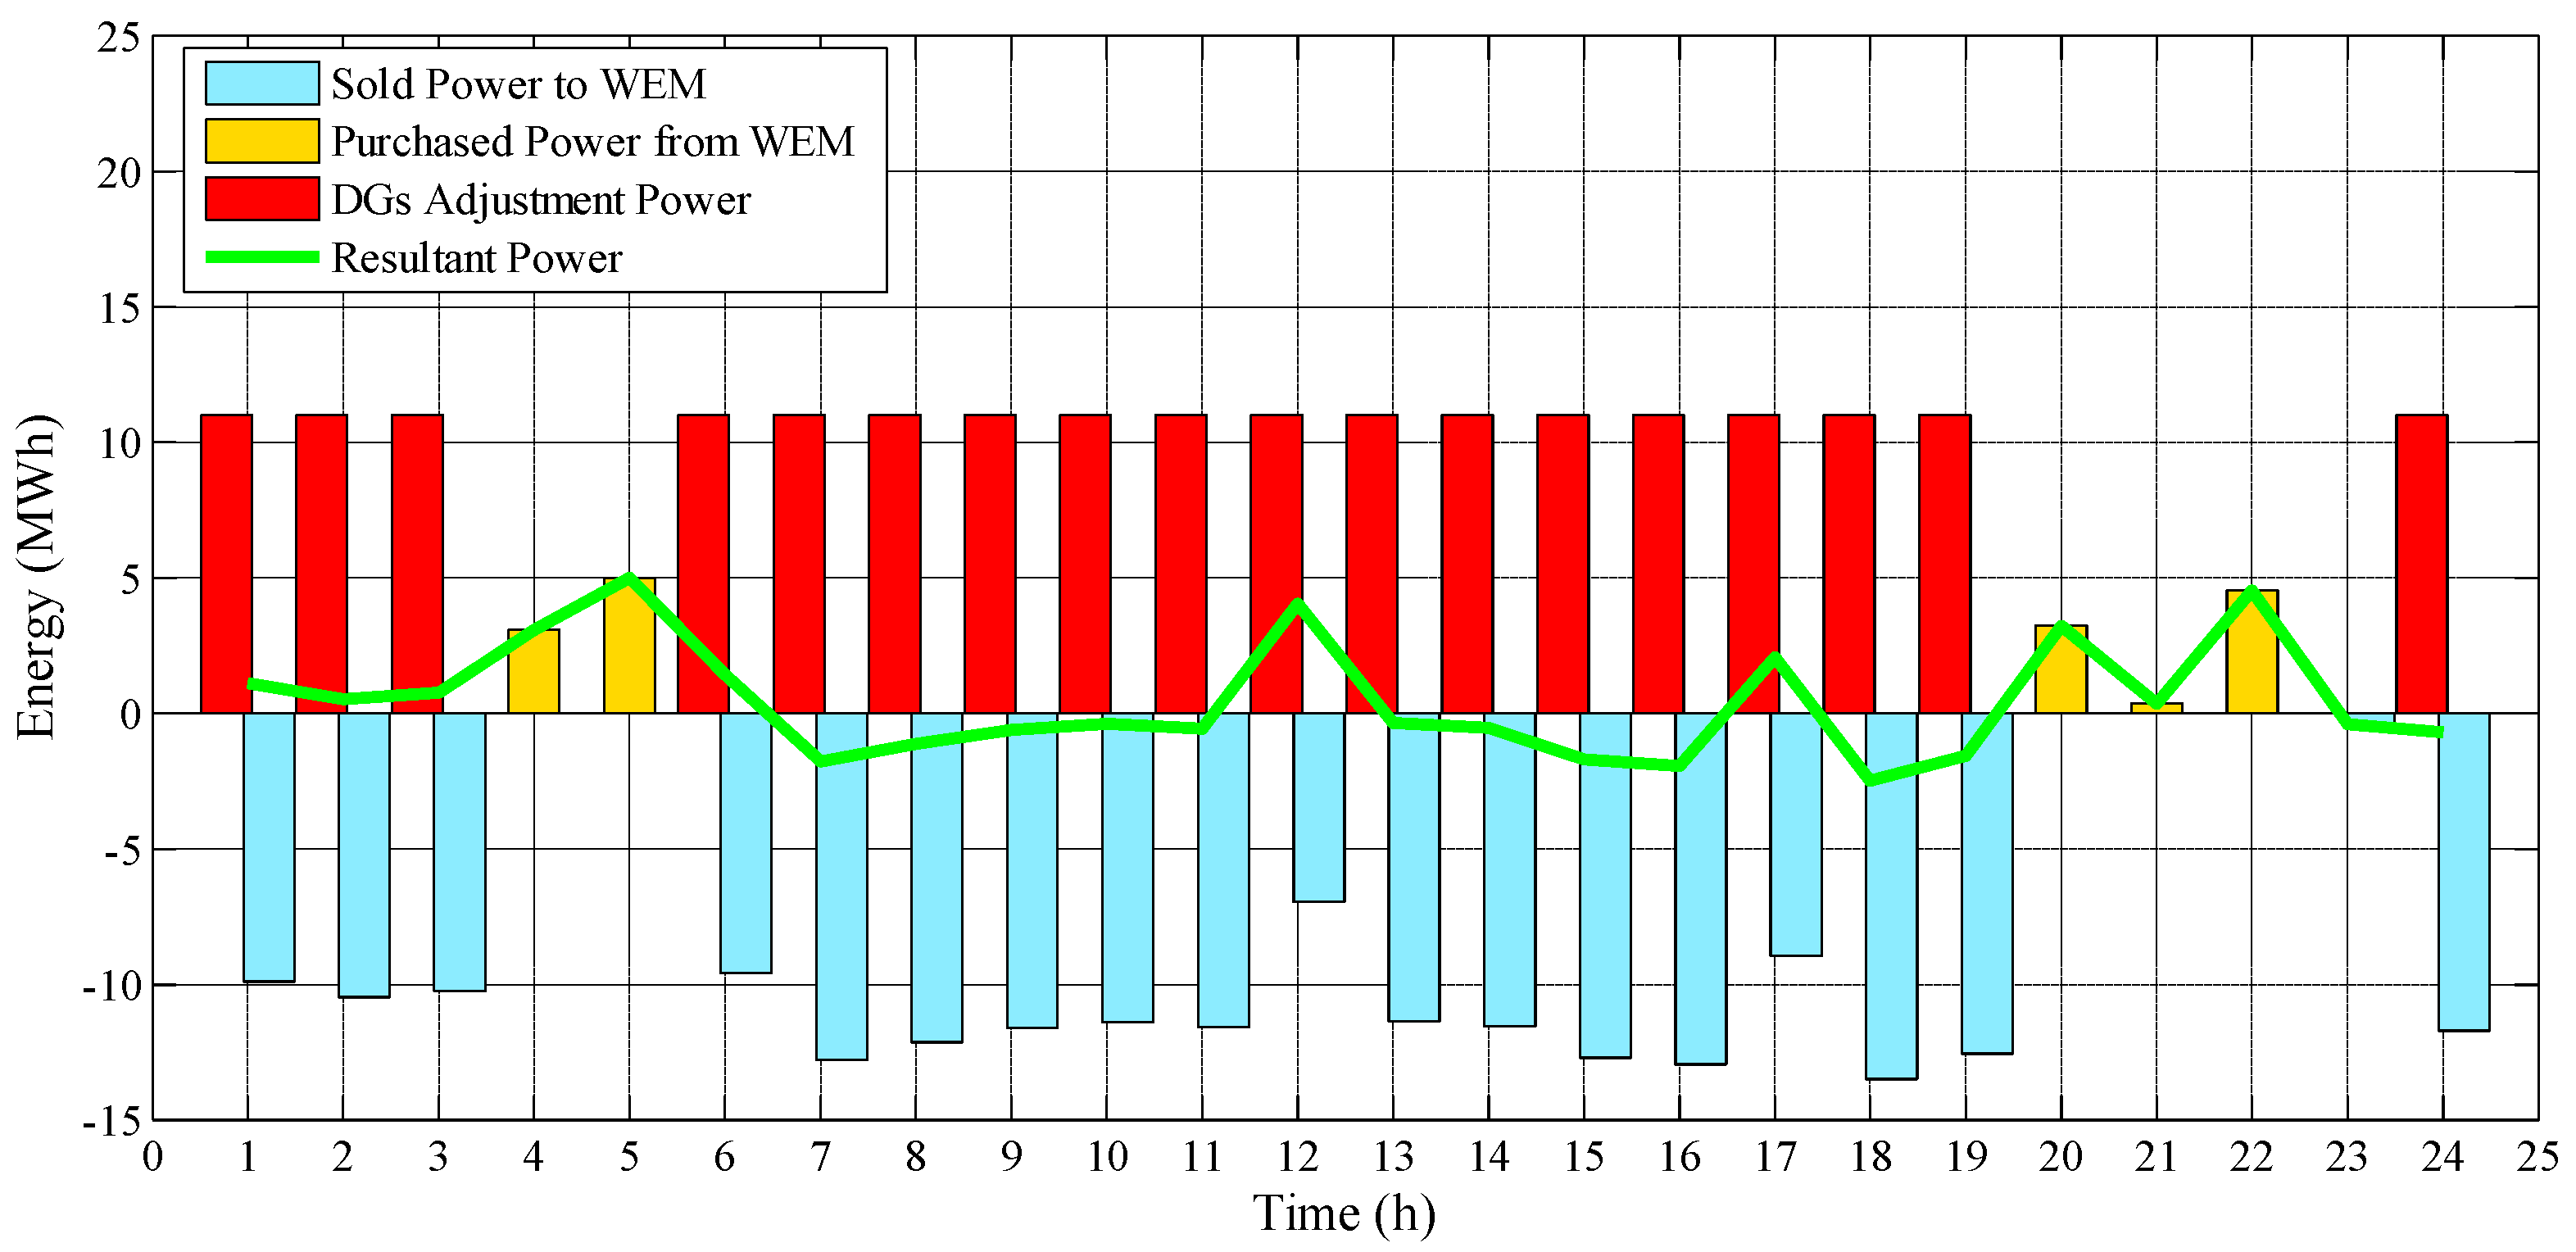
The DSO and AG’s traded energy in the RT markets for a sample scenario, scenario 6, is investigated in this section also. Figure 20 and Figure 21 illustrate the pattern of the exchanged power in more detail. As shown in Figure 20, the DSO traded energy in the RT WEM and has no power exchange in the RT LEM. As a result of this fact, the AG only participated in the RT WEM to adjust the power variation of its local non-dispatchable units.
Moreover, the DSO’s daily cost distribution as well as the DER AG’s daily profit distribution are summarized in Table 10.
Ultimately, the obtained results from these two case studies are compared with one another in Table 11. According to Table 11, without utilizing the game-based method, the operating cost of the DSO increased about 549.3 USD. On the contrary, the profit of the AG increased by about 1230 USD. Indeed, in the Stackelberg game-based framework, since the DSO was considered as the leader of the problem, it was able to profit from a better situation and reduce its total operating costs. In contrast, since the AG was considered as the follower of this game, it obtained less profit than in the second case study.
From the above table, the DER AG would prefer to obtain more profit from trading energy in the LEM. However, since the AG is an independent private player in the LEM, energy trading in this market has to be executed based on a game-theoretic method. In other words, the AG, as a follower, should accept the reduction of its benefit and set its decisions according to decisions of the DSO, as the leader of the problem and the owner of the SDN.

4. Conclusions

Nowadays, the penetration of numerous DERs with private ownership has led to a variety of challenges in the optimal scheduling of SDNs. The reason for this is that, on one hand, the separate participation of each small-scale DER in the energy management program of the DSO could not be optimal. On the other hand, satisfying the inherent conflicts that exist between the interests of each private unit and the DSO is highly difficult and may lead to intractability. As a result, presenting a proper framework in which a wide range of DERs can cooperate with one another to not only meet the SDN’s operational constraints but also promote their own benefit is essential. Based on these matters, in this article, an AG was defined to integrate DERs at the distribution level and interact with the DSO in a LEM platform. For solving this problem and modeling the TE environment among entities, a Stackelberg game-based method was presented in which the DSO and the DER AG are able to participate simultaneously in the LEM and WEM. Hence, at the upper level of this game, the operating cost of the DSO was minimized, while at the lower level, the expected profit of the AG was maximized. In order to deal with various uncertainties that exist in the decision-making process of both autonomous agents, a scenario-based two-stage stochastic programming method was used. The efficiency of the proposed scheme for the solving of the mentioned problem was tested in two case studies, with and without considering the competitive environment among players. The simulation results confirmed that due to the presence of private participants in the SDN, the energy exchange between actors in the LEM platform must be modeled based on the game-theoretic approach. In the end, for future works, the proposed model has the capability to be expanded by considering more than one AG of different types, such as Demand Response AG and Electric Vehicle AG in a LEM.

Author Contributions

Conceptualization, S.H.; Methodology, S.H.; Software, S.H.; Validation, S.H.; Formal analysis, S.H., K.Z., M.A., G.M.-D. and J.C.; Investigation, K.Z., M.A. and S.H.; Resources, S.H.; Data curation, S.H.; Writing—Original draft preparation, S.H.; Writing—review and editing, S.H., G.M.-D. and J.C.; Visualization, S.H.; Supervision, K.Z., M.A., G.M.-D. and J.C.; Project administration, G.M.-D. and J.C.; Funding acquisition, G.M.-D. and J.C. All authors have read and agreed to the published version of the manuscript.

Funding

The work of Gregorio Muñoz-Delgado and Javier Contreras was supported in part by the Ministry of Science, Innovation and Universities of Spain, under Projects RTI2018-096108-A-I00 and RTI2018-098703-B-I00 (MCIU/AEI/FEDER, UE); and by the Universidad de Castilla-La Mancha, under Grant 2020-GRIN-29009.

Conflicts of Interest

The authors declare no conflict of interest.

Nomenclature

Acronyms
AGAggregator
CAESCompressed Air Energy Storage
DADay-Ahead
DERDistributed Energy Resource
DSODistribution System Operator
LEMLocal Electricity Market
MCSMonte Carlo Simulation
MDTMinimum Down Time
MUTMinimum Up Time
PDFProbability Distribution Function
PVPhotovoltaic System
RTReal-Time
TETransactive Energy
WEMWholesale Electricity Market
WTWind Turbine
Indices and Sets
d Auxiliary index for MUT/MDT modeling, running from 1 to max (MUT(i), MDT(i))
i , I Index and set of the DSO and AG’s dispatchable units
j , J Index and set of the AG’s CAES systems
l , L Index and set of the DSO’s loads
s , S Index and set of scenarios
t , T Index and set of times
v , V Index and set of the DSO and AG’s PVs
w , W Index and set of the DSO and AG’s WTs
α   ,   β Index of buses
Λ Set of lines
Ω I Set of dispatchable units’ mapping into the set of buses
Ω J Set of CAES systems’ mapping into the set of buses
Ω L Set of loads’ mapping into the set of buses
Ω V Set of PVs’ mapping into the set of buses
Ω W Set of WTs’ mapping into the set of buses
Ξ Set of all decision variables
Parameters
a i , DSO dn   ,   a i , DSO up Cost of the DSO’s ith dispatchable unit for providing downward/upward energy in the RT (USD/MWh)
a i , DSO   ,   b i , DSO Coefficients of linear cost function for the DSO’s ith dispatchable unit (USD/MWh, USD)
c i , AG Marginal generation cost of the AG’s ith dispatchable unit (USD/MWh)
DT i , DSO ( i , d ) Auxiliary parameters for the MDT limitation of the DSO’s ith dispatchable unit
E j , AG init .   Initial amount of the stored energy in the AG’s jth CAES at the beginning of the first-time interval (MWh)
E j , AG fin . Final amount of the stored energy in the AG’s jth CAES at the end of the last time interval (MWh)
E j , AG max   ,   E j , AG min Maximum/minimum amount of the stored energy in the AG’s jth CAES (MWh)
G Ref Reference irradiance (kW/m2)
G ( t ) Solar irradiation forecast at time t (kW/m2)
G ( t , s ) Solar irradiation at time t and scenario s (kW/m2)
HR Heat rate of the AG’s jth CAES in discharging mode (MMBtu/MWh)
I α β max Maximum limitation of current from α th bus to β th bus (kA)
M Sufficiently large parameter for linearization of non-linear equations
MDT i , DSO ( i ) MDT of the DSO’s ith dispatchable unit (h)
MUT i , DSO ( i ) MUT of the DSO’s ith dispatchable unit (h)
OM com . Operation and maintenance cost of the jth CAES’s compressor (USD/MWh)
OM exp . Operation and maintenance cost of the jth CAES’s expander (USD/MWh)
P i , AG max   ,   P i , AG min Maximum/minimum output power of the AG’s ith dispatchable unit (MW)
P i , DSO max   ,   P i , DSO min Maximum/minimum output power of the DSO’s ith dispatchable unit (MW)
P jch , AG max   ,   P jch , AG min Maximum/minimum compression capacity of the jth CAES’s compressor (MW)
P jdis , AG max   ,   P jdis , AG min Maximum/minimum generation capacity of the jth CAES’s expander (MW)
P Load , DSO ( l , t ) DSO’s lth forecasted load at time t (MW)
P Load , DSO ( l , t , s ) DSO’s lth load at time t and scenario s (MW)
P v , AG ( v , t ) Forecasted power of the AG’s vth PV at time t (MW)
P v , AG ( v , t , s ) Output power of the AG’s vth PV at time t and scenario s (MW)
P v , AG R Rated power of the AG’s vth PV (MW)
P v , DSO ( v , t ) Forecasted power of the DSO’s vth PV at time t (MW)
P v , DSO ( v , t , s ) Output power of the DSO’s vth PV at time t and scenario s (MW)
P v , DSO R Rated power of the DSO’s vth PV (MW)
P w , AG ( w , t ) Forecasted power of the AG’s wth WT at time t (MW)
P w , AG ( w , t , s ) Output power of the AG’s wth WT at time t and scenario s (MW)
P w , AG R Rated power of the AG’s wth WT (MW)
P w , DSO ( w , t ) Forecasted power of the DSO’s wth WT at time t (MW)
P w , DSO ( w , t , s ) Output power of the DSO’s wth WT at time t and scenario s (MW)
P w , DSO R Rated power of the DSO’s wth WT (MW)
R α β Resistance of the line between the α th and β th buses ( Ω )
RD i , AG   ,   RU i , AG Ramp down/up rate of the AG’s ith dispatchable unit (MW/h)
sd i , DSO ( i ) Shut-down cost of the DSO’s ith dispatchable unit (USD)
su i , DSO ( i ) Start-up cost of the DSO’s ith dispatchable unit (USD)
T ( t ) Ambient temperature forecast at time t (°C)
T Ref Reference temperature (°C)
UT i , DSO ( i , d ) Auxiliary parameters for the MUT limitation of the DSO’s ith dispatchable unit
V ( t ) Wind speed forecast at time t (m/s)
V ( t , s ) Wind speed at time t and scenario s (m/s)
V w , AG ci   ,   V w , AG co Cut-in/cut-out speed of the AG’s wth WT (m/s)
V w , AG R Rated speed of the AG’s wth WT (m/s)
V w , DSO ci   ,   V w , DSO co Cut-in/cut-out speed of the DSO’s wth WT (m/s)
V w , DSO R Rated speed of the DSO’s wth WT (m/s)
V α max   ,   V α min Maximum/Minimum amount of voltage at α th bus (kV)
X α β Reactance of the line between the α th and β th buses ( Ω )
Z α β Impedance of the line between the α th and β th buses ( Ω )
ρ ( s ) Probability of scenario s (constant)
λ DA , LEM ( t ) DA price of the LEM at time t (USD/MWh)
λ DA , WEM ( t ) DA price of the WEM at time t (USD/MWh)
λ RT , LEM ( t , s ) RT price of the LEM at time t and scenario s (USD/MWh)
λ RT , WEM ( t , s ) RT price of the WEM at time t and scenario s (USD/MWh)
λ Gas Price of natural gas (USD/MMBtu)
η inj   ,   η pro Efficiency of the injected/produced power to/of the AG’s jth CAES (%)
Ψ PV panels’ coefficient of temperature (1/°C)
DA Decision Variables
E j , AG ( j , t ) Amount of the stored energy in the AG’s jth CAES at the beginning of each time interval (MWh)
I α β ( t ) Current from α th bus to β th bus at time t (kA)
P buy DA , LEM ( t ) DSO’s purchased power from the AG in the DA LEM at time t (MW)
P buy , AG DA , WEM ( t ) AG’s purchased power from the DA WEM at time t (MW)
P buy , DSO DA , WEM ( t ) DSO’s purchased power from the DA WEM at time t (MW)
P α β flow ( t ) Amount of active power flows at time t (MW)
P α β From ( t ) Active power flow from α th bus to β th bus at time t (MW)
P α β loss ( t ) Amount of active power losses at time t (MW)
P α β To ( t ) Active power flow from β th bus to α th bus at time t (MW)
P i , AG ( i , t ) Output power of the AG’s ith dispatchable unit at time t (MW)
P i , DSO ( i , t ) Output power of the DSO’s ith dispatchable unit at time t (MW)
P jdis , AG ( j , t ) Discharged power of the AG’s jth CAES at time t (MW)
P jch , AG ( j , t ) Charged power of the AG’s jth CAES at time t (MW)
P sell DA , LEM ( t ) DSO’s sold power to the AG in the DA LEM at time t (MW)
P sell , AG DA , WEM ( t ) AG’s sold power to the DA WEM at time t (MW)
P sell , DSO DA , WEM ( t ) DSO’s sold power to the DA WEM at time t (MW)
SD i , DSO ( i , t ) Shut-down cost of the DSO’s ith dispatchable unit at time t (USD)
SU i , DSO ( i , t ) Start-up cost of the DSO’s ith dispatchable unit at time t (USD)
V α ( t ) Voltage of the α th buses at time t (V)
V β ( t ) Voltage of the β th buses at time t (V)
μ ( t )   ,   λ ( t ) Dual variables for the DA expressions
RT Decision Variables
I α β ( t , s ) Current from α th bus to β th bus at time t and scenario s (kA)
P buy RT , LEM ( t , s ) DSO’s purchased power from the AG in the RT LEM at time t and scenario s (MW)
P buy , AG RT , WEM ( t , s ) AG’s purchased power from the RT WEM at time t and scenario s (MW)
P buy , DSO RT , WEM ( t , s ) DSO’s purchased power from the RT WEM at time t and scenario s (MW)
P α β flow ( t , s ) Amount of active power flows at time t and scenario s (MW)
P α β From ( t , s ) Active power flow from α th bus to β th bus at time t and scenario s (MW)
P α β loss ( t , s ) Amount of active power losses at time t and scenario s (MW)
P α β To ( t , s ) Active power flow from β th bus to α th bus at time t and scenario s (MW)
P i , DSO dn ( i , t , s ) Downward power adjustment of the DSO’s ith dispatchable unit in the RT at time and scenario s (MW)
P i , DSO up ( i , t , s ) Upward power adjustment of the DSO’s ith dispatchable unit in the RT at time and scenario s (MW)
P sell RT , LEM ( t , s ) DSO’s sold power to the AG in the RT LEM at time t and scenario s (MW)
P sell , AG RT , WEM ( t , s ) AG’s sold power to the RT WEM at time t and scenario s (MW)
P sell , DSO RT , WEM ( t , s ) DSO’s sold power to the RT WEM at time t and scenario s (MW)
V α ( t , s ) Voltage of the α th buses at time t and scenario s (V)
V β ( t , s ) Voltage of the β th buses at time t and scenario s (V)
μ ( t , s ) ,   λ ( t , s ) Dual variables for RT expressions
Binary variables
U i , DSO ( i , t ) Binary variable for operation of the DSO’s ith dispatchable unit at time t
X   ,   Y Binary variables for linearization of non-linear equations

References

  1. Haghifam, S.; Dadashi, M.; Zare, K.; Seyedi, H. Optimal operation of smart distribution networks in the presence of demand response aggregators and microgrid owners: A multi follower Bi-Level approach. Sustain. Cities Soc. 2020, 55, 102033. [Google Scholar] [CrossRef]
  2. Cheng, L.; Yu, T. Game-theoretic approaches applied to transactions in the open and ever-growing electricity markets from the perspective of power demand response: An overview. IEEE Access 2019, 7, 25727–25762. [Google Scholar] [CrossRef]
  3. Saad, W.; Han, Z.; Poor, H.V.; Basar, T. Game-theoretic methods for the smart grid: An overview of microgrid systems, demand-side management, and smart grid communications. IEEE Signal Process. Mag. 2012, 29, 86–105. [Google Scholar] [CrossRef]
  4. Rashidizadeh-Kermani, H.; Vahedipour-Dahraie, M.; Shafie-khah, M.; Siano, P. A regret-based stochastic Bi-level framework for scheduling of DR aggregator under uncertainties. IEEE Trans. Smart Grid 2020. [Google Scholar] [CrossRef]
  5. Gröwe-Kuska, N.; Heitsch, H.; Römisch, W. Scenario reduction and scenario tree construction for power management problems. In Proceedings of the 2003 IEEE Bologna Power Tech Conference Proceedings, Bologna, Italy, 23–26 June 2003; Volume 3, p. 7. [Google Scholar]
  6. Renani, Y.K.; Ehsan, M.; Shahidehpour, M. Optimal transactive market operations with distribution system operators. IEEE Trans. Smart Grid 2017, 9, 6692–6701. [Google Scholar] [CrossRef]
  7. Di Somma, M.; Graditi, G.; Siano, P. Optimal bidding strategy for a DER aggregator in the day-ahead market in the presence of demand flexibility. IEEE Trans. Ind. Electron. 2018, 66, 1509–1519. [Google Scholar] [CrossRef]
  8. Qiu, J.; Meng, K.; Zheng, Y.; Dong, Z.Y. Optimal scheduling of distributed energy resources as a virtual power plant in a transactive energy framework. IET Gener. Transm. Distrib. 2017, 11, 3417–3427. [Google Scholar] [CrossRef]
  9. Wang, J.; Zhong, H.; Wu, C.; Du, E.; Xia, Q.; Kang, C. Incentivizing distributed energy resource aggregation in energy and capacity markets: An energy sharing scheme and mechanism design. Appl. Energy 2019, 252, 113471. [Google Scholar] [CrossRef]
  10. Hatziargyriou, N.D.; Asimakopoulou, G.E. DER integration through a monopoly DER aggregator. Energy Policy 2020, 137, 111124. [Google Scholar] [CrossRef]
  11. Bahramara, S.; Sheikhahmadi, P.; Lotfi, M.; Catalão, J.P.; Santos, S.F.; Shafie-khah, M. Optimal Operation of Distribution Networks through Clearing Local Day-ahead Energy Market. In Proceedings of the 2019 IEEE Milan PowerTech, Milan, Italy, 23–27 June 2019; pp. 1–6. [Google Scholar]
  12. Cornélusse, B.; Savelli, I.; Paoletti, S.; Giannitrapani, A.; Vicino, A. A community microgrid architecture with an internal local market. Appl. Energy 2019, 242, 547–560. [Google Scholar] [CrossRef] [Green Version]
  13. Nunna, H.K.; Srinivasan, D. Multiagent-based transactive energy framework for distribution systems with smart microgrids. IEEE Trans. Ind. Inform. 2017, 13, 2241–2250. [Google Scholar] [CrossRef]
  14. Faqiry, M.N.; Edmonds, L.; Zhang, H.; Khodaei, A.; Wu, H. Transactive-market-based operation of distributed electrical energy storage with grid constraints. Energies 2017, 10, 1891. [Google Scholar] [CrossRef] [Green Version]
  15. Lezama, F.; Soares, J.; Hernandez-Leal, P.; Kaisers, M.; Pinto, T.; Vale, Z. Local Energy Markets: Paving the path toward fully transactive energy systems. IEEE Trans. Power Syst. 2018, 34, 4081–4088. [Google Scholar] [CrossRef] [Green Version]
  16. Correa-Florez, C.A.; Michiorri, A.; Kariniotakis, G. Optimal participation of residential aggregators in energy and local flexibility markets. IEEE Trans. Smart Grid 2019, 11, 1644–1656. [Google Scholar] [CrossRef]
  17. Guzman, C.P.; Bañol Arias, N.; Franco, J.F.; Rider, M.J.; Romero, R. Enhanced coordination strategy for an aggregator of distributed energy resources participating in the day-ahead reserve market. Energies 2020, 13, 1965. [Google Scholar] [CrossRef] [Green Version]
  18. Bahramara, S.; Sheikhahmadi, P.; Mazza, A.; Chicco, G.; Shafie-khah, M.; Catalão, J.P. A Risk-Based Decision Framework for the Distribution company in mutual interaction with the wholesale day-ahead market and microgrids. IEEE Trans. Ind. Inform. 2019, 16, 764–778. [Google Scholar] [CrossRef]
  19. Naebi, A.; SeyedShenava, S.; Contreras, J.; Ruiz, C.; Akbarimajd, A. EPEC approach for finding optimal day-ahead bidding strategy equilibria of multi-microgrids in active distribution networks. Int. J. Electr. Power Energy Syst. 2020, 117, 105702. [Google Scholar] [CrossRef]
  20. Wu, Y.; Shi, J.; Lim, G.; Fan, L.; Molavi, A. Optimal management of transactive distribution electricity markets with Co-optimized bidirectional energy and ancillary service exchanges. IEEE Trans. Smart Grid 2020. [Google Scholar] [CrossRef]
  21. Liu, Z.; Wang, L.; Ma, L. A transactive energy framework for coordinated energy management of networked microgrids with distributionally robust optimization. IEEE Trans. Power Syst. 2020, 35, 395–404. [Google Scholar] [CrossRef]
  22. Wang, J.; Wang, Q.; Zhou, N.; Chi, Y. A novel electricity transaction mode of microgrids based on blockchain and continuous double auction. Energies 2017, 10, 1971. [Google Scholar] [CrossRef] [Green Version]
  23. Akbari-Dibavar, A.; Mohammadi-Ivatloo, B.; Zare, K. Electricity Market Pricing: Uniform Pricing vs. Pay-as-Bid Pricing. In Electricity Markets; Springer: Berlin/Heidelberg, Germany, 2020; pp. 19–35. [Google Scholar]
  24. Pandžić, K.; Pandžić, H.; Kuzle, I. Virtual storage plant offering strategy in the day-ahead electricity market. Int. J. Electr. Power Energy Syst. 2019, 104, 401–413. [Google Scholar] [CrossRef]
  25. Hwang, Y.M.; Sim, I.; Sun, Y.G.; Lee, H.-J.; Kim, J.Y. Game-Theory Modeling for social welfare maximization in smart grids. Energies 2018, 11, 2315. [Google Scholar] [CrossRef] [Green Version]
  26. Schmitt, C.; Cramer, W.; Vasconcelos, M.; Thie, N. Impact of Spot Market Interfaces on Local Energy Market Trading. In Proceedings of the 2019 16th International Conference on the European Energy Market (EEM), Łódź, Poland, 28 June 2019; pp. 1–6. [Google Scholar]
  27. Khorasany, M.; Mishra, Y.; Ledwich, G. Market framework for local energy trading: A review of potential designs and market clearing approaches. IET Gener. Transm. Distrib. 2018, 12, 5899–5908. [Google Scholar] [CrossRef] [Green Version]
  28. Conejo, A.J.; Carrión, M.; Morales, J.M. Decision Making under Uncertainty in Electricity Markets; Springer: Berlin/Heidelberg, Germany, 2010; Volume 1. [Google Scholar]
  29. Soares, J.; Canizes, B.; Ghazvini, M.A.F.; Vale, Z.; Venayagamoorthy, G.K. Two-stage stochastic model using Benders’ decomposition for large-scale energy resource management in smart grids. IEEE Trans. Ind. Appl. 2017, 53, 5905–5914. [Google Scholar] [CrossRef]
  30. Ghazvini, M.A.F.; Faria, P.; Ramos, S.; Morais, H.; Vale, Z. Incentive-based demand response programs designed by asset-light retail electricity providers for the day-ahead market. Energy 2015, 82, 786–799. [Google Scholar] [CrossRef]
  31. Heitsch, H.; Römisch, W. Scenario reduction algorithms in stochastic programming. Comput. Optim. Appl. 2003, 24, 187–206. [Google Scholar] [CrossRef]
  32. Silvente, J.; Papageorgiou, L.G.; Dua, V. Scenario tree reduction for optimisation under uncertainty using sensitivity analysis. Comput. Chem. Eng. 2019, 125, 449–459. [Google Scholar] [CrossRef]
  33. Do Prado, J.C.; Qiao, W. A stochastic decision-making model for an electricity retailer with intermittent renewable energy and short-term demand response. IEEE Trans. Smart Grid 2018, 10, 2581–2592. [Google Scholar] [CrossRef]
  34. Rider, M.J.; López-Lezama, J.M.; Contreras, J.; Padilha-Feltrin, A. Bilevel approach for optimal location and contract pricing of distributed generation in radial distribution systems using mixed-integer linear programming. IET Gener. Transm. Distrib. 2013, 7, 724–734. [Google Scholar] [CrossRef]
  35. Kazempour, S.J.; Conejo, A.J.; Ruiz, C. Strategic generation investment using a complementarity approach. IEEE Trans. Power Syst. 2010, 26, 940–948. [Google Scholar] [CrossRef]
  36. Dadashi, M.; Haghifam, S.; Zare, K.; Haghifam, M.-R.; Abapour, M. Short-term scheduling of electricity retailers in the presence of Demand Response Aggregators: A two-stage stochastic Bi-Level programming approach. Energy 2020, 205, 117926. [Google Scholar] [CrossRef]
  37. Exizidis, L.; Kazempour, J.; Pinson, P.; De Grève, Z.; Vallée, F. Impact of public aggregate wind forecasts on electricity market outcomes. IEEE Trans. Sustain. Energy 2017, 8, 1394–1405. [Google Scholar] [CrossRef] [Green Version]
  38. Asl, R.M.; Zargin, E. Energy Procurement via Hybrid Robust-Stochastic Approach. In Robust Energy Procurement of Large Electricity Consumers; Springer: Berlin/Heidelberg, Germany, 2019; pp. 105–123. [Google Scholar]
  39. Feng, C.; Li, Z.; Shahidehpour, M.; Wen, F.; Li, Q. Stackelberg game based transactive pricing for optimal demand response in power distribution systems. Int. J. Electr. Power Energy Syst. 2020, 118, 105764. [Google Scholar] [CrossRef]
  40. Akbari, E.; Hooshmand, R.-A.; Gholipour, M.; Parastegari, M. Stochastic programming-based optimal bidding of compressed air energy storage with wind and thermal generation units in energy and reserve markets. Energy 2019, 171, 535–546. [Google Scholar] [CrossRef]
  41. Aliasghari, P.; Zamani-Gargari, M.; Mohammadi-Ivatloo, B. Look-ahead risk-constrained scheduling of wind power integrated system with compressed air energy storage (CAES) plant. Energy 2018, 160, 668–677. [Google Scholar] [CrossRef]
  42. Asensio, M.; Muñoz-Delgado, G.; Contreras, J. Bi-level approach to distribution network and renewable energy expansion planning considering demand response. IEEE Trans. Power Syst. 2017, 32, 4298–4309. [Google Scholar] [CrossRef]
  43. Haghifam, S.; Zare, K.; Dadashi, M. Bi-level operational planning of microgrids with considering demand response technology and contingency analysis. IET Gener. Transm. Distrib. 2019, 13, 2721–2730. [Google Scholar] [CrossRef]
  44. Ghalelou, A.N.; Fakhri, A.P.; Nojavan, S.; Majidi, M.; Hatami, H. A stochastic self-scheduling program for compressed air energy storage (CAES) of renewable energy sources (RESs) based on a demand response mechanism. Energy Convers. Manag. 2016, 120, 388–396. [Google Scholar] [CrossRef]
Figure 1. Scheme of the proposed model.
Energies 13 03621 g001
Figure 2. A typical branch of the Smart Distribution Networks (SDN).
Energies 13 03621 g002
Figure 3. Decision variables of entities in the suggested leader–follower decision-making model.
Energies 13 03621 g003
Figure 4. Configuration of the modified 33-Bus SDN.
Energies 13 03621 g004
Figure 5. Forecasted load profiles of the SDN [1].
Energies 13 03621 g005
Figure 6. Wind speed and solar irradiance forecast.
Energies 13 03621 g006
Figure 7. Day-Ahead (DA) market prices forecast.
Energies 13 03621 g007
Figure 8. Real-Time Wholesale Electricity Market (RT WEM) prices for reduced scenarios.
Energies 13 03621 g008
Figure 9. Distribution System Operator’s (DSO’s) traded energy with markets in the DA stage considering the competitive environment.
Energies 13 03621 g009
Figure 10. Optimal operating points of the DSO’s local units.
Energies 13 03621 g010
Figure 11. AG’s traded energy with markets in the DA stage considering the competitive environment.
Energies 13 03621 g011
Figure 12. Optimal operating points of the AG’s local sources.
Energies 13 03621 g012
Figure 13. Variation of stochastic parameters. a) WT power variation, b) PV power variation.
Energies 13 03621 g013
Figure 14. Changes in the DSO’s uncertain variables in scenario 6.
Energies 13 03621 g014
Figure 15. DSO’s traded energy in the RT markets for scenario 6 considering the competitive environment.
Energies 13 03621 g015
Figure 16. Changes in the Distributed Energy Resources (DER) Aggregator’s (AG’s) uncertain variables in scenario 6.
Energies 13 03621 g016
Figure 17. AG’s traded energy in the RT markets for scenario 6 considering the competitive environment.
Energies 13 03621 g017
Figure 18. DSO’s exchanged energy with markets in the DA stage without considering the competitive environment.
Energies 13 03621 g018
Figure 19. AG’s exchanged energy with markets in the DA stage without considering the competitive environment.
Energies 13 03621 g019
Figure 20. DSO’s traded energy in the RT markets for scenario 6 without considering the competitive environment.
Energies 13 03621 g020
Figure 21. AG’s traded energy in the RT markets for scenario 6 without considering the competitive environment.
Energies 13 03621 g021
Table 1. A comparison between the current study and previous research works.
Ref.Participation of the SDN’s Entities in Both WEM and LEMStackelberg Game-Based Approach for Local TE TradingCoordination of Decentralized DERs by an Independent AG
[6]
[7]
[8]
[9]
[10]
[11]
[12]
[13]
[14]
[15]
[16]
[17]
[18]
[19]
[20]
[21]
This Paper
Table 2. Occurrence probability of reduced scenarios.
# ScenarioS1S2S3S4S5S6S7S8S9S10
Probability0.0820.0840.1010.1230.1690.1210.1140.0640.0700.072
Table 3. Peak demand of loads.
Bus Number1234567891011
Demand (MW)2.190.923.581.082.695.505.381.151.730.27
Bus Number1213141516171819202122
Demand (MW)1.811.883.040.921.231.382.731.852.422.191.73
Bus Number2324252627282930313233
Demand (MW)1.7710.3810.620.921.851.043.545.733.155.731.58
Table 4. Input data of dispatchable units.
DSO’s Dispatchable Resources
Units P i , DSO min (MW) P i , DSO max (MW) a i , DSO (USD/MWh) b i , DSO (USD) MUT i , DSO (h) MDT i , DSO (h)
10.56.026.142.02.02.0
20.56.026.142.02.02.0
AG’s Dispatchable Resources
Units P i , AG min (MW) P i , AG max (MW) c i , AG (USD/MWh) RU i , AG (MW) RD i , AG (MW)
10.55.051.01.52.0
20.54.041.01.01.5
Table 5. Input data of non-dispatchable units.
DSO’s ResourcesAG’s Resources
ParameterValueParameterValue
P w , DSO R 5 (MW) P w , AG R 2 × 5 (MW)
V w , DSO R 14 (m/s) V w , AG R 15 (m/s)
V w , DSO ci 4 (m/s) V w , AG ci 4 (m/s)
V w , DSO co 20 (m/s) V w , AG co 25 (m/s)
P v , DSO R 3 (MW) P v , AG R 7.5 (MW)
T Ref 25 (°C) T Ref 25 (°C)
G Ref 1 (kW/m2) G Ref 1 (kW/m2)
Ψ −0.005 (1/°C) Ψ −0.005 (1/°C)
Table 6. Input data of the compressed air energy storage system.
E j , AG min E j , AG max OM exp . OM com . HR λ Gas P jch , AG max P jdis , AG max
2.00
(MWh)
20.00
(MWh)
3.09
(USD/MWh)
3.09
(USD/MWh)
3.99
(MMBtu/MWh)
1.87
(USD/MMBtu)
4.00
(MWh)
4.00
(MWh)
Table 7. DSO’s cost, revenue, and exchanged energy during the whole day.
Market Transaction Cost (USD/day)Purchased Energy (MWh/day)Market Transaction Revenue (USD/day)Sold Energy (MWh/day)Operating Cost of DERs (USD/Day)
LEMWEMLEMWEMLEMWEMLEMWEM
DA6375.844952.8111.3881.30.00.00.00.03866.8
RT-S10.00.00.00.055.13430.312.7448.2707.8
RT-S20.00.00.00.044.81998.37.1301.6741.5
RT-S30.00.00.00.099.62186.117.0243.8846.2
RT-S40.010.60.03.8130.92425.917.5205.21004.9
RT-S50.018.30.04.837.23583.92.8204.11644.9
RT-S60.078.10.013.133.02113.04.0202.31069.1
RT-S70.082.40.011.697.11272.211.0130887.2
RT-S828.8105.92.631.879.6640.08.6113.3493.5
RT-S949.477.68.627.169.9564.410.494.3630.1
RT-S10108.0134.313.230.27.2505.81.484.8603.4
Table 8. AG’s cost, revenue, and traded energy during the whole day.
Market Transaction Cost (USD/day)Purchased Energy (MWh/day)Market Transaction Revenue (USD/day)Sold Energy (MWh/day)Operating Cost of DERs (USD/day)
LEMWEMLEMWEMLEMWEMLEMWEM
DA0.055.90.01.46375.84891.9111.3102.34180.6
RT-S155.1126.812.711.40.0550.60.073.5
RT-S244.8181.17.121.50.0305.90.056.0
RT-S399.641.917.010.90.0420.40.061.0
RT-S4130.9295.017.521.30.0675.00.055.8
RT-S537.2318.12.825.20.0758.50.044.7
RT-S633.093.84.015.20.01092.10.0108.1
RT-S797.1153.411.010.60.0515.00.068.0
RT-S879.638.58.67.928.8346.32.680.8
RT-S969.9146.810.421.649.4276.68.658.0
RT-S107.2116.91.414.0108.0158.413.236.0
Table 9. Cost and benefit distribution of market participants considering the competitive environment.
DSODER Aggregator
LEM Transaction Cost5907.8 (USD/day)LEM Transaction Benefit5907.8 (USD/day)
WEM Transaction Cost26740.0 (USD/day)WEM Transaction Benefit8422.6 (USD/day)
DERs’ Operating Cost12495.4 (USD/day)DERs’ Operating Cost4180.6 (USD/day)
Total Operating Cost45,143.2 (USD/day)Total Expected Benefit10,149.7 (USD/day)
Table 10. Cost and benefit distribution of market participants without considering the competitive environment.
DSODER Aggregator
LEM Transaction Cost12699.6 (USD/day)LEM Transaction Benefit12,699.6 (USD/day)
WEM Transaction Cost20,828.9 (USD/day)WEM Transaction Benefit3803.8 (USD/day)
DERs’ Operating Cost12,164.0 (USD/day)DERs’ Operating Cost5123.7 (USD/day)
Total Operating Cost45,692.5 (USD/day)Total Expected Benefit11,379.7 (USD/day)
Table 11. Comparison between two case studies.
With a Game-Based ApproachWithout a Game-Based Approach
DSO’s Total Operating Cost45,143.2 (USD/day)45,692.5 (USD/day)
AG’s Total Expected Benefit10,149.7 (USD/day)11,379.7 (USD/day)