1. Introduction
The development of civilization is accompanied by population growth, technology development, and the increased production of pollutants. In the past, there was no concern about pollutants discharged into the environment, but at present, environmental damage awareness and the desire to protect nature are gaining public recognition. One of the objects of concern in this area is the waste produced by cities and wastewater factories. In order to counteract the harmful effects of water pollution, sewage treatment plants are being built.
The wastewater treatment plant is a complex of facilities in which precisely defined mechanical, chemical, and biological processes take place to purify water. Several types of wastewater treatment plants (WWTPs) can be named. One of them is the flow WWTP, in which wastewater continuously flows past subsequent tanks, and is subject to individual processes in them. In this paper, 0a WWTP with a sequencing batch reactor (SBR) is the main focus.
The SBR is a reservoir in which purification processes occur cyclically using the biological activated sludge method. This method makes use of microorganisms, the metabolism of which absorbs organic pollutants. The activated sludge method requires the introduction of oxygen as a bio-oxidant of impurities. The SBR tank operates in the cycle that consists of five phases [
1]:
Filling the SBR with sewage—untreated sewage is added to the tank with the already activated sludge from the previous sewage batch.
Aeration and mixing—the phase of growth of microorganisms and development of biological processes related to purification. This phase is the longest.
Sedimentation—the treated sewage accumulates in the upper part of the tank, while the activated sludge, microorganisms, and the untreated sewage remain at the bottom.
Decantation—draining of the clarified treated sewage into natural water tanks, rivers, or lakes.
Downtime—the shortest phase, during which the reactor awaits the start of a new cycle.
The definition of phases presented is simplified. The purification process requires the repeated succession of the filling and aeration phases. Phase 2 is the process of oxygenation of wastewater, and consists of variable aerobic and anaerobic periods. The removal of phosphorus and nitrogen from wastewater requires the alternation of aerobic and anaerobic conditions. Aerobic conditions are needed for the survival of most bacteria and micro-organisms, while the controlled anaerobic conditions are essential to remove these elements.
Ensuring an adequate level of dissolved DO oxygen is very important for the proper course of the purification process required to meet the determinants and standards for the content of chemical compounds in the purified water. A lack of oxygen causes the death of microorganisms that worsens the properties of activated sludge. This leads to a deterioration in the quality of treated wastewater. On the other hand, supplying too much oxygen increases the consumption of electricity needed to aerate wastewater, and thus the entire cost of the process. In general, DO control is very important for improving energy efficiency in the wastewater treatment plant, as the energy costs of the aeration process represent more than 50% of total operating costs [
2].
Various DO control algorithms are described in the literature [
3,
4,
5,
6,
7,
8,
9,
10,
11,
12,
13,
14]. New solutions are intended to decrease energy consumption and improve the stability of particular process phases. However, the aeration system is left aside in those solutions. Complex nonlinear dynamics are compared to unit gain. According to the authors of this paper, ensuring good results of DO control also requires taking into consideration direct aeration control. A detailed analysis of the aeration system is given in [
10]. This paper presents the design of the aeration control system, taking into account the dynamics of pipelines and blowers.
The paper is organized as follows.
Section 2 provides a description of the WWTP case study, while
Section 3 shows a mathematical model of the aeration system.
Section 4 describes the process design of the fuzzy controller, and
Section 5 analyzes the control results. Finally,
Section 6 concludes the paper.
2. Description of WWTP
The WWTP located at Mątowskie Pastwiska (Northern Poland) was designed for purifying municipal sewage. In 2017, the plant was modernized, which included increasing its throughput and process automation. These goals were achieved by building new facilities (e.g., sewage pumping stations, technological buildings, SBRs), as well as adapting the existing ones (chambers, tanks, and pumping stations). A purification process control system was developed to ensure process automation. Currently, the Supervisory Control and Data Acquisition (SCADA) system is used to operate the control system, and control is carried out via PLC controllers. The sources of the delivered sewage include small commercial, educational, and production facilities, as well as households and boarding houses.
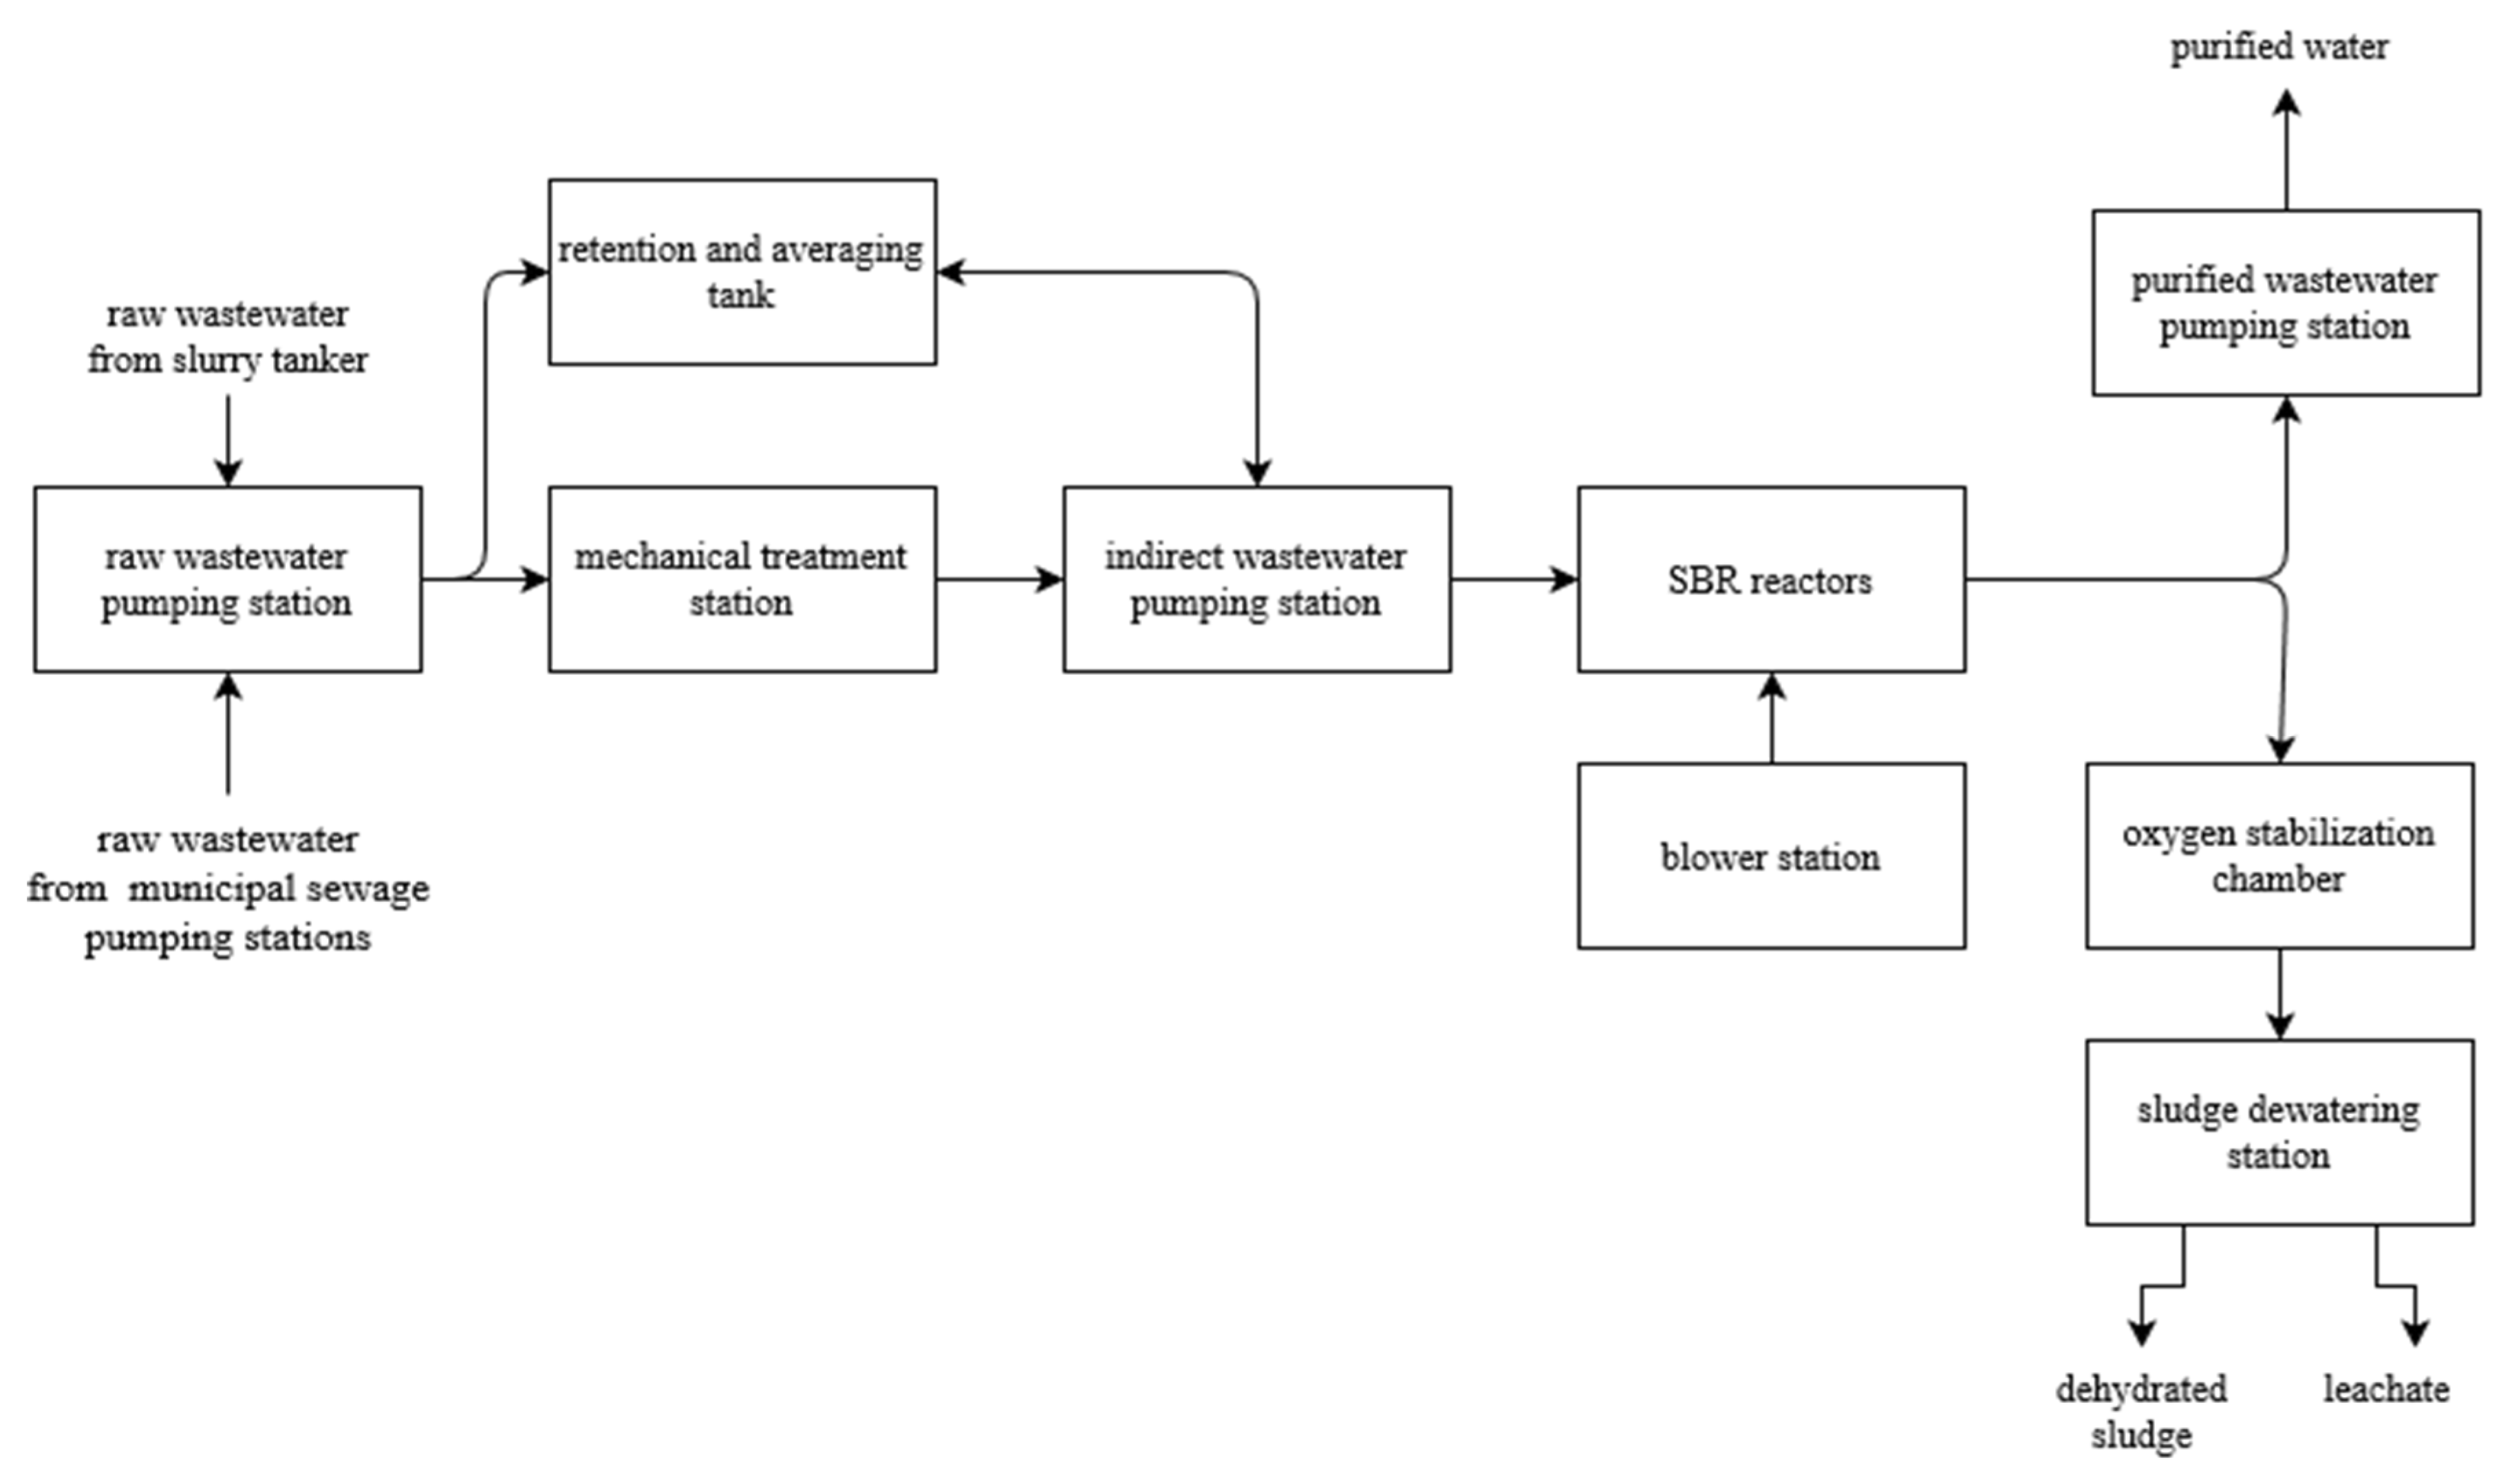
The schematic diagram of the WWTP case study is shown in
Figure 1. The wastewater flows from municipal sewage pumping stations to the raw wastewater pumping stations in the treatment plant. Next, the raw wastewater undergoes a mechanical treatment process, after which it flows by gravity to an intermediate pumping station. Pumps located in the indirect pumping station are responsible for supplying the wastewater to the SBR, following the planned course of biological treatment processes. The biological processes intended to purify the activated sludge take place in SBR reactors. The level of dissolved oxygen (DO) required for these processes is provided by the blower station. The airflow is also responsible for mixing the contents in the SBR. Finally, the treated wastewater flows to the treated wastewater pumping station, and the excess sludge from the reactors is pumped into the oxygen stabilization tank. The stabilized sludge flows to the sludge dewatering station. In there, the dehydrated sludge and leachate are extracted and transported to the sewage pumping station. The sewage treatment plant also has a retention and averaging tank responsible for collecting wastewater in the event of breakdowns or long-term rainfall.
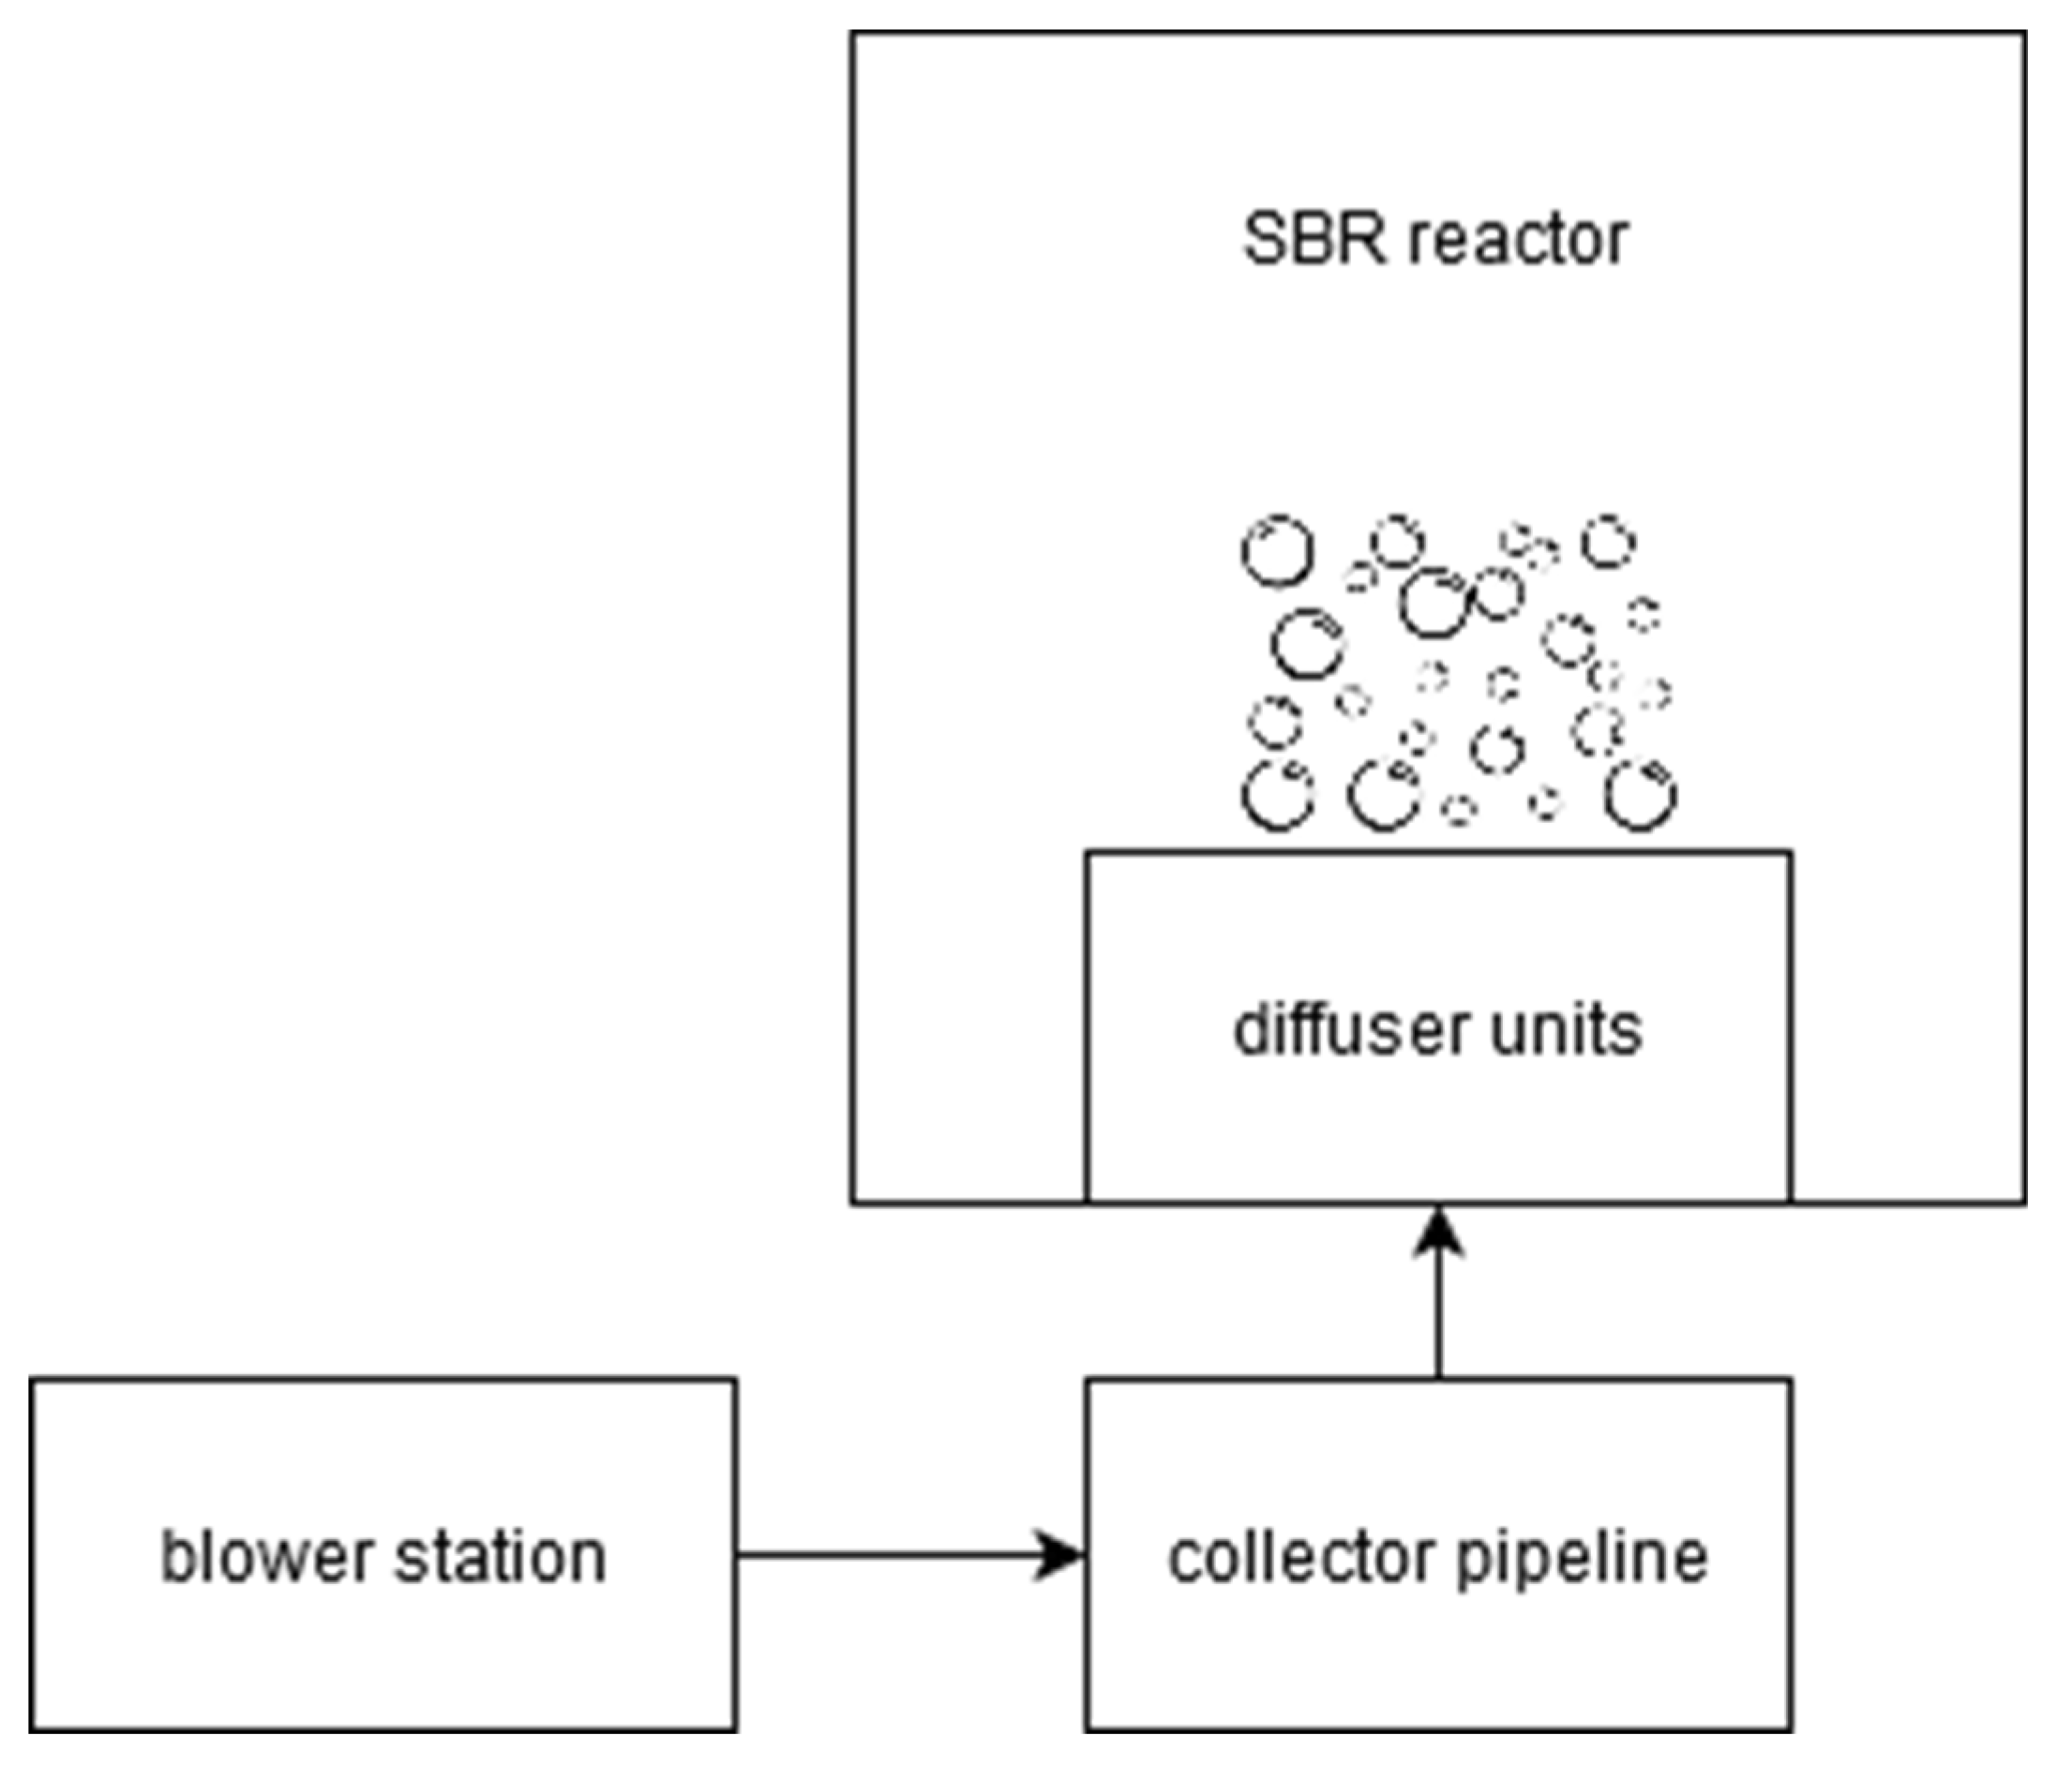
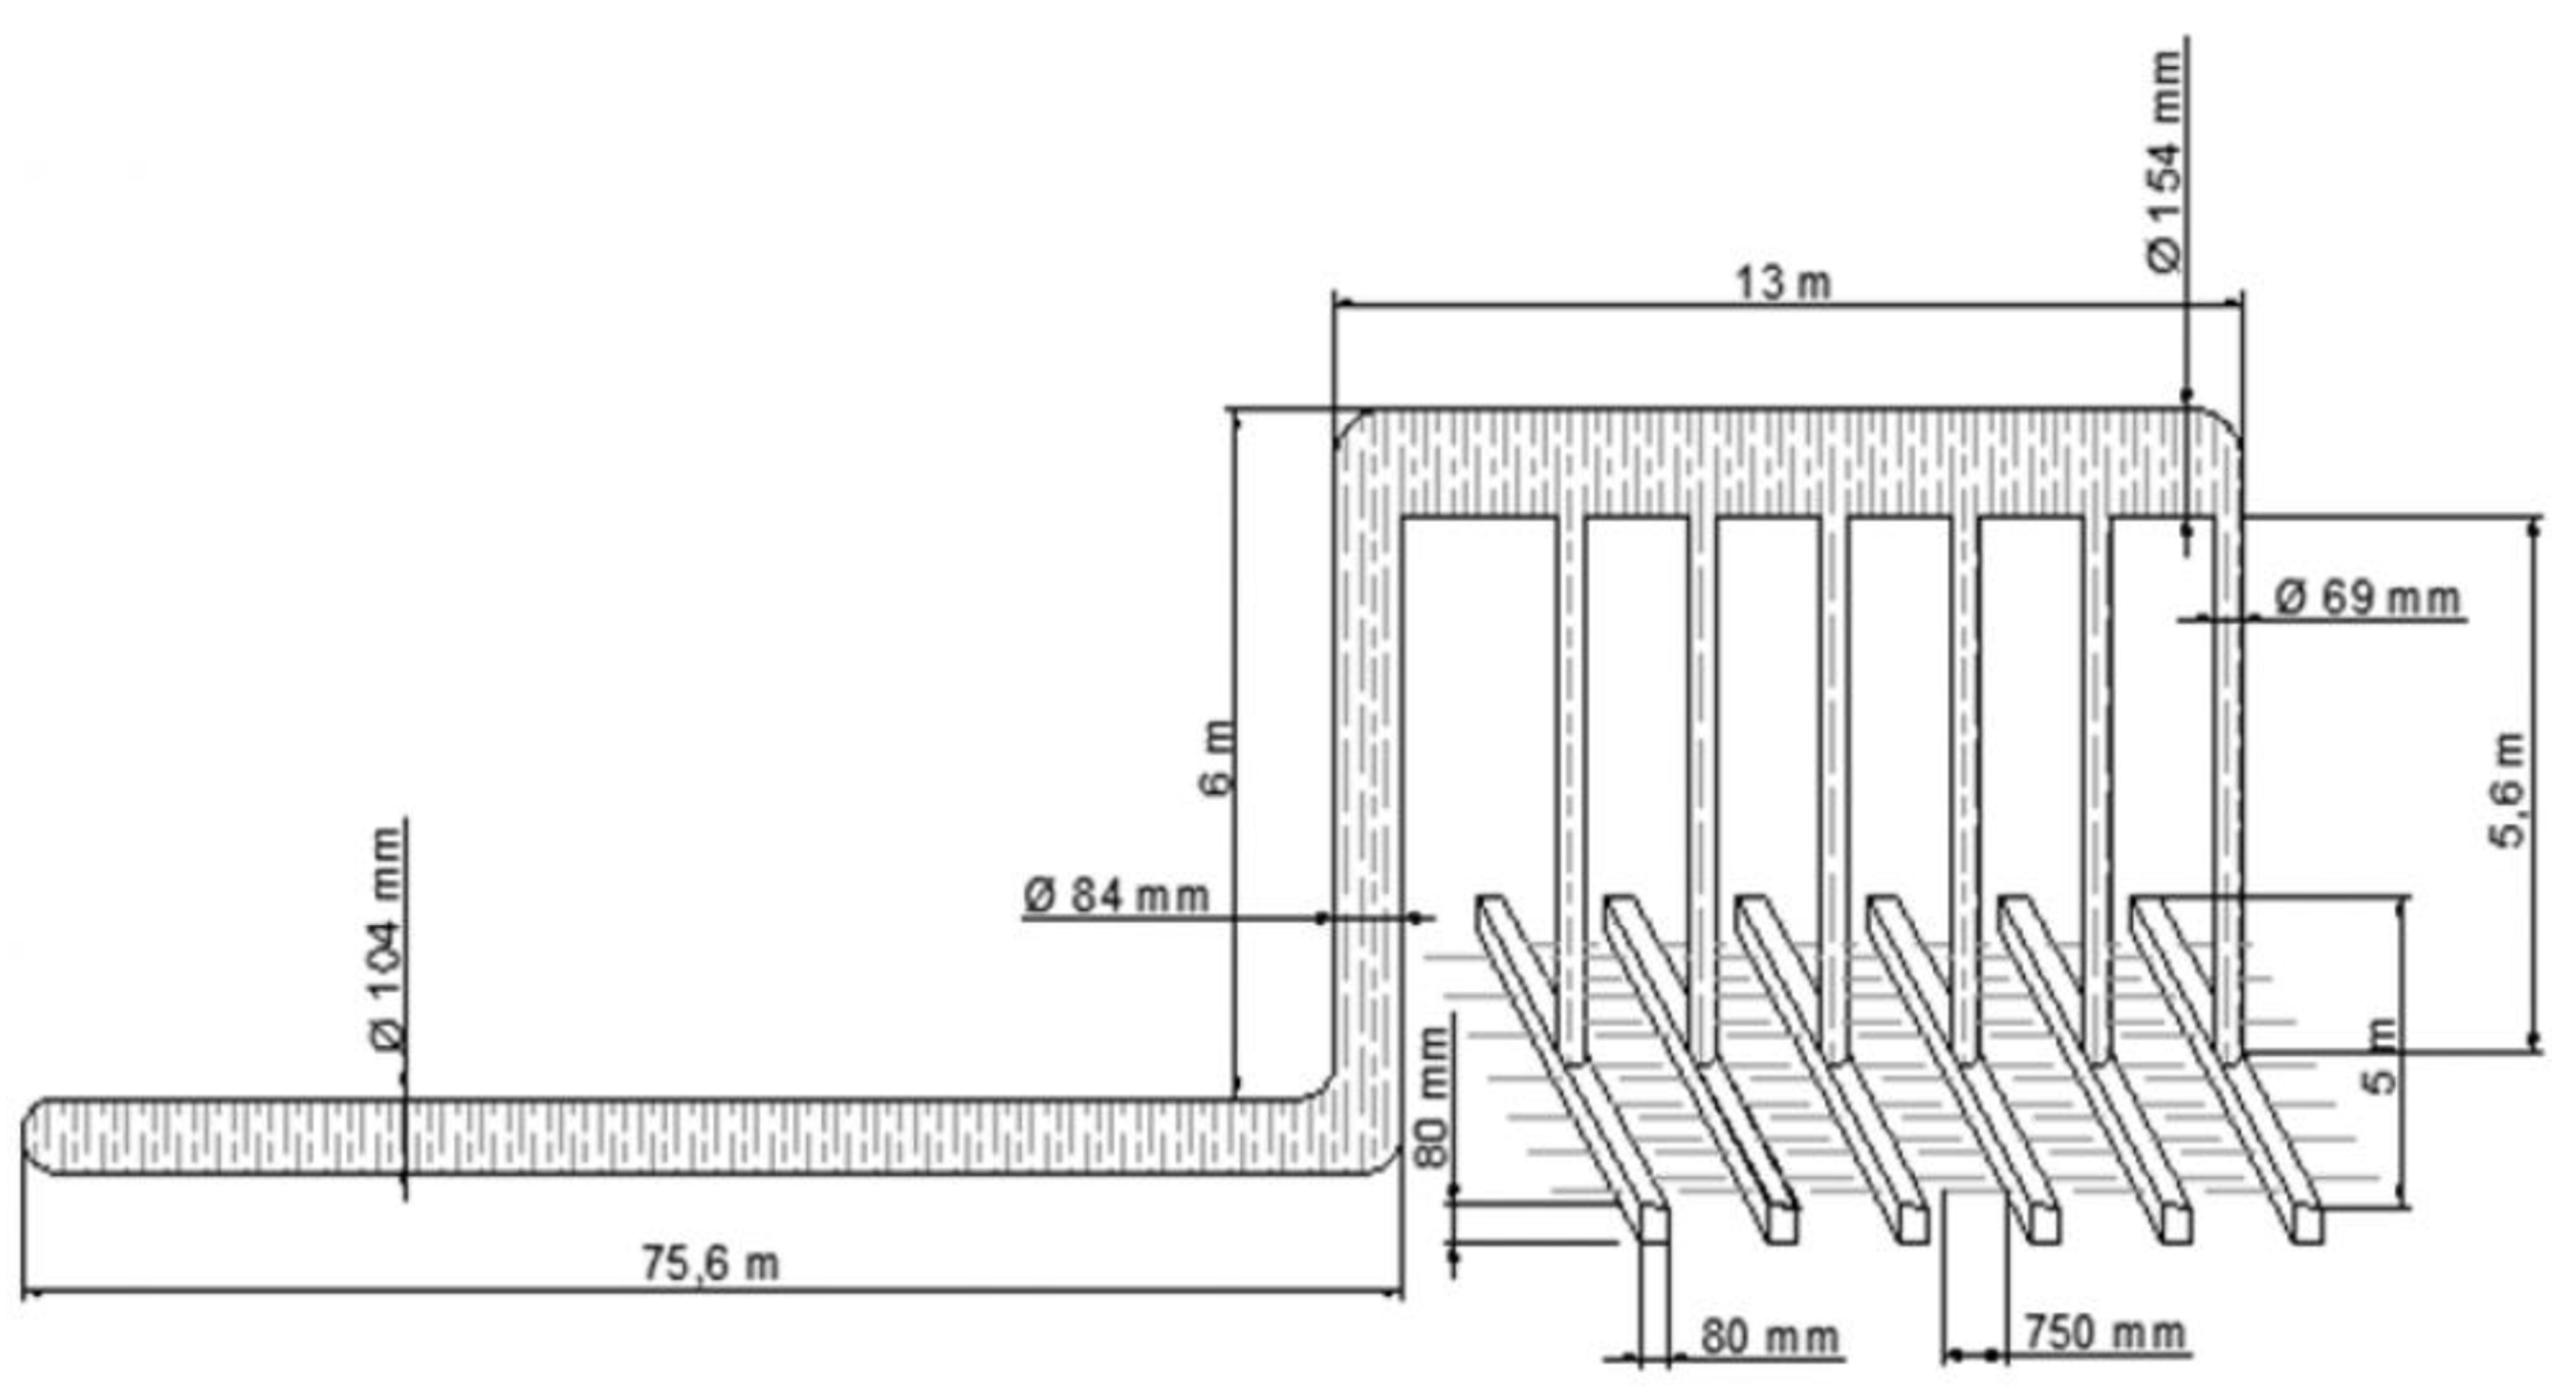
WWTP is composed of two identical SBRs which operate independently of each other. Each SBR is equipped with a separate aeration system, which consists of a blower, membrane diffuser units, and pipeline. The schematic diagram of the aeration system is shown in
Figure 2.
Currently, the aeration system is controlled by means of a PID (proportional–integral–derivative) controller with experimentally selected settings [
15]. The general form of the controller is presented as Equation (1), and the form including weights of the elements as Equation (2).
where:
y-control variable (CV), x-process variable (PV), w-setpoint (SP),
s-Laplace operator,
Kp-proportional gain,
TI-integral time,
TD-derivative time, and
a,
b, c-weights assigned to integrating, proportional and differentiating sequences, respectively. The values assigned to particular variables are:
Kp = 5,
TI = 7,
TD = 0,
a = 1,
b = 1, c = 0.2.
Such a selection of controller settings may generate a non-optimal control trajectory. Blowers can react too slowly or too rapidly to DO changes, causing oscillations. In each case, it leads to DO level disturbance in the reactor, with the resulting incorrect course of biological purification phases.
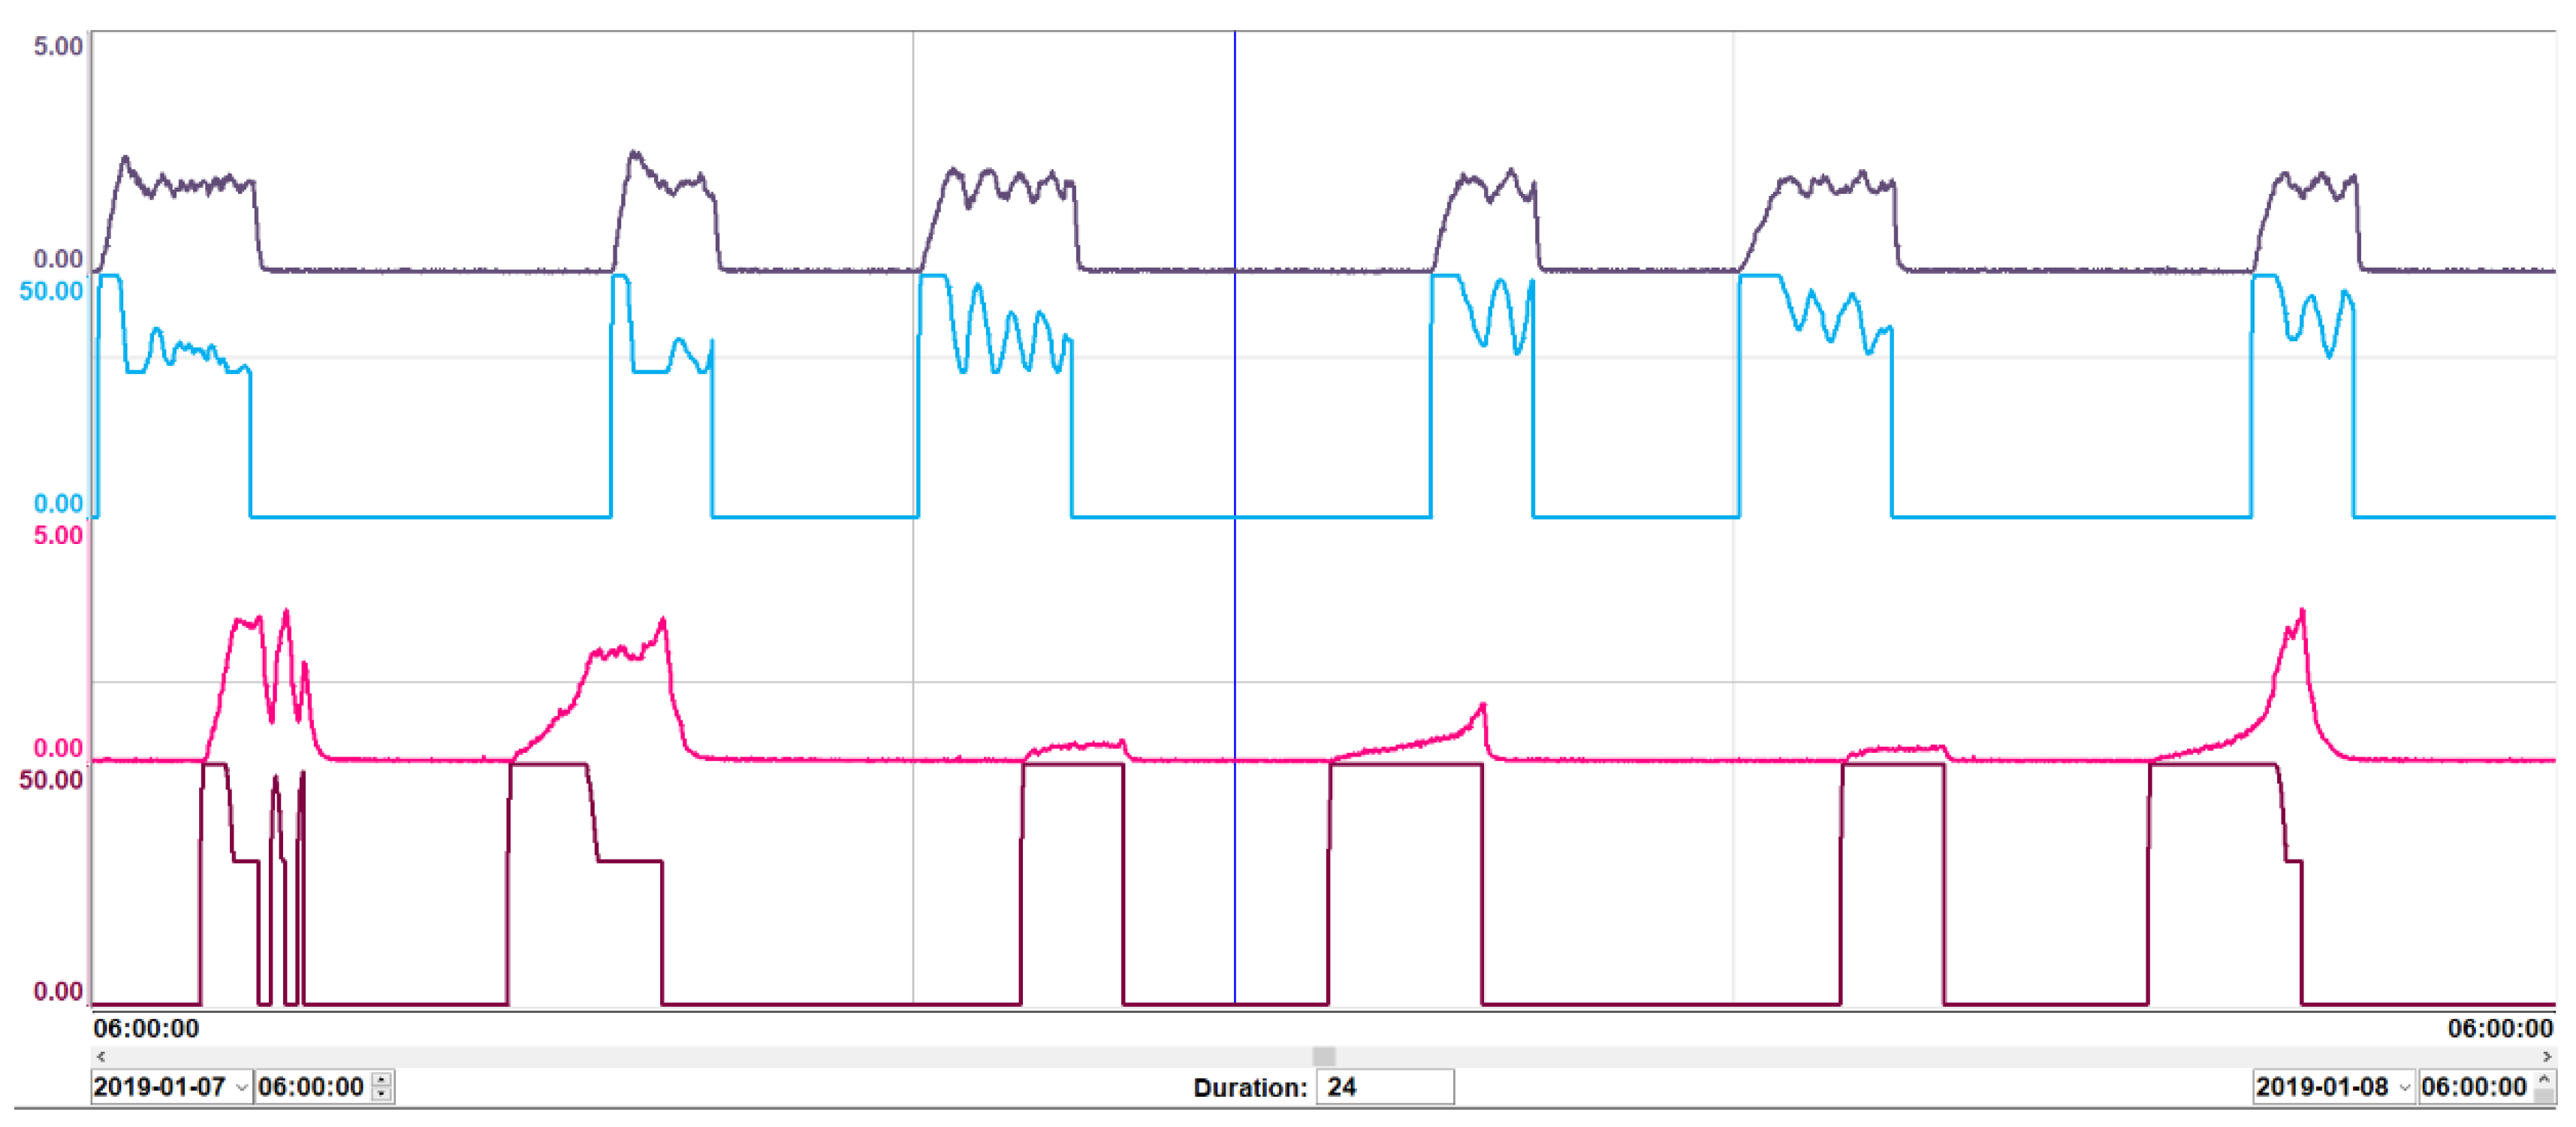
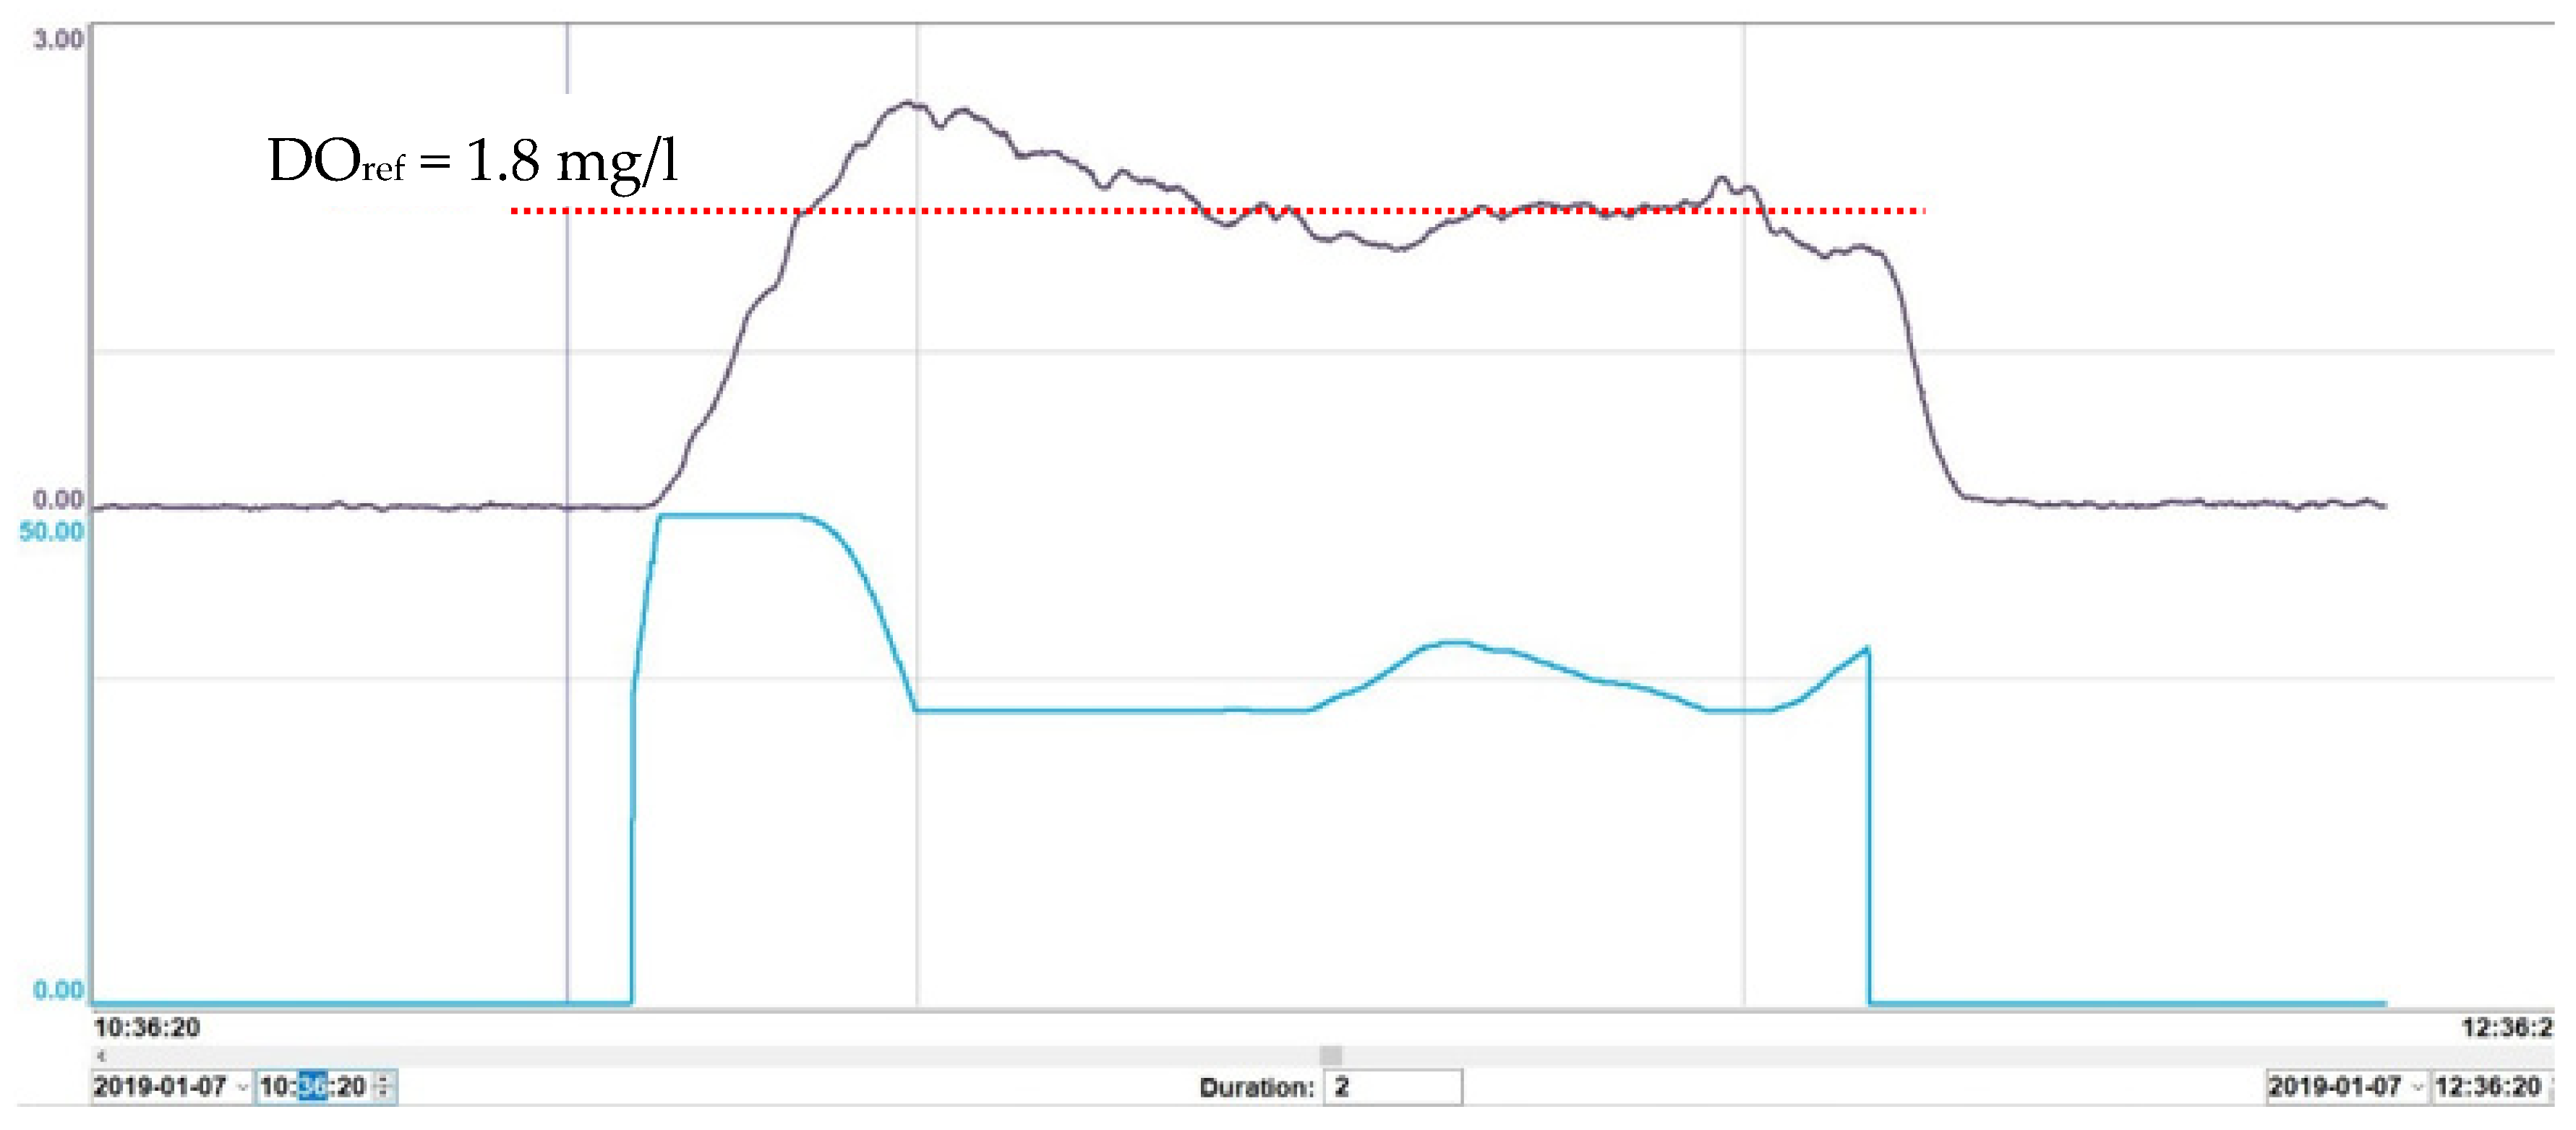
Figure 3 and
Figure 4 show the results of current DO control. Significant fluctuations and deviations from the DO setpoint can be observed.
Figure 3 presents the historical data of two identical SBR reactors during a one day period. The data are presented as follows: for reactor 1, the DO level is marked with a purple shade and the frequency of blowers is marked with light blue shade, for reactor 2, the DO level is marked with a pink shade and the frequency of the blower is marked with a purple shade.
Figure 4 shows the DO level controlling over two hours, for reactor 1, for the set value DO = 1.8 mg/L.
3. Aeration System Modelling
The structure of the aeration system model for control purposes was described in [
16], while the general methodology of aeration system modelling was given in [
17]. The aeration system model was divided into three subsystems (see
Figure 2).
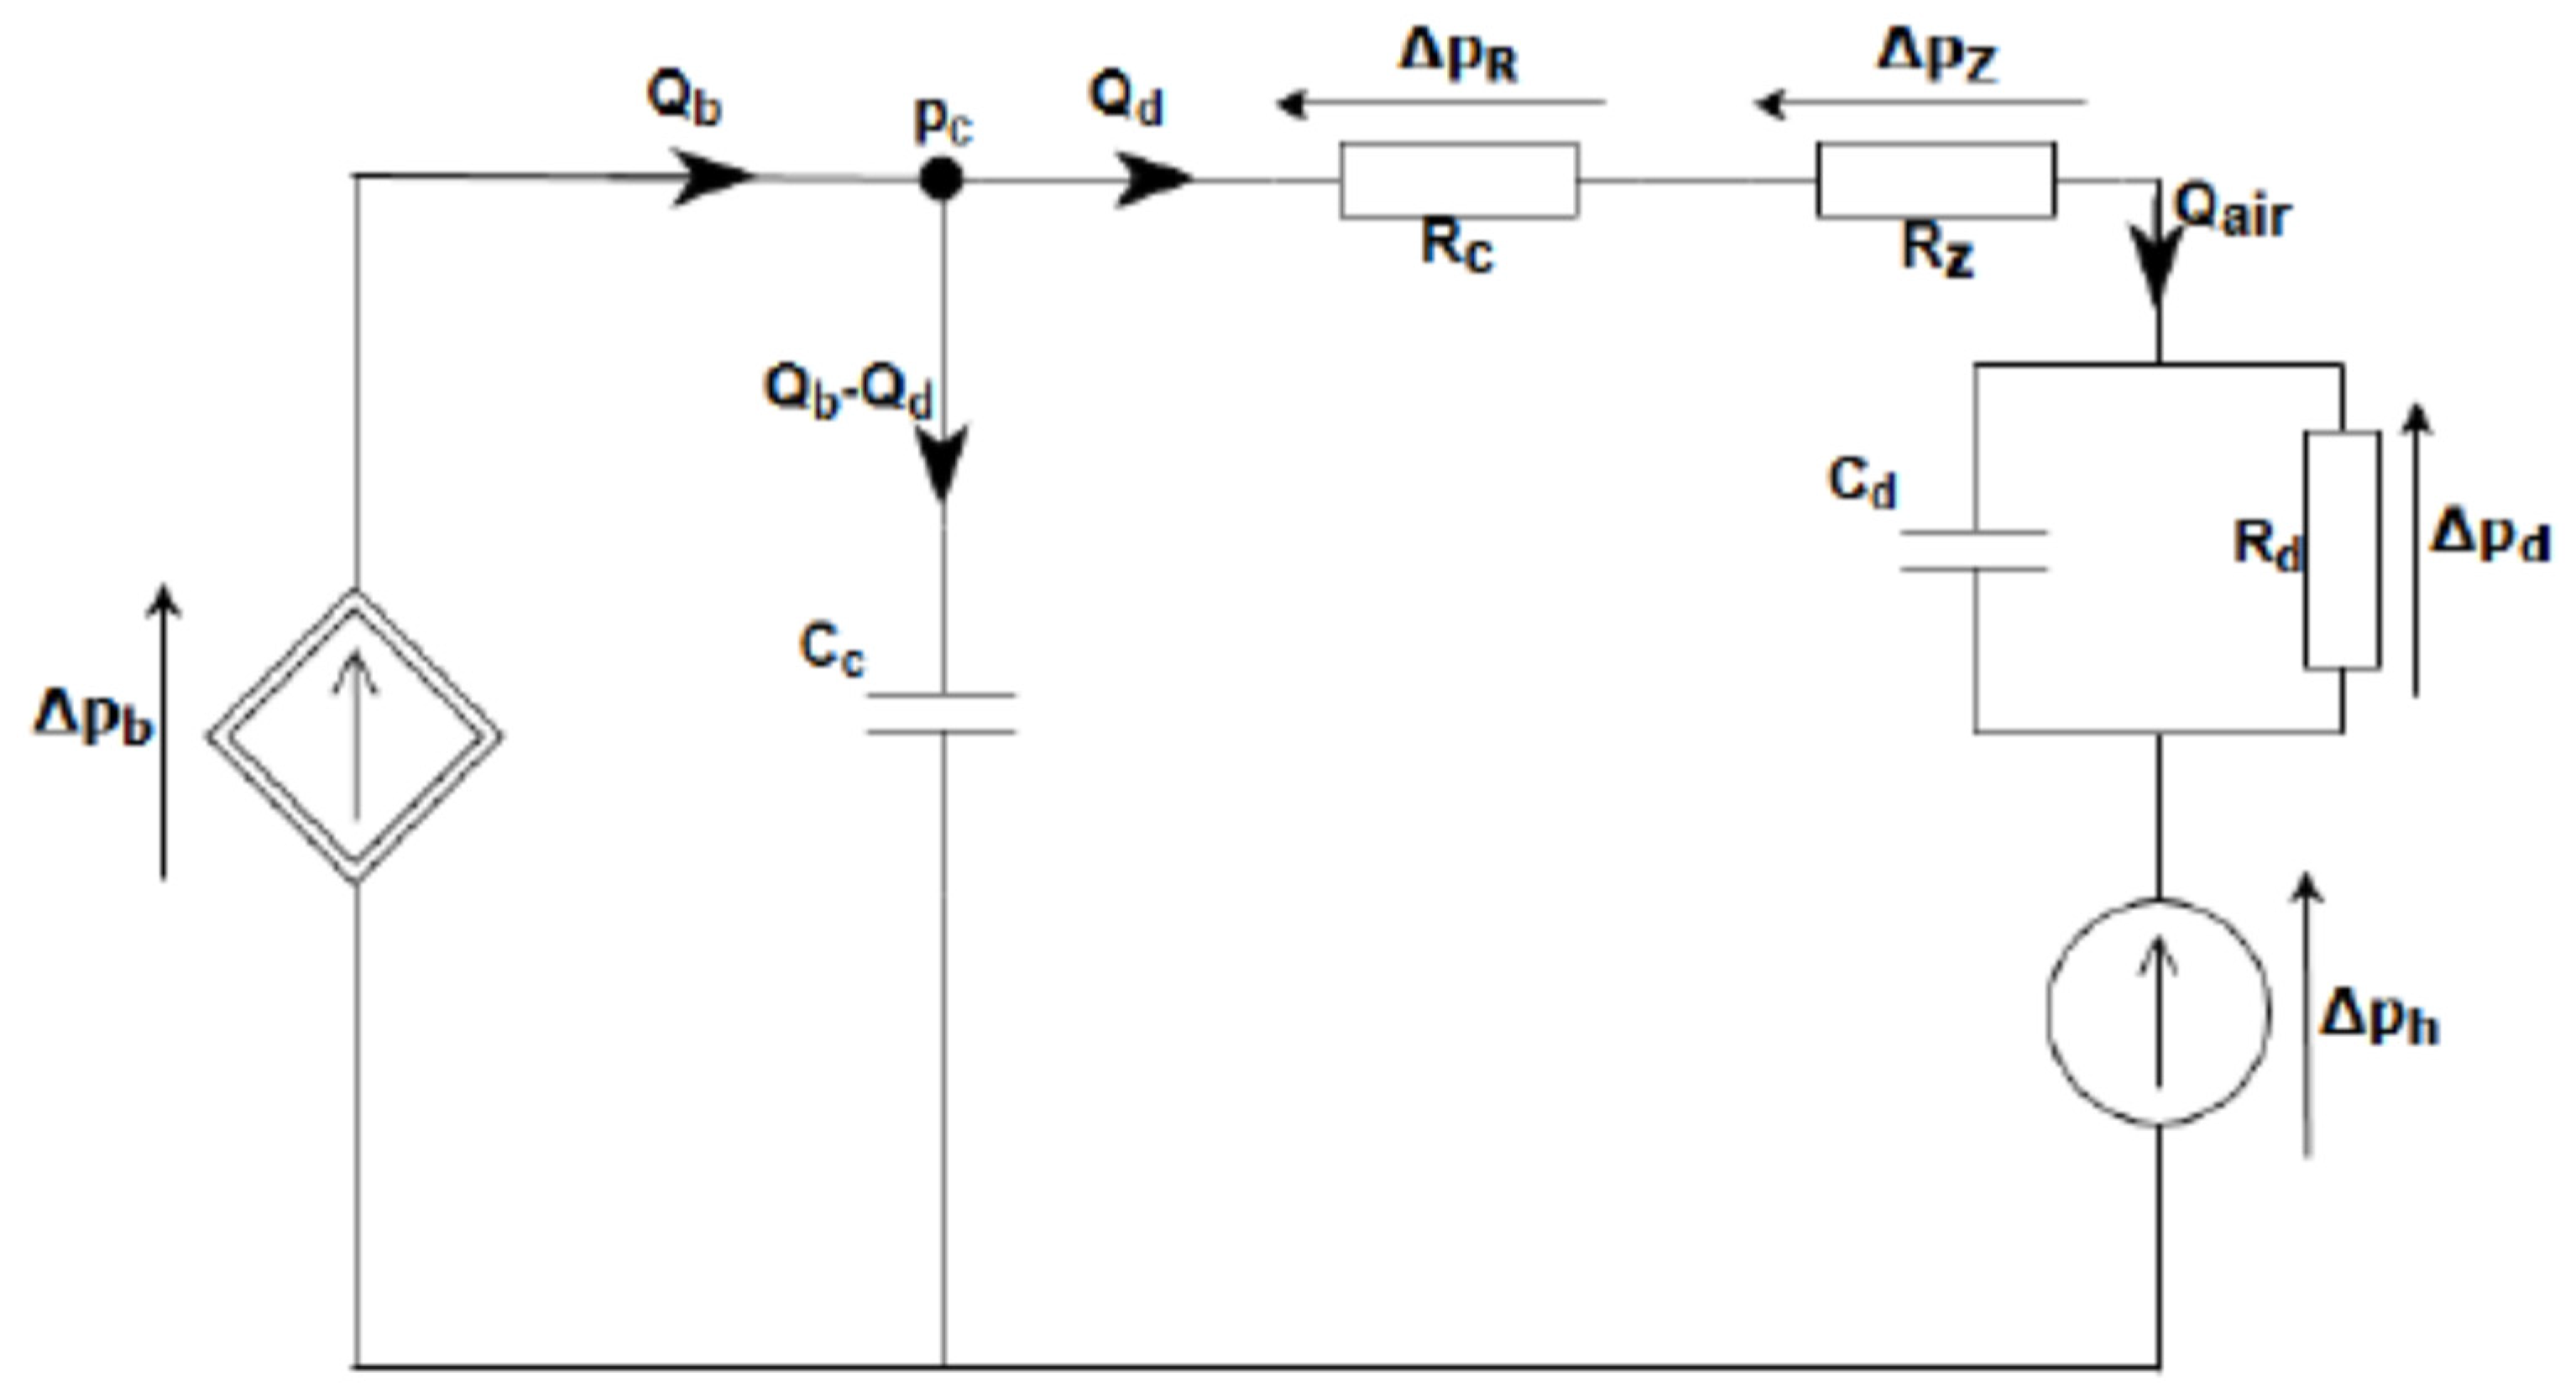
The circuit, which is an electrical analogy of the aeration system model, is shown in
Figure 5. The blower is represented by a nonlinear current source with designations
Qb and Δ
pb. Hydrostatic pressure is shown as the voltage source with pressure drop Δ
ph. Resistor
Rc corresponds to the total unit pressure loss along pipeline length, while the loss represented by
Rz results from changes in pipe diameter. The pipeline is presented as total fluid flow capacitance
Cc at node
pc. The aeration segment units are represented by resistance
Rd and capacity
Cd. The pressure loss across the diffuser is Δ
pd.
The blower station compresses air to assure appropriate pressure pc in the pipeline. The blower operation was modelled based on the characteristics provided by the blower manufacturer. The current rotational speed and pressure were compared with the table of characteristic values, and the nearest elements, marked as indices, were selected.
The pipeline has a large fluid flow capacity that significantly changes the dynamics of the model. The air capacity of the pipeline is modelled as shown in
Figure 6.
The blower model is represented as a nonlinear function:
where
Qb,
pc, and
n are the blower airflow output, pressure drop across the blower, and motor rotational speed, respectively.
The pressure change Δ
pc in the pipeline depends mainly on pipeline capacity
Cc, hydrostatic pressure Δ
ph associated with filling the SBR tank, and pipeline pressure losses Δ
pR and Δ
pZ. The pressure drop Δ
pd across the diffusers is treated as a receiver, and the power supply as a blower (Δ
pb).
The air capacity of the pipeline can be given as:
where
Vc is the total volume of the pipeline,
pc is the gas pressure inside the pipeline, and
kc is the unit conversion coefficient. The total volume of the pipeline is obtained as the sum of five pipeline segments of different lengths and cross-sections:
The pressure change in the pipeline is achieved using the principle of mass conservation at pipeline node:
The pressure loss occurring in the pipeline can be described as the sum of three elements: unit linear pressure loss over a specified section (presented as
in Equation (9)), local pressure loss due to changes in the pipe cross-section (presented as
in Equation (11)), and pressure loss due to height difference (presented as Δ
pH in Equation (13)). Pressure losses caused by pipelines elbows have been neglected due to their low impact. The unit linear pressure loss depends on the cross-section of the pipeline, as well as on gas density and the flow value. This loss was modelled according to the Renouard formula [
18]:
where
V is the mass airflow,
D is the pipeline diameter and
ρ is the gas density. The individual gas constant for air, equal to
r = 287.05 J/kgK, and temperature
T were applied to calculate the density:
The local pressure loss is caused by the influence of the Reynolds number on the value of the local resistance coefficient ξ and gas flow speed
w. This relation is given by Equation (11), with ξ defined as (12):
where
Aj and
Aj+1 are the pipe cross-section areas before and after narrowing, respectively.
The pressure loss caused by the difference in levels significantly affects pipelines with large altitude changes and low gas pressures. The vertical sections of these pipelines are exposed to pressure changes depending on the density difference between the flowing medium and the air under standard conditions,
ρp = 1.225 kg/m
3, according to the equation:
Due to small height changes in the examined pipeline, the pressure loss caused by the difference of levels has been neglected.
In the steady-state, the open diffuser airflow–pressure drop relation is described by a nonlinear function:
The characteristic obtained from the manufacturer’s data is described by a nonlinear function, with which the diffuser airflow dynamics can be described as:
where a
1 = −0.3484, a
2 = 7.1474, a
3 = 53.5072, a
4 = 178.1669, a
5 = −223.0322.
4. Design of Control Systems
In practice, WWTPs make use of simple control algorithms based on internal PI controllers of PLC systems. Algorithms comprising the PI family are designed to control linear processes. Using them to control the non-linear dynamics of DO and the aeration system does not bring, as a rule, satisfying results. Ensuring better control to reduce operating costs requires the optimization of controller settings at a work point and/or the use of advanced control techniques. The process of optimizing PID controller settings is presented in
Section 4.1, while
Section 4.2 shows the design process of a fuzzy controller for aeration system control purposes.
4.1. Optimization of PID Controller
The simplest action to improve the operation of the aeration system is to optimize the blower controller settings in the vicinity of the work point. In this study, the optimization was performed using the objective function, based on the integral qualitative criteria of the controller. The decision variables considered in the optimization process were the settings
Kp,
Ki, and
Kd of the PID algorithm with the following structure:
The integral of absolute error (IAE) was chosen as the optimization criterion:
Due to the capacitive nature of system dynamics, an anti-windup filter was applied. The optimization was carried out using the global minimum search algorithm for the blower speed setpoint level jump from 0 to the operating point. The non-linear characteristic of system dynamics means that local maxima and minima of the objective function may occur. To protect the algorithm from getting stuck at a local point, the global minimum of the objective function was used. The settings found by the optimization method are: Kp = 2.773, Ki = 5.292, and Kd = 1.168. A significant difference between the set values is visible—attention should also be paid to the difference in the structure of PID algorithms.
4.2. Design of Fuzzy Control Algorithm
With a fuzzy control system, several human activities, for instance, those of the operator or process technologist, can be emulated by the system, based on the knowledge base described by the rules of the fuzzy model. In addition to the knowledge base, the system also contains an extensive database, through which the input and output data are associated with the rules contained in the knowledge base. Fuzzy control works very well to control processes that cannot be easily described in the form of differential equations.
The Mamdani-type fuzzy linguistic model was applied to design the controller. The minimum operator was used as the method of logical sum (AND) and implications, while the logical alternative (OR) and aggregation were obtained using the maximum operator. The numerical form of the result of the controller’s operation was obtained using the centroid of area defuzzification method.
In the first phase of fuzzy controller designing, the error value and the error signal derivative were treated as input variables to the control system. The fuzzy controller output, interpreted as the blower speed change rate, was passed to the integrating member to obtain the blower speed.
Table 1,
Table 2,
Table 3 and
Table 4 present membership functions, conclusions, and linguistic principles.
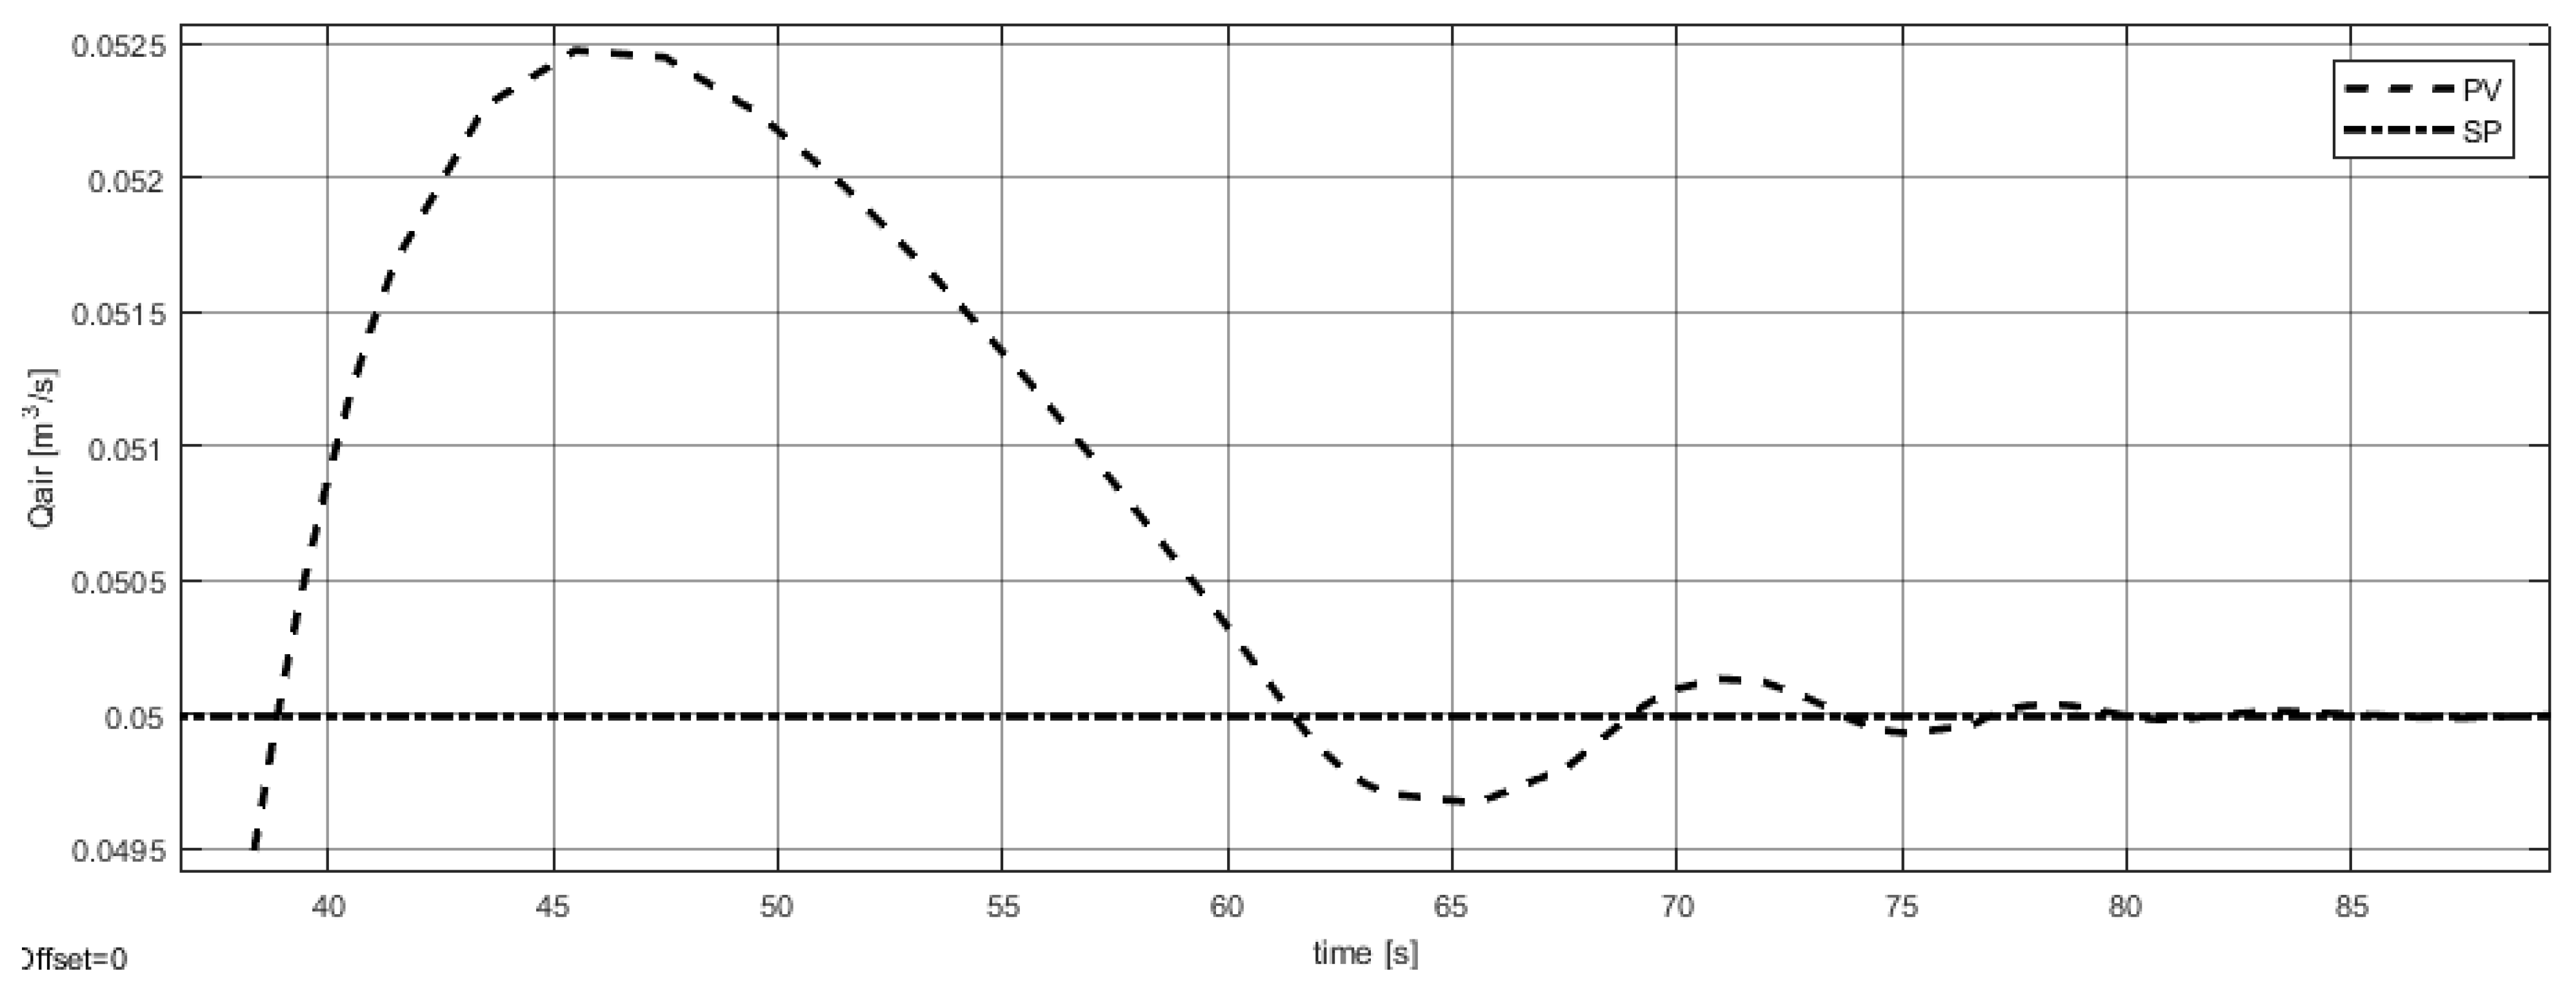
Simulation tests of the first version of the controller for the step signal are shown in
Figure 7. The setpoint (reference)
Qair is designated as SP and the process value
Qair as PV.
Fading oscillations and significant overshoot are observed in the step response of the first controller version. The control quality is unsatisfactory. The operation of the first control algorithm has also revealed that two operation modes are needed: (1) operation under normal conditions for the operating point, and (2) operation in start-up states of the aeration system. The latter mode means a condition that occurs after service work or extended downtime, and is characterized by a significant delay between the increase in blower speed, and reaching the minimum pressure in diffusers.
As a result of the introduction of two separate operating states in the second version of the controller, the number of inputs was increased by two new variables: the controlled signal Qair_PV, and the set value Qair_SP. This approach allowed the initial rotation speed to be selected in such a way as to meet DO requirements during the blower start-up.
An attempt was made to reduce overshoot and oscillations by adding additional linguistic values in the error premise.
Table 5,
Table 6,
Table 7,
Table 8,
Table 9 and
Table 10 present membership functions, conclusions, and linguistic principles.
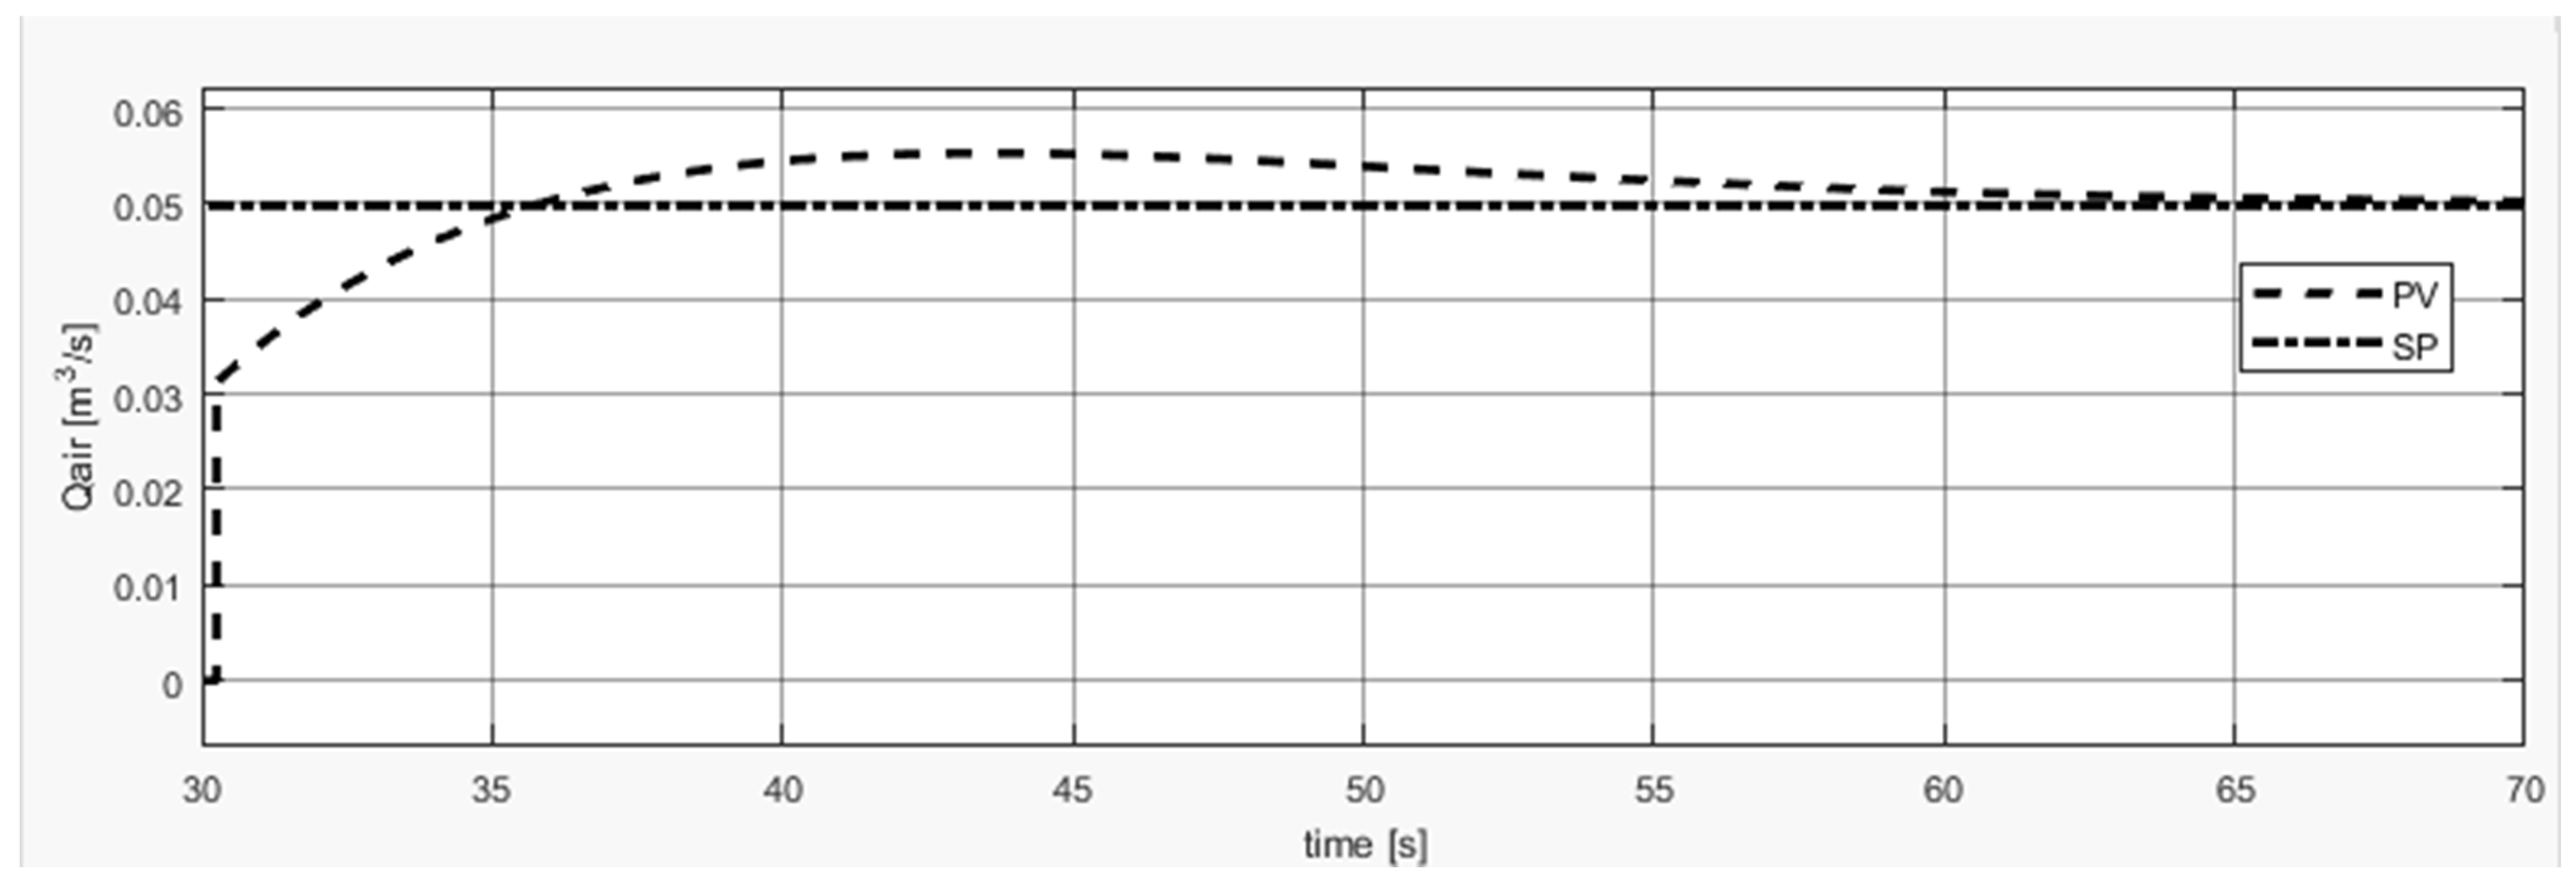
The second version of the controller is characterized by the lack of oscillation, but the observed overshoot is greater than in the first case. Improvement was achieved in the context of a smooth control signal, but no improvement in the quality of control–error. Its step response is shown in
Figure 8.
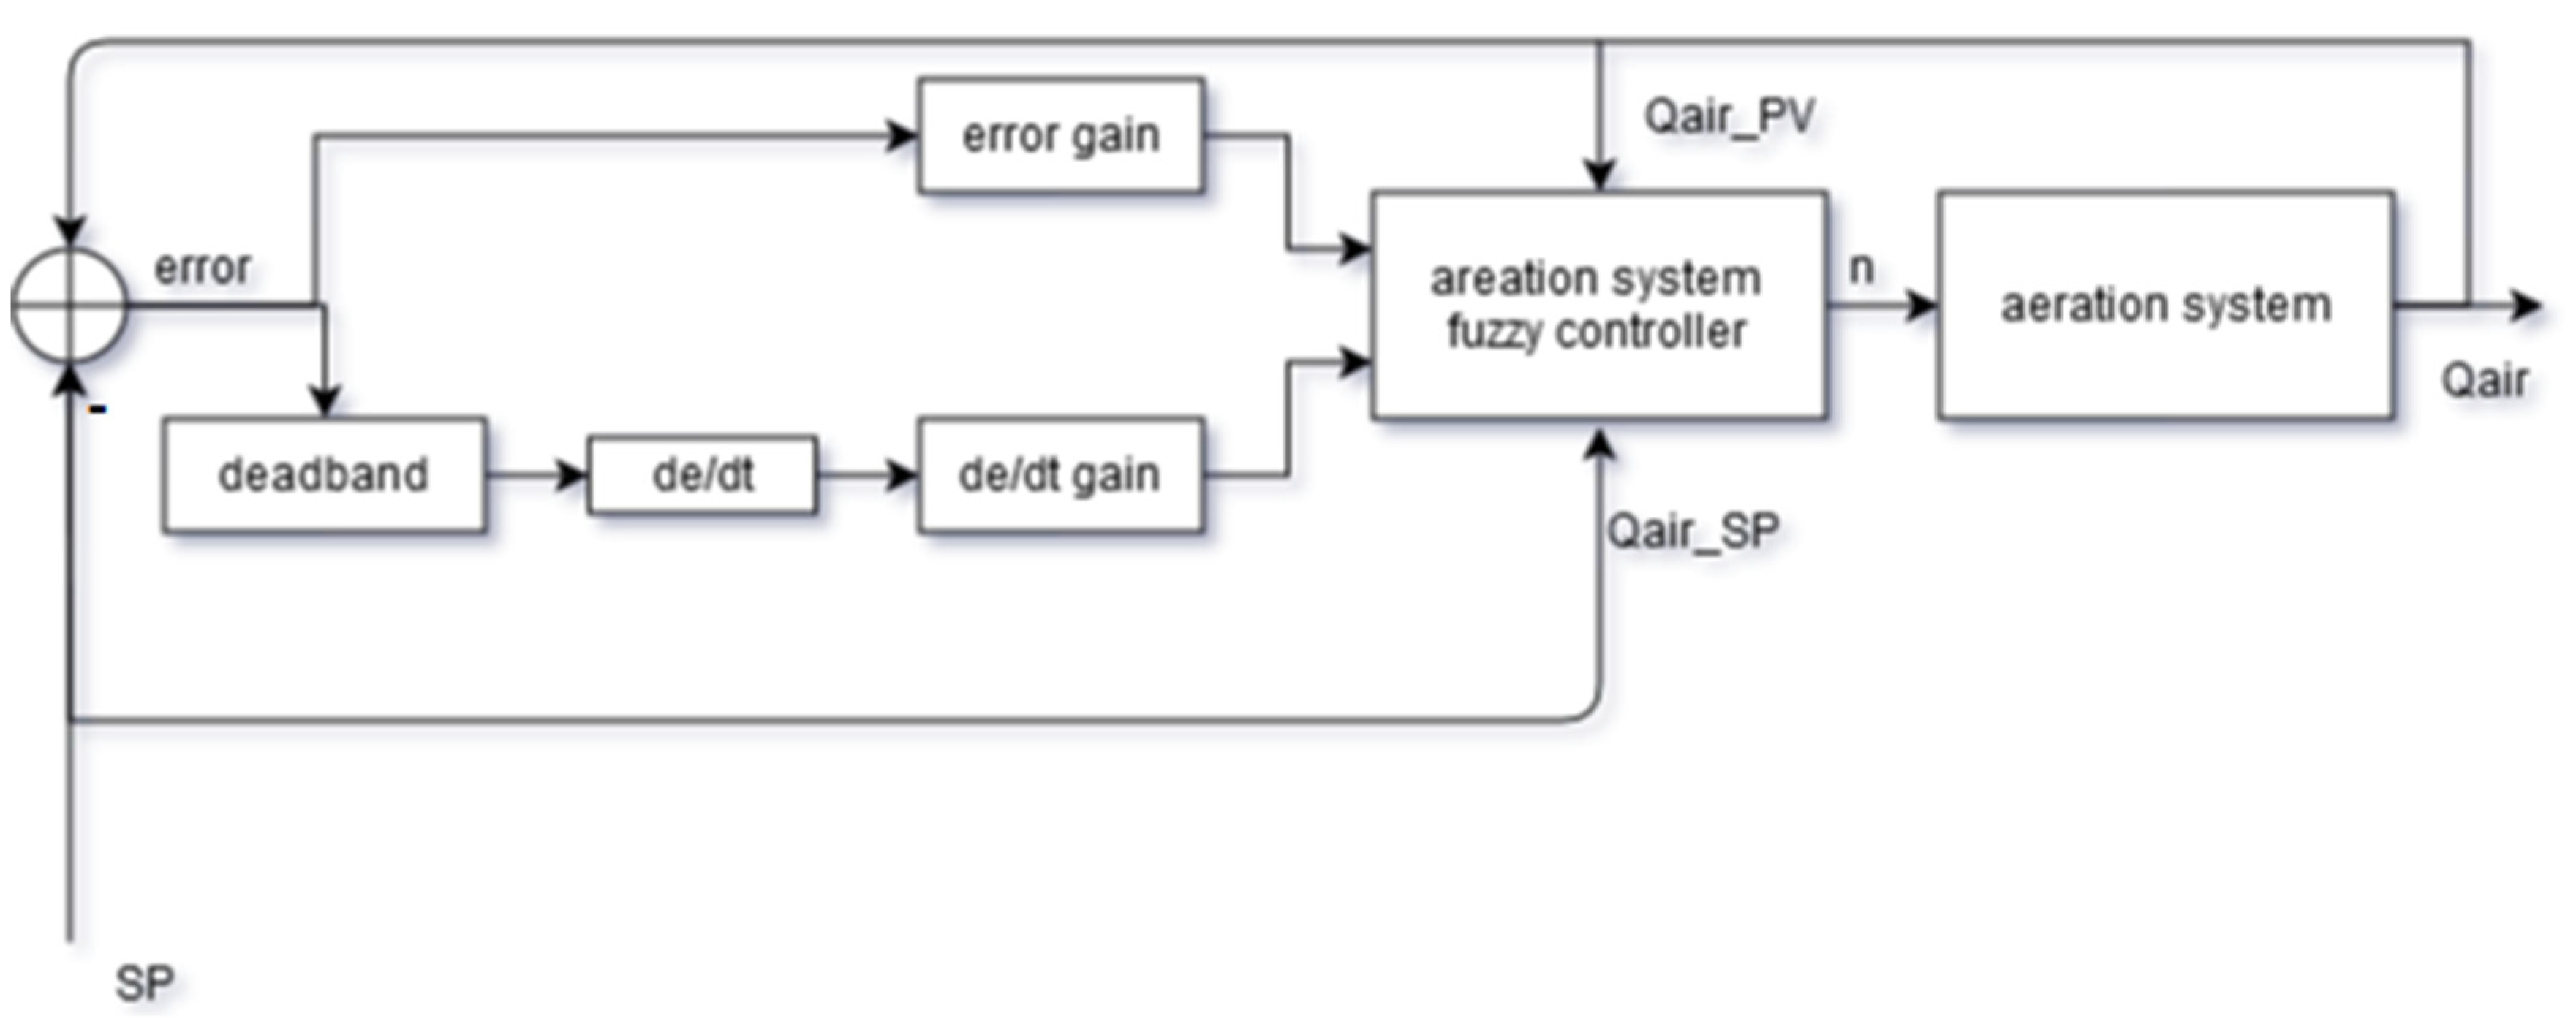
Further development of the fuzzy controller included, among others, the improvement of numerical stability by using the dead band function for individual signals, adding amplification of error signals and derivative, and changing the rules of the fuzzy controller. The third version of the controller abandoned the concentration of membership functions by assigning separate (slightly overlapping) numerical values to them. Some elements of the second version of the controller (see
Table 5 and
Table 6) were also used. The structure of the control system is presented in
Figure 9, while the details of the fuzzy controller are shown in
Figure 10.
The aeration control system acts as a subsystem of the entire DO control system in SBR. The output value of the Qair aeration system is the input value to the system which is the SBR tank. The set value (reference value) of the aerated system, denoted as SP, is the output value resulting from the DO control process.
The presented structure of the fuzzy controller consists of a block containing fuzzy logic and defuzzification methods, and input signal processing blocks. The dead band block used in the error derivative track is intended to limit the controller’s operation for very small error values. This ensures faster operation and numerical stability of the algorithm in the event of interference. The error and derivative error gain blocks allow to adjust the range of fuzzy variables without having to interfere with the values of linguistic variables.
Additional new rules 3 to 27 are presented in another form in
Table 15.
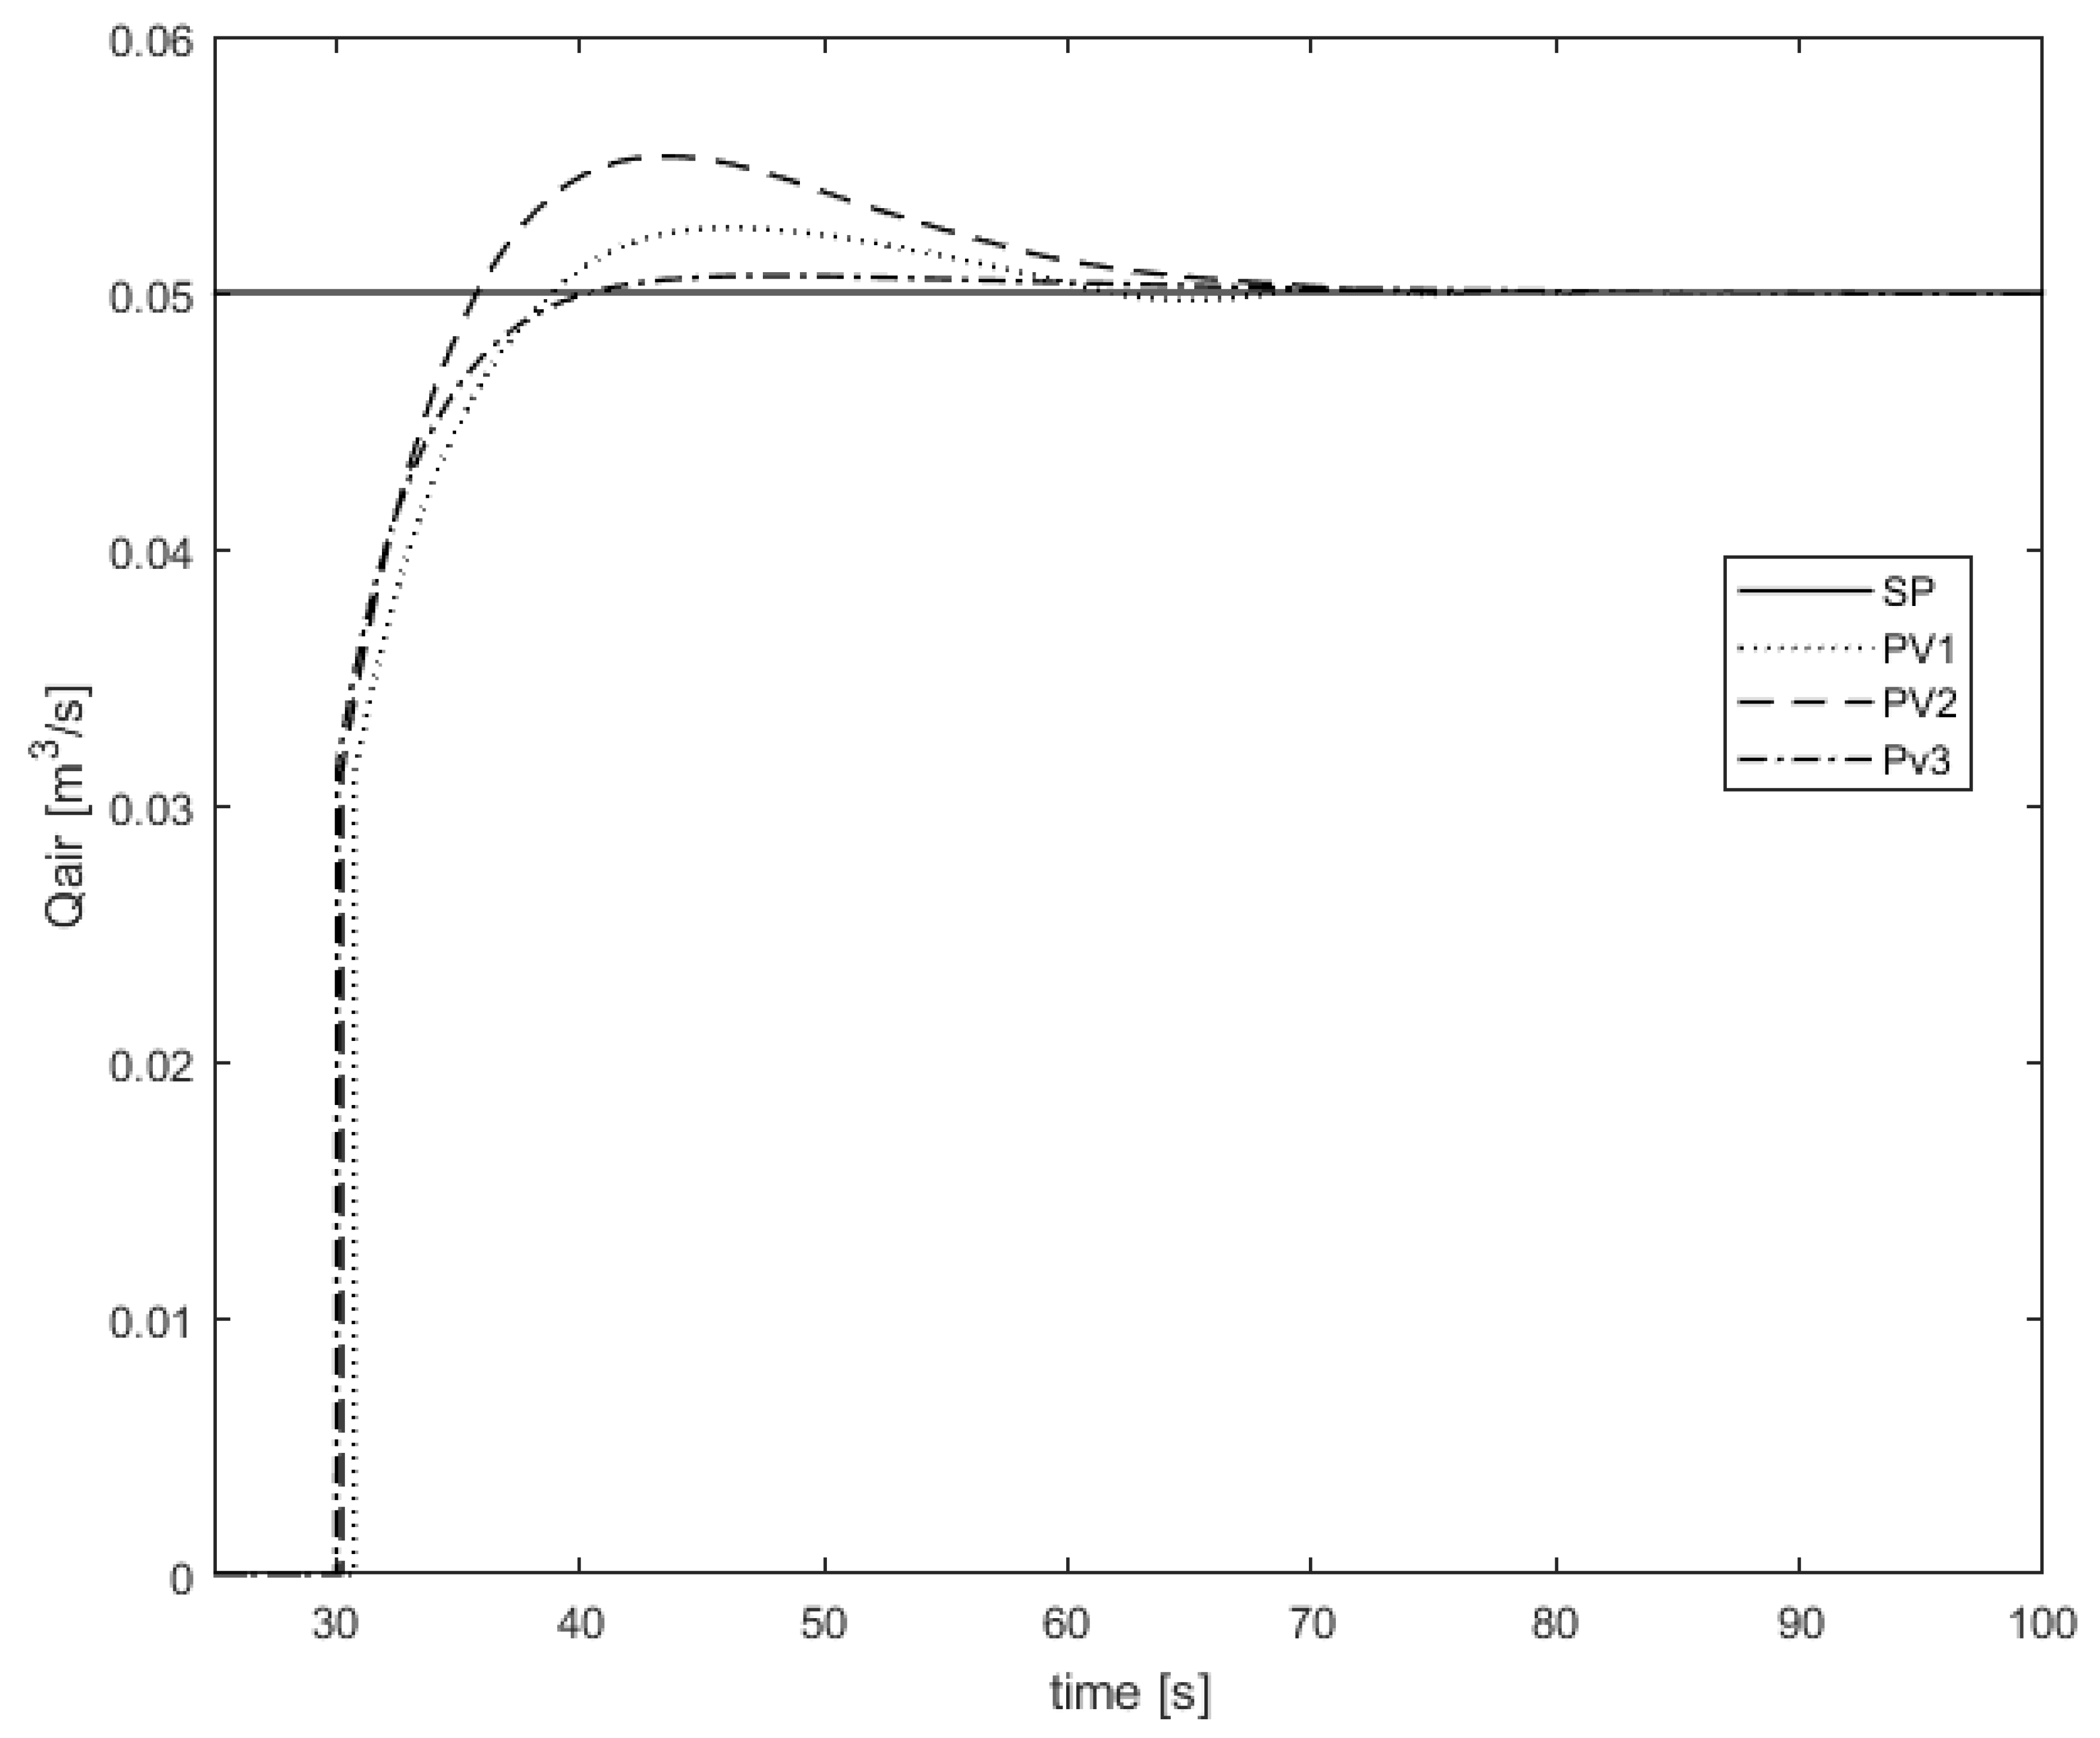
Simulation tests of the third version of the fuzzy controller were carried out. The results of the adjustment were considered to be satisfactory.
Figure 11 shows the step response of the final version of the control system, while
Figure 12 compares the step responses of different versions of fuzzy control systems. The improvement of the algorithm is very clearly visible.
5. Comparison of Control Results
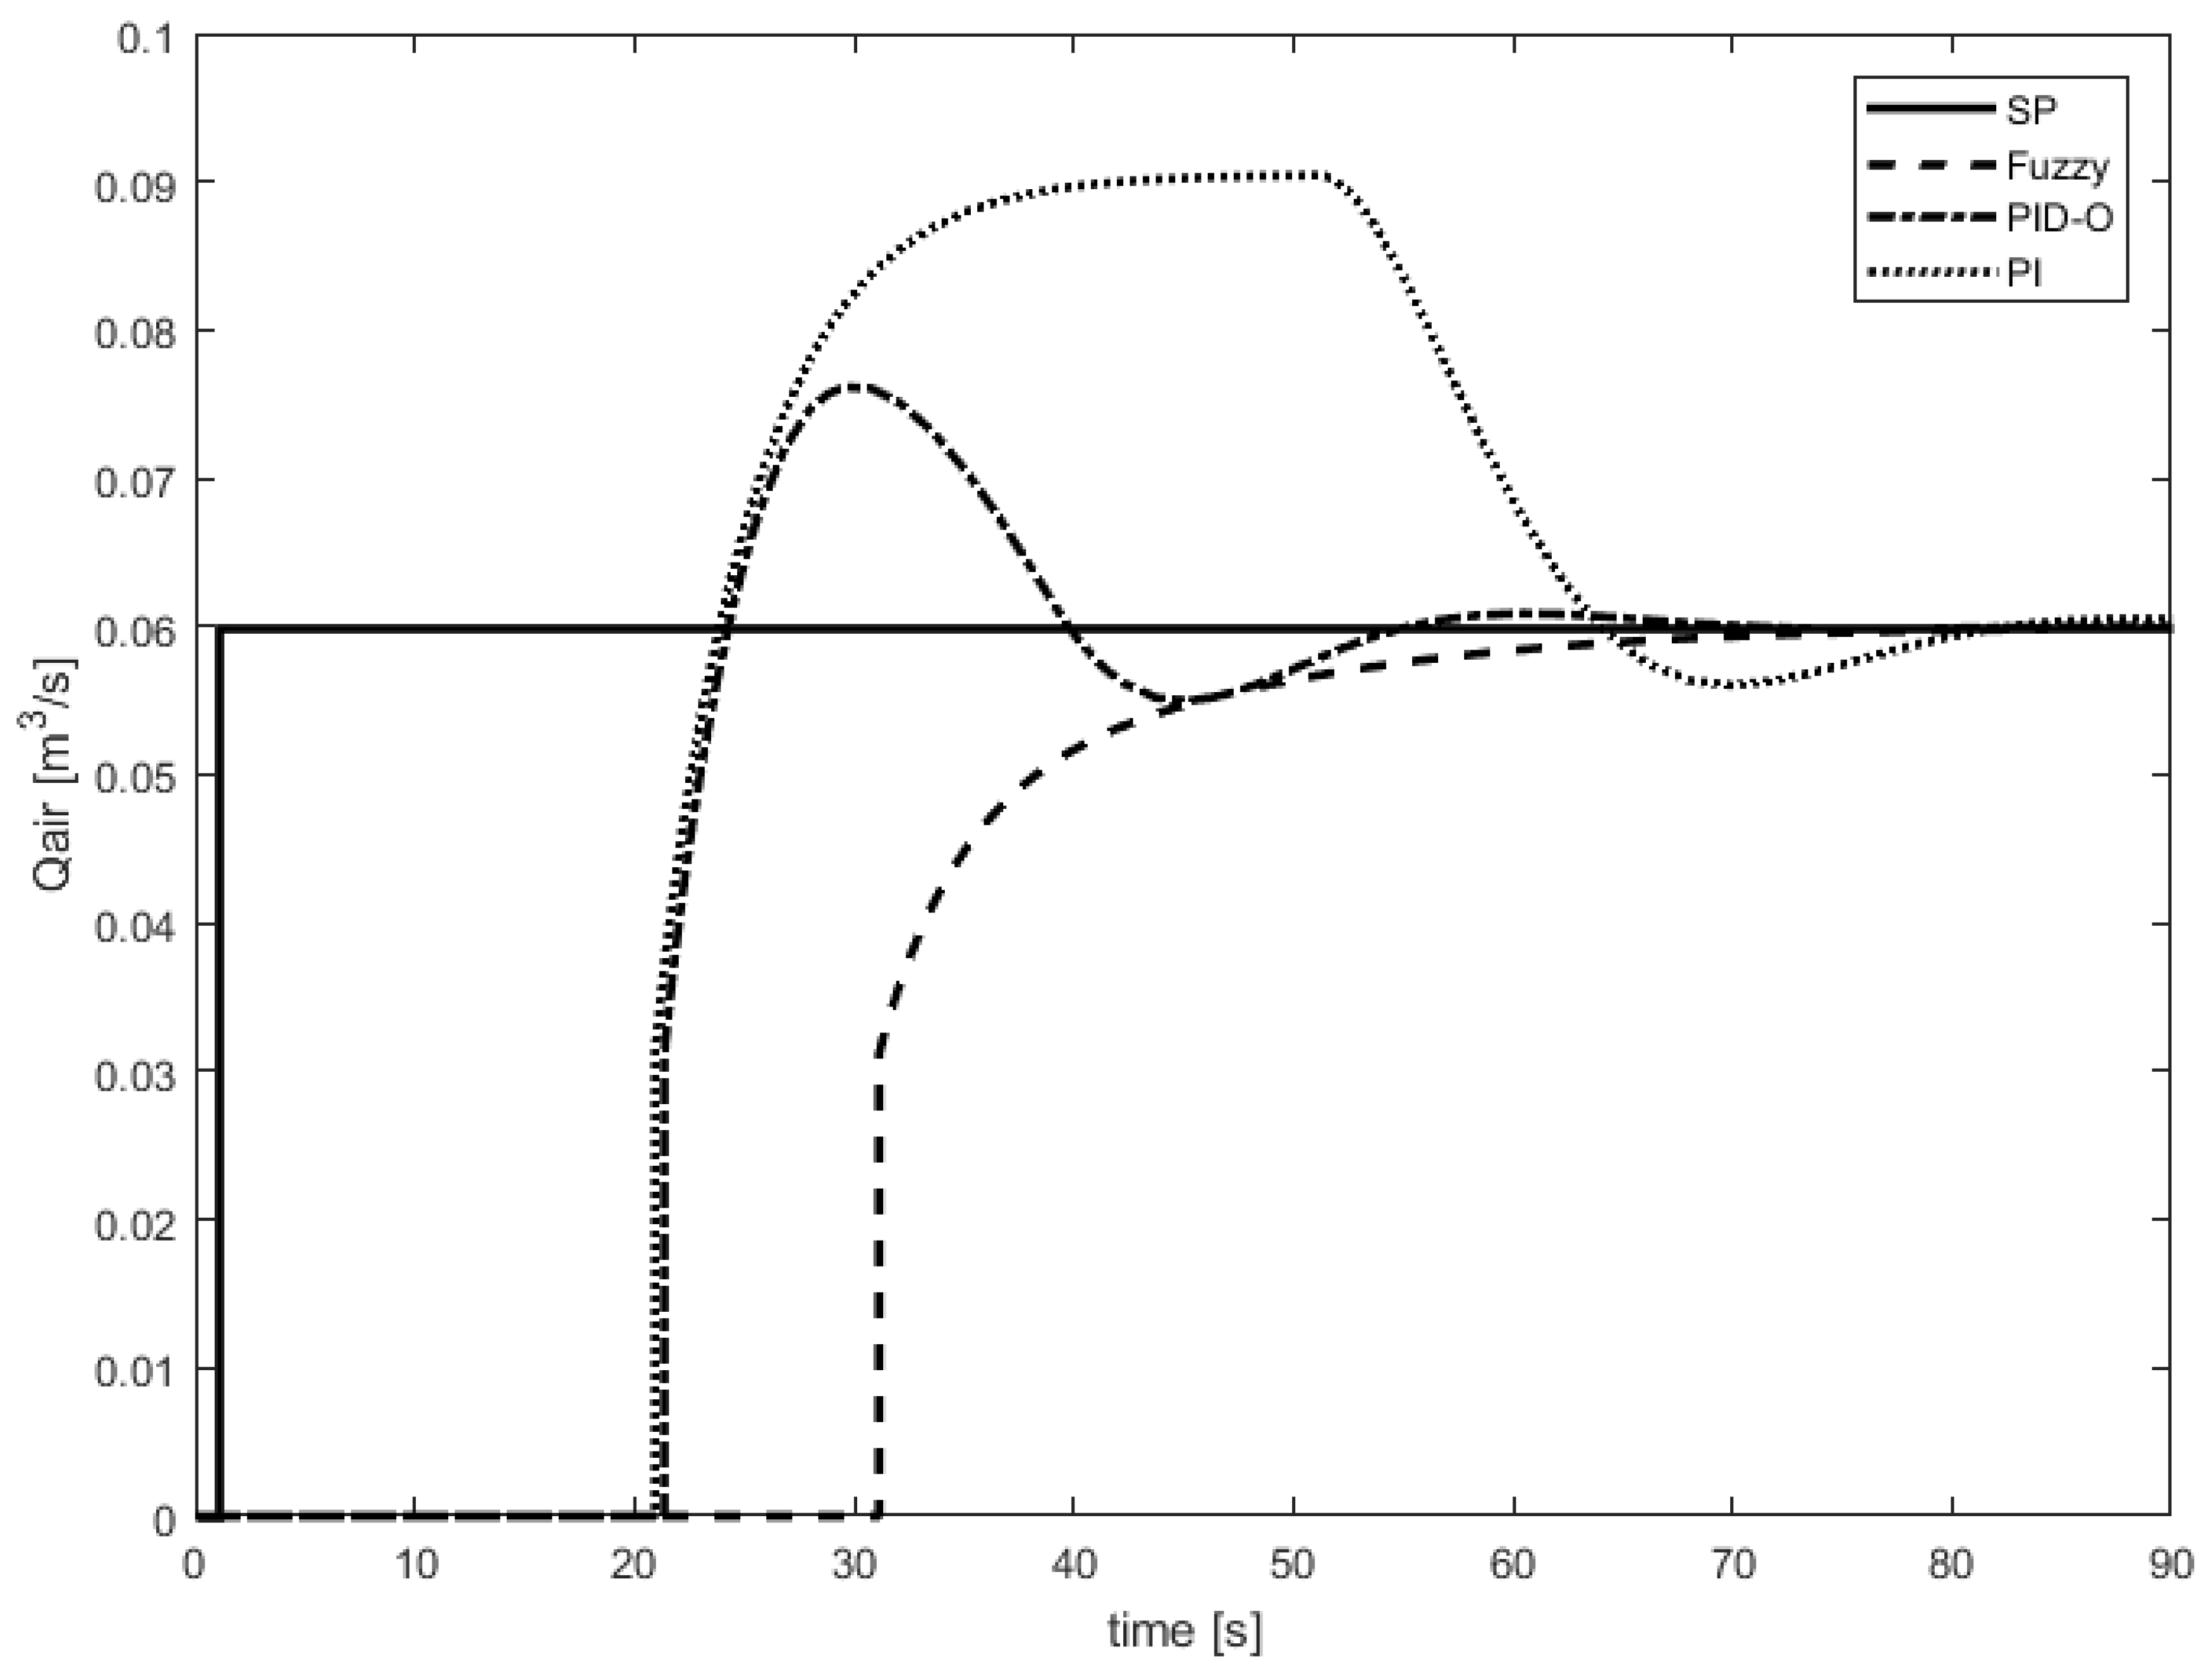
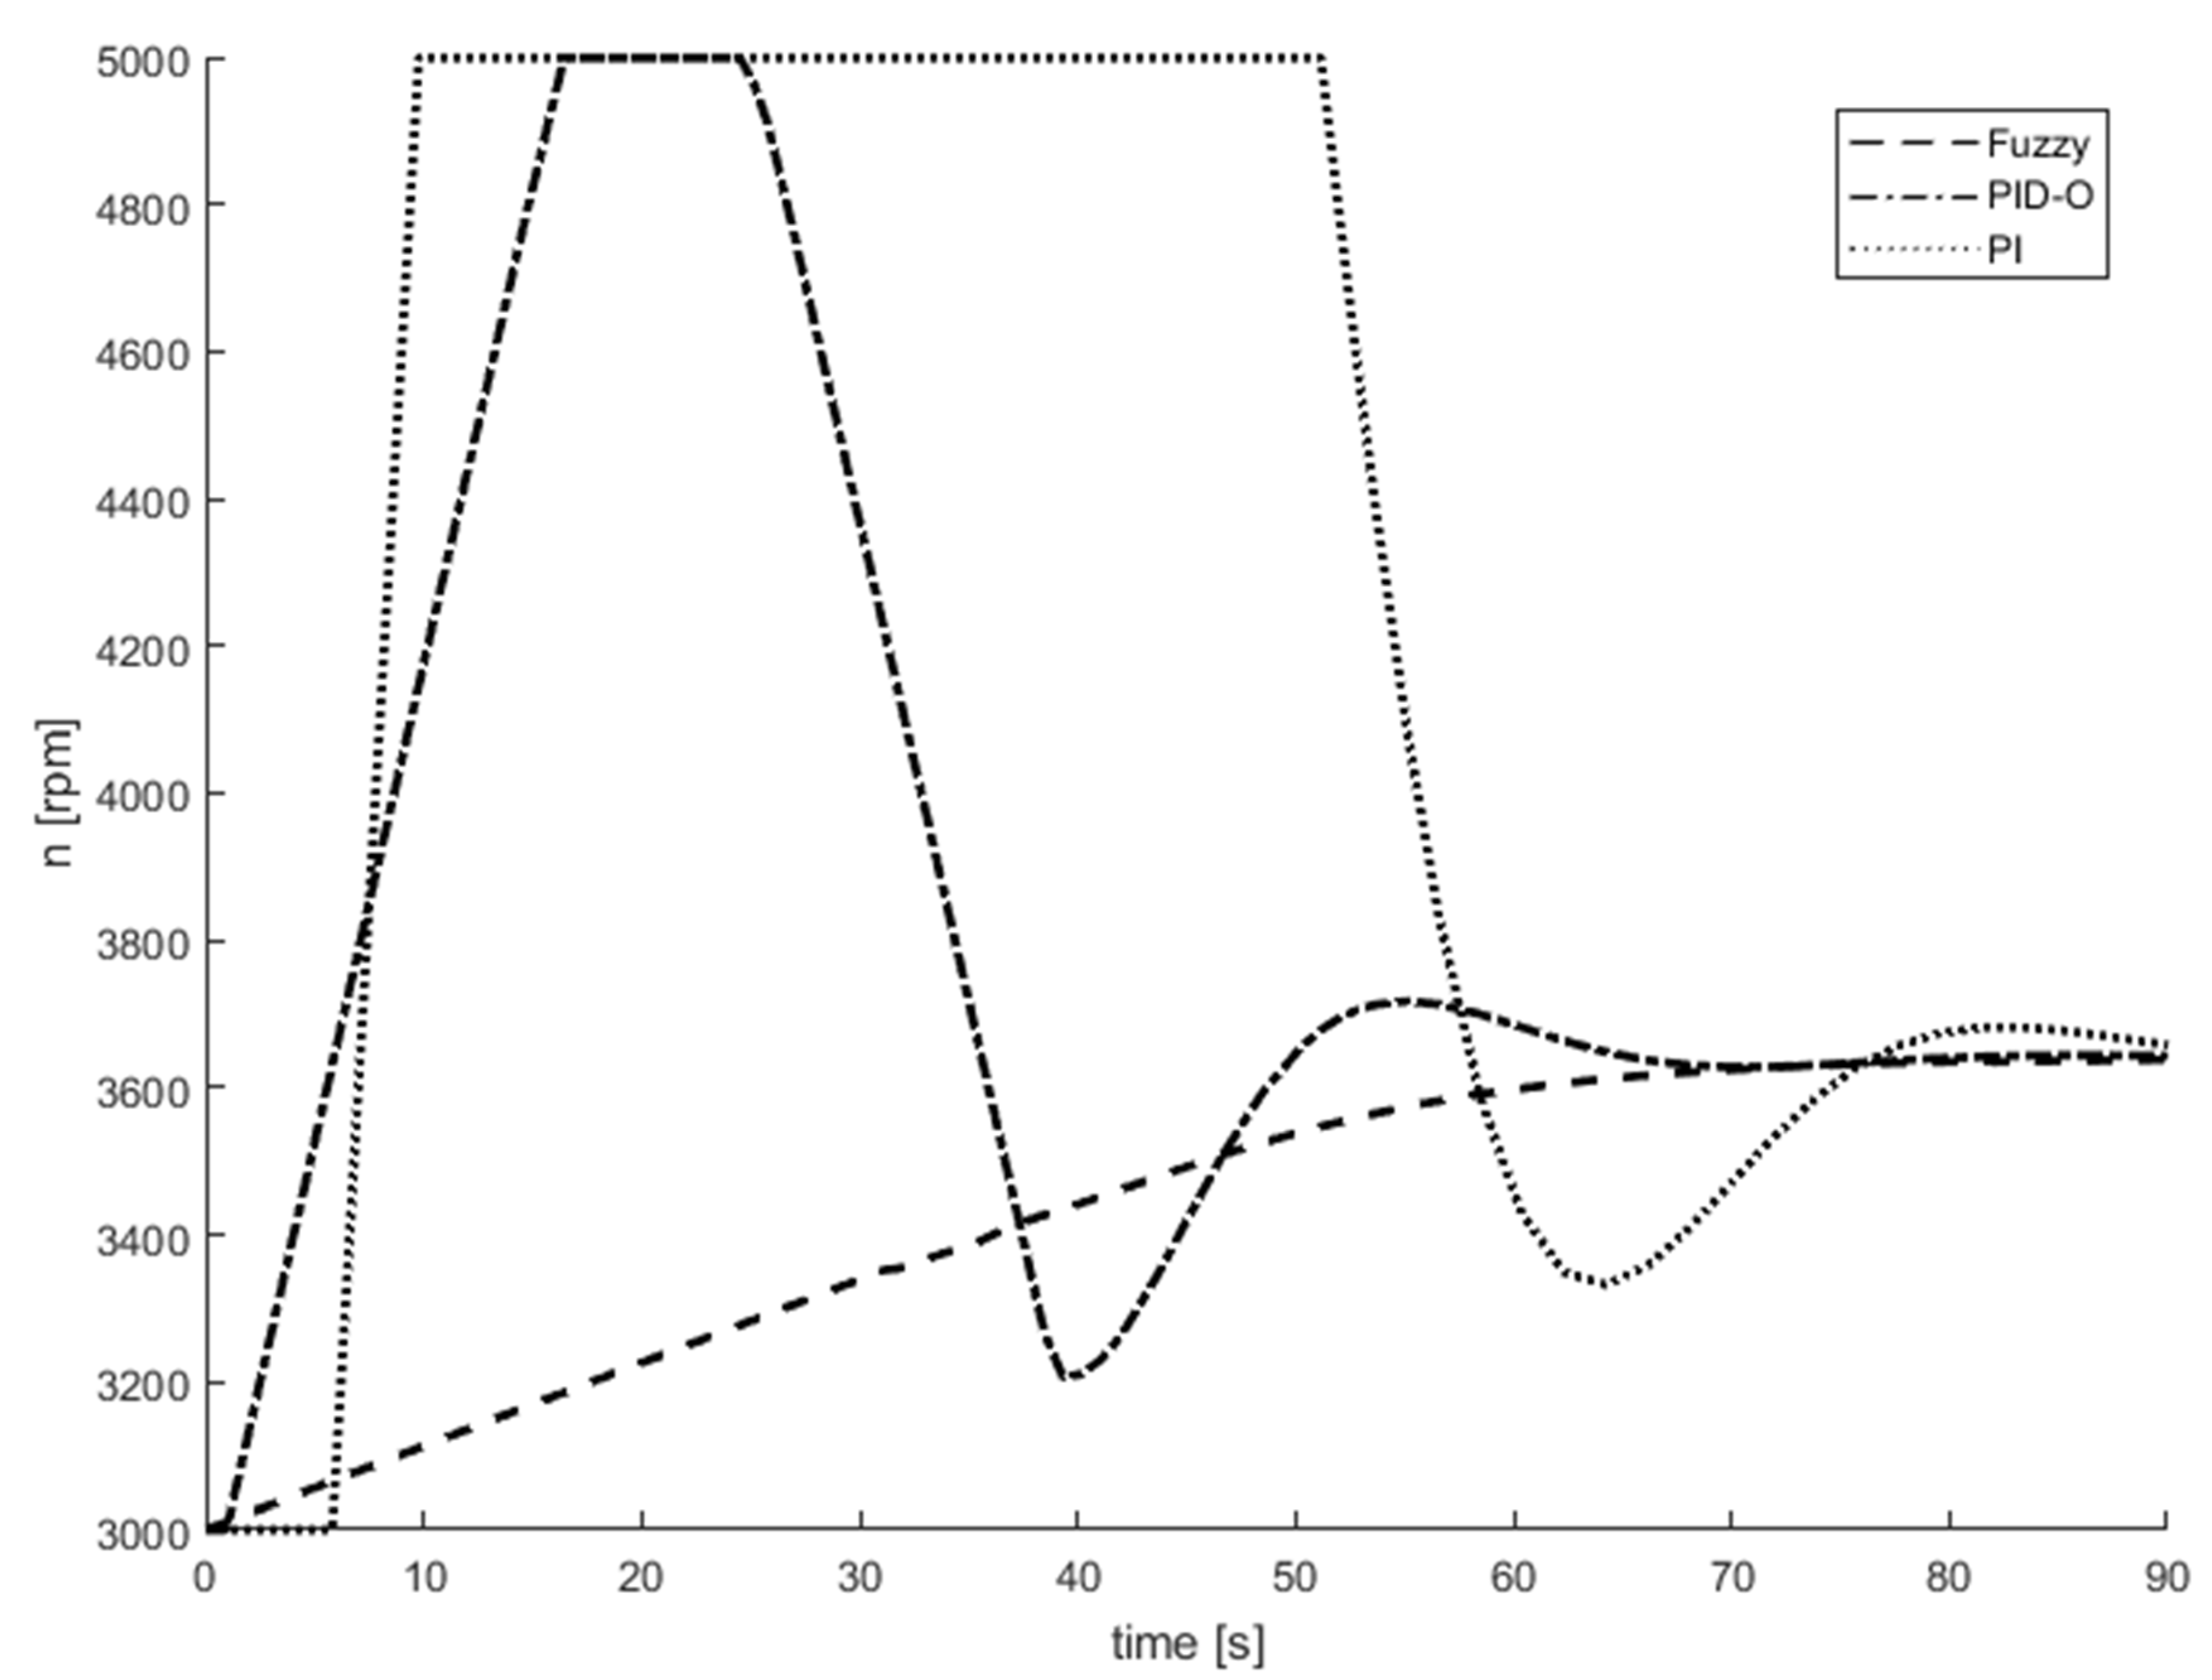
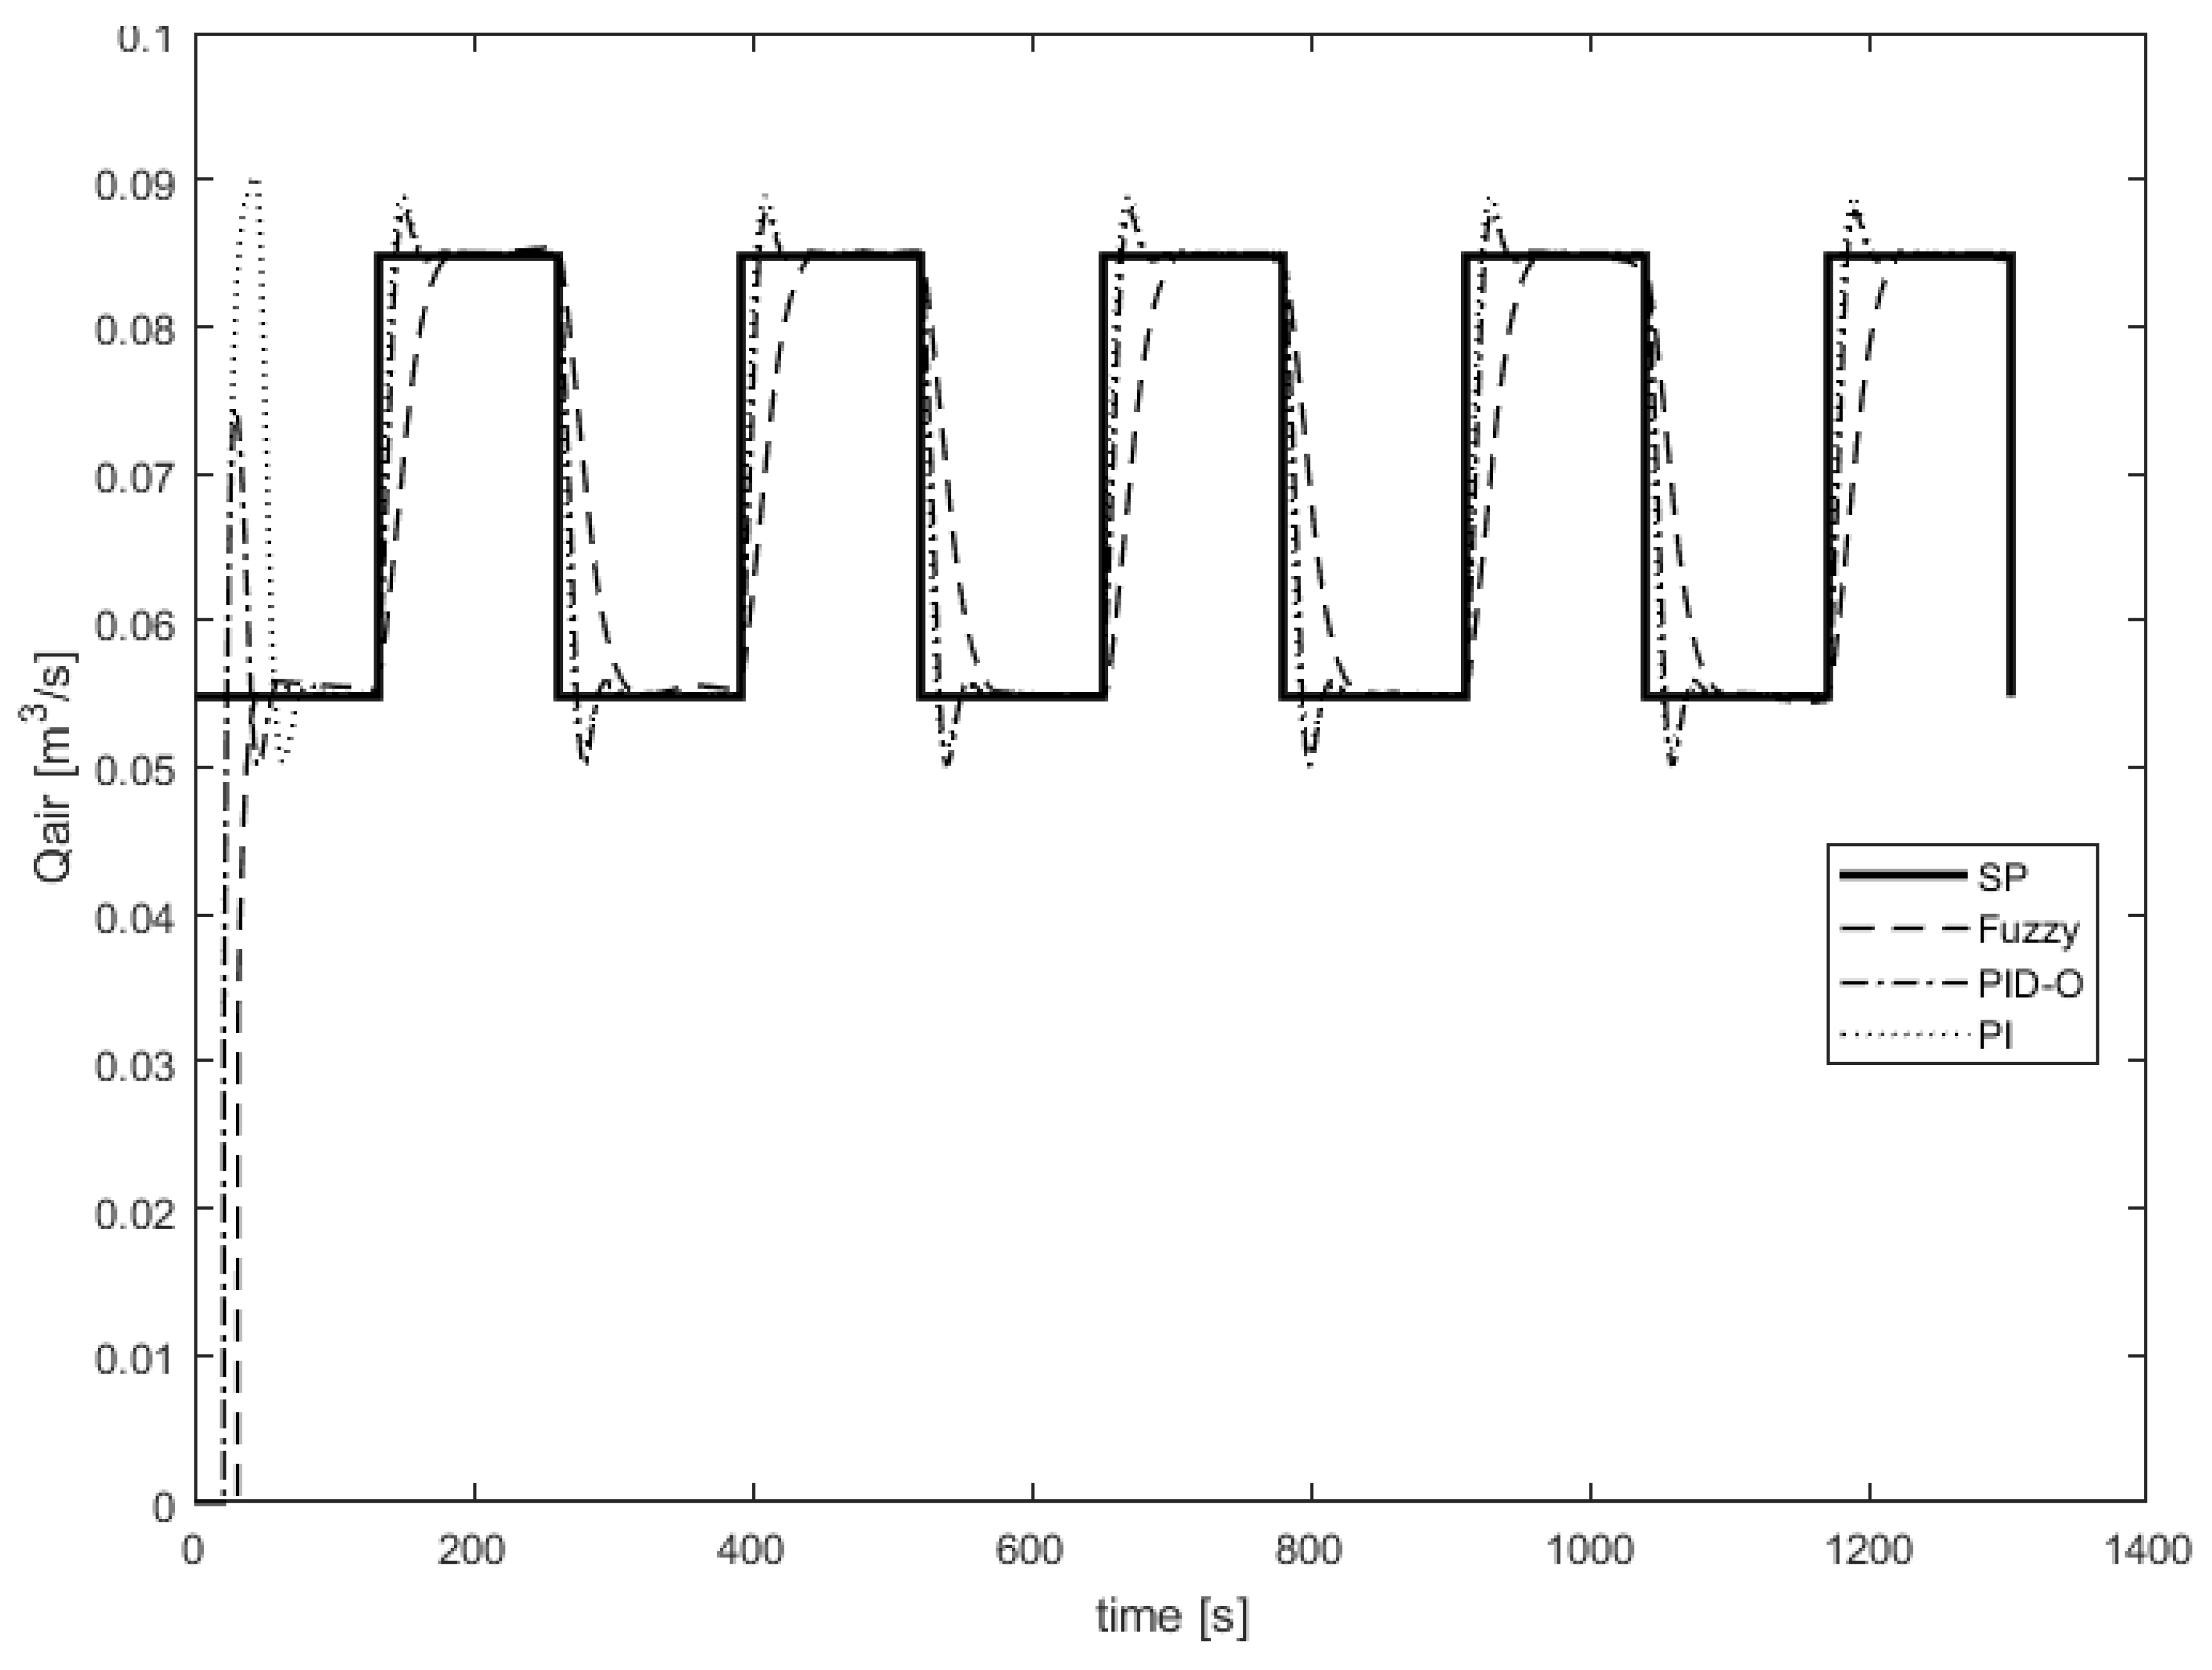
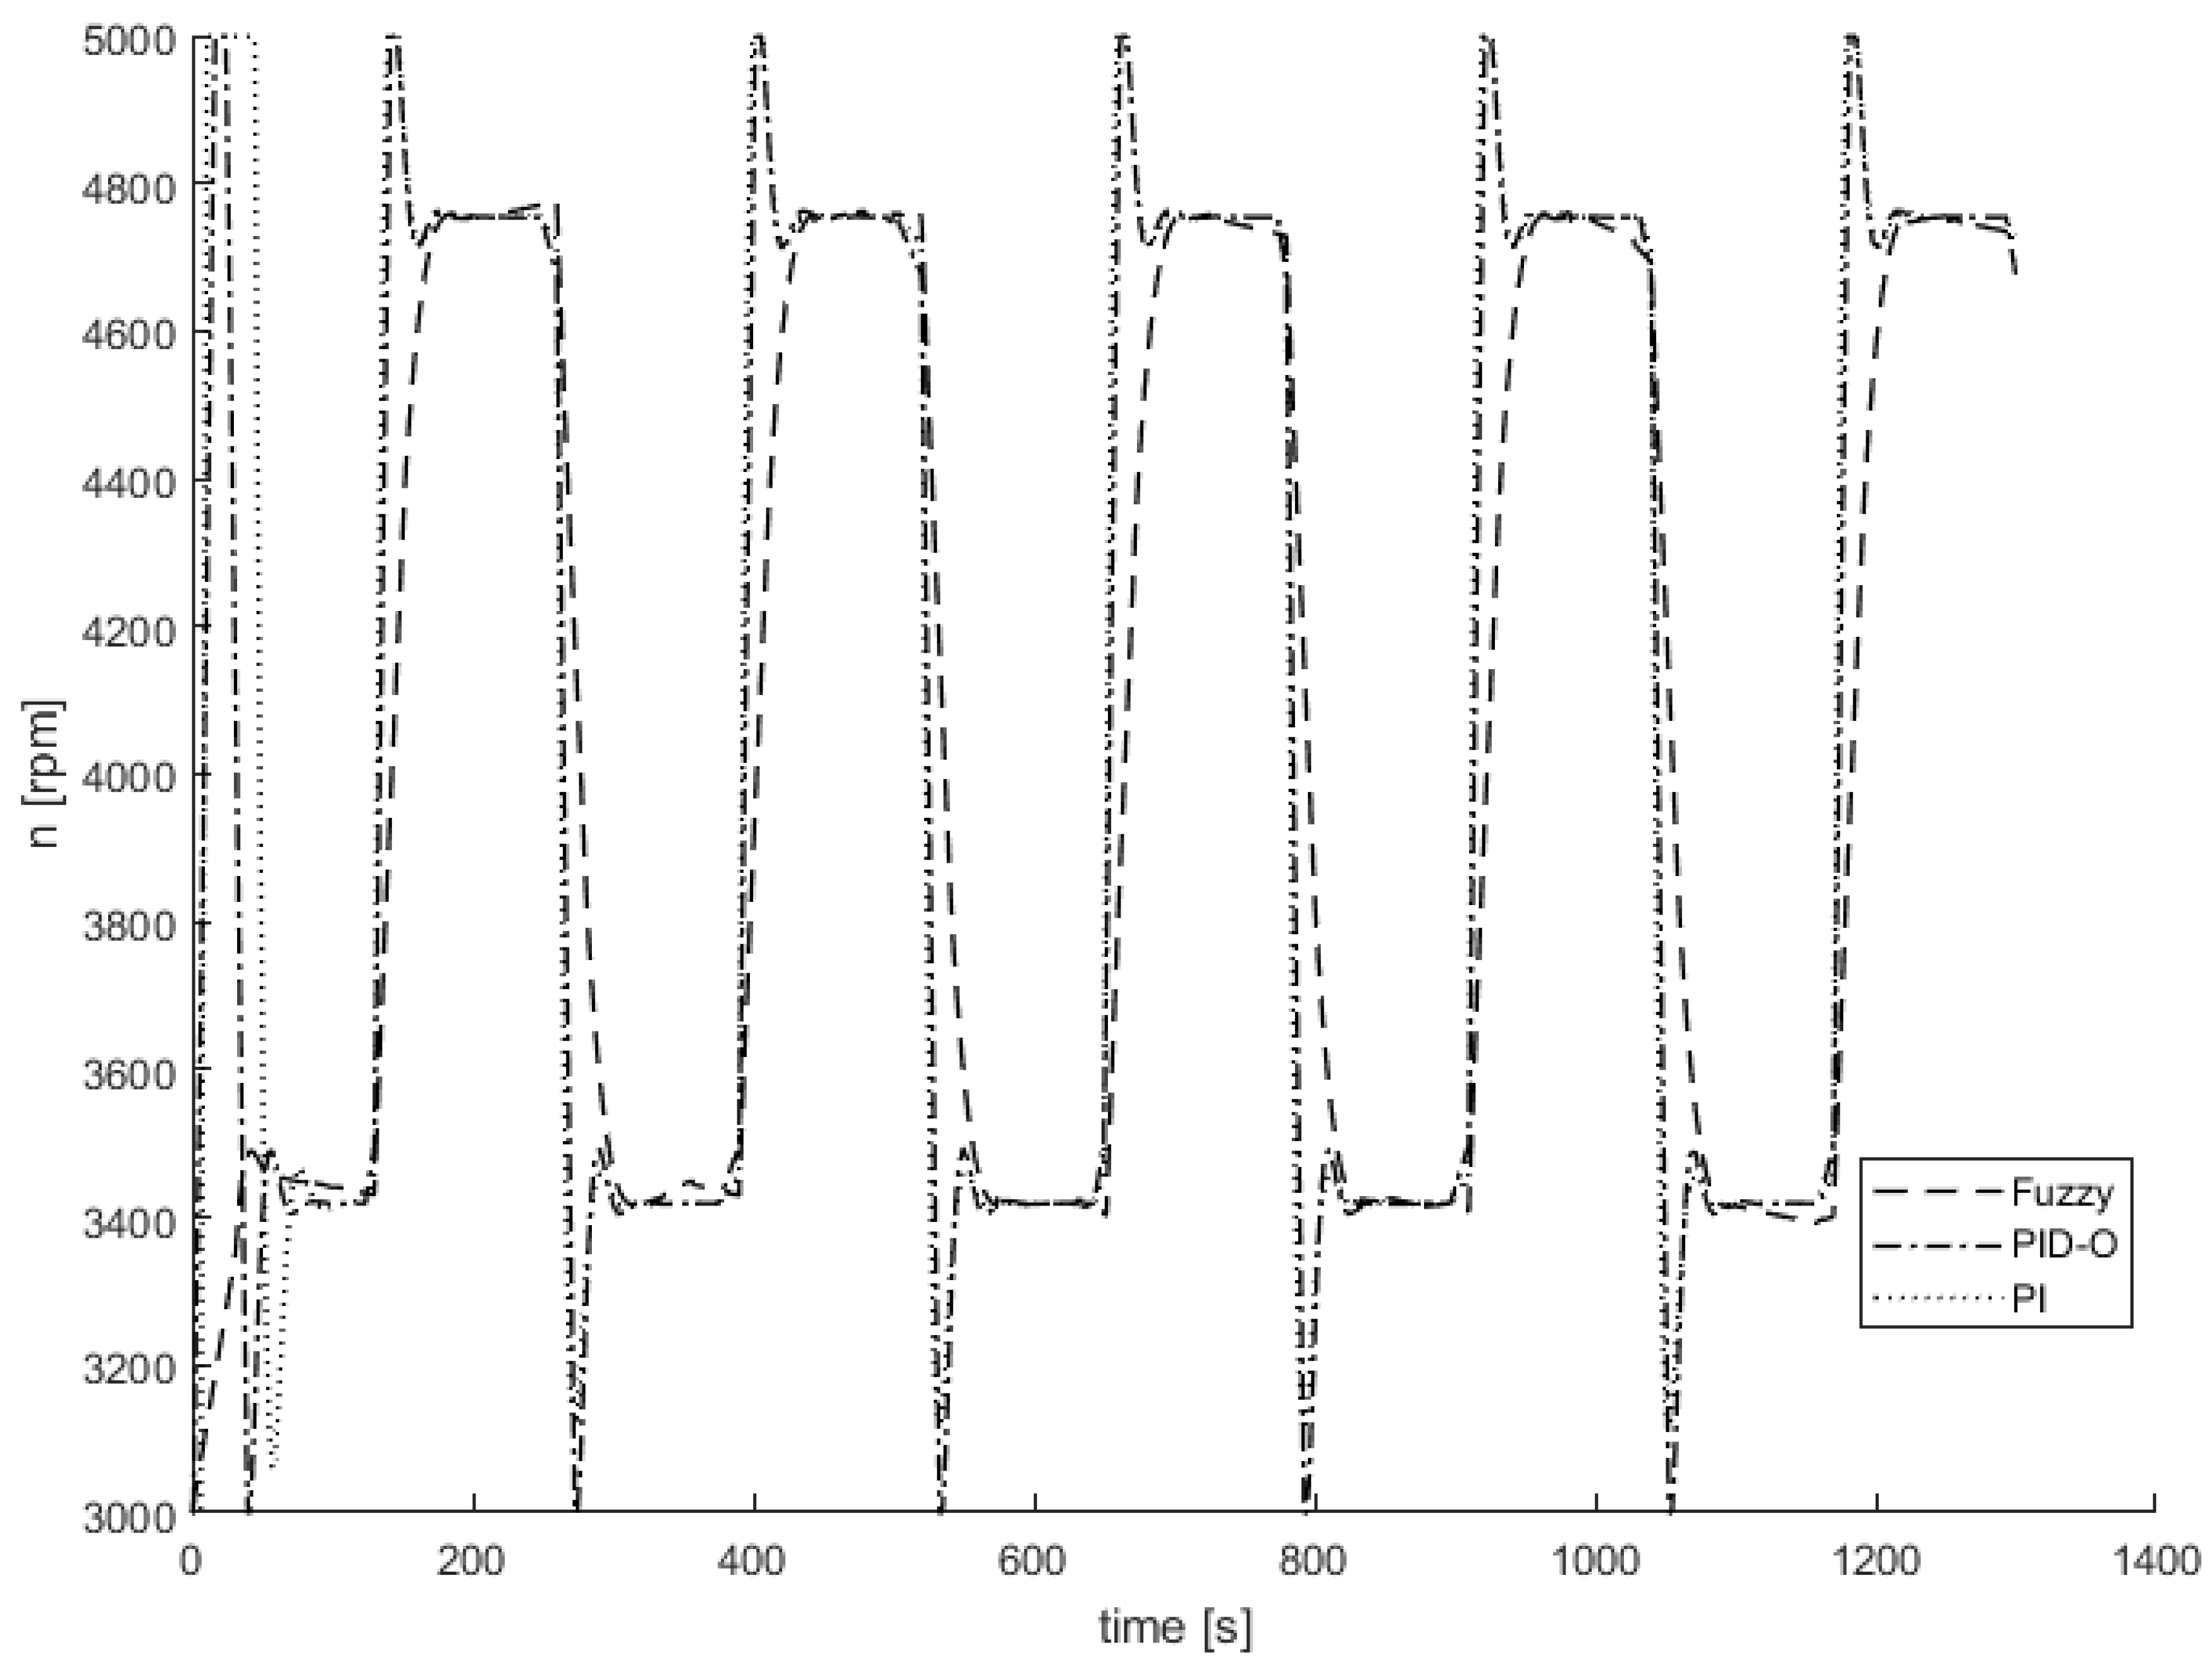
The controllers’ actions were simulated for a fixed set point, and for a sequence of setpoint changes. The control results are shown in
Figure 13,
Figure 14,
Figure 15 and
Figure 16. The PI controller with experimentally selected settings achieved the worst results (PI). The PID controller with anti-windup and the optimization of settings (PID-O) was the fastest to reach the set point (SP) and had less overshoot than the PI controller, but longer oscillations of the control signal were recorded in this case. The control system with fuzzy controller (Fuzzy) is characterized by the lack of overshoot and a smoothly rising control signal without oscillation. The time at which the fuzzy controller reaches the set value does not differ significantly from that of the remaining controllers.
The fuzzy controller has a slightly worse settling time than the PID-O algorithms, however, it achieves significant improvement in the context of the minimum energy criterion. For the 5% settling time criterion, the PID-O controller time is 49s, Fuzzy–53s and PID–73s. For the 2% settling time criterion, the PID-O controller time is 53s, Fuzzy–63s, PID–78s. The extended adjustment time of the fuzzy approach is associated with the minimum opening pressure of the diffusers taking a longer time. In summary, the proposed novel control system with fuzzy controller allows to: increase the efficiency, improve the quality of outflow, and reduce the cost of aeration, compared to the solutions currently applied in the case study plant.
6. Conclusions
SBR installations are widely used in WWTPs, due to their considerable operational flexibility. The operating costs of this purification method mainly depend on whether an adequate DO value is ensured or not. Therefore, for the proper operation of the WWTP, extensive technological knowledge of biochemical reactions taking place during the entire treatment process is required, along with a properly designed control system. The use of optimization methods or advanced control algorithms has a positive impact on the quality of the treated wastewater and economic conditions of the entire installation. Considering the operation of aeration systems, especially blowers, is of key importance at the stage of minimizing operating costs. The work of the fuzzy controller ensures, above all, a smooth characteristic of blower speed, which not only decreases the blower’s operating costs, but also slows down the wear of the device. The iterative design process presented in the article allowed for the implementation of a stable fuzzy controller, with an overshoot of less than 1%. The fuzzy controller has a slightly worse settling time than the PID-O algorithms, however, it achieves significant improvement in the context of the minimum energy criterion. The extended adjustment time of the fuzzy approach is associated with a longer achievement of the minimum opening pressure of the diffusers. The improvement of this aspect will be the goal of further research. The use of the dead band resulted in improved numerical stability, simultaneously maintaining a minimal impact on the steady-state offset value. The presented control algorithm can work in a cascade arrangement with a DO controller.
