Abstract
As electric vehicles (EVs) have been widely discussed as a promising way to mitigate the effect of climate change, various policies have been implemented across the world to promote the uptake of EVs. Policymakers also paid attention to the density of public charging points. In this paper, we examined the impact of policies on EV markets in the post subsidy era with multiple linear regression analysis using panel data on 13 countries from 2015 to 2018. Five of the independent variables showed significantly positive effects on the 1% level in different regression models: fast/slow charger density, mandate, purchasing restriction and waiver. Subsidies showed significance only on 5% level for battery electric vehicles (BEVs). Financial stimulates have experienced a declining marginal effect, whereas a high density of fast chargers has the most significantly positive effect on EV uptake. This paper suggests policymakers can invest more in completing the public infrastructures of EVs, especially on fast charging points.
1. Introduction
In order to lower greenhouse gas (GHG) emissions and to help achieve the goal of climate change mitigation, electric vehicle (EV) adoption has been discussed worldwide. Policies aiming to incentivize consumers have been widely adopted by governments in North America, Europe, and Asia. The effectiveness of policies to increase the market share of EVs has always been discussed in the literature.
We all know that the higher acquisition cost of electric vehicles compared to conventional vehicles is one of the important barriers to adoption, due to R&D investment and fixed asset investment of the car manufactures. For a new environment-friendly technology, the barriers also include the lack of knowledge for consumers and low consumer risk tolerance [1], leading to an inefficient allocation of goods and services, known as a market failure in economics. Thus, adopting policy incentives is reasonable to fix the market.
As for electric vehicles, policy incentives include financial incentives and non-financial incentives. Table 1 is adapted from reports of International Energy Agency (IEA), listing the existing policies in some selected countries in 2018/2019 [2]. Financial incentives consist of direct purchasing subsidy, registration/emission/tax fee exemption, etc., which are most widely used worldwide to lower the initial purchasing cost and cost in daily use. The authors of [3] studied financial and tax incentive policies in Norway based on a survey and found that tax exemptions were significant motivators for more than 80% of the respondents. Moreover, [4] concluded that the markets with high EV penetration, such as Norway, the Netherlands, and the State of California, were mainly attributed to supportive incentive policies. However, existing literatures have conflicting results regarding the effectiveness of financial incentives. The authors of [5] found that financial incentives were significantly correlated to EV uptake, whereas [6] showed a very weak correlation between purchase subsidies and consumers’ willingness to buy EVs. There are literatures show that repealing incentives may result in a sharp drop in sales. For example, the U.S. state Georgia experienced a drop in EV sales by over 80% after the state government repealed the tax credit [7] and [8] found that when subsidies and tax exemption for EVs are abrogated with no change to other policies, the market share of EVs will suffer a sharp fall by 42%. Thus, it is important to explore the crucial factors influencing EV adoption.

Table 1.
Electric vehicle (EV)-related policies in selected regions.
As substitutes and complements of financial incentives, non-financial incentives and public charging infrastructures also matter a lot to EV adoption. Non-financial incentive policies are designed for the convenience of EV users and vary across countries, such as free parking policy, toll tax exemption, highway lane excess, etc. The authors of [3] supported that convenience measures such as free parking are very effective for an increase in EV sales using stated preference (SP) data. Based on a large number of EV consumers, free access to bus lanes and exemption from toll taxes were the crucial factors for EV adoption. Furthermore, [9] attributed about 25% of California’s EV sales to high-occupancy vehicle (HOV) lane access policy. However, [10] demonstrated that access to bus lanes and road toll waivers are not statistically significant, whereas charging infrastructures are a strong predictor to EV adoption. The authors of [5] drew a similar conclusion regarding the relationship between the market share of electric vehicles and the number of charging stations per capita on national level.
Besides, government regulations are important factors to facilitate EV sales, targeting both consumers and automobile manufacturers, usually including setting goals for EV uptake, restricting the fuel used and mandating the EV production. A few examples of such regulations are GHG standards, a zero-emission vehicle mandate, and a low-carbon fuel standard. The authors of [11] revealed that corporate average fuel economy (CAFE) regulation could help promote the market penetration of EV, especially if executed along with other incentives. The authors of [12] studied dual-credit policy in China and found that the Corporate Average Fuel Consumption rules alone may stimulate more plug-in electric vehicle (PEV) sales than the dual-credit policy; however, the dual-credit policy could stimulate more battery electric vehicles (BEVs) in the market compared to other policy scenarios. Additionally, more economic benefits could be achievable for fleet owners once the carbon tax is introduced [13].
Battery electric vehicles (BEVs) operating solely on electricity are not the only alternative for the electrification of passenger cars. Plug-in hybrid electric vehicles (PHEV) running on both gasoline and electricity, usually with a lower cruising range, have the potential to replace fuel used with electricity and thus lower the impact on the environment, without compromising the range of the vehicle [14]. Since PHEVs do not suffer from range limitation, they bring higher flexibility for drivers and can be well suited for diversified driving needs. For which type of EVs to become a major option on the private car market, the total economics of the EV type would presumably have to be favorable compared to the alternatives, since the currently dominant battery technology (Li-ion) is still relatively expensive. Earlier studies have commonly focused on total battery cost and some recent studies have discussed the marginal cost and its effect on cost-effective battery sizing. For example, [15] found the battery range has a small impact on the total cost of ownership (TCO) for PHEVs, while [16] concluded that short-range PHEVs would reduce more gasoline consumption than PHEVs with a larger range. These different characteristics caused different market shares for EVs and PHEVs even in the same country. It will be interesting to study the effects of incentives on BEVs and PHEVs separately.
The trend of the relevant studies in recent five years is summarized in Table 2, adapted from a review by [13], selecting researches in field of Business Management and policy, as well as the field of Transportation and Environment science together. The adoption of electric vehicles is most frequently discussed in the USA and China, since the they have the largest EV markets. Studies in the USA are the most over the years, while studies based on other countries have been increasing, with China being the second, especially from 2017 onwards. The more prominent research design used in literature is a quantitative method compared to a qualitative method. Survey-based methodology is the most predominant method used for EV adoption, followed by simulation, optimization techniques, and secondary data analysis. Most cross-country studies used survey-based analysis and secondary data analysis, which indicates that heterogeneity, causality, and locational disparity are important indicators in the area [17]. Noticeably, the stated preference (SP) data of consumers may be subjective and are usually not be in accordance with reality [8]; thus, quantitative research using fact analysis may be preferred.
Table 2.
Trend of the relevant studies in recent years 1 [13].
Though plenty of researchers have done a considerable amount of work on EV-related policies, few papers have discussed the diminishing effect of subsidies for EVs using quantitative analysis on cross-country data. This scenario is also well known as the post subsidy era, referring to the stage when subsidies retreat and have less impact on consumers’ purchasing decisions. This paper focuses on this recent subtle change of subsidies and fills the gap by using multiple linear regression and panel data on 13 countries from 2015 to 2018 to examine the impact of policies and infrastructures on electric vehicle market.
The rest of the paper is organized as follows. Section 2 gives the descriptive statistics of the data in 13 countries and introduces the methodology. Section 3 demonstrates the impact of the policy incentives and infrastructures on EV uptake, and explanations for the findings are given in this section. Section 4 draws conclusions and provides policy implications.
2. Data and Methods
2.1. Data Description
EV market share and sales data were collected from International Energy Agency [2], containing 13 countries over 4 years (2015–2018). These countries are Canada, China, France, Germany, India, Japan, Korea, the Netherlands, Norway, Portugal, Sweden, the United Kingdom and the United States. Electric vehicles in the 13 countries accounted for over 90% worldwide in recent years. The macroeconomic data were collected from the website of World Bank. Details of variables and data sources are provided in Appendix A.
Policies we selected in the paper are considered as important ones to EV adoption or have conflicting results in related literatures. All these countries mentioned above are adopting targeted zero emission vehicle (ZEV) regulations and incentives to accelerate the rate of deployment. Mandate and purchasing restriction are dummy variables, indicating whether it is implemented. The other non-financial policies are categorical variables evaluated by policy intensity. The wider the policy is applied in the country, the higher the scores it gets. Details about how we quantify the effect of non-financial policies by assigning different values are provided in Appendix B.
Table 3 provides the financial and non-financial policies we have considered in our model. Fuel standard is the level of fuel standards/regulations drivers need to meet and has been raised over the years to meet air quality standards and greenhouse gas emission reduction goals. ZEV (Zero emission vehicle) mandates on manufacturers can also result in increased model availability in the market. Insufficient model options can deter consumers from purchasing EVs even after adequate emphasis on consumer incentives and charging infrastructures.
Table 3.
Financial and non-financial variables.
Among the non-financial policy incentives, the variable target evaluates the governments’ ambition to promote EVs. Different countries released a different target year to ban internal combustion engine (ICE) sales and achieve 100% ZEV sales. For example, Norway took the lead and promised to replace all fuel cars by 2025 [18], followed by some other European countries, such as Denmark and Iceland, announcing 100% ZEV by 2030. The Netherlands and the UK promised to replace all traditional vehicles later than 2040. The earlier the 100% ZEV target year is, the higher scores the variable target will get. We expected a positive relationship between the goal and EV uptake. [19] has highlighted the importance of policy goals in the UK and Germany to decrease GHG emissions; however, [20] found that the EV climate mitigation strategy was not effective in the United Kingdom. Despite the conflicting conclusions, the policy goal will be considered and tested in our model.
For better accuracy, after using dummy variables to describe the policies, we collected numerical dollar values to describe the purchasing incentives (usually are tax credits or purchasing subsidies). The numerical incentives are used in the extended analysis part where BEVs and PHEVs are discussed, respectively. BEVs, which totally use electricity were able to receive higher subsidies because the level of subsidies was usually decided by battery capacity across the countries. In this study, we assigned the highest level of money (tax credits or subsidies) a passenger vehicle can receive from the central government to the variable subsidy. Though we did not use median or average values because of data unavailability, the maximum value can still reflect the intensity of the subsidy, since both manufacturers and consumers will strive for the maximum subsidy. It is also a reason that a government giving a higher upper limit for subsidy standard, tends to provide a higher medium level of subsidies, that is to say, the maximum value of standard should be highly related to the average subsidy consumers get. Furthermore, we used linear regression for analysis; thus, we care much more about the relative relationship between countries and the difference between years, than the absolute value of subsidies. Thus, using the highest level of subsidy standard is reasonable. Besides, the subsidy itself is based on many parameters, and each country or even each province has different standards. For a global scope research involving 13 countries and 4 years, it is too complicated to refine and calculate subsidies and we only divided it into two categories: BEV and PHEV subsidies, which are considered as two variables and will be applied to BEV and PHEV sales, respectively.
For BEVs, Korea and China offered the highest subsidy in Asia. The subsidy in Korea was up to 10,900 dollars and was the highest of all countries over the years, although the standard of getting total subsidy was not easy to meet. China offered a subsidy up to 8900 dollars before 2018, slightly higher than the federal tax credits (USD 7500) in the United States. Norway was the most generous country in Europe to subsidize the promotion of electric vehicles with the highest level of 10,300 dollars over the 4 years. Except for France and Sweden, the other European countries, such as Germany and Portugal, gave lower than average subsidies (USD 6000) to EV consumers. Among all the countries listed in our study, India gave the least subsidies of up to 2000 dollars for BEVs, lower than Portugal (USD 2400), which ranked the second last.
For PHEVs, subsidies were much lower. The UK with USD 7100 subsidies ranked first and Norway with USD 7000 ranked second. Though Korea offered the highest subsidy for BEVs, PHEVs could only get the maximum of USD 860 dollars. When BEVs and PHEVs are considered as a whole, we used the weighted average of subsidies by the sales volume. Appendix B shows the value of some non-financial policy and numerical variables, such as subsidies and charger density, in 2018.
Table 4 below is the summary statistics, which contains the characteristics of all variables. The variables fast/slow chargers per million population means the number of chargers per million people in the country, which can also be presented by chargers’ density. EV share is the proportion of electric vehicle sales in total vehicle sales. We implemented a logit transformation to normalize the distribution of EV share because the data are skewed to the right [21]. After the transformation, the data showed a normal distribution and validated the ordinary least squares (OLS) regression we plan to use. This is one of the necessary conditions for a good estimation result, not a sufficient condition. OLS regression also needs to satisfy the assumptions of homoscedasticity of the error term, no multicollinearity, etc. We have tested them below in the study and all results are satisfactory. To solve traffic congestion and air pollution problem, China adopts administrative orders to control the supply of vehicle licenses, while the restrictions is not applicable for EVs [22]. To identify this effect, the variable purchasing restriction is considered in the pooled regression in the basic results part.
Table 4.
Summary statistics.
In Table 5, correlation coefficients are provided. Between a pair of independent variables, the correlation between slow chargers and fast chargers shows the largest cross-correlation coefficient of 0.804. Thus, there should be no severe linear correlations during regressions.
Table 5.
Correlation coefficients of variables.
For an overview of the electric vehicle markets, we used cross-sectional data in 2018 to draw a worldwide map of the sales and market share of EVs as shown in Figure 1. Though both crediting to the governments’ effort in promotion, market shares and sales give different information on the countries’ EV market. EV sales is more related to the market volume given that China and United States made remarkable achievements, while market shares showed the overall recognition of the citizens for EVs; thus, European countries showed higher EV share, especially Norway, the highest of all. Later in the basic result part, we will interpret the difference with statistical models.
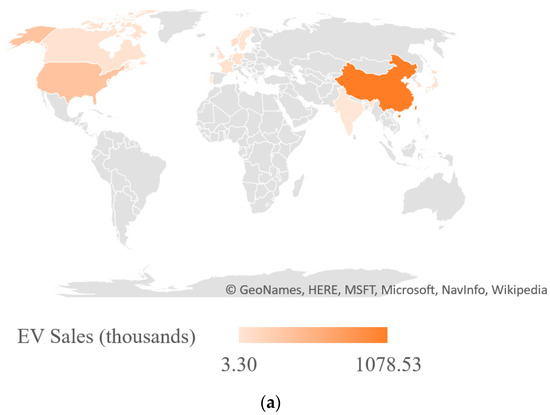
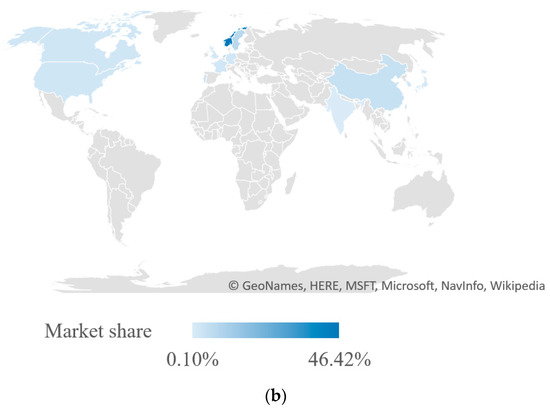
Figure 1.
EV sales and market share worldwide overview. (a) EV sales in 2018; (b) market share of EVs in 2018.
2.2. Model
We used panel data regression to analyze EV uptake to reduce time-invariant heterogeneity resulting from some unobservable variables that affect the EV market share in different countries. The multiple linear regression model with panel data is shown as follows:
where subscripts i and t represent the i-th country and the t-th year, respectively. The dependent variable is represent a logit transformation of for country i in year t. represents the EV share or EV sales, respectively, in two different regressions. is the fixed effects for individual countries and is the time fixed effects. Using this model, we evaluated the effectiveness of policies and charging infrastructures with macroeconomic factors controlled. To reduce the level of heteroscedasticity, some variables are taken natural logarithm along with EV shares [23].
Moreover, a simplified model of this is used in the basic results part for a pooled regression to look at the effectiveness of different policies and other influential factors, shown in Equation (2):
The pooled regression model is one type of model that has constant coefficients, referring to both intercepts and slopes. For this model, we can pool all of the data and run an ordinary least squares regression model without considering difference across countries and years.
Two types of models are usually considered for panel data regressions: the fixed effects and random effects model, different in dealing with endogeneity. Before deciding on the best regression method, we first have to figure out if our predictor variables are endogenous. The Hausman specification test was used to detect endogenous regressors in a regression model [24,25]. Details of the tests will be provided in the result part.
Besides, we used two statistical tests for our data and model in Section 3: the White test [26] (verifying the data conforming to the OLS homoscedasticity assumption) and the variance inflation factor test [27] (making sure that there is no multicollinearity problem in the pooled model). The tests showed that our data meet the requirements/assumptions of OLS regression.
For further analysis, we implemented the vector autoregression (VAR) model as an alternative method, in order to take time lag into consideration. Ordinarily, regressions reflect “mere” correlations, but [28] argued that causality in economics could be tested for by measuring the ability to predict the future values of a time series using prior values of another time series. The VAR model proposed by [29] is used to capture the linear interdependencies among multiple time series, with the lagged values of all endogenous variables to estimate the reverse impact of them [30]. Moreover, it allows us to consider both long-run and short-run restrictions justified by economic considerations [31]. Consequently, the VAR model can be used to capture the dynamic impacts of the influencing factors on EV sales. The mathematical expression of the general VAR model is given as follows:
where the observation (i periods back) is called the i-th lag of y, is a vector of constants (intercepts), is a time-invariant matrix and is a vector of error terms. In this paper, we used one period lag for VAR, which is i equals to 1, and we explored the relationship between subsidies, infrastructures and EV sales as three variables. We showed the results of Granger causality test, which is a statistical hypothesis test for determining whether one time series is useful in forecasting another, first proposed in 1969 and widely used for explaining the results of VAR models [28].
3. Results and Discussion
3.1. Descriptive Results
For further analysis of governments’ effect on EV uptake, we drew pictures of the relationship between EV uptake and policy incentives in the 13 countries and then showed the correlation between EV uptake and the density of public charging infrastructures. The aim of the descriptive analysis here is to provide a vivid understanding of the effectiveness of the variables before we used econometric models; however, they are probably not accurate and pervasive enough because of the existence of other influential factors which will be eliminated to a large extent in further discussion.
Figure 2 shows the correlation between policy incentives and the market share in the countries in 2018. The bars refer to the value of incentives and the red triangles represent the level of market share. EV market share in European countries are usually higher than in other countries. Norway had the highest level of EV uptake in the 13 countries, up to about 46% with highest policy incentives value; however, the relationship between uptake and policies is not always right for other countries. Korea and the U.S. had nearly the same scores for policy incentives as Norway; however, the uptake was not as good. Some European countries may not perform outstandingly in policies while the EV uptake was a lot higher than average. Overall, the descriptive analysis shows a relatively weak dependence between policy incentives and EV uptake.
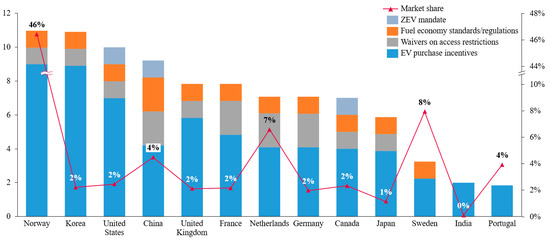
Figure 2.
EV market share and policy incentives in 2018.
The relationship between market share and density of public chargers is depicted in Figure 3 and Figure 4. The vertical axis and horizontal are the numbers of fast chargers and slow chargers per million population, respectively. The size of the bubble represents market share for the particular country. Norway performs best in both the density of fast and slow chargers. The Netherlands has a higher level in slow chargers than fast chargers. In China, fast chargers are developing relatively faster in China than slow chargers. Overall, it is consistent with the assumption that the larger the bubble size, the higher the country ranks in both axes.
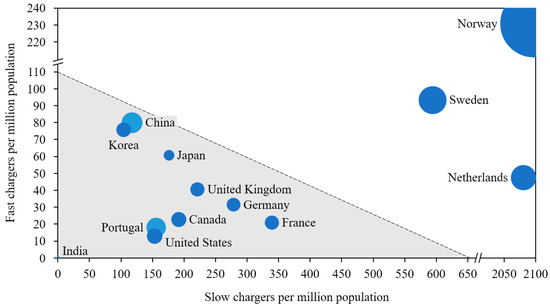
Figure 3.
Market share and numbers of slow and fast chargers per million population in 2018.
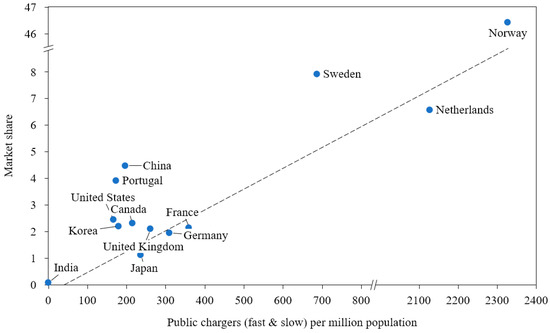
Figure 4.
Market share and numbers of all public chargers per million population in 2018.
3.2. Basic Results
We conducted a simple pooled regression model of all the countries over the years to describe the effectiveness of different policies and other influential factors. After performing the White test, we verified that the data conform to the OLS homoscedasticity assumption, that is, the variance of the errors in the regression models is constant, which means that the model was well defined. Due to the relatively large number of explanatory variables, in order to assess the possible effects of multicollinearity, the model was tested for variance inflation factor (VIF) [27]. The results are shown in Table 6. The maximum value of the variance expansion factor is 5.12 and the average value is 2.54, all less than the commonly used threshold of 10. Thus, it can be considered that there is no multicollinearity problem in the pooled model.
Table 6.
Results of variance inflation factor.
Using market share along with sales volume can partly eliminate the interference of external macro factors, such as income growth and economic growth [22]. We still controlled two macro factors in our regression model in order to measure the impact of macro factors. In the regression with EV share as dependent variable (the left column in Table 7), only slow-charger density was positively significant while in the regression of EV sales, mandate, waiver, fast-charger density and purchasing restriction policies showed a significant positive impact. The significant variables vary a lot if changing the dependent variable, but could be explained as follows.
Table 7.
Policy impact on total EV market using pooled regression.
For EV promotion, Europe usually started early in the history for higher citizens’ environmental awareness and thus showed a higher EV uptake. In the early days, only slow chargers other than fast chargers were available, so the more public slow chargers, the more it showed that the countries took earlier actions, which is highly related to the high market share nowadays. On the other hand, EV sales are more related to the size of the market, as is shown in Figure 1, meaning that China and the U.S. performed best. Purchasing restriction for traditional cars is the policy used only in China and is proved to be significantly effective [22]. Mandate policies were also used mainly in China and North America, and the large market scale makes the mandate policy remarkable. Waivers on access restrictions are the convenience EVs brought to the driver, especially in densely populated cities. It is good to know that the policy is effective in the history of promoting EV sales volume.
An explanation for the insignificancy of subsidies and other non-financial policies is that most of the countries offered high subsidies and other preferential treatments over the years; thus, those do not make a significant difference now. We will use panel data to analyze the impact thoroughly in the next section.
After performing the Hausman test mentioned in Section 2, the result of test showed that the p-value is small (less than 0.05) and rejected the null hypothesis, which is that the preferred model is random effects. The result shows significant differences between the coefficients for the fixed effects and random effects model. Therefore, we used the fixed effects model in the study with EV market share and EV sales as dependent variables, respectively.
In Table 8, regression coefficients are tabulated based on four models, in which seven and nine independent variables are utilized, respectively. Compared to pooled regression, the panel model controlled the country fixed effect; thus, we deleted purchasing restriction for highly multicollinearity with the dummy variable China, the only country conducted the restriction policy. Moreover, we will not include target in the regression since the target set does not change over time, meaning that it is not suitable for panel models.
Table 8.
Policy impact on total EV market.
By gradually introducing a socioeconomic factor in the later model, the possible impact of the factor can be observed more clearly. Referring to Table 8, the adjusted R square value for each model is above 0.90. That is, the confidence in explaining the cross-country EV share/sales is above 90% for the variables tested.
Most variables are not significant referring to Table 8. Only the density of fast chargers is significantly positive for all models. The parameter means that 1% increase in density of fast chargers can cause a 0.63% increase for EV uptake or a 0.36% increase for EV sales. Our study uses data from 2015–2018, when fast-charging infrastructures rather than slow chargers were constructed rapidly worldwide and contributed considerably to the global EV development. Besides, the result that other policy incentives are not significant may also due to the time period we studied. In the post subsidy era, policies have experienced a declining marginal effect. Taking the waiver on access restrictions as an example, we see from the pooled regression that the policy did show some positive impact on EV sales in the history; however, the effect was declining over the years, because HOV and bus lanes got crowded as the number of electric vehicles increased. In other words, the benefits diminished across time for some non-financial policies. According to the literature, in post subsidy era, it is chargers’ density and fuel price that really counts [8]. In this study, we will shed more light on the effect of charging infrastructures.
3.3. Heterogeneity: Considering Different EV Types
After the basic model analysis, we examined the effects of the policy incentives and infrastructures by separating PHEVs from BEVs. After the separation, the fast charging infrastructures have more apparent impacts for BEVs than those for PHEVs, as illustrated in Table 9 with macroeconomic factors controlled. The parameter means that a 1% increase in density of fast chargers can cause a 0.246% increase for BEV sales, while the effect for PHEV sales is not significant enough. The reason may be that PHEV drivers suffer much less from range anxiety.
Table 9.
Policy impact on the battery electric vehicle (BEV) market and plug-in hybrid electric vehicle (PHEV) market.
The variable subsidy is significant for BEVs but not significant for PHEVs, which may due to the low subsidy PHEV get for its relatively low battery density. The average subsidies for BEVs (USD 6000) are twice the average for PHEVs (USD 3200). The models separating PHEV from BEV also further indicates the robustness for analysis [32].
3.4. Extended Analysis: Vector Autoregression
Infrastructures for facilitating EV sales could be enhanced over years, and factors such as subsidies may influence upon others like chain reactions. Financial aid influences upon the BEV market; meanwhile, the reverse impact could occur. If the feedback relationships exist, vector autoregression should be used to reflect the dynamic relationships [30,33,34]. In this part, we are going to explore if there’s reverse causality in EV markets worldwide.
The authors of [8] develop a system dynamics model of China’s EV adoption to analyze the effectiveness of EV policies. In the dynamic model, the relationship of government incentives, customers’ behavior and infrastructure providers showed complex causality, inspiring us to predict the values of a time series using prior values of another time series. We run a vector autoregression (VAR) model using the three variables mentioned. For the data only contain four periods, we used the first lag of each variable.
We showed the results of the Granger causality test below in Table 10. The results show that all the lagged items do not show significance, even on the 10% level, which means that all lagged variables have no explanatory power for the other variables. The reversed causal relationship is not significant referring to EV adoption; thus, the pooled and panel data regressions we used above are sufficient to explain the causal effect.
Table 10.
Results of the Granger causality test.
4. Conclusions and Policy Implications
4.1. Conclusions
The purpose of this research is to explore the relationship between government incentives and other related factors to electric vehicle adoption across the main countries with EVs. Using panel data from 2015 to 2018, this paper studies the EV uptake among 13 countries. An econometric model for the uptake is established with eight independent variables and two macro control variables. Five of them showed significantly positive effects on 1% level in different regression models: fast/slow charger density, mandate, purchasing restriction and waiver. Subsidies showed significance only on the 5% level for BEVs. The zero–emission vehicle (ZEV) target set did not have apparent impacts. Descriptive analysis drew the same conclusion that charger infrastructure density predicts best for electric vehicle uptake on the national level.
Fast–charge infrastructures were positively related to EV uptake all the time. In the panel data regression, a 1% increase in the density of fast chargers can cause a 0.63% increase for EV uptake or a 0.36% increase for EV sales. It is reasonable that increasing the number of charging stations contributes to EV adoption, while from another perspective, fast–charger density is a sign that the country invested in public infrastructures in recent years. Slow charge infrastructures were positively significant when using pooled regression, that is to take all years into comparation. 1% increase in the density of slow chargers can cause 0.7% increase for EV uptake. Technology always evolves gradually [35] and even though fast chargers have been common in recent years, slow chargers occupied the market in the primary stage. Those countries with high slow charger density, such as Norway and the Netherlands [18], usually have developed electric vehicle markets for years. Thus, citizens have a higher acceptance for the new mobility tools, which was shown in the national EV uptake.
On the other hand, waiver, mandate and purchasing restriction (for fuel cars) were significantly effective to sales volume though they seemed to have little impact on EV market share, in pooled regression. They all showed significance in the 1% level, and purchasing restriction has the best effect for EV sales, that is a country with the fuel car restriction would have 1.47% more sales than others, with other factors controlled. We believe the three policies were directly intended for the sales volume and because of the mandatory, it should be effective in the short run, thus not enough to effect EV share. Market share is a better indicator for the overall acceptance of EV, requiring the governments’ persistent work for years, while EV sales are more sensitive to some powerful mandatory policy in the short term.
4.2. Policy Implications
The significance of the policies in the panel regression can be explained well by the logic behind consumers’ behaviors. If the policy makers can understand what people really care about, the policy is likely to be effective. For example, we can use financial policies to encourage the adoption of EVs; however, if we cannot relieve the range anxiety of EV drivers, it will not work well. In addition to increasing the energy density of the battery, which has already been encouraged in various ways, building more fast chargers along the highway is a good choice compared to other incentives. That is why the density of fast chargers was positive and significant in predicting EV adoption rates, especially for BEVs compared with PHEVs, because PHEVs can get refueling easily as traditional cars.
Besides, financial incentives have showed a declining marginal effect in promoting EV. Only the subsidies to BEV showed positive significance at a low level. The time we studied was the post subsidy era (2015–2018) [36], financial policies have been generous and used for years. Almost all the counties mentioned in the study had high subsidies or tax incentives from central government, not accounting for the local subsidies. The increase in subsidies will not bring as much benefit as before, just as the law of diminishing marginal utility indicates. The marginal effect is higher for the increase in infrastructures. According to the literature, chargers’ density needs more attention paid during this time [8].
In the future, we should shed more light on the effect of charging infrastructures. Policymakers should focus more on the infrastructures of electric vehicles, especially fast public charging points, which is also consistent with some of the literatures [5]. Shown in a recent review summarizing the top antecedents in related studies, the first was charging infrastructure [13]. Many studies also highlighted the importance of fast chargers, especially in densely populated areas [37,38]. Apart from public chargers, private chargers have also played an important role in creating a favorable EV ecosystem [39,40]. Thus, policies related to vehicle–to–grid, wireless charging, and the use of technology can further increase the likelihood of EV adoption [41,42].
Besides, use–based incentive policies designed for the convenience of EV users, such as free parking policy, toll tax exemption and highway lane excess, all showed significance in the pooled regression in this study. The zero–emission mandate is also proved to be relatively effective both in this study and in related literatures. Even policies like the purchasing restriction of fuel cars in China showed a certain level of significance for EV adoption. These policies are not the most widely discussed topics in the literatures, while they are quite effective in reality and worth considering by policymakers.
Author Contributions
Conceptualization, J.Y., S.X. and X.M.; Data curation, J.Y.; Formal analysis, J.Y.; Funding acquisition, S.X. and X.M.; Investigation, J.Y.; Methodology, J.Y.; Resources, S.X.; Supervision, S.X. and X.M.; Visualization, J.Y.; Writing—original draft, J.Y.; Writing—review & editing, S.X. All authors have read and agreed to the published version of the manuscript.
Funding
This research received no external funding.
Acknowledgments
We would like to express our gratitude to all those who helped us during the writing of this paper, especially Ma, our supervisor, for his constant encouragement and guidance.
Conflicts of Interest
The authors declare no conflict of interest.
Appendix A
Table A1.
Description of variables and sources.
Table A1.
Description of variables and sources.
| Variables | Data Descriptions | Sources |
|---|---|---|
| EV share | National market share of electric vehicles as percentage of all car sales | [2] |
| EV sales | National EV car sales | [2] |
| Subsidies | Direct purchasing subsidies (BEV & PHEV) available to consumers, using the exchange rate of domestic currency against US$ on May 20th 2020 | [13] National websites |
| BEV subsidy | Direct subsidies available to consumers when purchasing BEVs, using the exchange rate of domestic currency against US$ on May 20th 2020 | [13] National websites |
| PHEV subsidy | Direct subsidies available to consumers when purchasing PHEVs, using the exchange rate of domestic currency against US$ on May 2020 | [13] National websites |
| Waiver | Waivers on access restrictions, such as access to HOV/bus lanes and access to restricted traffic zones | [2,18,43,44,45] |
| Mandate | ZEV (Zero emission vehicle) mandate policy | [2,18,43,44,45] |
| Target | Year set by the government when 100% ZEV sales goal should be achieved | [2,18,43,44,45] |
| Fuel standard | Level of fuel standards/regulations in the country | [2,18,43,44,45] |
| Purchasing restriction | Restriction referring to purchasing traditional cars, used only in China | [2,18,22,43,44,45] |
| Fast chargers per million population | Number of fast public chargers per million population. Data of chargers are collected from IEA and population of countries is collected from world bank. | [2] World Bank |
| Slow chargers per million population | Number of slow public chargers per million population. Data sources are the same as above. | [2] World Bank |
| GDP per capita | Gross domestic product per capita, in current US dollars | World Bank |
| Population density | People per sq. km of land area, in national level | World Bank |
Appendix B
This appendix provides the details of how we quantify the effect of non–financial policies. We assign different values to the policies. Mandate and purchasing restriction are dummy variables, indicating whether it is implemented. The other non-financial policies are categorical variables evaluated by policy intensity. The wider the policy is applied in the country, the higher the scores it gets. For example, if the policy was implemented nationwide other than just in some target cities, it will get higher value. For waiver, we added up the value of three variables to get the total scores, which are shown in Table A2 below. Table A3 gives the value of some non-financial policy in 2018 and Table A4 provides the value of numerical variables. Data are adapted from IEA reports.
Table A2.
Summary of policy value for waiver in 2018 [2,43].
Table A2.
Summary of policy value for waiver in 2018 [2,43].
| Country | Waiver on Access Restrictions | ||
|---|---|---|---|
| Access to Bus Lanes | Access to HOV Lanes | Access to Restricted Traffic Zones | |
| Canada | 0 * | 1 | 0 |
| China | 0 | 1 | 1 |
| France | 1 ** | 0 | 1 |
| Germany | 1 | 0 | 1 |
| India | 0 | 0 | 0 |
| Japan | 0 | 1 | 0 |
| Korea | 0 | 0 | 1 |
| Netherlands | 2 *** | 0 | 0 |
| Norway | 1 | 0 | 0 |
| Portugal | 0 | 0 | 0 |
| Sweden | 0 | 0 | 0 |
| UK | 1 | 0 | 0 |
| USA | 0 | 1 | 0 |
* No policy; ** Only in target cities; *** Nationwide policy.
Table A3.
Summary of policy value for the variable in selected countries in 2018.
Table A3.
Summary of policy value for the variable in selected countries in 2018.
| Country | Waiver | Mandate | Target | Fuel Standards | Purchasing Restriction |
|---|---|---|---|---|---|
| Canada | 1 | 1 | 0 | 1 | 0 |
| China | 2 | 1 | 0 | 2 | 1 |
| France | 2 | 0 | 1 | 1 | 0 |
| Germany | 2 | 0 | 0 | 1 | 0 |
| India | 0 | 0 | 0 | 0 | 0 |
| Japan | 1 | 0 | 0 | 1 | 0 |
| Korea | 1 | 0 | 0 | 1 | 0 |
| Netherlands | 2 | 0 | 2 | 1 | 0 |
| Norway | 1 | 0 | 3 | 1 | 0 |
| Portugal | 0 | 0 | 0 | 0 | 0 |
| Sweden | 0 | 0 | 1 | 1 | 0 |
| UK | 1 | 0 | 1 | 1 | 0 |
| USA | 1 | 1 | 0 | 1 | 0 |
Table A4.
Summary of numerical variables in 2018.
Table A4.
Summary of numerical variables in 2018.
| Country | BEV Subsidy ($) | PHEV Subsidy ($) | Weighted Average Subsidy ($) | Market Share of BEVs | Market Share of PHEVs | Public Slow Chargers per Million Population | Public Fast Chargers per Million Population |
|---|---|---|---|---|---|---|---|
| Canada | 4.0 | 4.0 | 4.0 | 1.2% | 1.1% | 191.6 | 22.7 |
| China | 4.6 | 3.0 | 4.2 | 3.4% | 1.1% | 117.5 | 79.9 |
| France | 6.7 | 1.1 | 4.8 | 1.4% | 0.7% | 339.4 | 20.8 |
| Germany | 4.5 | 3.6 | 4.1 | 1.1% | 0.9% | 278.7 | 31.5 |
| India | 2.0 | 0.0 | 2.0 | 0.1% | 0.0% | 0.2 | 0.0 |
| Japan | 5.6 | 1.9 | 3.9 | 0.6% | 0.5% | 176.1 | 60.7 |
| Korea | 10.0 | 0.9 | 8.9 | 2.0% | 0.3% | 104.5 | 75.7 |
| Netherlands | 4.4 | 2.0 | 4.1 | 5.7% | 0.9% | 2080.7 | 47.5 |
| Norway | 9.0 | 9.0 | 9.0 | 29.5% | 17.0% | 2097.2 | 230.7 |
| Portugal | 2.4 | 1.2 | 1.8 | 2.1% | 1.8% | 155.8 | 17.9 |
| Sweden | 6.0 | 1.0 | 2.2 | 2.0% | 6.0% | 594.1 | 93.3 |
| UK | 3.9 | 6.7 | 5.8 | 0.7% | 1.4% | 221.6 | 40.5 |
| USA | 7.5 | 6.0 | 7.0 | 1.6% | 0.8% | 153.6 | 13.0 |
References
- Jaffe, A.B.; Stavins, R.N. The energy–efficiency gap what does it mean? Energy Policy 1994, 22, 804–810. [Google Scholar] [CrossRef]
- IEA. Global EV Outlook 2019: Scaling–Up the Transition to Electirc Mobility. Available online: https://www.iea.org/reports/global-ev-outlook-2019 (accessed on 5 May 2019).
- Bjerkan, K.Y.; Nørbech, T.E.; Nordtømme, M.E. Incentives for promoting battery electric vehicle (BEV) adoption in Norway. Transp. Res. Part D Transp. Environ. 2016, 43, 169–180. [Google Scholar] [CrossRef]
- Melton, N.; Axsen, J.; Goldberg, S. Evaluating plug–in electric vehicle policies in the context of long–term greenhouse gas reduction goals: Comparing 10 Canadian provinces using the “PEV policy report card”. Energy Policy 2017, 107, 381–393. [Google Scholar] [CrossRef]
- Sierzchula, W.; Bakker, S.; Maat, K.; Van Wee, B. The influence of financial incentives and other socio–economic factors on electric vehicle adoption. Energy Policy 2014, 68, 183–194. [Google Scholar] [CrossRef]
- Zhang, X.; Wang, K.; Hao, Y.; Fan, J.-L.; Wei, Y.-M. The impact of government policy on preference for NEVs: The evidence from China. Energy Policy 2013, 61, 382–393. [Google Scholar] [CrossRef]
- Badertscher, N. Electric Car Sales Hit the Brakes as Tax Credit Axed and Fee Added; Politifact: Washington, DC, USA, 2015. [Google Scholar]
- Wang, N.; Tang, L.; Pan, H. A global comparison and assessment of incentive policy on electric vehicle promotion. Sustain. Cities Soc. 2019, 44, 597–603. [Google Scholar] [CrossRef]
- Sheldon, T.L.; DeShazo, J.R. How does the presence of HOV lanes affect plug–in electric vehicle adoption in California? A generalized propensity score approach. J. Environ. Econ. Manag. 2017, 85, 146–170. [Google Scholar] [CrossRef]
- Mersky, A.C.; Sprei, F.; Samaras, C.; Qian, Z.S. Effectiveness of incentives on electric vehicle adoption in Norway. Transp. Res. Part D Transp. Environ. 2016, 46, 56–68. [Google Scholar] [CrossRef]
- Sen, B.; Noori, M.; Tatari, O. Will Corporate Average Fuel Economy (CAFE) Standard help? Modeling CAFE’s impact on market share of electric vehicles. Energy Policy 2017, 109, 279–287. [Google Scholar] [CrossRef]
- Ou, S.; Lin, Z.; Qi, L.; Li, J.; He, X.; Przesmitzki, S. The dual–credit policy: Quantifying the policy impact on plug–in electric vehicle sales and industry profits in China. Energy Policy 2018, 121, 597–610. [Google Scholar] [CrossRef]
- Kumar, R.R.; Alok, K. Adoption of electric vehicle: A literature review and prospects for sustainability. J. Clean. Prod. 2020, 253, 119911. [Google Scholar] [CrossRef]
- Björnsson, L.-H.; Karlsson, S. Electrification of the two–car household: PHEV or BEV? Transp. Res. Part C Emerg. Technol. 2017, 85, 363–376. [Google Scholar] [CrossRef]
- Neubauer, J.; Brooker, A.; Wood, E. Sensitivity of plug–in hybrid electric vehicle economics to drive patterns, electric range, energy management, and charge strategies. J. Power Sources 2013, 236, 357–364. [Google Scholar] [CrossRef]
- Peterson, S.B.; Michalek, J.J. Cost–effectiveness of plug–in hybrid electric vehicle battery capacity and charging infrastructure investment for reducing US gasoline consumption. Energy Policy 2013, 52, 429–438. [Google Scholar] [CrossRef]
- Lieven, T. Policy measures to promote electric mobility–A global perspective. Transp. Res. Part A Policy Pract. 2015, 82, 78–93. [Google Scholar] [CrossRef]
- IEA. Global EV Outlook 2020: Entering the Decade of Electric Drive? Available online: https://www.iea.org/reports/global-ev-outlook-2020 (accessed on 5 June 2020).
- Mazur, C.; Contestabile, M.; Offer, G.J.; Brandon, N.P. Assessing and comparing German and UK transition policies for electric mobility. Environ. Innov. Soc. Transit. 2015, 14, 84–100. [Google Scholar] [CrossRef]
- Heidrich, O.; Hill, G.A.; Neaimeh, M.; Huebner, Y.; Blythe, P.T.; Dawson, R.J. How do cities support electric vehicles and what difference does it make? Technol. Forecast. Soc. Chang. 2017, 123, 17–23. [Google Scholar] [CrossRef]
- Levine, M.D.; Koomey, J.G.; McMahon, J.E.; Sanstad, A.H.; Hirst, E. Energy efficiency policy and market failures. Annu. Rev. Energ. Environ. 2003, 20, 535–555. [Google Scholar] [CrossRef]
- Ma, S.-C.; Fan, Y.; Feng, L. An evaluation of government incentives for new energy vehicles in China focusing on vehicle purchasing restrictions. Energy Policy 2017, 110, 609–618. [Google Scholar] [CrossRef]
- Jenn, A.; Springel, K.; Gopal, A.R. Effectiveness of electric vehicle incentives in the United States. Energy Policy 2018, 119, 349–356. [Google Scholar] [CrossRef]
- Wooldridge, J.M. A unified approach to robust, regression–based specification tests. Econom. Theory 1990, 17–43. [Google Scholar] [CrossRef]
- Hausman, J.A. Specification tests in econometrics. Econom. J. Econom. Soc. 1978, 1251–1271. [Google Scholar] [CrossRef]
- White, H. A heteroskedasticity–consistent covariance matrix estimator and a direct test for heteroskedasticity. Econom. J. Econom. Soc. 1980, 817–838. [Google Scholar] [CrossRef]
- Craney, T.A.; Surles, J.G. Model–dependent variance inflation factor cutoff values. Qual. Eng. 2002, 14, 391–403. [Google Scholar] [CrossRef]
- Granger, C.W.J. Long memory relationships and the aggregation of dynamic models. J. Econ. 1980, 14, 227–238. [Google Scholar] [CrossRef]
- Sims, C.A. Comparison of Interwar and Postwar Business Cycles: Monetarism Reconsidered. Am. Econ. Rev. 1980, 70, 250–257. [Google Scholar]
- Xu, B.; Lin, B. Carbon dioxide emissions reduction in China’s transport sector: A dynamic VAR (vector autoregression) approach. Energy 2015, 83, 486–495. [Google Scholar] [CrossRef]
- Magkonis, G.; Tsopanakis, A. Exploring the effects of financial and fiscal vulnerabilities on G7 economies: Evidence from SVAR analysis. J. Int. Financ. Mark. Inst. Money 2014, 32, 343–367. [Google Scholar] [CrossRef]
- Li, X.; Chen, P.; Wang, X. Impacts of renewables and socioeconomic factors on electric vehicle demands–Panel data studies across 14 countries. Energy Policy 2017, 109, 473–478. [Google Scholar] [CrossRef]
- Choi, H. Technology–push and demand–pull factors in emerging sectors: Evidence from the electric vehicle market. Ind. Innov. 2018, 25, 655–674. [Google Scholar] [CrossRef]
- Zhang, Y.; Zhong, M.; Geng, N.; Jiang, Y. Forecasting electric vehicles sales with univariate and multivariate time series models: The case of China. PLoS ONE 2017, 12, e0176729. [Google Scholar] [CrossRef] [PubMed]
- Jenn, A.T. Advanced and Alternative Fuel Vehicle Policies: Regulations and Incentives in the United States; Carnegie Mellon University: Pittsburgh, PA, USA, 2014. [Google Scholar]
- Brown, D.; Hall, S.; Davis, M.E. Prosumers in the post subsidy era: An exploration of new prosumer business models in the UK. Energy Policy 2019, 135, 110984. [Google Scholar] [CrossRef]
- Neaimeh, M.; Salisbury, S.D.; Hill, G.A.; Blythe, P.T.; Scoffield, D.R.; Francfort, J.E. Analysing the usage and evidencing the importance of fast chargers for the adoption of battery electric vehicles. Energy Policy 2017, 108, 474–486. [Google Scholar] [CrossRef]
- Bunsen, T.; Cazzola, P.; Gorner, M.; Paoli, L.; Scheffer, S.; Schuitmaker, R.; Tattini, J.; Teter, J. Towards Cross–Modal Electrification; Global EV Outlook: Paris, France, 2018. [Google Scholar]
- Helveston, J.P.; Liu, Y.; Feit, E.M.; Fuchs, E.; Klampfl, E.; Michalek, J.J. Will subsidies drive electric vehicle adoption? Measuring consumer preferences in the US and China. Transp. Res. Part A Policy Pract. 2015, 73, 96–112. [Google Scholar] [CrossRef]
- Wu, X. Role of workplace charging opportunities on adoption of plug–in electric vehicles–Analysis based on GPS–based longitudinal travel data. Energy Policy 2018, 114, 367–379. [Google Scholar] [CrossRef]
- Liu, H.; Wang, D.Z. Locating multiple types of charging facilities for battery electric vehicles. Transp. Res. Part B Methodol. 2017, 103, 30–55. [Google Scholar] [CrossRef]
- Xiong, Y.; Wang, B.; Chu, C.-C.; Gadh, R. Vehicle grid integration for demand response with mixture user model and decentralized optimization. Appl. Energy 2018, 231, 481–493. [Google Scholar] [CrossRef]
- IEA. Global EV Outlook 2016: Beyond One Million Electric Cars. Available online: https://www.oecd.org/publications/global-ev-outlook-2016-9789264279469-en.htm (accessed on 6 July 2016).
- IEA. Global EV Outlook 2017: Two Million and Counting. Available online: https://webstore.iea.org/global–ev–outlook–2017 (accessed on 5 June 2017).
- IEA. Global EV Outlook 2018: Towards Cross–Modal Electrification. Available online: https://www.oecd.org/publications/global–ev–outlook–2018–9789264302365–en.htm (accessed on 5 June 2018).


© 2020 by the authors. Licensee MDPI, Basel, Switzerland. This article is an open access article distributed under the terms and conditions of the Creative Commons Attribution (CC BY) license (http://creativecommons.org/licenses/by/4.0/).