Article

Comparison of Economic Feasibility for Efficient Peer-to-Peer Electricity Trading of PV-Equipped Residential House in Korea

School of Architecture and Building Science, Chung-Ang University, Seoul 06974, Korea
Energies 2020, 13(14), 3568; https://doi.org/10.3390/en13143568
Submission received: 25 May 2020 / Revised: 3 July 2020 / Accepted: 9 July 2020 / Published: 10 July 2020
(This article belongs to the Special Issue Smart Built Environment for Health and Comfort with Energy Efficiency)

Abstract

:
Since the sharing economy emerged as a new paradigm with the development of technology, the global sharing economy market has grown rapidly. In the energy sector, peer-to-peer energy trading is being conducted to share energy produced through renewable energy systems. In this study, in the situation where energy transactions among individuals are expected to expand in the future, the types of buildings and trading to secure the economics of energy trading were compared. The types of buildings were limited to residential buildings, and the economic efficiency according to energy performance was compared. Because the government has strengthened energy performance regulations, the performance varied depending on the time of construction. Therefore, building types were divided into existing houses, new houses, and zero-energy houses. The trading types were compared to the existing methods, net-metering and feed-in tariff for small-scale distributed PV systems, with P2P trading. Thus, consuming only the amount of electricity in Tier 1 and trading the rest between individuals was the most economical strategy in residential buildings to which the progressive tariff system was applied. As the performance of a building improves, the more electricity that can be traded, and the wider the range for securing economic feasibility.

1. Introduction

The traditional way of using energy involve receiving and consuming energy unilaterally from energy suppliers. However, due to the 4th industrial revolution and the activation of the sharing economy, the paradigm of the energy industry has also shifted with energy decentralization and independence, in which consumers can directly consume or sell the energy produced by installing energy facilities. In particular, in the power sector, energy prosumers that generate electricity through small distributed energy resources (DERs) and trade leftover electricity for other consumers have emerged.
Energy prosumers are divided into three types: net energy metering, wholesale market transaction, and peer-to-peer (P2P) energy trading, depending on the buyer or transaction methods. First, in net energy metering, surplus power among the electricity produced from DERs is transferred back to the grid, and this is subtracted from the amount of electricity received to settle the electricity bill. Second, according to the wholesale market transaction, the aggregators recruit small-scale DERs to proxy the transaction in the electricity wholesale market and distribute the sales revenue. Lastly, in P2P trading, individuals directly generate and consume energy and trade surplus electricity directly with each other without going through the power exchange.
Recently, a massive number of energy-users have transformed into prosumers because of numerous reasons such as the strong society attitude with respect to alleviation of negative climate impacts, desires to decrease electricity costs, and various government regulations, including generous feed-in tariff schemes. Factors influencing the prosumer’s revitalization vary in terms of social values, technological development, etc. [1,2,3,4,5,6], but the most frequently mentioned are renewable energy generation costs and electricity prices [7,8,9,10]. In general, the cost of power generation is compared with the levelized cost of electricity (LCOE) [11]. Korea’s utility-scale PV LCOE is 0.102 USD/kWh [12], which is higher than the world average utility-scale PV LCOE of 0.085 USD/kWh [13]. In particular, LCOE of residential solar PV systems for prosumers is higher than the utility scale. PV LCOE around the world is steadily decreasing because of technological advances, production scale expansion, and operations and maintenance efficiency. However, Korea’s PV LCOE is higher than that of nuclear power plants or conventional fossil fuel-based power plants, and Korea is not achieving grid parity. Among countries where P2P energy trading is in effect, the Netherlands and Germany have reached grid parity [14], while the United Kingdom and the United States are nearly approaching grid parity [15,16,17]. Electricity prices vary by country, but are generally increasing. This economic burden on electricity bills is also an important factor in the emergence of prosumers, and energy prosumers in EU have been shown to participate in the market to reduce energy costs [18]. Korea’s electricity price for households is 110.45 USD/MWh, which is cheaper than that in other countries [19]. Consumers are encouraged to participate in energy production if it is cheaper to generate and use electricity directly than to use conventional electricity. However, if the cost of generating electricity is higher than the revenue gained from reducing or trading, the cause disappears. These high LCOE and low electricity prices in Korea are a barrier to P2P energy trading.
The price of P2P energy trading for a house is affected by the electricity cost of that building, installation cost of the PV system, and supply price of electricity, among others. The existing power transactions are divided into a spot market that is traded at auctioned rates and a contract market that is traded at a certain fixed rate. The spot market fluctuates depending on the supply and demand; recently, the spot market transaction prices in Korea have been continuously decreasing. In the spot market scenario, it is difficult to secure sufficient economic feasibility to attract participation from small-scale power generation companies.
The Korean prosumer market is still in its infancy. Korea has not yet entered grid parity. Thus, there is little incentive for individuals or private companies to enter the prosumer market. However, globally, the cost of renewable energy generation continues to fall, and there is a possibility that electricity rates will rise as energy demand increases. Moreover, as artificial intelligence and blockchain technology are used in the prosumer market, the energy trading market is evolving into various P2P models beyond net metering and wholesale market sales [20]. P2P energy trading is an inevitable trend.
Various studies have been proposed to secure the economic feasibility of P2P energy trading. Baghaee et al. [21] presented an algorithm for planning and designing an optimized microgrid system in terms of the supply reliability and cost. However, this algorithm is suitable for designing independent RE systems in microgrids but unsuitable for renewable energy systems integrated into buildings. Moreover, there are limits to applying the energy produced by considering energy consumptions in buildings toward P2P energy trading. Pillai et al. [22] proposed the prosumer electricity unit cost for calculating economic benefits. The case studies compared different climate and operating conditions in the two locations. They pointed out the importance of installed locations and demand-generation matching for economic benefits of grid-connected residential PV systems. Delgado et al. [23] studied economic analysis for heat and electricity prosumers in zero-energy buildings in Finland. They found that it is difficult to reach zero-energy balances in cost effective ways with the low retail prices and without demand control. The time difference between occupancy and PV generation has led to additional electric charges. Camilo et al. [24] compared the economic efficiency of different prosumer’s scenarios according to whether it is self-consumed and whether there is a battery. They obtained the most effective way for PV owners to trade the remaining amount of electricity after self-consumption. Because the investment for batteries is still too high, they claimed that it was not economical to store surplus energy in a battery and then trade it later. According to the survey of Oberst et al. [25] on the energy consumption patterns in prosumer and non-prosumer households, energy consumption attitudes were not different. Instead, more energy-efficient equipment was used in prosumer households, resulting in lower energy consumption. In other words, it is not necessary to save energy due to changes in the behavior of the occupants but to save energy in the facilities of the building or the building itself for prosumers. In this context, economic energy trading requires demand control in the building itself and not the storage of surplus energy. Although P2P energy trading is expected to be actively pursued, there are very few reported works that address the possibility of energy trading between individuals by considering self-consumption according to the energy performances of buildings. For the economic feasibility of P2P energy trading, the balance between the energy demand of buildings and the amount of production is important, but research on it is insufficient.
The purpose of this study is to analyze the suitability of P2P energy trading according to the energy performance of buildings in photovoltaic installed houses. In addition, the profitability of each electricity trading type was compared to analyze the economic feasibility of P2P energy trading. In this study, to investigate the applicability of P2P energy trading according to building performance, the transaction amounts were analyzed based on the electricity rate systems without considering the price fluctuations due to network congestion and spot pricing. The paper is organized as follows. In Section 2, the building model for simulated and electricity tariffs for residential buildings in Korea are described. The buildings are divided into existing houses (EH), newly-built houses (NH), and zero-energy houses (ZH) according to the time of construction and energy performance. Section 3 presents the results regarding building energy consumption and electricity rates by building types. Section 4 discusses and analyses the results. The economic feasibility was compared based on trading types and building types.

2. Methodology

2.1. Building Model

The simulation model was set up as a detached house of 83.16 m2, located in Seoul, South Korea. The size of the simulation model was referred to as the size of the national housing proposed by the Housing Act in Korea. National housing refers to houses built by the government to stabilize housing. Table 1 lists the building parameters, and Figure 1 shows the plan of the simulation model. Table 2 lists the simulated weather conditions. The weather data used were hourly data provided by Meteonorm v.7.3.4. The type of climate in Seoul, South Korea, is categorized as mixed-humid (4A) by the ASHRAE 169-2006 standard. The building envelope construction was based on the building energy conservation design standard, as shown in Table 3. To save energy in buildings, the Korean government has continually strengthened the building’s legal insulation standards. The EH and NH were assumed to apply the 2001 and 2020 standard, respectively. For ZH, the building envelope construction was applied to a passive house standard. Table 4 summarizes the input variables by building types. The infiltration rate varied with building types because the building age affects the airtightness. The occupancy density was calculated as a household composition of four people. The EHs were equipped with fluorescent lights, and the NHs had LED lights, according to “Construction standard of energy conserving eco-friendly housing” [26]. The light density of the ZH was set with reference to previous ZHs [27]. To obtain the miscellaneous electric load, the same appliances were assumed to be used in all three houses and the same values were applied. The heating and cooling systems shown in Table 5 were installed radiant floor heating by hot water and a fan coil unit, respectively.
The PV system in Table 6 was installed on the roof. The PV system was connected to the electrical system of the building via a grid-connected type inverter. The capacity of the PV system was 3 kW, and the efficiencies of the modules and an inverter at standard test condition were 18% and 95%, respectively. The generated energy was calculated by a standard one-diode model with the building energy consumption using DesignBuilder. The energy consumption was calculated as the site energy.

2.2. Electricity Tariffs

In Korea, electricity is supplied to all buildings through Korea electric power corporation (KEPCO), a government-owned public entity. Electricity billing plans depend on the use type and supply voltage. In general, the use types are residential, general, educational, industrial, agricultural, street lighting, and electric vehicle charging. The progressive electricity tariff is only applied to residential houses, and different rates are applied to the others depending on season or the time of the day. The net payable charge is calculated with the minimum charge, energy charge, value-added tax (VAT), and electric power industry basis fund as shown in Equation (1). Table 7 lists the progressive electricity tariffs for residential services. The minimum charge is charged according to the monthly energy consumption, and the energy charge is calculated based on each tier of the energy consumption range. The rates of Tier 2 and Tier 3 are approximately twice and three times those of Tier 1, respectively. Table 8 presents the low voltage plan that most consumers select. The general and educational services are charged using a seasonal rate.
Ctotal = Cmin + CE + VAT + FElec = Cmin + CE +(Cmin + CE) × 0.1 + (Cmin + CE) × 0.037
where Ctotal is the net payable charge, Cmin is the minimum charge, CE is the energy charge, VAT is the value-added tax, and FElec is the electric power industrial basis fund.

2.3. Types of Generated Energy Transactions

There are two methods of using electricity produced through PV systems: a stand-alone type that consumes all of its energy using a battery, and a grid-connected type that transmits the electricity by connecting with the grid. In this paper, it is assumed that electricity transactions are conducted only for the grid-connected type, and that the capacity of the PV system is 3 kW. The energy transaction types considering installed PV capacity were set as follows:
  • Net metering
  • Feed-in tariff for small-scale distributed PV system
  • P2P trading
Currently, the electricity generated by installing PV systems in residential buildings can be used for net metering and to feed-in tariff for small-scale distributed PV systems. The net metering is a system in which surplus electricity is sent to the KEPCO grid after self-consumption of electricity produced through power generation facilities of 10 kW or less, and the electricity rate corresponding to the surplus electricity is deducted. However, the minimum charge, VAT, and the electric power industrial basis fund are charged based on the energy usage without considering the excess energy produced. If the required electricity from the grid is smaller than the produced energy, the difference is carried over to the next month’s billing.
To generate stable profits for small PV owners, the feed-in tariff for small-scale distributed PV systems was implemented in 2018. This system is for PV owners with a capacity of less than 30 kW or cooperatives or farmers with a capacity of less than 100 kW. The produced energy is purchased at a fixed price for the next 20 years by the public power generators. The unit price is determined by referring to the system marginal price (SMP) base price of the previous year and the weight by the installed type and place. The unit price is calculated as shown in Equation. (2). In this study, the unit price of 143.08 USD/kWh announced in 2020 was applied. The fixed price considering the weight is calculated as shown in Equation (3). Because PV systems are installed on the building, the fixed price with the weight 1.5 is 174.45 USD/MWh as of 2020.
Punit = SMP + 1REC = 143.08 USD/MWh (As of 2020)
Pfix = SMP + REC × weighting factor = SMP + (Punit − SMP) × weighting factor
where Punit is the unit price, SMP is the system marginal price (USD 80.32), REC is the renewable energy certificate, and Pfix is the fixed price.
The number of projects for P2P energy trading has increased recently all over the world. In Korea, article 19 of “Guidelines for transactions on small-scale renewable energy generation electric power” has made it possible to trade energy between neighbors since 2016. However, direct energy trade between individuals is impossible in Korea. P2P transactions are handled by KEPCO as an intermediary and settle fees similar to the net metering system. The energy transaction is assumed to use KEPCO’s gird and pay fees in consideration of Korea’s situation. It is assumed that producers and consumers enter into mutual contracts, such as trading amount of electricity, unit price, and duration, to trade electricity through KEPCO’s distribution network and to pay a certain fee. The estimated price to use the P2P trading platform is set to USD 5.50 per month by referring to the study of Lee and Cho [28]. To establish electricity trading conditions, this study set two scenarios according to the balance between the generated energy and electricity demand (Table 9). The first scenario (P2P Tier 1) is to trade energy except the maximum consumption amount of Tier 1 and use progressive electricity tariffs for residential services. Energy consumption and production generally fluctuate on a daily basis depending on the weather. However, in this study, it is assumed that the amount of electric energy supplied from the grid is limited by the Tier 1 capacity (200 kWh or 300 kWh), and the energy used in excess of this quantity is consumed as energy produced by the PV system. The remaining production, after excluding self-consumption, is used for P2P energy trading. The second is to trade the remaining energy after self-consumption. The second scenario (P2P Zero) only involves trading the monthly remaining energy after firstly self-consuming the generated energy in buildings. The second one is similar to net metering. The difference is that the remaining energy is supplied to the consumer, not KEPCO, so the trade price is different. Energy trades are assumed to be supplied to consumers who consume more than Tiers 2 or 3 of progressives, so that prosumers and consumers can trade at a lower cost than electricity supplied from the grid. In actual P2P trading, the price of energy trading may fluctuate in real time, but in this study, it is limited to supply for a year at a fixed price.
In general, power management systems in the microgrid are connected to the same grid, and the building and distributed power generators are considered separately. These models separate the demand and supply of energy and are managed comprehensively via an energy management system within the microgrid. In such cases, energy supply by distributed generators can be considered to be more important than energy saving in buildings. However, the strategy proposed in this work preferentially consumes only a certain amount of energy in buildings and uses the remaining amount for power transactions. This reduces the load on the building through the integrated PV system and reduces congestion and overload of the network. This helps analyze the appropriate target for P2P energy trading according to the energy performance of the building.

2.4. Economic Assessment

LCOE is a numerical value that represents all costs incurred during the operation period of a PV system. Thus, it shows how much cost the PV system needs to produce 1 kWh of electricity, considering investment costs, operating costs, revenues, etc. A lower LCOE means that energy is produced at a low cost, implying that the prosumer’s economic potential is expected to be higher. Because the LCOE is calculated using the installation cost, operating cost, replacement cost, and power generation of the system, it does not differ based on the type of building. The LCOE according to the trading type was analyzed, and the minimum trading price was calculated by comparing the LCOE with the energy charge by tier of progressive electricity tariffs for residential buildings. The LCOE is defined by [29]:
LCOE = LCC PV LCEG PV = i = 1 n IC i + OM i + RC i ( 1 + r ) i i = 1 n AEG ( 1 d ) i ( 1 + r ) i
where LCCPV is the life cycle cost of the PV system, LCEGPV is the life cycle electricity generation cost of the PV system, ICi is the initial installation cost in year i, OMi is the operation and maintenance cost in year i, RCi is the replacement cost in year i, AEG is the annual electricity generation by PV system, d is the annual degradation rate, and r is the real discount rate.
In this study, the net present value (NPV), internal rate of return (IRR), profitability index (PI), and discounted payback period (DPP) were used as indicators of economic assessment [24,30,31]. NPV is the difference in cash flows between the revenue and expenditure over a period of time and is calculated as the sum of the discounted amount of the present time by applying the rate of interest, as shown in Equations (5) and (6). Revenue is the reduction in electricity rates and electricity trading of surplus energy according to the scenario of generated energy transaction. In general, when the NPV is greater than 0, the project is well worth investing in; otherwise, there is no investment value.
NPV = i = 1 n NR i ( 1 + r ) i IC
NR i = EC i + ETR i OM i RC i
where n is the project lifetime, NRi is the net revenue obtained in year i, ECi is the difference between the existing electricity rates and the reduced electricity rates due to self-consumption of electricity produced, and ETRi is the electricity trading revenue.
IRR is the discount rate that equals the present value of the total cost of the expected total benefit from the investment and can be expressed using Equation (7) as the discount rate that makes the NPV zero. In general, if the IRR is greater than the capital ratio before proceeding with the project, the project is proceeded with. In other words, if IRR is higher than the standard interest, the project is economically profitable.
i = 1 n N R i ( 1 + I R R ) i I C = 0
PI describes the ratio of the present value of investment costs and the present value of future cash flow. If the PI is greater than 1, the project is accepted, and if it is less than 1, the project is rejected. PI is calculated using Equation (8):
PI = i = 1 n NR i ( 1 + r ) i i = 0 n 1 IC i ( 1 + r ) i
DPP measures the time taken to recover the initial investment costs based on the present value of cash flows over a period expected in the future. The DPP is calculated by
i = 1 DPP NR i ( 1 + r ) i = i = 0 n 1 IC i ( 1 + r ) i
The indicators for economic assessment are shown in Table 10. The standard for 2020 was applied to the criteria for grassland investment costs and government subsidies. The real discount rate is 0.75%/year, which is the base rate of the Bank of Korea for March 2020. The government provides subsidies for the installation of PV systems in residential houses with net metering or P2P, but in the case of FIT, they are subsidized at the guaranteed purchase price of generated energy, so installation cost support cannot be applied. The replacement cost was assumed to be 13 years after installation, and the inverter was assumed to be replaced; 9.5% of the initial installation cost was assumed. According to the NREL, the annual degradation rate of the mono-Si PV system was suggested to be 0.2–0.9% [32]. Therefore, 0.5% was applied considering this range.

3. Results

3.1. The Building Energy Consumption

Energy consumption according to the construction time of the building was estimated as shown in Table 11. Typical Korean houses use gas for heating and hot water and electricity for other energy loads such as cooling and lighting. EHs had a large proportion of heating in the total energy consumption and consumed more gas than electricity. Furthermore, the better the building’s energy performance, the greater the reduction in heating energy. The ratio of electric energy consumption to the total energy consumption was large, as shown in Figure 2. The energy use intensities of EH, NHs and ZH are 248.2 kWh/m2, 141.8 kWh/m2, and 55.0 kWh/m2, respectively. According to the statistics of energy consumption for residential buildings in Seoul [33], the annual energy consumption of detached houses was 239.8 kWh/m2, which showed an error of 3.5% in the EH simulation result value of 248.2 kWh/m2. EH consumed 68% of the annual energy consumption as gas for heating and hot water and 22% of the annual energy consumption as electricity. In contrast, ZH consumed 22% of total energy consumption as gas for heating and domestic hot water and 78% as electrical energy. As the energy performances of buildings improved, the total energy consumption by NH and ZH were respectively 57% and 22% of the total energy consumption by EH. However, the electricity consumption of NH and ZH were respectively 87% and 70% of that of EH. Hence, the electric energy consumption savings are very small compared to the overall building energy consumption savings. Because it is assumed that the living pattern of the occupants is the same regardless of the building energy performance, as the energy performance of buildings improves, it can be seen that the proportion of the internal equipment load increases in the total energy consumption.
The annual energy output of a 3-kW PV system is 3,611.4 kWh, as presented in Table 12. The ratios of PV generation to the total site energy of EH, NH, and ZH were 11%, 35%, and 85%, respectively. The ratios of power generation to the annual electricity consumption were 85%, 97%, and 119%, respectively. Electric energy consumption is not constant on a monthly basis but is concentrated in the summer months. However, PV generation is high in spring and autumn. Although buildings with high self-reliance rate are advantageous for P2P trading, the potential of P2P trading can be evaluated through monthly net electricity analysis of EHs with low energy independence. As shown in Figure 3, the monthly net electricity varies with building energy performance. In general, because electricity consumption is concentrated in the summer, the electricity consumption of the ZH is also in high demand in the summer. In contrast, during the winter or mid-term, PV generation of NH and ZH is greater than the electricity consumed. During the cooling period, from June to September, electricity consumption increases, so that EH and NH are not self-reliant and have to use electricity from the grid.

3.2. Electricity Rates

Table 13 shows the monthly electricity rate using the progressive rate system. The annual electricity rates for EH, NH, and ZH are 601.90 USD, 471.33 USD, and 336.89 USD, respectively. According to the improvement of building performance, the annual electricity savings are 13% for NH and 29% for ZH compared to an EH. However, the electricity charge savings are 22% for a NH and 44% for a ZH. This is because the tier of the progressive rate system changes. In the case of EH, the Tier 3 plan with the highest price was applied from June to September because of the increased requirement for cooling energy. The Tier 3 plan was only applied to the NH in August. The Tier 2 plan was applied to the ZH every month.
It is important not only to reduce the electricity consumed by the building itself but also to lower the tier of the progressive rate system. For example, let us compare the June rate of the EH with the July rate of the NH. Even though the electricity consumption in July for the NH is higher than the consumption in June for the EH, the electricity charge for June in the EH is higher. In July and August, the electricity consumption range increases at each tier, so even if electricity consumption is similar, lower rates are applied.

3.3. Economic Assessment by Trading Types

3.3.1. Minimum Trading Price

The LCOE for PV systems was calculated considering initial cost, operating cost, replacement cost, and annual energy production. When calculating the LCOE, the differences in energy consumption according to the type of building were not considered. Thus, the LCOE according to the trading type was compared.
The resulting LCOEs are listed in Table 14. The least LCOE was for net metering because the initial cost with subsidy was the least. The initial cost for P2P was the same as net metering, but the LCOE value was higher because the LCOE of P2P includes platform usage fee for trading and requires more operating cost. In contrast, the LCOE of FIT was 0.71 USD/kWh, which was higher than those of other trading types because it did not receive government subsidies at the beginning of the installation. In this study, the minimum trading price was set to 0.08 USD/kWh considering the energy charge at Tier 1 of the residential electricity rate system and LCOE by trading types.

3.3.2. Net Electricity Charge by Building and Trading Types

The existing electric rate system consists of minimum charge, energy charge, VAT, and electric power industry basis fund, of which, the energy charge has the largest proportion. However, the rate system using net metering is calculated in the same way as the existing rate system except energy charge, which is calculated only for electricity excluding power generation from energy consumption. The rate system with FIT charge is the same as the existing electricity rate systems, and instead revenues are collected by selling electricity energy produced through PV at fixed prices. The prosumer assumes that it deals with Tier 3 consumers with high energy consumption and sets the default trading price as the average energy charge at Tier 2 and Tier 3 (0.19 USD/kWh).
The annual net electricity charges for each trading type are shown in Table 15. The net electricity is calculated as the difference between the electricity charges and revenues obtained by electricity trading including the P2P platform usage fee. If the net electricity charge is negative, it implies income and that the net electricity charge value reduced as the energy performance of the building improved. Electricity energy used for lighting, cooling, heating, etc. is reduced, and the electricity charge has been reduced.
Net metering subtracts the electricity produced through a PV system from the electricity consumption, and the surplus electricity is carried over to the next month and is reflected in the next month’s charge. EH consumes more energy than electricity, but NHs and ZHs consume more electricity. In particular, ZH has 584.5 kWh/year of electricity left without any financial benefits. In the case of FIT, the generated energy is the same regardless of the building and revenues by trading at the same. All types of buildings with FIT were in surplus, so profits increased by reducing the electricity charges by improving the building energy performance. When conducting P2P trading, the net electricity charge was largely different depending on the scenario. It is assumed that P2P-Tier 1 consumes only the amount to maintain the Tier 1 of the electricity rate system and trades the rest. Compared with EH’s FIT and P2P-Tier 1, the net electricity charges are −28.13 USD and 2.06 USD, respectively. The trading volume is almost twice as large at 3611.4 kWh/yr and 1950.0 kWh/yr, respectively, but the fixed price of FIT is 0.175 USD/kWh, which is smaller than the default trading price of 0.190 USD/kWh, and the annual energy charge is higher, so the P2P-Tier 1 has more income. This means that even if the transaction volume is small, the energy charge and transaction cost play an important role in securing the economics.
Because P2P-Zero made the energy consumption zero and only other power generation methods were a part of the transaction, there was not much actual trading volume. As shown in Table 16, most of the electricity produced was self-consumed, and only 6–19% of the generated power could be traded. EH, NH, and ZH participated in trading for only 5, 6, and 8 months of the year. In contrast, P2P-Tier 1 could generate transaction profits by trading all year round. The trading volumes of the EH, NH, and ZH were 54%, 69%, and 88% of the total power generation, respectively.

3.3.3. Economic Analysis by Building and Trading Types

NPV, IRR, PI, and DPP were analyzed for economic analysis. Table 17 presents the economic analysis based on building types and trading types. In this study, it is assumed that the total revenue is the electricity charge savings and trading income of each building type. To compare the economics of each building type, the construction cost of each building type should be considered. However, in this study, the construction cost of the building was not considered, so a comparison between building types was not conducted. Net metering and P2P trading generate revenues with reduced electricity bills because of the improved building performance. However, FIT does not reduce electricity bills, so the economic feasibility of improving building performance is the same.
Rooftop PV installation prices have fallen significantly worldwide [13,34,35]. Types of economic feasibility by trading types were evaluated. The most economical trading type of each building types was the P2P-Tier 1. P2P-Tier 1 is the most economical because it self-consumes a portion of the electricity generated to maintain Tier 1 of the progressive electricity tariffs and uses the rest for P2P trading.
FIT has a high cash flow, so NPV is high. However, it does not receive the government’s installation subsidy, and payment of electricity is more than other transaction methods. Although the profits were large, the expenditure was also high, and the FIT yield was analyzed to be low.
The least profitable trading method is net metering. In the case of EH, most generated energy is self-consumed, resulting in a lot of savings from the EH’s existing electric rates. In contrast, when the net metering was applied to ZH, it was found that the energy consumption of the building was less than that of EH, so it was not economical because the cost saving due to self-consumption was not large. The net-metering revenue of EH is higher than that of ZH.
When estimating the amount of energy to be used for P2P trading, the self-consumption ratio and the energy unit cost should be considered. P2P-Zero will maintain the energy consumption in the building at zero and then put the remaining energy into the transaction. The electric energy consumption tiers of EH, NH, and ZH are mostly Tier 2 or 3, and the applied energy charges are 0.15 USD for Tier 2 and 0.23 USD for Tier 3. However, when trading energy between individuals, it can be sold at a higher price than the energy charge of Tier 2. Therefore, it is more economical to consume only a part of the energy and sell it to consumers at a higher price. Because the P2P trading price is set to 0.19 USD, it is more effective to gain a profit by selling large amounts of energy rather than self-consumption.
The DPPs of EH, NH and ZH were 3.99–7.37, 3.83–7.37, and 3.70–9.00, respectively. The better the performance of a building, the greater the difference in DPP for each trading type. This is because the better the performance of the building, the greater the difference in the yield.

3.3.4. Sensitivity Analysis According to the Trading Price

The sensitivity analysis according to the trading unit price was only conducted for P2P-Tier1 with the best economic efficiency. The range of trading prices is a section where profits can be generated for both consumers and prosumers and is set to be more than 0.08 USD, which is the unit energy charge of progressives of Tier 1, and is less than 0.23 USD, which is the unit energy charge of Tier 3. Consumers can obtain economic benefits by purchasing energy at a cheaper rate than the unit energy charge of Tier 2 or 3 in residential progressive electric rate systems, and prosumers can sell it at a higher price than the electricity bill and LCOE of Tier 1.
The trading prices by building types that offset electricity rates and generate net profit are 0.20 USD, 0.14 USD, and 0.11 USD, as shown in Table 18. EH should deal with consumers who consume Tier 3 of the progressive electric system to generate net profit, and NH and ZH can trade with Tier 2.
Table 19 shows the economic evaluation results according to the trading price of each building type. When evaluating the economics of each building type, the revenue was calculated similar to the method in 3.3.3. Based on the NPV value of FIT, 7,025 USD, the unit trading price to secure economic feasibility of P2P trading was 0.16 USD/kWh. The minimum trading price of EH was 0.12 USD/kWh, and the minimum trading price of NH and ZH was 0.11 USD/kWh when the IRR of the trading types excluding P2P-Tier1 of each building type was applied. In the same way, if the minimum trading price is determined based on PI, that for EH is 0.10 USD/kWh, while that for NH and ZH is 0.11 USD/kWh. There is a difference in the method of calculating the economic efficiency of each index, so when selecting the minimum trading price, a difference occurs for each index.
Based on whether a net profit is generated and based on the economic evaluation with other trading methods, there may be a difference in the minimum trading price for each building type. In the case of EH, the transaction volume is smaller than that of ZH, so it is necessary to trade at a higher price than other building types to calculate the favorable amount for the prosumer. However, in the case of ZH, the transaction volume is high. Therefore, even if it is traded at a price lower than 0.15 USD/kWh, which is the energy charge of Tier 2, it will be possible to secure economic feasibility.

4. Discussion

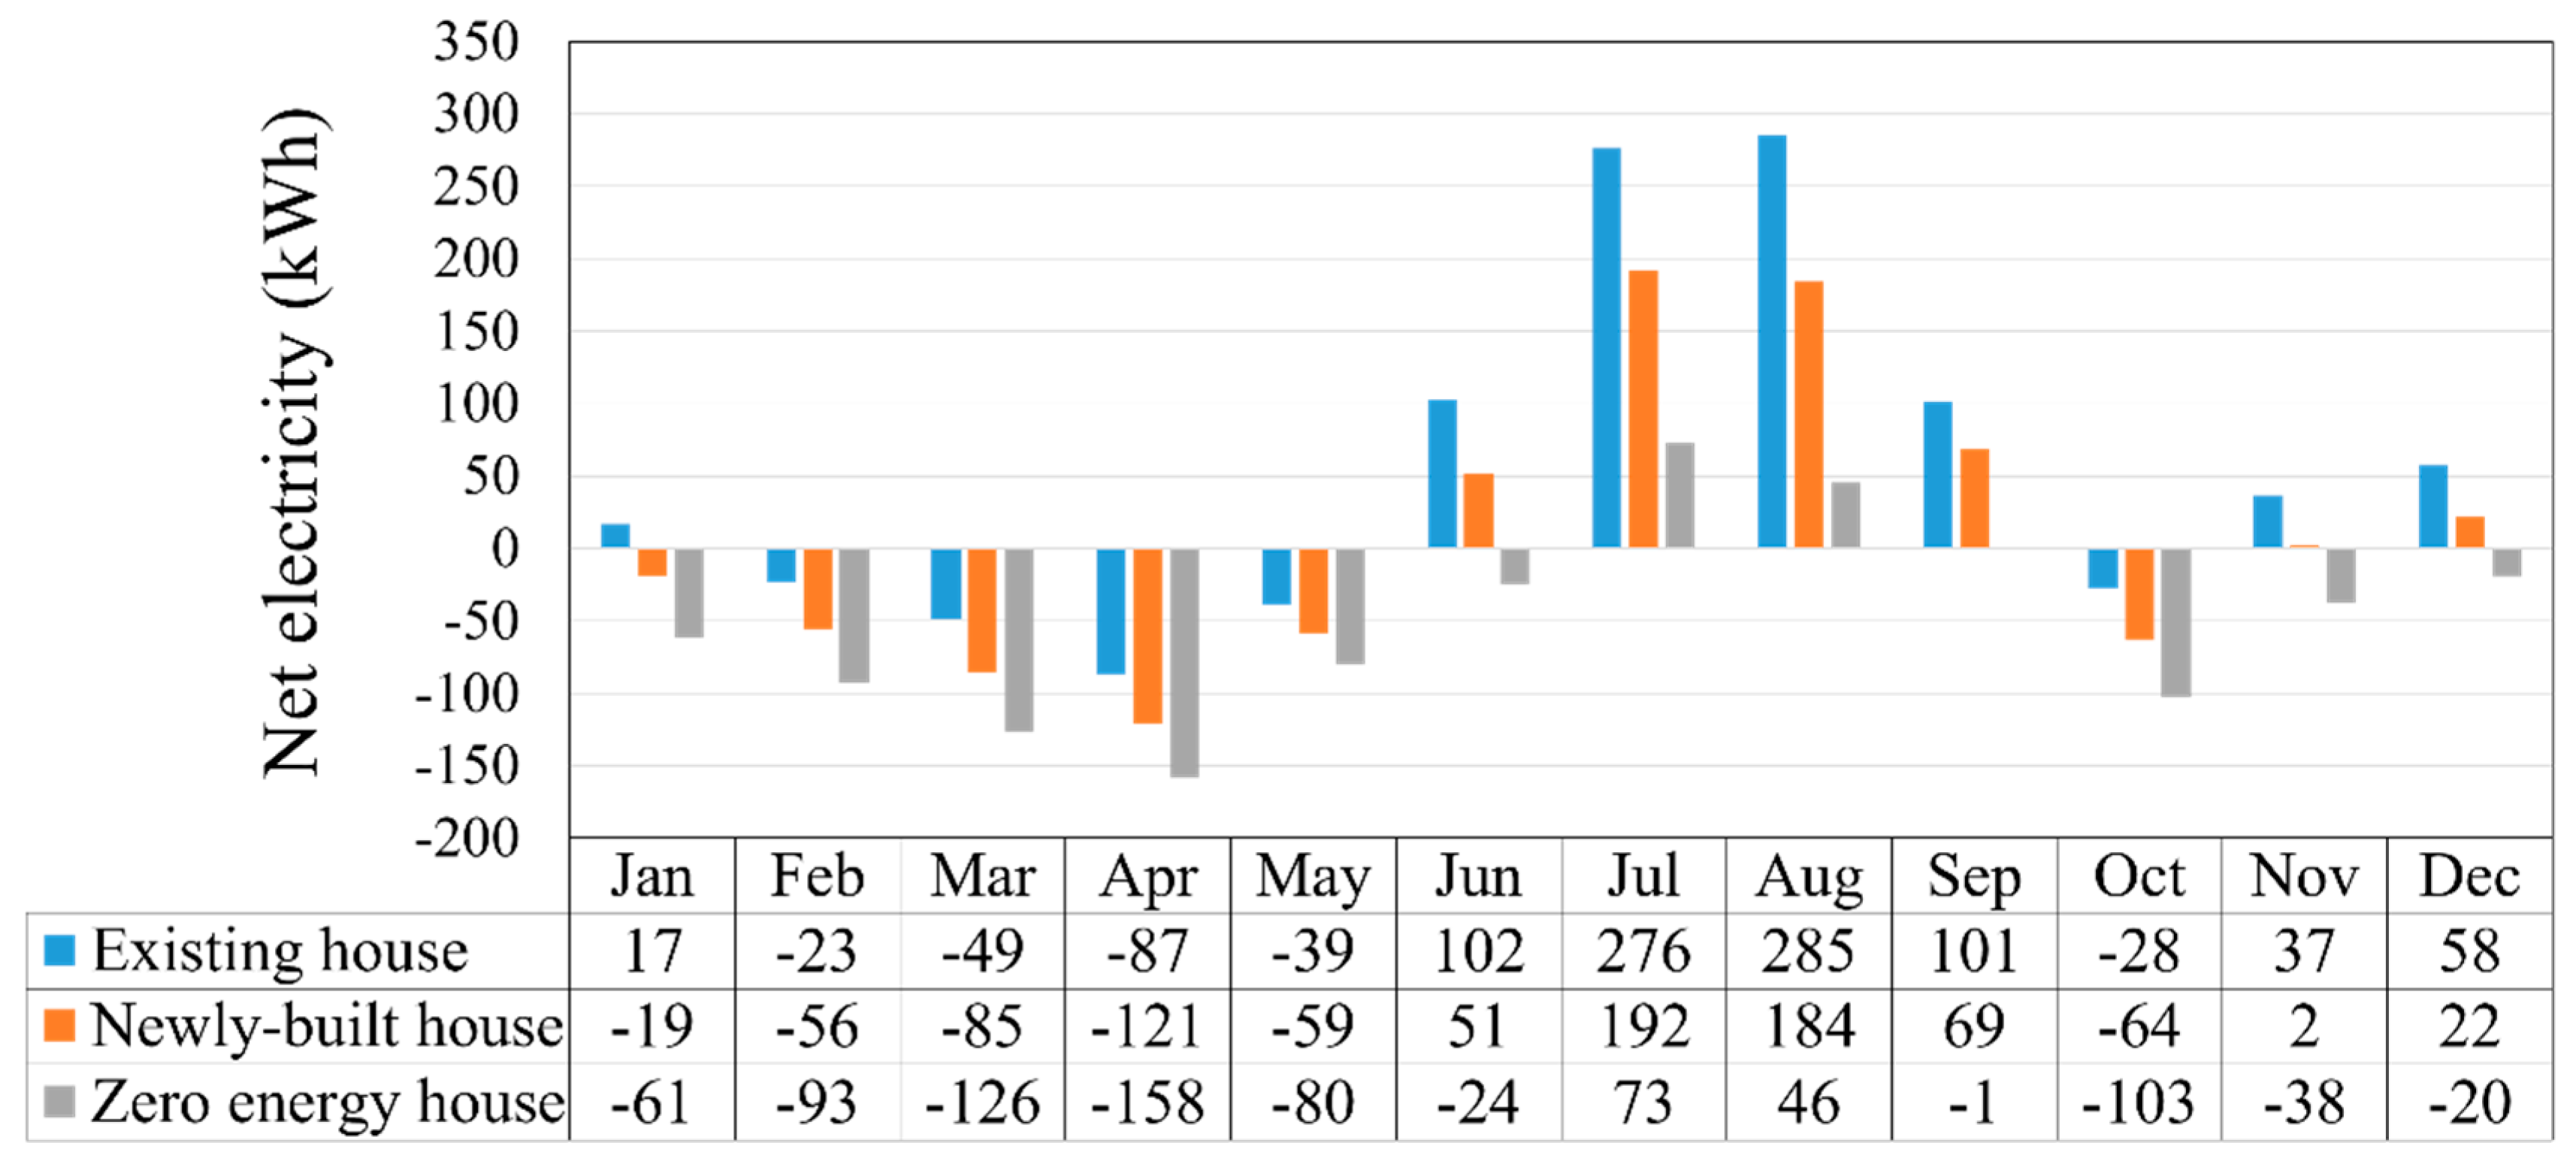
As the energy performance of a building improves, its gas energy consumption decreases dramatically. Most Korean households use gas for heating and electricity for cooling. According to the improvements in energy performances of buildings, reduction of heating energy has the largest effect, whereas the reduction rates of cooling and lighting energies have smaller effects. That is, even if the energy performance of a building is improved with ZH, a certain amount of electricity is still consumed. Although the consumption of electric energy is concentrated in the summer for cooling purposes, the installation angle of the PV system is determined based on the annual energy consumption, so the load pattern and production energy pattern do not match. Therefore, the trading type should be considered from the initial stage of the PV system installation.
Since residential buildings use progressive electricity tariffs, with different unit prices for each tier, it is not economical in the current pricing system to achieve zero electrical energy consumption in buildings by self-consumption of the produced energy. In P2P energy trading, an important factor determining the limit of self-consumption is the unit cost of electricity. Presently, the electricity unit cost for Tier 1 is 0.08 USD/kWh, which is cheaper than the profits from P2P energy trading, so it is most economical to consume the energy produced by the PV system only in excess of that allowable under Tier 1. If the unit prices of electricity increase, then these results and the associated strategies may change.
When multiple distributed generations are combined, those with different characteristics must be combined to supply power to the load, thereby requiring control technology. For stable operation, control systems are used to obtain the information on supply and demand. Real-time control of energy demand and power supply in buildings is required, and real-time energy monitoring and control are needed to maintain the electricity consumption in buildings within Tier 1. To track the load in real time, droop control is the most commonly used strategy. Since the method proposed in this work advocates consuming the energy produced in the building and trading only as much as necessary, it can help reduce congestion compared to the method of separating and controlling distributed generation and demand. The power monitoring and control methods to maintain the electricity consumption within Tier 1 can be achieved through predictive control of electricity consumption, which will be studied later. This study is therefore meaningful as it analyzes the applicability of P2P energy trading based on building energy performance.

5. Conclusions

In this study, residential buildings were classified into EH, NH, and ZH to evaluate the applicability of P2P trading according to the energy performance of buildings; it was assumed that the energy trading was on a small scale and in an individual-to-individual manner. In addition, the energy consumption of each building was analyzed to estimate the transaction amount of electricity generated by the PV system. Furthermore, economic analysis was conducted according to the trading type. The main results of this study are as follows.
  • The trading type was set to existing net metering, feed-in tariff for small-scale distributed PV systems, and P2P trading. P2P trading was subdivided into P2P-Tier 1 and P2P-Zero according to the ratio of self-consumption of the produced energy.
  • As a result of calculating the LCOE for each trading type, the minimum trading price was found to be 0.08 USD/kWh due to the drop in system installation prices and the influence of government subsidies. However, because the energy charge of the residential progressive Tier 1 was 0.08 USD/kWh, the minimum trading price was calculated to be 0.09 USD/kWh.
  • It is assumed that the transaction is conducted with a consumer who consumes a lot of electricity and is applied to Tier 3 of the progressive system, and the default trading price is assumed to be 0.19 USD/kWh considering the energy charge at Tiers 2 and 3. Economics were compared according to the trading type of each building. As a result, it was found that it is most economical to inject the remaining energy into the P2P trading after self-consuming enough to fix the energy consumption of the prosumer in Tier 1.
  • For the most economical P2P-Tier1, as a result of sensitivity analysis according to trading price, EH generated net profit at a trading price of 0.20 USD/kWh, NH generated net profit at 0.14 USD/kWh, and ZH generated net profit at 0.11 USD/kWh. The higher the building’s energy performance, the greater the range of transaction volumes to secure economics; thus, prosumers will be able to actively participate in P2P trading.
Because this study did not consider the increase in construction costs for each type of building, comparison by building type was impossible, which is a limitation of this study. EH can secure economic efficiency when the unit trading price is secured, but the consumer can be limited to the Tier 3 electricity rate. Depending on the electricity rate system, the economics of EH may fluctuate. In case of P2P trading of ZH, it was found that the electricity tariff saving compared with the existing electricity tariff of ZH is small, so the revenue is calculated to be less than that of EH. The difference in electricity rate is small compared to ZH’s existing electricity rate system, so a lesser profit than EH is calculated. However, we found that it can secure profits because of the large volume of transactions. In other words, as the energy independence of buildings increases, it is possible to secure economic feasibility of P2P trading, so that P2P trading can be activated. Currently, power transactions in Korea are divided according to the power generation capacity; hence, this study assumes that only small-scale transactions through the grid are possible and limited to solar power systems installed in buildings. In other words, this study analyzed the economic feasibility of P2P energy trading based on the unit prices of electricity rates, without comparison of the spot prices. However, when considering P2P energy trading with participation in spot market trading, the economic feasibility may fluctuate with spot price fluctuations. If the business model of P2P trading for each building type is developed based on the results of this study, the help of the government promotes the use of renewable energy.

Funding

This research was supported by the Basic Science Research Program through the National Research Foundation of Korea (NRF), which is funded by the Ministry of Science, ICT & Future Planning (NRF-2017R1C1B20117911).

Conflicts of Interest

The authors declare no conflict of interest.

Nomenclature

AEGAnnual electricity generation by PV system
CEEnergy charge
CminMinimum charge
CtotalNet payable charge
dAnnual degradation rate
DERDistributed energy resources
DPPDiscounted payback period
ECiDifference between the existing electricity rates and the reduced electricity rates due to self-consumption of electricity produced
EHExisting house
ETRiElectricity trading revenue
FElecElectric power industrial basis fund
FITFeed-in tariff for small-scale distributed PV system
ICiInitial installation cost in year i
IRRInternal rate of return
KEPCOKorea electric power corporation
LCCPVLife cycle cost of the PV system
LCEGPVLife cycle electricity generation cost of the PV system
LCOELevelized cost of electricity
nProject lifetime
NHNewly-built House
NPVNet present value
NRiNet revenue obtained in year i
OMiOperation and maintenance cost in year i
PfixFixed price
PIProfitability index
PunitUnit price
P2P Peer to peer
PVPhotovoltaics
r Real discount rate
RCiReplacement cost in year i
RECRenewable energy certificate
SMPSystem marginal price
VATValue-added tax
ZHZero-energy house

References

  1. Ruotsalainen, J.; Karjalainen, J.; Child, M.; Heinonen, S. Culture, values, lifestyles, and power in energy futures: A critical peer-to-peer vision for renewable energy. Energy Res. Soc. Sci. 2017, 34, 231–239. [Google Scholar] [CrossRef]
  2. Van der Schoor, T.; Scholtens, B. Power to the people: Local community initiatives and the transition to sustainable energy. Renew. Sustain. Energy Rev. 2015, 43, 666–675. [Google Scholar] [CrossRef] [Green Version]
  3. Espe, E.; Potdar, V.; Chang, E. Prosumer communities and relationships in smart grids: A literature review, evolution and future directions. Energies 2018, 11, 2528. [Google Scholar] [CrossRef] [Green Version]
  4. Hwang, J.; Choi, M.-I.; Lee, T.; Jeon, S.; Kim, S.; Park, S.; Park, S. Energy prosumer business model using blockchain system to ensure transparency and safety. Energy Proced. 2017, 141, 194–198. [Google Scholar] [CrossRef]
  5. Jacobs, S.B. The energy prosumer. Ecology LQ 2016, 43, 519. [Google Scholar]
  6. Ahl, A.; Yarime, M.; Tanaka, K.; Sagawa, D. Review of blockchain-based distributed energy: Implications for institutional development. Renew. Sustain. Energy Rev. 2019, 107, 200–211. [Google Scholar] [CrossRef]
  7. Kastel, P.; Gilroy-Scott, B. Economics of pooling small local electricity prosumers-LCOE & self-consumption. Renew. Sustain. Energy Rev. 2015, 51, 718–729. [Google Scholar]
  8. Park, C.; Yong, T. Comparative review and discussion on P2P electricity trading. Energy Proced. 2017, 128, 3–9. [Google Scholar] [CrossRef]
  9. Liu, N.; Yu, X.H.; Wang, C.; Li, C.J.; Ma, L.; Lei, J.Y. Energy-sharing model with price-based demand response for microgrids of peer-to-peer prosumers. IEEE Trans. Power Syst. 2017, 32, 3569–3583. [Google Scholar] [CrossRef]
  10. Ossenbrink, J. How feed-in remuneration design shapes residential PV prosumer paradigms. Energy Policy 2017, 108, 239–255. [Google Scholar] [CrossRef]
  11. Branker, K.; Pathak, M.J.M.; Pearce, J.M. A review of solar photovoltaic levelized cost of electricity. Renew. Sustain. Energy Rev. 2011, 15, 4470–4482. [Google Scholar] [CrossRef] [Green Version]
  12. Alsharif, M.H.; Kim, J.; Kim, J.H. Opportunities and challenges of solar and wind energy in south Korea: A review. Sustainability 2018, 10, 1822. [Google Scholar] [CrossRef] [Green Version]
  13. IRENA. Renewable power generation costs in 2018. In Report, International Renewable Energy Agency; International Renewable Energy Agency: Abu Dhabi, UAE, 2019. [Google Scholar]
  14. Kamran, M.; Fazal, M.R.; Mudassar, M.; Ahmed, S.R.; Adnan, M.; Abid, I.; Randhawa, F.J.S.; Shams, H. Solar photovoltaic grid parity: A review of issues and challenges and status of different PV markets. Int. J. Renew. Energy Res. 2019, 9, 244–260. [Google Scholar]
  15. Breyer, C.; Gerlach, A. Global overview on grid-parity. Prog. Photovolt. 2013, 21, 121–136. [Google Scholar] [CrossRef]
  16. Karneyeva, Y.; Wustenhagen, R. Solar feed-in tariffs in a post-grid parity world: The role of risk, investor diversity and business models. Energy Policy 2017, 106, 445–456. [Google Scholar] [CrossRef]
  17. Schwabe, U.K.W.; Jansson, P.M. Utility-Interconnected Photovoltaic Systems Reaching Grid Parity in New Jersey. IEEE PES Gen. Meet. 2010, 1–5. [Google Scholar] [CrossRef]
  18. Consortium, G.B. Study on “Residential Prosumers in the European Energy Union”. Growth from Knowledge, Lovaina(Bélgica). Available online: https://ec.europa.eu/commission/sites/beta-political/files/study-residential-prosumersenergy-union_en.pdf (accessed on 10 April 2020).
  19. 2018. Available online: https://www.iea.org/data-and-statistics/charts/household-electricity-prices-in-select-iea-countries-2018 (accessed on 10 April 2020).
  20. Jogunola, O.; Ikpehai, A.; Anoh, K.; Adebisi, B.; Hammoudeh, M.; Son, S.Y.; Harris, G. State-of-the-art and prospects for peer-to-peer transaction-based energy System. Energies 2017, 10, 2106. [Google Scholar] [CrossRef] [Green Version]
  21. Baghaee, H.R.; Mirsalim, M.; Gharehpetian, G.B.; Talebi, H.A. Reliability/cost-based multi-objective Pareto optimal design of stand-alone wind/PV/FC generation microgrid system. Energy 2016, 115, 1022–1041. [Google Scholar] [CrossRef]
  22. Pillai, G.G.; Putrus, G.A.; Georgitsioti, T.; Pearsall, N.M. Near-term economic benefits from grid-connected residential PV (photovoltaic) systems. Energy 2014, 68, 832–843. [Google Scholar] [CrossRef]
  23. Delgado, B.M.; Cao, S.L.; Hasan, A.; Siren, K. Thermoeconomic analysis of heat and electricity prosumers in residential zero-energy buildings in Finland. Energy 2017, 130, 544–559. [Google Scholar] [CrossRef] [Green Version]
  24. Camillo, F.M.; Castro, R.; Almeida, M.E.; Pires, V.F. Economic assessment of residential PV systems with self-consumption and storage in Portugal. Sol. Energy 2017, 150, 353–362. [Google Scholar] [CrossRef]
  25. Oberst, C.A.; Schmitz, H.; Madlener, R. Are Prosumer Households that much different? Evidence from stated residential energy consumption in Germany. Ecol. Econ. 2019, 158, 101–115. [Google Scholar] [CrossRef]
  26. Construction Standards for Energy Conserving Eco-Friendly Housing. Republic of Korea Code, Notice No. 2019-537. 2019.
  27. Kim, M.H.; Kim, J.K.; Lee, K.H.; Baek, N.C.; Park, D.Y.; Jeong, J.W. Performance investigation of an independent dedicated outdoor air system for energy-plus houses. Appl. Therm. Eng. 2019, 146, 306–317. [Google Scholar] [CrossRef]
  28. Lee, J.; Cho, Y. Estimation of the usage fee for peer-to-peer electricity trading platform: The case of South Korea. Energy Policy 2020, 136, 111050. [Google Scholar] [CrossRef]
  29. Darling, S.B.; You, F.Q.; Veselka, T.; Velosa, A. Assumptions and the levelized cost of energy for photovoltaics. Energy Environ. Sci. 2011, 4, 3133–3139. [Google Scholar] [CrossRef]
  30. Palmer, J.; Sorda, G.; Madlener, R. Modeling the diffusion of residential photovoltaic systems in Italy: An agent-based simulation. Technol. Forecast. Soc. 2015, 99, 106–131. [Google Scholar] [CrossRef]
  31. Ye, L.C.; Rodrigues, J.F.D.; Lin, H.X. Analysis of feed-in tariff policies for solar photovoltaic in China 2011–2016. Appl. Energy 2017, 203, 496–505. [Google Scholar] [CrossRef]
  32. Jordan, D.C.; Kurtz, S.R. Photovoltaic degradation rates-an analytical review. Prog. Photovolt. 2013, 21, 12–29. [Google Scholar] [CrossRef] [Green Version]
  33. Green Together. Building Energy Statistics. Available online: www.greentogether.go.kr (accessed on 4 April 2020).
  34. Jäger-Waldau, A. PV Status Report 2019, EUR 29938 EN; Publications Office of the European Union: Luxembourg, 2019. [Google Scholar]
  35. IRENA. Competitiveness Indicators: Rooftop Solar PV; International Renewable Energy Agency: Abu Dhabi, UAE, 2017. [Google Scholar]
Figure 1. Plan of the simulation model.
Energies 13 03568 g001
Figure 2. Energy use intensity by building types.
Energies 13 03568 g002
Figure 3. Monthly net electricity by building types.
Energies 13 03568 g003
Table 1. Simulation building parameters.
CategoryParameters
Building typeDetached house
LocationSeoul, S. Korea
Longitude126.97°
Latitude37.57°
Building area83.16 m2
Number of floor1
OrientationFull southern aspect
Floor height3.0 m
Ceiling height2.5 m
Roof typeFlat roof
Table 2. Weather conditions.
MonthOutside Dry-Bulb Temperature (°C)Outside Dew-Point Temperature (°C)Air Speed (m/s)Direct Normal Irradiation
(kWh/m2)
Diffuse Horizontal Irradiation
(kWh/m2)
January−1.4−9.52.374.733.5
February1.1−7.82.564.145.4
March6.0−3.22.872.064.3
April12.52.82.775.480.0
May18.29.42.469.695.6
June22.115.22.261.387.8
July24.919.92.141.073.4
August25.619.92.149.677.2
September21.114.31.864.366.0
October15.27.51.972.057.6
November7.2−0.42.158.538.5
December0.5−7.72.360.331.9
Table 3. The national standard for building envelope by year and passive house standard for the building envelope (unit: W/m2K).
StandardRevision YearExternal WallRoofFloorWindow and Door
The national building code2001–20130.4700.2900.5203.840
2013–20150.2700.1800.3502.100
2018–0.2400.1500.2401.500
Passive house0.1500.1200.1500.800
Table 4. Input variables by building types.
VariablesEHNHZH
External wall U-value (W/m2K)0.4690.2350.150
Roof U-value (W/m2K)0.2900.1790.120
Floor U-value (W/m2K)0.5130.2390.150
Total solar transmission of window (SHGC)0.8440.6300.400
Light transmission of window0.8840.6900.430
Window U-value (ISO 15099/NFRC) (W/m2K)3.8401.5000.800
Infiltration (ACH)2.01.00.6
Occupancy density (people/m2)0.05760.05760.0576
Lighting density (W/m2)108.04.7
Miscellaneous (W/m2)6.46.46.4
Table 5. Specifications of the heating and cooling system.
HVAC Systems TypeSpecification
HeatingSystem typeHeated floor, Hot water
Boiler efficiency92%
Fuel typeNatural gas
Heating setpoint temperature20 °C
Heating setback temperature13 °C
Operation periodNovember–March
CoolingSystem typeAir conditioner
Fuel typeElectricity
COP3.5
Cooling setpoint temperature26 °C
Cooling setback temperature30 °C
Operation periodMay–September
Table 6. Specifications of the PV system.
CategoryParameters
Cell typeMonocrystalline Silicon
Installed PV power capacity3 kW
Number of a module in series10
Number of cells in a module60
Size of a module1670 × 1000 × 32 mm
Active area of a module1.46 m2
Power at max power (PMPP)300 W
Short circuit current (Isc)9.83 A
Module current at max power (IMPP) 9.28 A
Temperature coefficient of short circuit current (α)0.04 %/K
Open circuit voltage (Voc)39.76 V
Module voltage at max power (VMPP)32.41 V
Temperature coefficient of short circuit voltage (β)−0.28 %/K
Array slope35°
Azimuth
Inverter capacity3 kW
Inverter efficiency95%
Table 7. Progressive electricity tariffs for residential services.
TierEnergy Consumption Range(kWh)Minimum Charge (USD/household)Energy Charge (USD/kWh)
General Month Expect July and AugustJuly and August
10–2000–3000.750.08
2201–400301–4501.320.15
3401–451–6.000.23
Note: The exchange rate (KRW/USD) is 1,216.00 won to a U.S. dollar (as of 26 February 2020).
Table 8. Electricity tariffs for low voltage general and educational services.
Use TypeMinimum Charge (USD/Consumer)Energy Charge (USD/kWh)
Summer
(June–August)
Spring & FallWinter
(November–February)
General 5.070.090.050.08
Educational4.300.080.050.07
Note: The exchange rate (KRW/USD) is 1216.00 won to a U.S. dollar (as of 26 February 2020).
Table 9. Trading types depending on the energy consumption range.
TypesProsumer’s Electricity ConsumptionTimeProgressive Tariff Tier According to Prosumer’s Electricity Usage
P2P-Tier 1Maximum range of tier 1, 200 or 300 kWh depending on a monthMonthly1
P2P- Zero0 kWh expect the month which is less generating than consumptionMonthly0
Table 10. Assumptions for economic assessment.
CategoryParameters
Analysis point 2020
Life time of PV system25 years
Installation cost of 3 kW PV system4135 USD
Subsidy of 3 kW PV systems2043 USD
Operation and management cost1% of the installation cost
Real discount rate of interest0.75%
Replacement cost 9.5% of the installation cost
Replacement cycle13 year
Degradation rate of PV system0.5%
Table 11. Annual energy consumption by end uses.
Building TypeEHNHZH
End use energy typeElectricityNatural gasElectricityNatural gasElectricityNatural gas
End uses (kWh)Heating20.414,253.615.66542.94.0515.2
Cooling784.70669.50438.50
Lighting1149.20857.80522.40
Fan369.70247.10124.60
Interior equipment1937.501937.601937.50
Domestic hot water0725.50725.20725.2
Total energy (kWh)4261.414,979.23727.57268.03026.91240.4
Total energy per total building area (kWh/m2)55.0193.248.193.739.016.0
Table 12. Annual electricity consumption and PV power generation.
Energy TypesAnnual Electricity (kWh)Electricity Per Total Building Area (kWh/m2)
Building TypesEHNHZHEHNHZH
Total site energy19,240.610,995.54267.3248.2141.855.0
PV power generation3611.43611.43611.446.646.646.6
Net site energy15,629.27384.1655.9201.695.38.5
Table 13. Monthly electricity charges.
Building TypesEHNHZH
MonthElectricity Usage
(kWh)
TierTotal Charges
(USD)
Electricity Usage
(kWh)
TierTotal Charges
(USD)
Electricity Usage
(kWh)
TierTotal Charges
(USD)
1298.8236.30262.6229.94221.1222.64
2269.2231.09236.5225.36199.3118.24
3296.6235.91260.6229.59219.7222.40
4284.1233.72250.1227.75212.5221.14
5331.1241.97310.8238.41289.4234.64
6422.4365.28371.2249.02295.9235.79
7515.7389.76431.1259.55313.1238.81
8563.63102.34462.8375.90324.3240.78
9400.8359.61368.9248.61299.2236.38
10294.3235.51258.7229.26219.6222.39
11286.8234.19252.0228.08212.4221.12
12298.3236.21262.1229.86220.6222.56
Yearly totals4261.4-601.903727.5-471.333026.9-336.89
Table 14. LCOE by trading types.
Trading TypesNet MeteringFITP2P
LCOE(USD/kWh)0.0430.0710.064
Table 15. Annual net electricity charges by trading types (unit: USD).
Building TypeTrading TypeAnnual Electricity Charges (A)Revenues by Electricity Trading (B)Platform Charge for P2P (C)Net Electricity Charges (D = A − B + C)
EHExisting electricity plan601.9000601.90
Net metering156.9400156.94
FIT601.90630.030−28.13
P2P-Tier1306.55370.0066.02.06
P2P-Zero169.1442.8427.5153.80
NHExisting electricity plan471.3300471.33
Net metering89.220089.22
FIT471.33630.030−158.70
P2P-Tier1276.76471.9566.0−129.19
P2P-Zero113.0576.6233.069.43
ZHExisting electricity plan336.8900366.89
Net metering55.820055.82
FIT336.89630.030−293.14
P2P-Tier1255.31605.0566.0−283.75
P2P-Zero63.08129.9244.0−22.84
Table 16. Self-consumption and transmission of generated energy (unit: kWh/yr).
Building TypeTrading TypeSelf-ConsumptionTransmission to the Gird or Trading P2P
EHNet metering3611.40
FIT03611.4
P2P-Tier11661.41950.0
P2P-Zero3385.9225.5
NHNet metering3611.40
FIT03611.4
P2P-Tier11127.52483.9
P2P-Zero3208.1403.3
ZHNet metering3026.90
FIT03611.4
P2P-Tier1426.93183.7
P2P-Zero2927.6683.8
Table 17. Results of economic analysis by building types and trading types.
Building TypeTrading TypeNPV (USD)IRR (%)PI (%)DPP (Year)
EHNet metering5942184.15.28
FIT7025123.07.37
P2P-Tier18403256.23.99
P2P-Zero5474174.65.33
NHNet metering4640153.66.27
FIT7025123.07.37
P2P-Tier18634246.53.83
P2P-Zero4563154.26.03
ZHNet metering254892.69.00
FIT7025123.07.37
P2P-Tier18901266.63.70
P2P-Zero3725133.96.89
Table 18. Annual net electricity charges by trading price.
Trading Price (USD/kWh)EHNHZH
Income (USD)Net-Charge Including Platform Charges (USD)Income (USD)Net-charge Including Platform Charges (USD)Income (USD)Net-Charge Including Platform Charges (USD)
0.09175.50197.06223.55119.20286.5334.78
0.10195.00177.56248.3994.36318.372.94
0.11214.50158.06273.2369.53350.20−28.90
0.12234.00138.56298.0744.69382.04−60.74
0.13253.50119.06322.9119.85413.88−92.57
0.14273.0099.56347.75−4.99445.71−124.41
0.15292.5080.06372.59−29.83477.67−156.37
0.16312.0060.56397.43−54.67509.52−188.21
0.17331.5041.06422.27−79.51541.36−220.06
0.18351.0021.56447.11−104.35573.21−251.90
0.19370.502.06471.95−129.19605.05−283.75
0.20390.00−17.44496.79−154.03636.90−315.59
0.21409.50−36.94521.63−178.87668.74−347.44
0.22429.00−56.44546.47−03.71700.59−379.28
Table 19. Results of economic analysis by trading price.
Trading Price (USD/kWh)EHNHZH
NPV (USD)IRR (%)PI (%)DPP (yr)NPV (USD)IRR (%)PI (%)DPP (yr)NPV (USD)IRR (%)PI (%)DPP (yr)
0.094583.5154.56.03768.9133.87.02662.9103.38.5
0.104965.4164.75.74255.4144.46.53286.5113.97.5
0.115347.3174.95.44741.9154.66.03910.0134.26.7
0.125729.2185.15.15228.4164.95.64533.5154.56.1
0.136111.1195.34.95714.9185.15.35157.1164.85.6
0.146493.1205.54.76201.4195.35.05780.6185.15.2
0.156875.0225.74.46687.9205.64.46406.5205.44.8
0.167256.9225.84.37174.4215.84.37030.2215.74.5
0.177638.8236.04.17660.9236.04.17653.9236.04.2
0.188020.7246.24.08147.3246.34.08277.6246.33.9
0.198402.6256.43.88633.8256.53.88901.3266.73.7
0.208784.5266.63.79120.3266.83.79525.0277.03.5
0.219166.4276.83.69606.8277.03.610,148.7297.33.3
0.229548.4287.03.510,093.3297.23.510,772.4317.63.2

