Abstract
Large-scale introduction of electric vehicles (EVs) to the market sets outstanding requirements for battery performance to extend vehicle driving range, prolong battery service life, and reduce battery costs. There is a growing need to accurately and robustly model the performance of both individual cells and their aggregated behavior when integrated into battery packs. This paper presents a novel methodology for Lithium-ion (Li-ion) battery pack simulations under actual operating conditions of an electric mining vehicle. The validated electrochemical-thermal models of Li-ion battery cells are scaled up into battery modules to emulate cell-to-cell variations within the battery pack while considering the random variability of battery cells, as well as electrical topology and thermal management of the pack. The performance of the battery pack model is evaluated using transient experimental data for the pack operating conditions within the mining environment. The simulation results show that the relative root mean square error for the voltage prediction is 0.7–1.7% and for the battery pack temperature 2–12%. The proposed methodology is general and it can be applied to other battery chemistries and electric vehicle types to perform multi-objective optimization to predict the performance of large battery packs.
1. Introduction
The automotive industry has faced a paradigm shift towards electromobility in recent years to reduce greenhouse gas emissions, air pollution, and dependence on fossil fuels [1]. Therefore, Lithium-ion (Li-ion) battery storage systems have undergone a substantial growth in popularity, as they play an indispensable role in emerging electric vehicles (EVs) [2,3]. Battery-powered EVs present a thriving solution not only for road transport, but also for mines, which are under mounting pressure to increase effectiveness, optimize productivity, and reduce operational costs.
Fully electric off-road vehicles that are used in mining and construction are indeed one of the most promising EV applications, as they have several prominent advantages over their conventional counterparts. Driving off-road electric vehicles has a positive impact to the environment, as they generate zero emissions during the operation. For example, electric mining vehicles provide a great improvement in underground air quality, as the heavily generated exhaust gasses from diesel machines are completely removed [4,5]. It should be noted that the off-road vehicles operate under different driving cycles as compared to regular road vehicles. They are characterized by low operational speeds or stationary conditions, as well as high torque and power demands. The latter require large battery packs, which consist of many individual battery cells that are interconnected mechanically and electrically. Moreover, while electric off-road vehicles produce very little heat, which is beneficial in harsh underground conditions where temperatures often reach high values, there are some concerns regarding the safety of the vehicle batteries themselves. Namely, Li-ion batteries are known to be prone to overheating, potentially leading to a hazardous condition. Hence, the operating temperatures and temperature gradients within the battery pack are strongly affecting the performance and safety of the vehicles. Therefore, comprehensive evaluations of battery packs require understanding of complex electrochemical thermally coupled phenomena that occur at different time scales (from nanosecond reaction times to several years long aging processes) and different length scales (from the atomic nanoscale to the pack macroscale) [6]. Multiphysics-multiscale modeling and simulations provide a powerful framework to address the challenges of the battery packs that are inherently related to the properties of battery cells [7], as well as to consider the interactions between the cell and pack levels. One of the main challenges with battery system modeling is the trade-off between model complexity and model fidelity to reduce the computational requirements and the amount of data needed for their creation and execution. The development of such robust modeling framework goes together with strong incentives to expand the existing in-situ (as batteries are cycled) techniques to not only monitor the important battery states, but also to assist the design and optimisation of new materials and electrochemistries [8]. In this manner, it is possible to develop the next-generation high-energy battery technologies, e.g., by identifying novel high-voltage cathode materials and suitable high-voltage electrolytes to increase the energy density of battery cells and hence downsize the battery pack without reducing its energy content [9].
This work presents the modeling methodology for a battery pack simulation for an electric mining vehicle under typical operating conditions. The approach robustly scales up validated Li-ion cell models to pack system-level simulations to identify and predict non-uniform property distributions and interactions within the battery pack. The calibration and parameter identification procedure, herein referred to as calibration optimization uniquely combines electrochemical-thermal models and electrical circuit-based models with data-driven techniques that rely on the experimental measurements of the individual cells and the entire pack.
2. Background and Research Gap
Modeling of Li-ion batteries is of crucial importance in the design, evaluation and control stages of the battery cells and packs in different applications [10]. Among different approaches, the equivalent circuit models (ECM) [11] and the high-fidelity electrochemical models [12] are the most popular ones. Even though ECMs are computationally efficient and can easily be calibrated to experimental data, they fail in providing sufficient insight about the inner physical states of the battery and have lower accuracy and predictability in comparison with the electrochemistry-based models [13]. Within the class of the electrochemical models, the pseudo two- dimensional (P2D) model considers the major principles of the transport phenomena in a Li-ion battery cell and it is used for a wide variety of applications [14]. The P2D model is usually coupled with a thermal model to investigate heat generation and dissipation rates and hence predict cell temperature evolution [15]. The electrochemical-thermal model is composed of a diverse set of parameters, including cell engineering design specifications and material properties which influence the model predictive capability. Therefore, model calibration and parameter identification play a pivotal role in the model predictability and accuracy.
At the cell level, two methods have been proposed in the literature for the electrochemical models’ parametrization. In the first method, the cell geometry and physico-chemical properties are measured by performing cell teardown and conducting extensive experimental elaborations [16,17]. For instance, Hosseinzadeh et al. [18] provided a systematic approach to experimentally extract the cell electrochemical-thermal properties and dimensions of a large format Li-ion pouch cell. Prada et al. [19] obtained cell design parameters of a commercial Li-ion cylindrical cell by applying the electrochemical characterization tests at both electrodes and cell dimensions. The second method utilizes mathematical and optimization techniques for the model calibration purpose [10,20]. For example, Tagade et al. [13] proposed a Bayesian calibration method for a P2D-thermal model parameters estimation. Santhanagopalan et al. [21] applied recursive least squares methods to identify the kinetic and diffusional properties of a Li-ion cell while using single particle models. Optimization based calibration using heuristic techniques, like genetic algorithm, has also been successfully implemented in the parameter identification of the Li-ion cell electrochemical-thermal models [22,23,24].
Speaking of the battery pack level, the Li-ion cell model is usually coupled with the electrical domain to investigate the cell-to-cell variations [25]. Brand et al. [26] employed a simplified model for two Li-ion cells with constant resistance, which were connected in parallel in order to evaluate the current imbalances in a simple battery pack. Bruen et al. [27] used an equivalent circuit model for Li-ion cells and investigated the electrical and thermal performance of a battery pack made of four parallel cells with different states of health. Neupert et al. [28] studied the current and voltage inhomogeneities in a battery pack that arose from the cell positions and load terminals. For this purpose, four parallel cells with different internal resistances and nominal capacities were modeled using equivalent circuit approach. Hosseinzadeh et al. [3] combined the electrochemical-thermal model of a large format pouch cell based on the P2D approach with the electrical model of a battery pack composed of five parallel cells of the same type. The aim was to investigate the role of the interconnection resistance and thus capture the effect of cell-to-cell extrinsic variations on the overall performance of the pack. Liu et al. [29] used the single particle model for Li-ion cells to build a battery pack that consists of six parallelly connected cells to study the impact of cell-to-cell variations and temperature gradients on the performance and aging of the battery pack. However, using the single particle model leads to model inaccuracy in voltage prediction due to neglecting electrolyte dynamics, especially under high current operating conditions (higher than 1C) typically occurring in automotive applications.
System-level modeling and analysis of battery packs is scarce in the literature. The vast majority of existing studies have used electrical or simplified electrochemical cell models in the battery pack modeling framework and performance assessment. Moreover, the battery pack behavior has been oversimplified by only using several parallelly connected cells. The aim of this paper is to fill in the knowledge gap by proposing a novel methodology to integrate the validated electrochemical-thermal models of the Li-ion cells into battery pack simulations by employing the calibration optimization procedure that utilizes experimental measurements under realistic operating conditions of the pack. The simulations are carried out in GT-AutoLion, which is the industry-leading Li-ion battery simulation software. The experimental data are provided by Northvolt AB, a European manufacturer of the next-generation Li-ion battery cells and complete battery systems.
3. Experimental Tests
The experimental tests were provided by Northvolt AB for both individual cells and the whole battery pack. The following sections provide information for each testing protocol.
3.1. Cell Experiments
The experimental data concern Li-ion cylindrical battery cells made of graphitic anode and lithium nickel manganese cobalt oxide (NCM) cathode. Cell experiments were performed for four random samples to address the intrinsic cell-to-cell variations originating from the manufacturing process. Each cell sample firstly underwent low rate capacity check at C/20 discharge current from its fully charged state until the lower cut-off voltage was reached. This low operating C-rate prevented the cell dynamics from being excited and, hence, the measured terminal voltage represented the open circuit voltage (OCV) characterization.
Cycling tests comprising charge and discharge states and in-between rest periods were conducted in a continuous manner. The cycling tests were designed to reflect the actual operating conditions of an electric mining vehicle. For that purpose, the depleted cells were subjected to the C/3 constant current (CC) charge stage followed by the constant voltage (CV) charging regime until the current reduced to C/20. The charged cells then underwent the period of rest, followed by the discharge process at the C/5 current rate until the lower cut-off voltage threshold was reached. The discharged cells experienced the same rest interval as after being fully charged before the next cycle begun. The cycling experiments with identical charging and relaxation strategies were repeated for two more discharge rates of C/2 and 1C. The cells’ surface temperatures were measured during the whole cycling profile while the ambient temperature was kept nearly constant.
3.2. Battery Pack Test Scenarios
The battery pack consists of individual cells connected in series and parallel to fulfill the load demand of the mining vehicle. The pack was thermally managed using liquid cooling and its performance was tested by implementing three scenarios.
The first scenario included two-step CC charging first at a C/2 rate followed by a C/3 rate until reaching the predefined upper cut-off voltage of the pack. Afterwards, the pack was subject to CV charging stage until the current rate was lower than C/20. After a period of rest, the pack was discharged by a 1.5 C rate and the test was terminated either when the lower cut-off voltage was reached or when the temperature exceeded its maximum allowable value. In the second testing scenario, the same charge and rest strategies were applied; however, the pack was discharged by a C/2 current rate afterwards. A three-step CC charge regime, including 1.1 C, C/2, and C/3 rates, was considered for the third scenario, while CV charge, rest and discharge sequences were the same as in the first scenario. Cell-to-cell temperature variations were measured during cycling scenarios while using several sensors that were located in different positions within the pack. The initial pack temperatures were nearly the same as the ambient temperature in all three scenarios.
4. Model Calibration Optimization Methodology
The proposed calibration optimization methodology is categorized into two main parts, including cell calibration and battery pack calibration, which are explained in detail in Section 4.1 and Section 4.2, respectively.
4.1. Cell Model Calibration
First, the cell model is described briefly in Section 4.1.1 for the purpose of completeness. The calibration of the parameters of the cell model comprising two main steps is described afterward. The first step considers the OCV calibration (Section 4.1.2) to capture the cell balance and the second step is the cycling calibration (Section 4.1.3), which reflects the cell dynamic response under cycling.
4.1.1. Electrochemical-Thermal Cell Model
Li-ion batteries belong to the category of rechargeable battery types in which Li ions shuttle back and forth between negative and positive electrodes during discharge and charge processes [2]. A Li-ion electrochemical cell sandwich comprises three main compartments: a porous negative electrode (anode), a porous positive electrode (cathode), and a separator, as illustrated in Figure 1. The cell is commonly filled with an electrolyte made of solvent and Li- salt to facilitate the mobility of Li-ions [30].
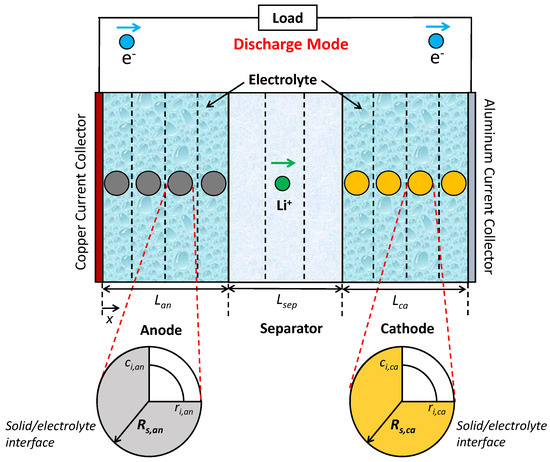
Figure 1.
A schematic representation of the Li-ion cell sandwich operation during discharge mode together with finite control volume based discretization approach.
The cell electrochemical model used in this work is based on the pseudo two-dimensional (P2D) framework developed by Newman’s group [31]. The mathematical formulation of the Li-ion cell is governed by species and charge conservation in both solid (electrode) and liquid (electrolyte) phases, as well as electrochemical kinetics [3]. Anode, separator, and cathode are discretized along the cell thickness while using the finite control volume approach to solve the governing equations. Each control volume of the anode and cathode includes one spherical particle discretized in radial direction and it is a representative of the active material occupying the porous electrodes [15].
In a Li-ion cell, the Li concentration distributions within the solid and electrolyte phases are expressed by Fick’s second law. Moreover, Ohm’s law is used to describe the variation of the solid and electrolyte phase potentials. Charge and mass conservation equations are integrated through the intercalation current density via the Butler–Volmer equation, which defines cell electrochemical kinetics. Appendix A summarizes the governing equations of the P2D electrochemical-thermal model and the most relevant equations for the purpose of the model parameterization are integrated into the cycling calibration optimization section (Section 4.1.3).
4.1.2. OCV Calibration Optimization
The OCV calibration is the first step of Li-ion cell model calibration and state estimation [32,33]. For this aim to be achieved, a precise characterization of cell balance is of crucial importance. Cell balancing defines the amount of Li in the anode and cathode at 0% and 100% of SOC and it identifies how the electrodes are balanced [10].
There are three groups of parameters that influence the cell balance and OCV calibration:
- Electrode Loading
Electrode loading is the capacity of an electrode per unit area of the electrode and it specifies how much active material is occupied in the electrode. The areal capacity ratio of negative to positive electrode ( ratio) relates the electrode loading of an anode () to that of a cathode (), i.e.,
- First Charge/Discharge Capacity (FCC/FDC)
During the first charge and discharge cycles, a portion of the cell Li inventory is lost due to the initial formation of the solid electrolyte interphase (SEI) layer. The specific first charge and discharge capacities are defined to address Coulombic efficiencies of the first charge and discharge cycles when initial lithiation of the active material takes place.
- OCV of Fully Charged Cell
OCV of a fully charged cell determines the initial point of the capacity check test. During this test, the cell undergoes a low rate (lower than C/20) discharge process to specify maximum deliverable capacity under a predefined operating voltage window recommended by the cell manufacturer.
Based on the importance of these three set of parameters, seven influential factors as summarized in Table 1 play the key role in achieving the cell balance and performing the OCV calibration.

Table 1.
Influential factors for identifying cell balance and OCV curve.
In the first stage of the OCV calibration, the sensitivity analysis-based pre-optimization step is performed to capture the cell balance. First, the cathode capacity loading is altered to pre-calibrate the overall capacity of the cell. Subsequently, the ratio is varied to provide good agreement with the experimental data in the middle part of the OCV discharge curve, which represents the most probable operating range of the physical cell. These pre-calibrated values, together with material dependent FCC/FDC properties and fully charged cell OCV estimation based on experiments, are used in the second stage where the cell OCV is calibrated using the optimization routine.
The second stage of the OCV calibration involves the optimization objective to minimize the root mean square error (RMS) between the simulated and experimental OCV predictions [34],
where, here is the simulated cell capacity and and are the minimum and maximum allowable values of the cell capacity fed to the optimization routine.
4.1.3. Cycling Calibration Optimization
In Section 4.1.2, low rate capacity check experiments were used for calibrating the cell OCV. However, under actual working conditions, the battery cells experience significantly higher C-rates than those in OCV tests, which lead to mass and charge transport limitations within the cell. Factors that cause the major impact on cell response during cycling must be selected in order to successfully perform the calibration optimization procedure. The literature review shows that there is no consensus on choosing factors affecting cell cycling response [10]. Some researchers suggest highly sophisticated identification frameworks that take into account more than fifteen influential parameters [22], while others believe that utilizing less than five factors is sufficient for achieving this aim [10,35,36]. Accurate selection of the number of influential factors depends highly on the model prediction capability, the cell chemistry, as well as the availability and the level of details concerning the cell geometry and the material properties.
Bergveld et al. [37] decouple solid phase overpotentials into Li diffusion overpotential and kinetic or reaction overpotential in both electrodes. Moreover, electrolyte overpotentials due to migration and diffusion are divided into two terms in the work of Prada et al. [19]. The first term depends on Li concentration distribution along the cell thickness, whereas the second term expresses electro-migration in electrolyte phase, and it is known as a part of the ohmic resistance. On this basis, diffusion, kinetic, and ohmic overpotentials need to be identified in any kind of cycling calibration procedure. The main factors that affect each of the aforesaid overpotentials are presented herein.
- Diffusion Overpotential
The solid phase diffusion limitation is expressed by Fick’s second law as:
where is the Li concentration, is the solid phase diffusion coefficient, is the intercalation current density, F is the Faraday’s constant, and represents the interfacial surface area which depends on the solid phase volume fraction and the particle radius () [19]. It is well understood that the solid phase diffusion coefficients () controls mass transport overpotential [21,38]. However, the cell voltage shows remarkably less sensitivity to the anode diffusion coefficient for the Li cobalt-oxide (LCO) cells in comparison with the other parameters [21].
Applying Fick’s second law in the electrolyte phase results in:
where is the effective diffusivity in the electrolyte, is the porosity, is the current density and stands for the Li-ion transference number [3]. Here, diffusion inside the liquid phase is controlled by the electrolyte phase diffusivity () [10,36].
- Kinetic Overpotential
Botler–Volmer relationship governs the solid phase electrochemical kinetics:
where is the exchange current density, is the charge transfer coefficient, R is the universal gas constant, and T stands for absolute cell operating temperature. Furthermore, represents cell overpotential, which is calculated by subtracting cell operating voltage from the open circuit potential [39]. As mentioned by Li et al. [22], the exchange current density () is the adjustable parameter to regulate the kinetic overpotential.
- Ohmic Overpotential
The ohmic resistance within the cell originates from the migration inside the electrolyte, the resistivity of the current collectors and the electrodes, as well as the contact resistance between the electrodes and the current collectors. The contact resistance () between the electrodes and the current collectors is commonly used for tuning the ohmic resistance to obtain a good voltage match between the simulation and experimental values in the mid-SOC range of the voltage curve [10,40]. Therefore, the contact resistance is introduced into the voltage equation as:
where V is the cell voltage, is the solid phase potential, is the contact resistance, A is the electrode plate area, and I is the applied current [10].
- Temperature Effect
A lupmed energy conservation model is applied to correlate the cell temperature (T) evolution to the generated heat inside the cell and the convective dissipated heat to the ambient as:
where h is the heat transfer coefficient, is the cooling medium temperature, is the cell outer surface area, and is the total heat generated within the cell [15,18]. Arrhenius’s law is used to correlate the value of the physico-chemical properties to the cell temperature [19]. The heat transfer coefficient (h) is used to consider the coupling between the cell electrochemical and thermal models during the calibration optimization procedure.
Table 2 lists five factors that are used to calibrate cell voltage and temperature responses under cycling.
Table 2.
Factors affecting cell voltage and temperature under cycling.
In the first stage of the cycling calibration, the sensitivity analysis-based pre-optimization step is performed to find the lower and upper bounds of the factors affecting cell cycling calibration. These values are used in the second stage, where the cell voltage and temperature profiles are calibrated using the optimization routine.
In the cycling calibration optimization, a multi-objective weighted sum approach is utilized as:
where represents sum of the voltage and temperature root mean square errors and and are user defined prioritized voltage and temperature weighting factors. For example, a weighting factor of 12 for the voltage related term and 1 for the temperature dependent term are suggested by the GT-SUITE software.
4.2. Battery Pack Model Calibration
Two approaches are proposed for the creation and calibration optimization of the battery pack model based on the cell electrochemical-thermal model, as described in Section 4.2.1 and Section 4.2.2, respectively.
4.2.1. Lumped Pack Approach
The lumped battery pack model is constructed by scaling up the cell model when considering the number of parallel and serial cells to reflect the pack behavior. By using this approach, no interconnections between the individual cells exist and, therefore, all cells are subjected to same loading conditions, thus neglecting cell-to-cell variations that cause current imbalances in a real-world battery pack [25]. Nonetheless, to mimic the impact of cell-to-cell intrinsic variations, a virtual aggregate cell is built by calibrating the cell model while simultaneously using the experimental data for all four samples (see Section 3.1).
The goal is to find an optimal solution that provides the best fit between the experimental and predicted values for the given optimization objective for all four tested samples by using the case sweep optimization method. The objective function is to minimize the average RMS error for all four samples.
The calibrated aggregate cell is then used to construct the lumped pack model. To calibrate the lumped battery pack model, the optimization objective function is defined as:
where is the pack terminal voltage and is the average temperature within the pack. Furthermore, the heat transfer coefficient is considered to be the only decision variable that requires adjustment during the optimization calibration of the lumped pack model.
4.2.2. Module-to-Module Discretization
Large traction battery packs comprise several hundreds of cells that are connected in series and parallel by electrical connectors to fulfill the system demand for voltage and capacity. The literature review reveals that the interconnection resistance is an external factor that is responsible for current and consequently temperature and SOC inhomogeneities within highly parallelized packs [3,27,28]. The interconnection resistance can induce significant current distributions in the pack, even under low to moderate operating C-rates (lower than 1.5 C), which causes accelerated aging of the cells subjected to the higher cycling currents or temperatures [29]. Although the lumped battery pack model provides a useful tool for fast analysis of battery packs, especially during system sizing stage, it fails in a detailed assessment of the battery pack performance when considering temperature gradients, localized aging, and cooling circuits’ design and evaluation. On the other hand, modeling a real-world battery pack by considering all individual cells is computationally expensive.
In this research, the battery pack model is discretized into several modules, where each module is treated as a lumped model. Figure 2 illustrates a schematic representation of the proposed module-to-module discretization method.
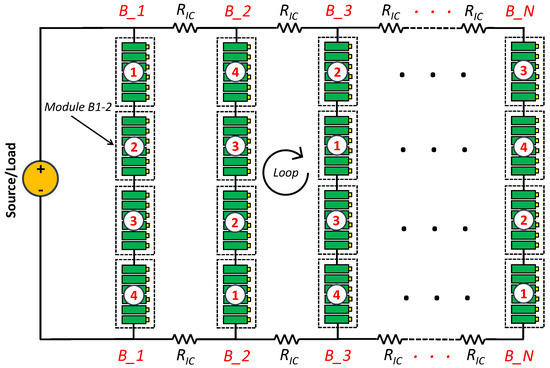
Figure 2.
A schematic representation of the module-to-module discretization method for the battery pack.
The number of parallel branches labelled B_1 to B_N is the same as it is in the physical battery pack, in order to achieve a good level of inhomogeneity due to cell parallelization. Each branch consists of four different lumped modules representing four cell samples (see Section 3.1) which consist of serially connected cells of the same type. Each module is labeled by the cell sample number (1–4) it is based on. Each cell sample is separately calibrated (see Section 4.1) and then replicated to represent serially connected cells in the module. The generated modules are then randomly spread within the battery pack while considering in-between interconnection resistors for parallel branches. Each module is labelled based on the cell sample and the parallel branch that it belongs to. For instance, B_1–2 represents the module that belongs to the first parallel branch and is made of serially connected cells based on sample 2.
Each module is governed by the P2D electrochemical-thermal model and integrated into the electrical domain to address the inhomogeneities that exist in the battery pack due to interconnection resistances and load terminals. The electrical circuit equations are governed by Kirchhoff’s voltage and current laws around each loop and junction, respectively [3,27], making it possible to address both intrinsic and extrinsic variations in the battery pack.
As the temperature variation within the battery pack can be captured by the module-to-module discretization approach, the optimization objective function is extended to also take the maximum and minimum temperatures into account. These two parameters, together with the resulting maximum temperature difference inside the pack, are critical factors for efficient design of battery packs and cooling circuits. The total RMS error (Equation (10) includes the pack terminal voltage (), the pack average temperature (), as well as the maximum and the minimum temperatures within the pack ( and ):
where, w is the weighting factor that is assigned to the individual RMS terms. In addition, the decision variables for optimization-based calibration include the value of the interconnection resistance and the heat transfer coefficient of each sample which is used to build the modules. Hence, the total number of variables which govern model calibration is equal to five.
4.3. GT-SUITE/ GT-AutoLion Battery Simulations
The simulations have been carried out using GT-SUITE Version 2020 software [41]. The P2D electrochemical-thermal cell model has been built and solved through GT-AutoLion template that provides a large material and geometry database library for the most commercial Li-ion cells. The finite control volume approach is used in GT-AutoLion solver to discretize the governing equations of the battery cell. To this aim, the cathode and anode electrodes were divided into six control volumes along the cell thickness, while twelve control volumes were used for spherical particles representing the electrodes’ active material. Besides, the separator compartment was divided into four control volumes.
The GT-AutoLion template was coupled with the electrical domain through the capabilities of GT-SUITEmp templates for modeling electrical circuits. The optimization was carried out using the built-in design optimizer platform. Due to the nonlinear characteristics of the model governing equations, the evolutionary method was selected for the optimization purpose. Thus, a genetic algorithm that was based on NSGA-III was chosen for the aim of the global search.
Figure 3 graphically summarizes the proposed calibration optimization framework implemented in GT-SUITE. The GT-AutoLion battery cell model is used to create battery modules, which are electrically connected to create the battery pack in the module-module discretization battery pack model.
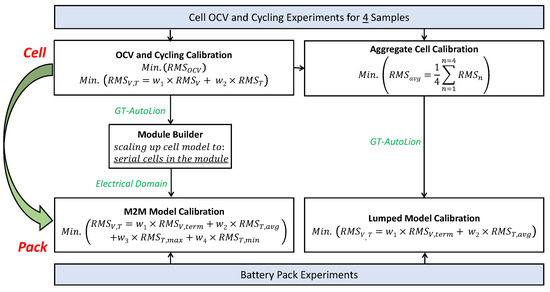
Figure 3.
Li-ion battery cell and battery pack calibration optimization framework.
5. Results and Discussion
The calibration optimization results based on the proposed methodology are elaborated for the battery cells and the battery pack under consideration. It is noteworthy that the simulation results are presented in their dimensionless form. Therefore, the following dimensionless parameters are defined first; the dimensional values are normalized by their respective maximum:
Furthermore, the relative root mean square error (RRMSE) is used to evaluate the model accuracy:
and the R-squared () is calculated as the goodness of fit index to assess how the simulated results () match the experimental ones ():
where, y represents OCV, voltage or temperature, and the subscript refers to the corresponding average value.
5.1. Cell Calibration
The cell calibration results are categorized into OCV calibration and cycling calibration, as described in Section 5.1.1 and Section 5.1.2, respectively.
5.1.1. OCV Calibration
Table 3 presents the optimal values for the decision variables used in the OCV calibration optimization together with the RRMSE for all four cell samples. The RRMSE is lower than 0.3% for all cases; the highest observed RRMSE is for cell sample 3 and it equals to 0.271%. The is 0.998 for all four samples.
Table 3.
Optimal dimensionless values for the decision variables in the open circuit voltage (OCV) calibration.
Figure 4 illustrates the OCV versus Depth of Discharge (DOD) curves visually confirming excellent agreement between the simulated and experimental values.
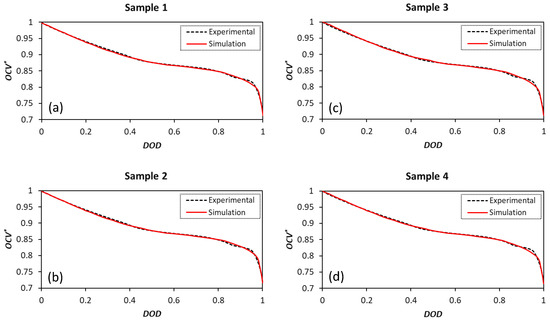
Figure 4.
OCV calibration optimization results for four cell samples. (a): sample 1; (b): sample 2; (c): sample 3; (d): sample 4.
It should be noted that the deviation of the simulation results from the experiments is slightly more pronounced when the DOD exceeds 80%. The model cannot fully capture the reduction trend in the OCV curve for DOD of higher than 80% due to the high dependence on electrodes’ material specifications and, therefore, half cell equilibrium potentials, which makes full cell characterization complicated.
Table 4 indicates the optimal values of the decision variables in the OCV optimization calibration stage of the aggregate cell that was used for building the lumped pack model.
Table 4.
OCV calibration optimization results for the aggregate cell.
Figure 5 illustrates the OCV curve of the aggregate cell, together with the OCV curves of the experimental samples. The same as the calibration optimization results for each cell sample, the OCV curve trend of the aggregate cell shows a slight deviation from the experimental observations when the DOD is higher than 80%.
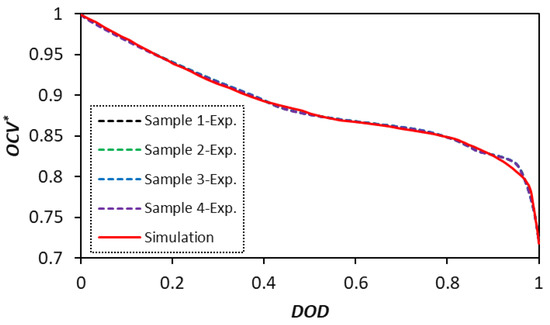
Figure 5.
OCV calibration optimization results for the aggregate cell.
5.1.2. Cycling Calibration
In the cycling calibration optimization stage, the multipliers are used to tune the charge () and mass transport ( and ) properties within the cell. The heat transfer coefficient (h) and the contact resistance () are the other two decision variables where intrinsic values are adjusted in the design optimizer. Li et al. [22] presented the effective intervals of the parameters influencing the cell cycling behavior, showing that the mass and charge transfer coefficients can vary one order of magnitude in the calibration optimization problem. Similarly, Ecker et al. [42] considered one order of magnitude change in the exchange current density to find the best fit to the experimental voltage curve. Accordingly, Table 5 presents the lower and upper bounds for the parameters, which are considered in the present cycling calibration optimization. The choice of the limits on the contact resistance () and the natural convection heat transfer coefficient (h) have been made based on Refs. [19,41], respectively. Moreover, similarly to the study by Santhanagopalan et al. [21], the diffusion coefficient inside the cathode particles highly affects the cell discharged capacity. Therefore, the effective range of has been narrowed to enhance the model predictability.
Table 5.
Effective ranges of the multipliers and dimensionless decision variables for cell cycling calibrations.
The combination of the calibration parameters (multipliers and dimensionless decision variables) needs to be chosen to minimize the total RMS of the voltage and temperature predictions (), so that the sample-to-sample parameter variability is also minimized. Table 6 shows the values for different set of parameters for all four cell samples. It is noted that the contact resistance () is considered in all of the combinations [41] along with the heat transfer coefficient (h) that couples the cell electrochemical and thermal models.
Table 6.
The values for different combinations of the calibration parameters.
Comparing the second and third rows in Table 6 shows that including the diffusion coefficient in the cathode leads to a significant reduction in the when compared to considering the diffusion coefficient in the anode. Similarly, evaluating the fourth and fifth rows reflects that the cathodic exchange current density is more impactful than the anodic exchange current density. Therefore, the cycling behavior of the battery cells under consideration is governed by cathode’s charge and mass transport properties. Moreover, the sixth row indicates that incorporating the electrolyte diffusivity in addition to the cathodic diffusivity further enhances the model predictability. This is most likely due to the facts that the cathode is made of several different materials (e.g., Ni, Co, and Mn) and the electrolyte includes different solvents (e.g., ethylene carbonate (EC) and ethyl methyl carbonate (EMC)). Including the cathodic exchange current density further reduces the (the seventh row) while adding the anodic current density (as shown in the eighth row) does not make more improvements.
The next step is to consider the variability of the identified parameters among the cell samples. The variability is defined here as:
where x stands for each of the factors affecting cell cycling performance and the , and subscripts correspond to the maximum, minimum, and average values among the four cell samples, respectively.
The results for all four samples are summarized in Table 7. It is seen that all the combinations, except the row in bold, result in 100% or more variability for at least one of the parameters. Therefore, the parameter combination (, h, , , ) highlighted in bold in Table 6 and Table 7 has been considered in the cycling calibration optimization herein.
Table 7.
Sample-to-sample parameter variability for different parameter combinations.
Table 8 summarizes the cycling calibration optimization results for all four samples. The RRMSEs/ for voltage and temperature predictions are approximately 1%/0.98 and 3%/0.7 for all samples.
Table 8.
Optimal values of the multipliers and dimensionless decision variables for cell cycling calibrations.
The sample-to-sample parameter variability reported in Table 8 can be explained by qualitative analysis of the experimental observations. Figure 6 illustrates the experimentally observed discharge curves under 1 C cycling rate for all four samples. Three different regions (A, B, and C) where different parameters govern the cell cycling behavior are marked on the discharge curve.
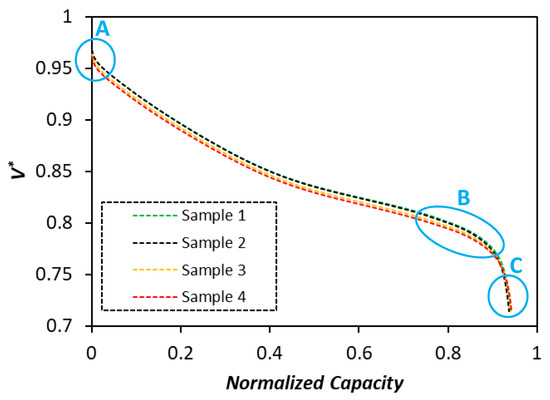
Figure 6.
Experimental 1 C discharge curves for samples 1–4.
First, it can be noticed that samples 1 and 2 have almost identical cycling characteristics, while samples 3 and 4 experience similar cycling behaviors. This observation is reflected in the calibrated parameters for the corresponding samples. It is seen that samples 1 and 2 show higher voltage levels in the region A, where the kinetic overpotential is dominant. The calibration optimization results in Table 8 are in agreement with the experimental data, where samples 1 and 2 show higher values for the cathode exchange current densities () in comparison with samples 3 and 4. The parameter identification for the electrolyte diffusivity () predicts higher values for samples 1 and 2 than for samples 3 and 4. This prediction is also well aligned with the actual observations in the region B, where samples 1 and 2 show better performance (higher voltage levels) than samples 3 and 4 at the downward turning point of the discharge curve where mass transport limitations of the electrolyte phase play a role. The calibrated values of the diffusion coefficient within the cathode particles () for samples 1 and 2 are lower than samples 3 and 4. These predictions are confirmed by the observed experiments in the region C where solid phase mass transport limitations are dominant. Thus, samples 3 and 4 have slightly higher discharged capacities than samples 1 and 2.
Figure 7 compares the simulated voltage and temperature profiles with the experimental data for all four samples. The cells undergo three consecutive cycles, including C/3 CC-CV charge-rest-C/5 discharge, C/3 CC-CV charge-rest-C/2 discharge, and C/3 CC-CV charge-rest-1C discharge.
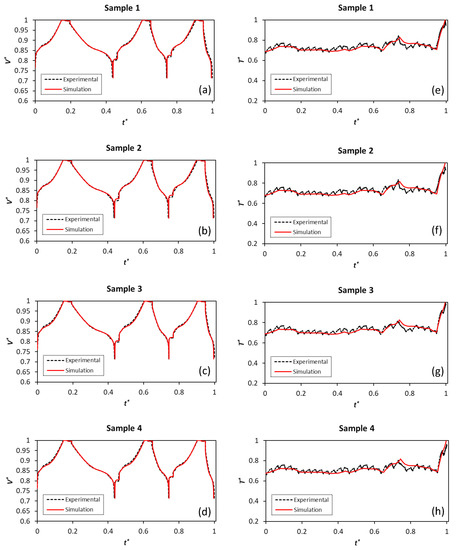
Figure 7.
Cycling calibration optimization results for samples 1-4. (a–d): Voltage profiles; (e–h): Temperature profiles.
The predicted voltage profiles excellently capture the experimentally measured profiles for all four samples. The trend for the temperature profiles is also well captured in the simulations. Nevertheless, it should be mentioned that there is a slight increase in the voltage deviation at the end of discharge for lower C-rates, where the model predicts a higher discharged capacity for the cells than the experimental values. The mass transport limitations play the key role in the cell overpotential increase and they further affect voltage simulation predictions at the end of discharge with higher cycling currents. This phenomenon is common for electrochemistry-based models, which contain a diverse set of parameters to be identified, as it has also been highlighted by Weißhar et al. [43].
The cell overpotential and cycling current both contribute to heat generation inside the cell causing the temperature to rise. Figure 6a–d indicate that all samples show the lowest level of temperature during the C/5 discharge process () when the operating current is at its lowest value. The maximum temperature is observed in the 1 C discharge cycle when the end of discharge voltage is reached and the cell overpotential is at its highest value during the corresponding cycle ().
The cycling calibration optimization results for the aggregate cell are provided in Table 9. The average RRMSEs/ for the voltage and temperature are 1.08%/0.98 and 3.07%/0.68, respectively.
Table 9.
Cycling calibration optimization results for the aggregate cell.
Figure 8 shows the results for the aggregate cell calibration optimization. The predictions for voltage and temperature are compared with the actual profiles that were experienced by samples 1–4. The aggregate cell simulated voltage shows deviations from the experiments at the end of discharge states similar to the calibration results for each cell sample.
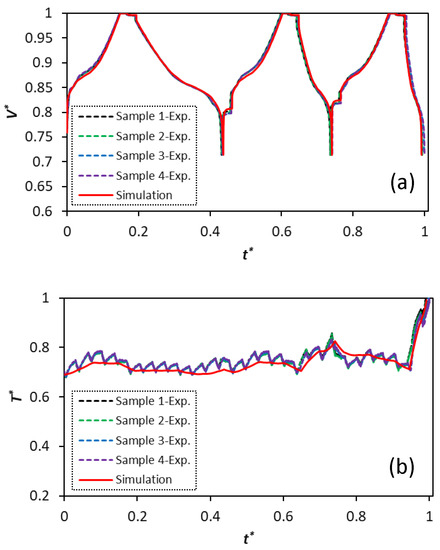
Figure 8.
Cycling calibration optimization results for the aggregate cell. (a): voltage profiles; (b): temperature profiles.
5.2. Battery Pack Calibration
This section presents the model calibration optimization results for the battery pack based on the lumped model (Section 5.2.1) and the module-to-module discretization approach (Section 5.2.2). The battery pack was tested for three cycling scenarios (see Section 3.2). In this study, the first scenario (C/2 + C/3 CC charge, CV charge, rest, 1.5 C discharge) is used for the model calibration purpose, while the second (C/2 + C/3 CC charge, CV charge, rest, C/2 discharge) and the third (1.1 C + C/2 + C/3 CC charge, CV charge, rest, 1.5 C discharge) scenarios are utilized to evaluate the calibrated battery pack model.
5.2.1. Lumped Pack Model Calibration
The calibration optimization of the lumped pack model yields the optimal dimensionless value of the heat transfer coefficient 0.54, which is approximately the same as for the aggregate cell. Therefore, for the lumped pack model, the aggregate cell represents the average thermal and electrical performance of the pack with sufficient accuracy. The RRMSEs for the voltage and temperature predictions are 1.32% and 5.38%, respectively.
Figure 9 illustrates the calibrated voltage and temperature patterns when the pack is subjected to the first cycling scenario. Figure 9c,d illustrate how well the simulation results fit the experimental data, i.e., how close the data are to the fitted regression line. The calculated values for the voltage and temperature predictions are 0.963 and 0.837, respectively.
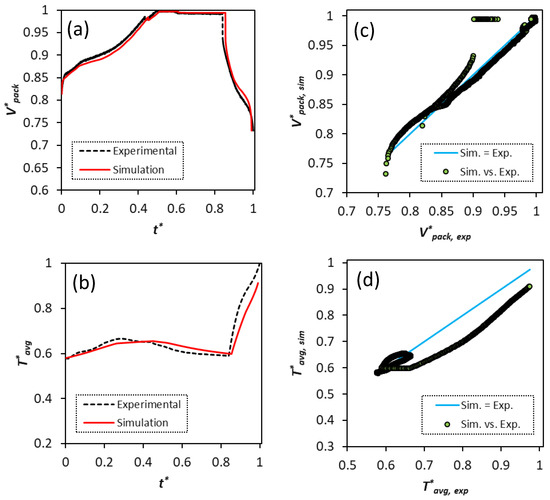
Figure 9.
Lumped pack model calibration optimization results for the first scenario (C/2 + C/3 CC charge, CV charge, rest, 1.5 C discharge). (a) Pack terminal voltage; (b) pack average temperature; (c,d) point by point comparison between the simulations and experiments for the pack terminal voltage and average temperature.
The voltage curve is very well predicted for both charging C-rates, during the rest period, as well as during discharge. It can be noted that the discharge process (that starts at ) is predicted with a slight delay when compared to the experiments. This discrepancy accumulates from the previous stage when the simulation predicts a slight longer period for the CC-CV charge step as compared to the measurements.
Figure 10 illustrates the evaluation results for the calibrated lumped battery pack model under the second and third testing scenarios.
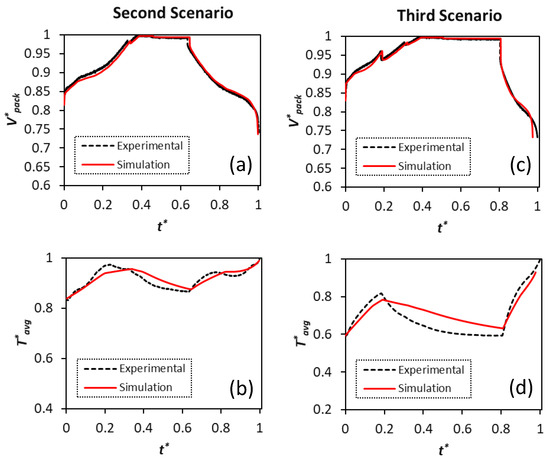
Figure 10.
Lumped battery pack model evaluation. (a,b): second scenario (C/2 + C/3 CC charge, CV charge, rest, C/2 discharge); (c,d): third scenario (1.1 C + C/2 + C/3 CC charge, CV charge, rest, 1.5 C discharge).
The lumped pack model predicts very well the voltage curve of the pack in the both evaluation scenarios. However, more deviations can be observed from the predicted average temperature profile within the pack for the third scenario, where the pack is subjected to higher operating currents than the second scenario. In the physical setup, the liquid cooling circuits are used to thermally manage the pack. The proposed modeling framework considers the convective heat transfer boundary condition for the cells to account for the effects of the cooling circuits, leading to discrepancy in temperature predictions.
Table 10 provides the RRMSEs for evaluating the calibrated lumped battery pack model. The terminal voltage of the battery pack is predicted with more than 99% accuracy in both scenarios. The RRMSE for the pack average temperature is circa 8% under the third scenario.
Table 10.
Relative root mean square errors (RRMSEs) for the lumped battery pack model evaluation.
5.2.2. Module-to-Module Discretization Model Calibration
Table 11 summarizes the optimal dimensionless values of the factors that were considered for calibrating the module-to-module discretization model for the first testing scenario. The calibration optimization gives a low value for the interconnection resistance () between the pack parallel branches, which implied that the electrical domain is well balanced (i.e., low level of current imbalances within the pack). However, the optimal dimensionless values of the heat transfer coefficients differ from those obtained during the cell cycling calibration optimization stage (see Table 8). This result shows the temperature variation within the pack is significant and the lumped battery pack model is insufficient for capturing temperature gradients within the pack.
Table 11.
Module-to-module discretization model calibration optimization results.
Figure 11 shows the calibration results for the voltage curve (Figure 11a), as well as for the average, minimum, and maximum temperature evolution (Figure 11b–d) within the pack for the first scenario.
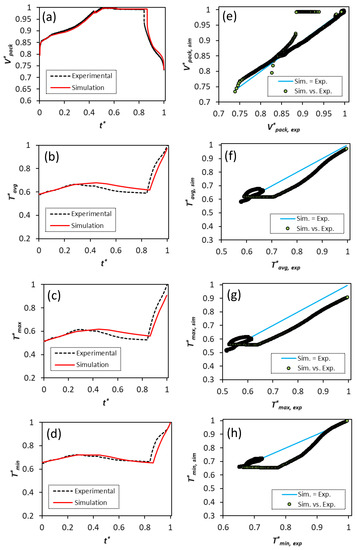
Figure 11.
Module-to-module discretization model calibration optimization results for the first scenario (C/2 + C/3 CC charge, CV charge, rest, 1.5 C discharge). (a) Pack terminal voltage; (b) pack average temperature; (c) pack maximum temperature; (d) pack minimum temperature; (e–h) point by point comparison between the simulations and experiments for the pack terminal voltage, average, maximum, and minimum temperatures within the pack.
Similarly as in the lumped pack model, the voltage curve is very well predicted for the whole cycle with the RRMSE of 1.67%. The pack temperatures (average, minimum, and maximum) are predicted with RRMSEs of 4–7%. The minimum temperature evolution in the battery pack is accurately captured for both charging and resting intervals. The deviations in the prediction of the average and maximum pack temperatures occur in the middle part of the cycle that corresponds mainly to the resting interval () and during the discharge process () for the minimum temperature. The time delays in the prediction of the discharge process cause the deviations in the temperature predictions to visually appear larger.
Figure 12 shows the evaluation results for the voltage curve and all three temperatures under the second and third testing scenarios.
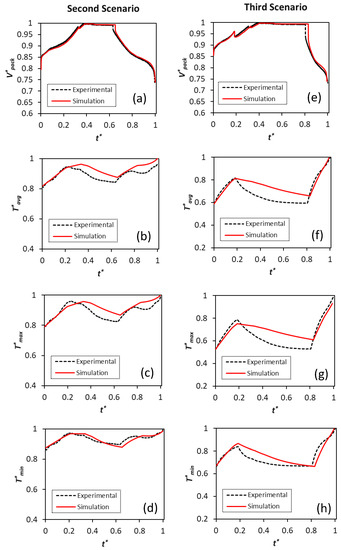
Figure 12.
Module-to-module discretization battery pack model evaluation. (a–d): second scenario (C/2 + C/3 CC charge, CV charge, rest, C/2 discharge); (e–h): third scenario (1.1 C + C/2 + C/3 CC charge, CV charge, rest, 1.5 C discharge).
The experimental voltage curves are well captured by the model for both evaluation scenarios with the RRMSE lower than 1.6%. The overall trend for temperature evolution is well predicted in the second scenario. The largest deviation is observed for the maximum temperature profile in the rest period and during the discharge process. However, the model shows a good match to the experiments during the charge process, where the cycling current is similar to the first scenario that was used for the model calibration. In the third scenario with charging C-rates of higher than those used in the model calibration optimization, the temperatures are overpredicted during the charging and the resting. Nonetheless, the pack temperatures during discharge are captured with good accuracy.
For more straightforward comparison, Table 12 summarizes the RRMSEs between the simulations and experiments for the evaluation cases. The maximum observed RRMSE is 12.27% and it corresponds to the maximum temperature inside the pack for the third testing scenario where the charging C-rate is the highest. The calibrated model shows better predictability for the minimum temperature within the pack for the evaluation scenarios.
Table 12.
RRMSEs for the module-to-module discretization battery pack model evaluation.
6. Conclusions
The model-based calibration optimization methodology was developed for Li-ion battery packs for electric mining vehicles. The battery cells were modeled in GT-AutoLion using the electrochemical pseudo-two dimensional (P2D) -thermally coupled modeling approach. The calibrated cell models were scaled up to build the modules and the entire battery pack. For this purpose, two approaches were considered: the lumped model approach and the module-to-module discretization approach that accounts for cell-to-cell variations within the pack. The calibration optimization of the battery pack models was performed using the experimental data provided by Northvolt AB. Three different operating/testing scenarios that included charge, rest, and discharge intervals were considered. The first operating scenario (C/2 + C/3 CC charge, CV charge, rest, 1.5 C discharge) used for model calibration, while the model predictability was evaluated for the second (C/2 + C/3 CC charge, CV charge, rest, C/2 discharge) and the third scenario (1.1 C + C/2 + C/3 CC charge, CV charge, rest, 1.5 C discharge). The simulations were carried out in GT-SUITE/GT-AutoLion and the optimization was performed using GT-SUITE’s design optimizer.
The simulation results for Li-ion cells show that the cell model excellently captures the experimentally observed voltage and temperature curves with the relative root mean square errors (RRSMEs) 1% and 3%, respectively. The lumped pack model calibration predicted the terminal voltage and the average temperature with the RRMSEs 1.3% and 5.4%, respectively. The predictions for the average temperature deviated by 8.2% from the experimental observations when the pack operates under the third scenario where the charging current was higher when compared to those used during the model calibration. The module-to-module discretization model calibration estimated the terminal voltage and the average temperature inside the pack with nearly the same accuracy as the lumped battery pack model (RRMSEs 1.7% and 5.7%, respectively) for the calibration scenario. The module-to-module discretization model also predicted well the maximum and minimum temperatures within the pack with the RRMSE 7% and 4%, respectively, under the calibration scenario. The model evaluation showed that the pack terminal voltage was well estimated (RRMSE was lower than 1.6%), while the maximum temperatures within the pack were predicted with RRMSEs 4.3% and 12.3% for the second and third scenarios, respectively. To further improve the accuracy of the temperature predictions, the cooling circuits domain needs to be integrated with the pack model to more precisely consider the impact of the cooling strategy on the battery modules.
The proposed methodology provides a unified framework for calibration optimization of Li-ion battery packs and, thus, provides a powerful tool for predicting and optimizing the battery pack performance from both electrical and thermal perspectives. Despite the present study being focused on the battery packs for mining vehicles, the developed framework is robust enough to be implemented in other automotive applications, as well as stationary energy storage systems.
Author Contributions
Simulations and writing—original draft preparation, M.A.; conceptuallization, methodology and formal analysis, M.A. and J.A.; writing—review and editing, J.A.; cell calibration consultancy, D.M. and H.S.; software consultancy, P.S.; experimental data, M.M. and M.C.; overall guidance, L.L.; project leadership, H.S. All authors have read and agreed to the published version of the manuscript.
Funding
This work has been financially supported by the Swedish Energy Agency (project number P47906-1).
Conflicts of Interest
The authors declare no conflict of interest.
Nomenclature
| List of Symbols | |
| A | cell surface area () |
| interfacial surface area () | |
| c | lithium concentration () |
| specific heat () | |
| D | diffusion coefficient () |
| activation energy () | |
| F | Faraday’s constant () |
| h | heat transfer coefficient () |
| I | current () |
| exchange current density () | |
| intercalation current density () | |
| k | ionic conductivity () |
| L | thickness () |
| electrode loading () | |
| Areal capacity ratio of negative to positive electrode | |
| generated heat () | |
| R | universal gas constant () |
| r | radial coordinate |
| contact resistance () | |
| particle radius () | |
| T | temperature () |
| t | time () |
| transference number | |
| w | wight factor |
| x | spatial coordinate |
| V | voltage () |
| Greek Letters | |
| charge transfer coefficient | |
| porosity | |
| overpotential () | |
| density () | |
| electronic conductivity () | |
| electric potential () | |
| transport property | |
| Subscripts/ Superscripts | |
| anode | |
| cathode | |
| e | electrolyte |
| effective | |
| reference | |
| s | solid |
| separator | |
| Abbreviations | |
| average | |
| boundary conditions | |
| capacity | |
| depth of discharge | |
| experimental | |
| first charge capacity | |
| first discharge capacity | |
| maximum | |
| minimum | |
| Open Circuit Voltage | |
| pseudo-two dimensional | |
| root mean square | |
| relative root mean square error | |
| simulation | |
| state of charge |
Appendix A
This section summarizes the governing equations which are used to simulate the Li-ion cell cycling behavior based on the P2D electrochemical-thermal modeling approach. The readers are referred to Refs. [14,19,39] for more detailed information.
Li-ion concentration changes inside the solid phase during intercalation/deintercalation process. Fick’s second law expresses Li-ion mass conservation inside the cell [19]. The distribution of Li in the spherical particles located in each control volume of the electrodes is predicted as:
where is the Li-ion concentration, is the solid phase diffusion coefficient, is the intercalation current density, F is Faraday’s constant and represents the interfacial surface area which depends on the solid phase volume fraction and the particle’s radius ().
Li-ion concentration profile in the liquid phase depends on the effective diffusivity in the electrolyte (), the porosity (), the current density and the Li-ion transference number () [3] as:
where , and are the anode, the separator and the cathode thicknesses, respectively.
The charge conservation in the solid phase () which is dependent on the solid phase conductivity () and the reaction current density () [14] is expressed as:
The electrolyte phase charge conservation () is described by Equation (A4), where the electrolyte potential is affected by the ionic conductivity (), the ionic diffusional conductivity (), as well as the reaction current density () [14] as:
The partial differential Equations (A1)–(A4) are integrated through the intercalation current density () via the Butler-Volmer equation which defines cell electrochemical kinetics [39] as:
where is the exchange current density, is the charge transfer coefficient, R is the universal gas constant and T stands for the absolute cell operating temperature. Furthermore, represents the cell overpotential which is calculated by [19]:
where U is the cell thermodynamic potential.
It is worth mentioning that the electrolyte effective parameters (= and ) are related to the intrinsic values (= and k) by the porosity () and the Bruggeman exponent () [44] as:
The cell physico-chemical parameters (=, and ) have temperature dependency defined by Arrhenius’s law [15] as:
where is the parameter’s value at the reference temperature and is the activation energy which controls the temperature sensitivity of the given parameter (, and ).
A lupmed energy conservation model is applied to correlate cell temperature (T) evolution to the generated heat inside the cell and the convective dissipated heat to the ambient [15,19] as:
where h is the heat transfer coefficient, is the cooling medium temperature, is the cell outer surface area and is the total heat generated within the cell.
References
- Pietrzak, K.; Pietrzak, O. Environmental Effects of Electromobility in a Sustainable Urban Public Transport. Sustainability 2020, 12, 1052. [Google Scholar] [CrossRef]
- Zubi, G.; Dufo-López, R.; Carvalho, M.; Pasaoglu, G. The lithium-ion battery: State of the art and future perspectives. Renew. Sustain. Energy Rev. 2018, 89, 292–308. [Google Scholar] [CrossRef]
- Hosseinzadeh, E.; Marco, J.; Jennings, P. Combined electrical and electrochemical-thermal model of parallel connected large format pouch cells. J. Energy Storage 2019, 22, 194–207. [Google Scholar] [CrossRef]
- Feng, Y.; Dong, Z. Optimal energy management with balanced fuel economy and battery life for large hybrid electric mining truck. J. Power Sources 2020, 454, 227948. [Google Scholar] [CrossRef]
- Feng, Y.; Dong, Z. Optimal control of natural gas compression engine hybrid electric mining trucks for balanced fuel efficiency and overall emission improvement. Energy 2019, 189, 116276. [Google Scholar] [CrossRef]
- Offer, G.; Edge, J. Multi-Scale Modeling; Technical Report; The Faraday Institution: Didcot, UK, 2019. [Google Scholar]
- Uddin, K.; Picarelli, A.; Lyness, C.; Taylor, N.; Marco, J. An Acausal Li-Ion Battery Pack Model for Automotive Applications. Energies 2014, 7, 5675–5700. [Google Scholar] [CrossRef]
- Grey, C.P.; Tarascon, J.M. Sustainability and in situ monitoring in battery development. Nat. Mater. 2017, 16, 45–56. [Google Scholar] [CrossRef]
- High-Energy Battery Technologies; Technical Report; The Faraday Institution: Didcot, UK, 2020.
- Jin, N.; Danilov, D.L.; Van den Hof, P.M.J.; Donkers, M.C.F. Parameter estimation of an electrochemistry-based lithium-ion battery model using a two-step procedure and a parameter sensitivity analysis. Int. J. Energy Res. 2018, 42, 2417–2430. [Google Scholar] [CrossRef]
- Marco, J.; Kumari, N.; Widanage, D.W.; Jones, P. A Cell-in-the-Loop Approach to Systems Modelling and Simulation of Energy Storage Systems. Energies 2015, 8, 8244–8262. [Google Scholar] [CrossRef]
- He, W.; Pecht, M.; Flynn, D.; Dinmohammadi, F. A Physics-Based Electrochemical Model for Lithium-Ion Battery State-of-Charge Estimation Solved by an Optimised Projection-Based Method and Moving-Window Filtering. Energies 2018, 11, 2120. [Google Scholar] [CrossRef]
- Tagade, P.; Hariharan, K.S.; Basu, S.; Verma, M.K.S.; Kolake, S.M.; Song, T.; Oh, D.; Yeo, T.; Doo, S. Bayesian calibration for electrochemical thermal model of lithium-ion cells. J. Power Sources 2016, 320, 296–309. [Google Scholar] [CrossRef]
- Santhanagopalan, S.; Guo, Q.; Ramadass, P.; White, R.E. Review of models for predicting the cycling performance of lithium ion batteries. J. Power Sources 2006, 156, 620–628. [Google Scholar] [CrossRef]
- Smith, K.; Wang, C.Y. Power and thermal characterization of a lithium-ion battery pack for hybrid-electric vehicles. J. Power Sources 2006, 160, 662–673. [Google Scholar] [CrossRef]
- Schmalstieg, J.; Rahe, C.; Ecker, M.; Sauer, D.U. Full Cell Parameterization of a High-Power Lithium-Ion Battery for a Physico-Chemical Model: Part I. Physical and Electrochemical Parameters. J. Electrochem. Soc. 2018, 165, A3799–A3810. [Google Scholar] [CrossRef]
- Schmalstieg, J.; Sauer, D.U. Full Cell Parameterization of a High-Power Lithium-Ion Battery for a Physico-Chemical Model: Part II. Thermal Parameters and Validation. J. Electrochem. Soc. 2018, 165, A3811–A3819. [Google Scholar] [CrossRef]
- Hosseinzadeh, E.; Genieser, R.; Worwood, D.; Barai, A.; Marco, J.; Jennings, P. A systematic approach for electrochemical-thermal modelling of a large format lithium-ion battery for electric vehicle application. J. Power Sources 2018, 382, 77–94. [Google Scholar] [CrossRef]
- Prada, E.; Di Domenico, D.; Creff, Y.; Bernard, J.; Sauvant-Moynot, V.; Huet, F. Simplified Electrochemical and Thermal Model of LiFePO4-Graphite Li-Ion Batteries for Fast Charge Applications. J. Electrochem. Soc. 2012, 159, A1508–A1519. [Google Scholar] [CrossRef]
- Ahmed, R.; Sayed, M.E.; Arasaratnam, I.; Tjong, J.; Habibi, S. Reduced-Order Electrochemical Model Parameters Identification and SOC Estimation for Healthy and Aged Li-Ion Batteries Part I: Parameterization Model Development for Healthy Batteries. IEEE J. Emerg. Sel. Top. Power Electron. 2014, 2, 659–677. [Google Scholar] [CrossRef]
- Santhanagopalan, S.; Guo, Q.; White, R.E. Parameter Estimation and Model Discrimination for a Lithium-Ion Cell. J. Electrochem. Soc. 2007, 154, A198. [Google Scholar] [CrossRef]
- Li, J.; Zou, L.; Tian, F.; Dong, X.; Zou, Z.; Yang, H. Parameter Identification of Lithium-Ion Batteries Model to Predict Discharge Behaviors Using Heuristic Algorithm. J. Electrochem. Soc. 2016, 163, A1646–A1652. [Google Scholar] [CrossRef]
- Forman, J.C.; Moura, S.J.; Stein, J.L.; Fathy, H.K. Genetic identification and fisher identifiability analysis of the Doyle–Fuller–Newman model from experimental cycling of a LiFePO4 cell. J. Power Sources 2012, 210, 263–275. [Google Scholar] [CrossRef]
- Zhang, L.; Wang, L.; Hinds, G.; Lyu, C.; Zheng, J.; Li, J. Multi-objective optimization of lithium-ion battery model using genetic algorithm approach. J. Power Sources 2014, 270, 367–378. [Google Scholar] [CrossRef]
- Offer, G.J.; Yufit, V.; Howey, D.A.; Wu, B.; Brandon, N.P. Module design and fault diagnosis in electric vehicle batteries. J. Power Sources 2012, 206, 383–392. [Google Scholar] [CrossRef]
- Brand, M.J.; Hofmann, M.H.; Steinhardt, M.; Schuster, S.F.; Jossen, A. Current distribution within parallel-connected battery cells. J. Power Sources 2016, 334, 202–212. [Google Scholar] [CrossRef]
- Bruen, T.; Marco, J. Modelling and experimental evaluation of parallel connected lithium ion cells for an electric vehicle battery system. J. Power Sources 2016, 310, 91–101. [Google Scholar] [CrossRef]
- Neupert, S.; Kowal, J. Inhomogeneities in Battery Packs. World Electr. Veh. J. 2018, 9, 20. [Google Scholar] [CrossRef]
- Liu, X.; Ai, W.; Naylor Marlow, M.; Patel, Y.; Wu, B. The effect of cell-to-cell variations and thermal gradients on the performance and degradation of lithium-ion battery packs. Appl. Energy 2019, 248, 489–499. [Google Scholar] [CrossRef]
- Astaneh, M.; Dufo-López, R.; Roshandel, R.; Golzar, F.; Bernal-Agustín, J.L. A computationally efficient Li-ion electrochemical battery model for long-term analysis of stand-alone renewable energy systems. J. Energy Storage 2018, 17, 93–101. [Google Scholar] [CrossRef]
- Doyle, M.; Fuller, T.F.; Newman, J. Modeling of Galvanostatic Charge and Discharge of the Lithium/Polymer/Insertion Cell. J. Electrochem. Soc. 1993, 140, 1526–1533. [Google Scholar] [CrossRef]
- Barcellona, S.; Piegari, L. Lithium Ion Battery Models and Parameter Identification Techniques. Energies 2017, 10, 2007. [Google Scholar] [CrossRef]
- Zhang, C.; Jiang, J.; Zhang, L.; Liu, S.; Wang, L.; Loh, C.P. A Generalized SOC-OCV Model for Lithium-Ion Batteries and the SOC Estimation for LNMCO Battery. Energies 2016, 9, 900. [Google Scholar] [CrossRef]
- Zhang, R.; Xia, B.; Li, B.; Cao, L.; Lai, Y.; Zheng, W.; Wang, H.; Wang, W.; Wang, M. A Study on the Open Circuit Voltage and State of Charge Characterization of High Capacity Lithium-Ion Battery Under Different Temperature. Energies 2018, 11, 2408. [Google Scholar] [CrossRef]
- Masoudi, R.; Uchida, T.; McPhee, J. Parameter estimation of an electrochemistry-based lithium-ion battery model. J. Power Sources 2015, 291, 215–224. [Google Scholar] [CrossRef]
- Ramadesigan, V.; Chen, K.; Burns, N.A.; Boovaragavan, V.; Braatz, R.D.; Subramanian, V.R. Parameter Estimation and Capacity Fade Analysis of Lithium-Ion Batteries Using Reformulated Models. J. Electrochem. Soc. 2011, 158, A1048–A1054. [Google Scholar] [CrossRef]
- Bergveld, H.J.; Kruijt, W.S.; Notten, P.H. Battery Management Systems: Design by Modelling; Springer Science + Business Media Dordrecht: Dordrecht, The Netherlands, 2002. [Google Scholar] [CrossRef]
- Speltino, C.; Domenico, D.D.; Fiengo, G.; Stefanopoulou, A. Experimental identification and validation of an electrochemical model of a lithium-ion battery. In Proceedings of the 2009 European Control Conference (ECC), Budapest, Hungary, 23–26 August 2009; pp. 1053–1058. [Google Scholar] [CrossRef]
- Hosseinzadeh, E.; Marco, J.; Jennings, P. Electrochemical-Thermal Modelling and Optimisation of Lithium-Ion Battery Design Parameters Using Analysis of Variance. Energies 2017, 10, 1278. [Google Scholar] [CrossRef]
- Tanim, T.R.; Rahn, C.D. Aging formula for lithium ion batteries with solid electrolyte interphase layer growth. J. Power Sources 2015, 294, 239–247. [Google Scholar] [CrossRef]
- Gamma Technologies. GT-SUITE User Manual; Version 2020 Build 1.0001; Gamma Technologies: Westmont, IL, USA, 2020. [Google Scholar]
- Ecker, M.; Käbitz, S.; Laresgoiti, I.; Sauer, D.U. Parameterization of a Physico-Chemical Model of a Lithium-Ion Battery. J. Electrochem. Soc. 2015, 162, A1849–A1857. [Google Scholar] [CrossRef]
- Weißhar, B.; Bessler, W.G. Model-based lifetime prediction of an LFP/graphite lithium-ion battery in a stationary photovoltaic battery system. J. Energy Storage 2017, 14, 179–191. [Google Scholar] [CrossRef]
- Thorat, I.V.; Stephenson, D.E.; Zacharias, N.A.; Zaghib, K.; Harb, J.N.; Wheeler, D.R. Quantifying tortuosity in porous Li-ion battery materials. J. Power Sources 2009, 188, 592–600. [Google Scholar] [CrossRef]


© 2020 by the authors. Licensee MDPI, Basel, Switzerland. This article is an open access article distributed under the terms and conditions of the Creative Commons Attribution (CC BY) license (http://creativecommons.org/licenses/by/4.0/).