Article

Electrogenic Biofilm Development Determines Charge Accumulation and Resistance to pH Perturbation

Sustainable Environment Research Centre (SERC), Faculty of Computing, Engineering and Science, University of South Wales, Pontypridd, Mid-Glamorgan CF37 1DL, UK
*
Author to whom correspondence should be addressed.
Energies 2020, 13(14), 3521; https://doi.org/10.3390/en13143521
Submission received: 27 May 2020 / Revised: 23 June 2020 / Accepted: 23 June 2020 / Published: 8 July 2020

Abstract

:
The electrogenic biofilm and the bio-electrode interface are the key biocatalytic components in bioelectrochemical systems (BES) and can have a large impact on cell performance. This study used four different anodic carbons to investigate electrogenic biofilm development to determine the influence of charge accumulation and biofilm growth on system performance and how biofilm structure may mitigate against pH perturbations. Power production was highest (1.40 W/m3) using carbon felt, but significant power was also produced when felt carbon was open-circuit acclimated in a control reactor (0.95 W/m3). The influence of carbon material on electrogenic biofilm development was determined by measuring the level of biofilm growth, using sequencing to identify the microbial populations and confocal microscopy to understand the spatial locations of key microbial groups. Geobacter spp. were found to be enriched in closed-circuit operation and these were in close association with the carbon anode, but these were not observed in the open-circuit controls. Electrochemical analysis also demonstrated that the highest mid-point anode potentials were close to values reported for cytochromes from Geobacter sulfurreductans. Biofilm development was greatest in felt anodes (closed-circuit acclimated 1209 ng/μL DNA), and this facilitated the highest pseudo-capacitive values due to the presence of redox-active species, and this was associated with higher levels of power production and also served to mitigate against the effects of low-pH operation. Supporting carbon anode structures are key to electrogenic biofilm development and associated system performance and are also capable of protecting electrochemically active bacteria from the effects of environmental perturbations.

1. Introduction

Microbial fuel cells (MFCs) are comprised of anodic and cathodic chambers, each typically containing carbon-based electrodes and separated by an ion exchange membrane; these electrodes can then be electrically connected to an external electrical circuit to generate a cell voltage. Bioelectrochemical systems are able to convert organic matter to electrical energy by using inherent metabolic processes associated with a district group of electrogenic microorganisms that are able to facilitate extracellular electron transfer to the anode. MFC systems have been applied to a number of environmental treatment and sensing processes, notably, in wastewater treatment, in energy conservation for remote sensor systems and as on-line biosensors [1]. However, it is known that the performance of MFC biofilms is affected by a number of different factors, including temperature, substrate, material type, construction, flow rate and pH [2].
Carbon is considered to be a good support material for electrogenic biofilms due to its inherent biocompatibility, high surface area and relatively low cost [3]; whilst electrical conductivity is good, it presents significantly higher resistances than typical metals. A number of strategies have been employed to improve the biocatalytic/electrochemical properties of carbon in reactor systems. Cheng and Logan carried out surface modifications which resulted in improved anode performance; notably, ammonium treatment produced a 46% improvement in power production [4], and when carbon was modified with quinine groups/electrically active mediators this resulted in an improvement in current production by a factor of ten [5]. However, the three-dimensional structure of the carbon electrode has been shown to exert an even greater influence on anode performance as this is the focus of the bioelectrochemical activities [6]. Total surface area (to volume) properties of different carbon types are known to vary significantly at microbiologically relevant micron levels, with graphite rods having a low surface-to-volume ratio as compared to carbon felt which is composed of a porous network of inter-linking carbon fibres. Indeed, this approach was used by Logan et al. [7] to enhance the “biologically” effective surface area by winding graphite fibres around a metal current collector to produce a 2.5-fold improvement in power production compared to standard carbon cloth electrodes, and Larrosa-Guerrero et al. showed that carbon type can have an effect on biofilm efficacy [8]. In systems with high surface areas and large porous volumes this will also act to enhance the potential contact between substrate and bacteria by increasing fluid flows and so maximizing mass transfer effects. This approach was further investigated by looking at forced flow through porous anodes; this produced a 2.28-fold improvement in current densities and a subsequent reduction in the reactor internal resistance [9], but little consideration has been given to the bioelectrochemical development of these biofilms in different carbon matrices.
The considerable importance of the anodic carbon material to system performance has been investigated in a number of studies; these have typically included a number of felts, foams and multi-layered structures [10]. Indeed, the importance of carbon type to the scale-up of microbial electrolysis cells was addressed by Roubard et al. who benchmarked the performance of four carbon materials; this work highlighted the importance of the biofilm and its electrochemical properties for performance [11]. Carbon felt is commonly used in BES electrodes, as it can provide large pore sizes that can enable microbiological colonisation; looser networks of microbial fibres can lead to lower levels of electrical connections and higher resistivities compared to other carbon types. However, the overall performance of the system will depend on the development and type of electrogenic biofilm present and this will then be subject to a number of different operational factors: i.e., mass transfer limitations and the conductivity of the biofilm.
The use of open-circuit operation to aid energy and discontinuous MFC operation in MFC biofilms have been shown to be associated with charge accumulation and double-layer capacitance in MFC biofilms, particularly with regard to the presence of Geobacter sulfurreducens, a key electroactive microorganism [12]. This microorganism has the capacity to not only facilitate direct electron transfer to the anode but may also utilise cytoplasmic cytochromes within the biofilm matrix as an electrostorage mechanism. It is clear that within the biofilm matrix a range of electroactive species exist, including actively excreted quinone molecules produced by Shewanella oneidensis [13]. Indeed, pseudocapacitance effects based on both double-layer capacitance and redox active c-type cytochromes in Geobacter sulfurreducens biofilms were modelled and it was found that the presence of the c-type cytochromes increased the overall capacitance by a factor of two [14]. The importance of the redox state was further examined by Krige et al. [15], where Raman microscopy was used to demonstrate that the oxidation state was a good indicator of cellular metabolic activity in Geobacter sulfurreducens. The development of robust biofilms with inherent capacitive properties is viewed as being important as this can have a direct impact on electrogenic properties such as power over-shoot [16]. The importance of key microorganisms such as Shewanella oneidensis and Geobacter sulfurreducens to electrogenic performance is well established; however, due to the 3-dimentional structure of the support matrix, there is little in-situ spatial/image information on bio-electrodes. Epi-fluorescent microscopy has been used to visualise the overall biofilm structure [17], and confocal laser scanning microscopy has been specifically used to investigate Shewanella oneidensis biofilm structures. There has been little work investigating where specific microbial groups exits within carbon-based biofilms and how this spatial organization might affect system performance.
pH is an important parameter in the operation of MFCs, as the chemical formation and movement of protons from the anode to the cathode is integral to system operation. The Nernst equation shows that each pH unit change across a cell membrane represents a potential loss (overpotential) of 0.059 V through the development of high anodic equilibrium potentials. In a MFC dual-chamber system, He et al. [18] found that reducing the anode chamber to pH 5 also reduced the current density tenfold. The actual pH that develops in an MFC anode will be dependent on the type and concentration of buffering used and the composition of substrates; when high concentrations of fermentable carbohydrates are fed to an MFC, the pH can rapidly drop due to the formation of acidic products by fermentative metabolism, but it has also been reported that even if low pH values cause a reduction in power production this power can again recover if the pH is again re-adjusted to 7 [19]. Low pH can also have a direct effect on the respiratory activity of electrochemically active bacteria (EAB), and it has been demonstrated that this can be a particular concern in anodic biofilms, where the build-up of protons due to mass transfer limitations can lead to significant localised drops in pH close to the electrode [20]. However, it has also been shown that bacteria such as Shewanella spp. can be acclimated to operation at pH levels as low as 5 [21]. Whilst pH can have a large effect on performance, the inherent structure of the biofilm will also dictate how different anodic systems respond to a given perturbation.
A number of previous studies have investigated the use of carbon materials for biofuel cell applications, but there has been little work on the development and performance of electrogenic biofilms with different carbon types and how this may impact the performance efficacy. The aim of this study was to investigate how different carbon types influenced anodic biofilm development and subsequent reactor performance. Dual-chamber reactors were used to maintain all carbon materials in exactly the same MFC operational conditions, as all four different types of carbon materials, each with an external area of 4 cm2, were sited together in the anode chamber. The anode material provides the support for the initial attachment of microorganisms and subsequent electrogenic biofilm growth. Different physical properties are associated with different anode materials, and their corresponding three-dimensional properties at the micro scale will affect how microorganisms within electrogenic biofilms attach, develop and facilitate exocellular electron transfer. To understand the efficacy of electrogenic biofilm development, the levels of biofilm, anode performance, microbial population and charge accumulation were all assessed using the different carbon materials as support structures. The performances of these materials were then compared with an open-circuit-acclimated control.

2. Materials and Methods

2.1. MFC Construction and Operation

H-type MFCs were constructed using two media bottles (320 mL capacity, Corning Inc., New York, NY, USA) joined by a glass tube containing a 2.1-cm-diameter cation exchange membrane (CMI-7000, Membrane International Inc., Ringwood, NJ, USA). The anode utilised four different anode carbon materials during MFC operation—TGPH-120 Toray carbon paper (Alfa Aesar), E-TEK, NJ, USA, (2.5 cm × 4.5 cm); V2 carbon felt (2.5 cm × 4.5 cm), Mast Carbon Advanced Products Ltd., Devon, UK; carbon rod cluster (4.5-cm length and 1-cm total diameter, made up of-3 mm hollow individual rods), Mast Carbon Advanced Products Ltd., Devon, UK; graphite rod, (1-cm diameter), Mast Carbon Advanced Products Ltd., Devon, UK. All cathode electrodes were made of plain porous carbon paper (TGPH-120, Toray carbon paper (Alfa Aesar), E-TEK, 2.5 cm × 4.5 cm, projected area of 22.5 cm2) with an incorporated Pt catalyst (0.35 mg/cm2; 10% Pt; E-Tek, Somerset, NJ, USA). Ferricyanide solution (100 mM in phosphate buffer, 100 mM, pH 7) was used as a catholyte in order to maintain cathode potential. The different physical characteristics of the carbon were as in Table 1.
The MFC reactors were acclimated/operated in batch mode in an open circuit or with a fixed load resistance of 1000 Ω. The reactors were fed with 1000 mg/L sucrose on a weekly basis; anode potentials were measured as the maximum steady-state value achieved in each cycle (before any substrate depletion effects). Each reactor was connected, and the voltages across the MFCs were recorded at 10-min intervals using LabVIEW™ software and an NI 16-Bit isolated M Series MIO DAQ, (National Instrument Corporation Ltd., Berkshire, UK). The reactors were inoculated with a 10% anaerobic digestion sludge (Cog Moors wastewater treatment plant, Cardiff, Wales) in nutrient buffer media and were operated in batch mode and fed with 40 mg/L acetate on a weekly basis during the acclimation phase. Nutrient buffer medium containing 100 mM phosphate buffer (pH 7.0) was added to the substrate as part of the feeding process. To assess the effects of pH on the biofilms during subsequent experiments, a syringe/needle was placed in the sample port, which allowed the stepwise manual (dropwise) introduction of 1 M HCl into the anode chamber. The pH change was monitored by a pH probe which had been sealed and fitted into the anode cap. pH values in the anode substrate/media were then sequentially adjusted to pH 6.0, 5.5, 5.0, and 4.5.

2.2. Analyses

2.2.1. Electrochemical and Chemical Analysis

Voltage and current were monitored using the digital data logging system detailed above (National Instruments, LabVIEW™, Austin, TX, USA). The cyclic voltammetry measurements were carried out under potentiodynamic control (scan rate 1–50 mV s−1), using a Solartron Electrochemical Interface (Solartron Ltd, Farnborough, UK) controlled by dedicated software (CorrWare 2™, Scribner Associate Inc., Southern Pines, NC, USA); open-circuit reactors were immediately placed back in open-circuit mode after the measurement was complete. Cyclic voltammetry was carried out using a conventional three-electrode system with the anode as the working electrode, the cathode (2.5 cm2, 0.35 mg/cm2; 10% Pt; E-Tek, NJ) as the counter electrode, and an Ag/AgCl reference electrode. Power density plots, polarisation curves and internal resistance were measured and calculated using an automated system programmed to change the load over time. Measurement of accumulated charge was carried out by switching between open-circuit (OC) (charging) and closed-circuit (CC) (discharging) operation, this was carried out at OC periods of 0.5, 1, 5, 30, 90, 180 and 900 min, and CC operation until base-line voltage was reached. The influence of different OC periods on the average current at R = 1000 Ω was then determined by calculating the overall charge by integrating the different peaks. Each of these experiments was carried out over a number of repeated OC/CC cycles; the results represent the average of two cycles on both reactors. pH measurements were recorded using the ThermoOrion Hydrus 300 system (Thermo Fisher Scientific Inc., Waltham, MA, USA). The specific surface area values were calculated according to the BET (Brunauer–Emmett–Teller) equation using a Micromeritics ASAP2020 BET Surface Area and Porosity Analyser (Micromeritics UK Ltd., Lincoln, UIK. Characterisation of the samples was carried out using N2 adsorption/desorption at −196 °C, and the surface BET (sBET) was determined over 0.05–0.3 relative pressures.

2.2.2. Molecular Analysis and Microbial Diversity Studies
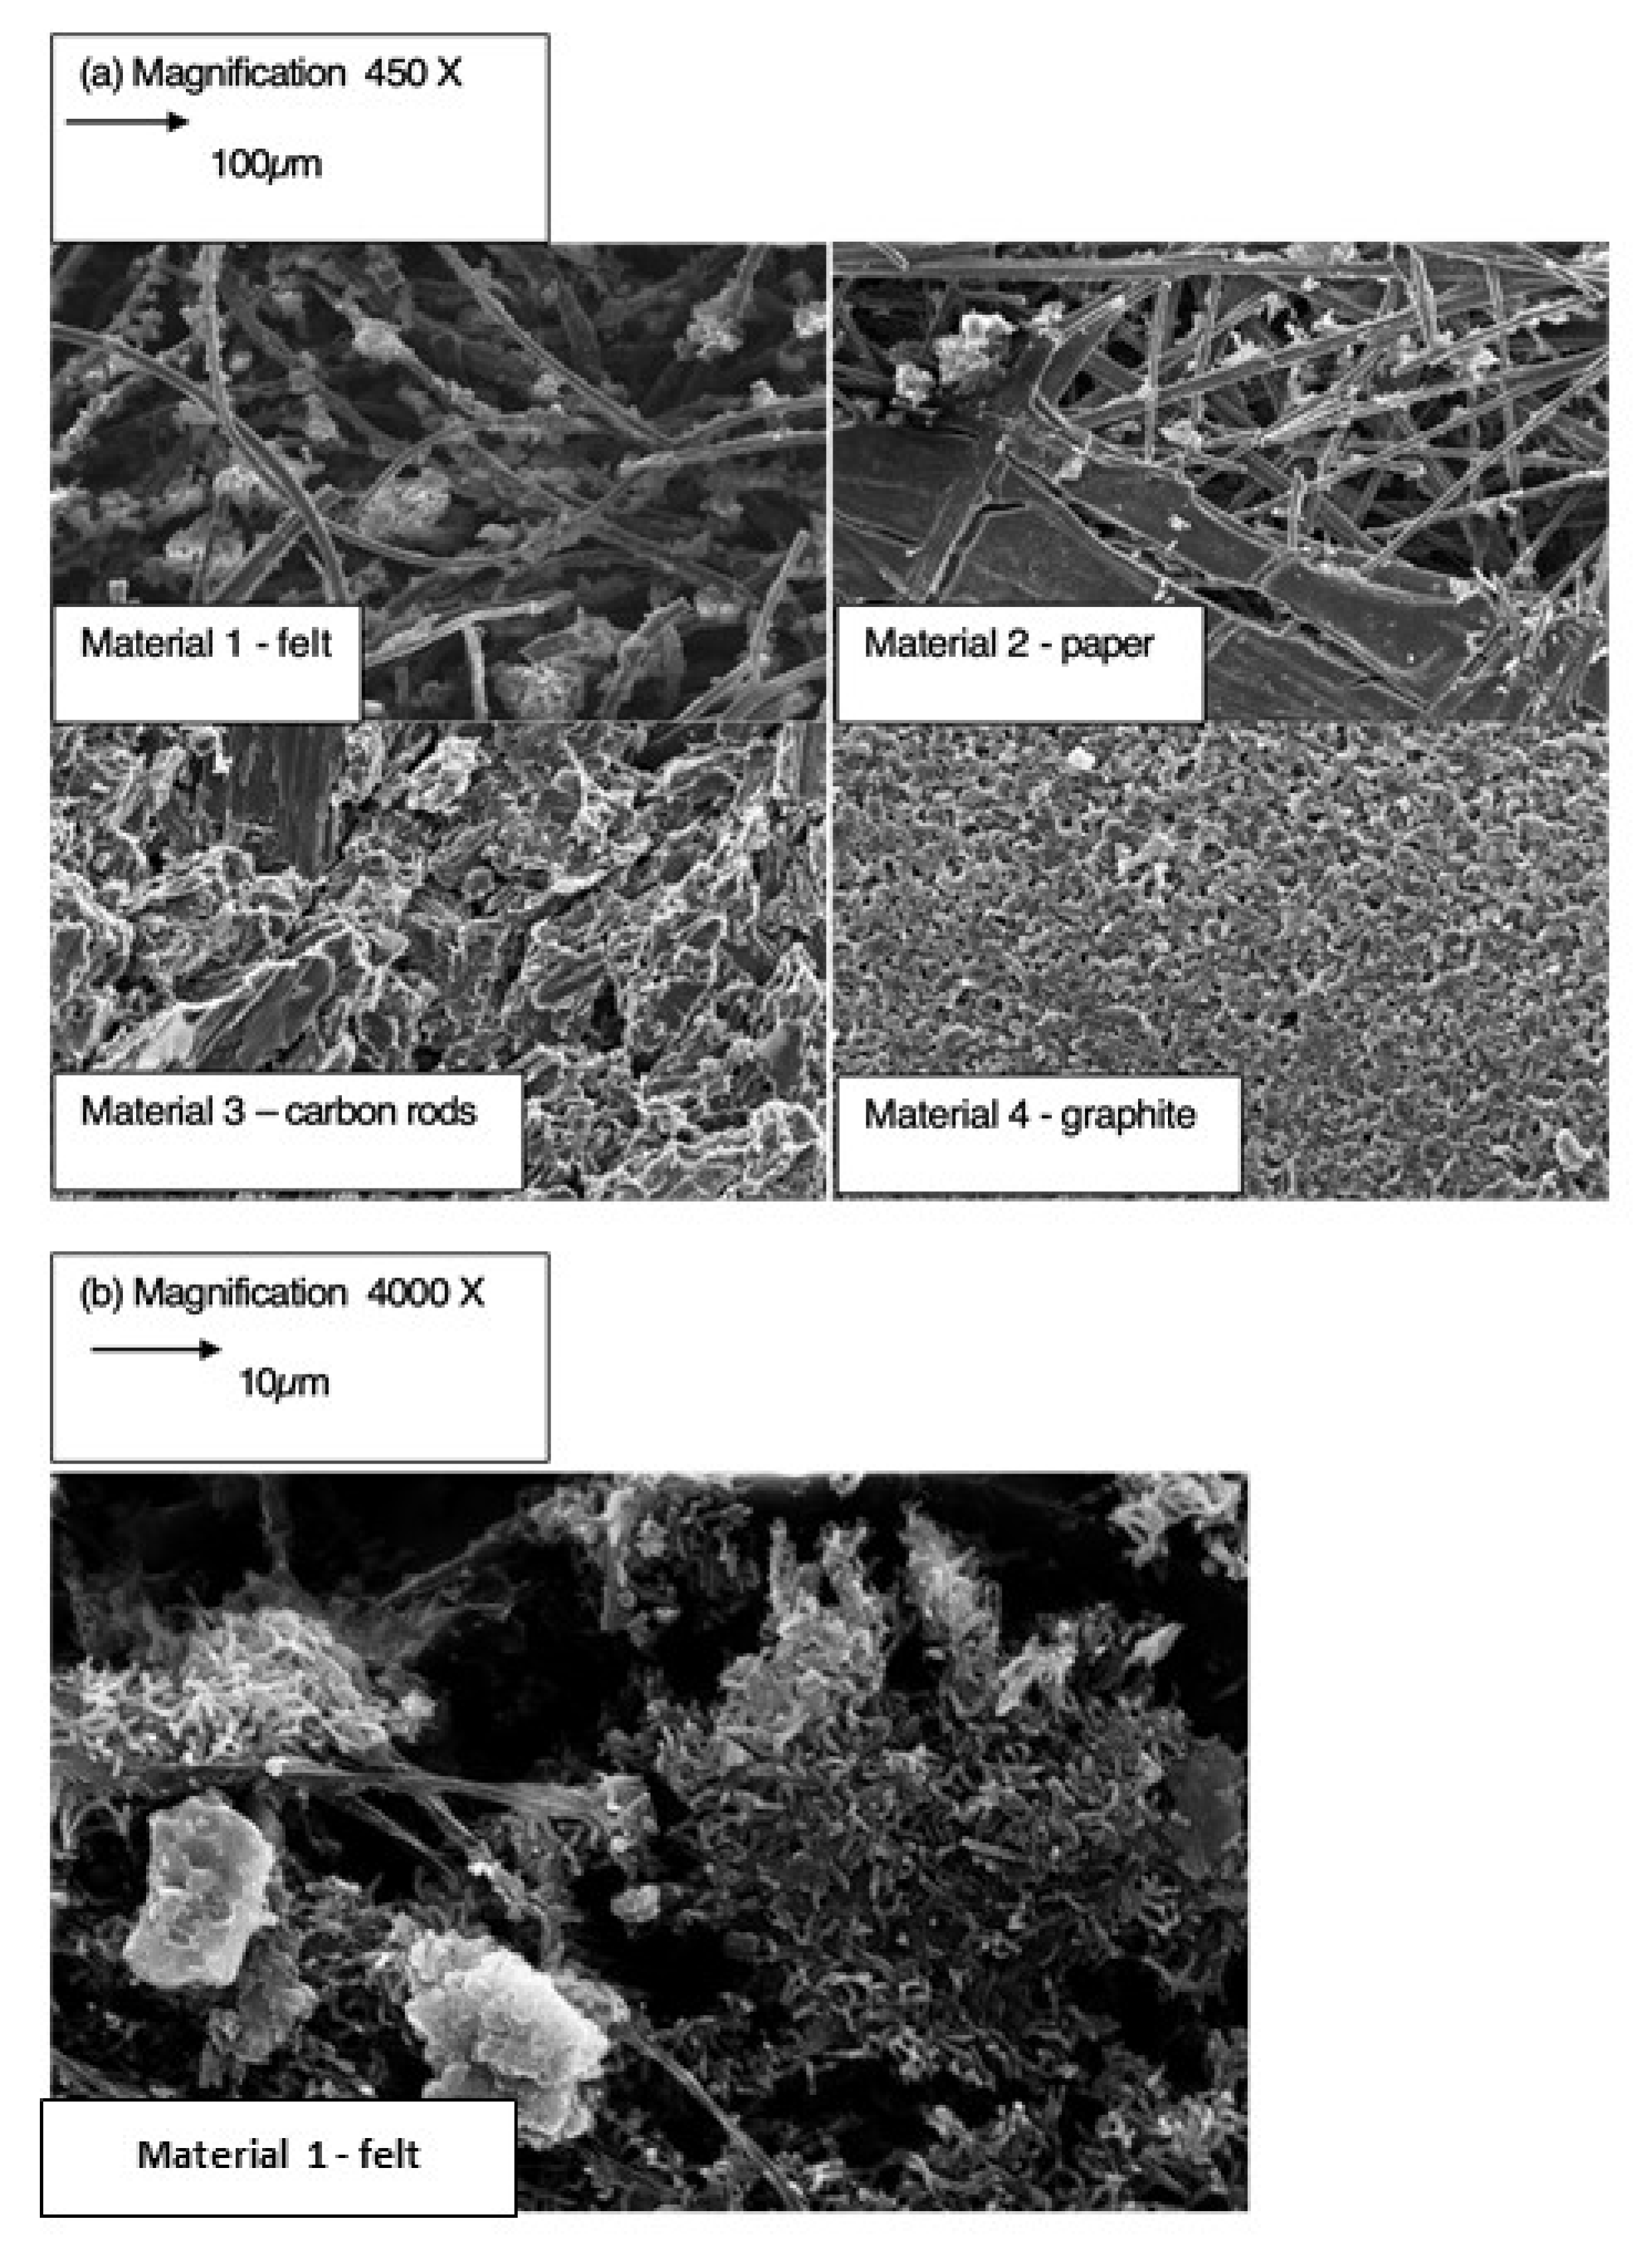
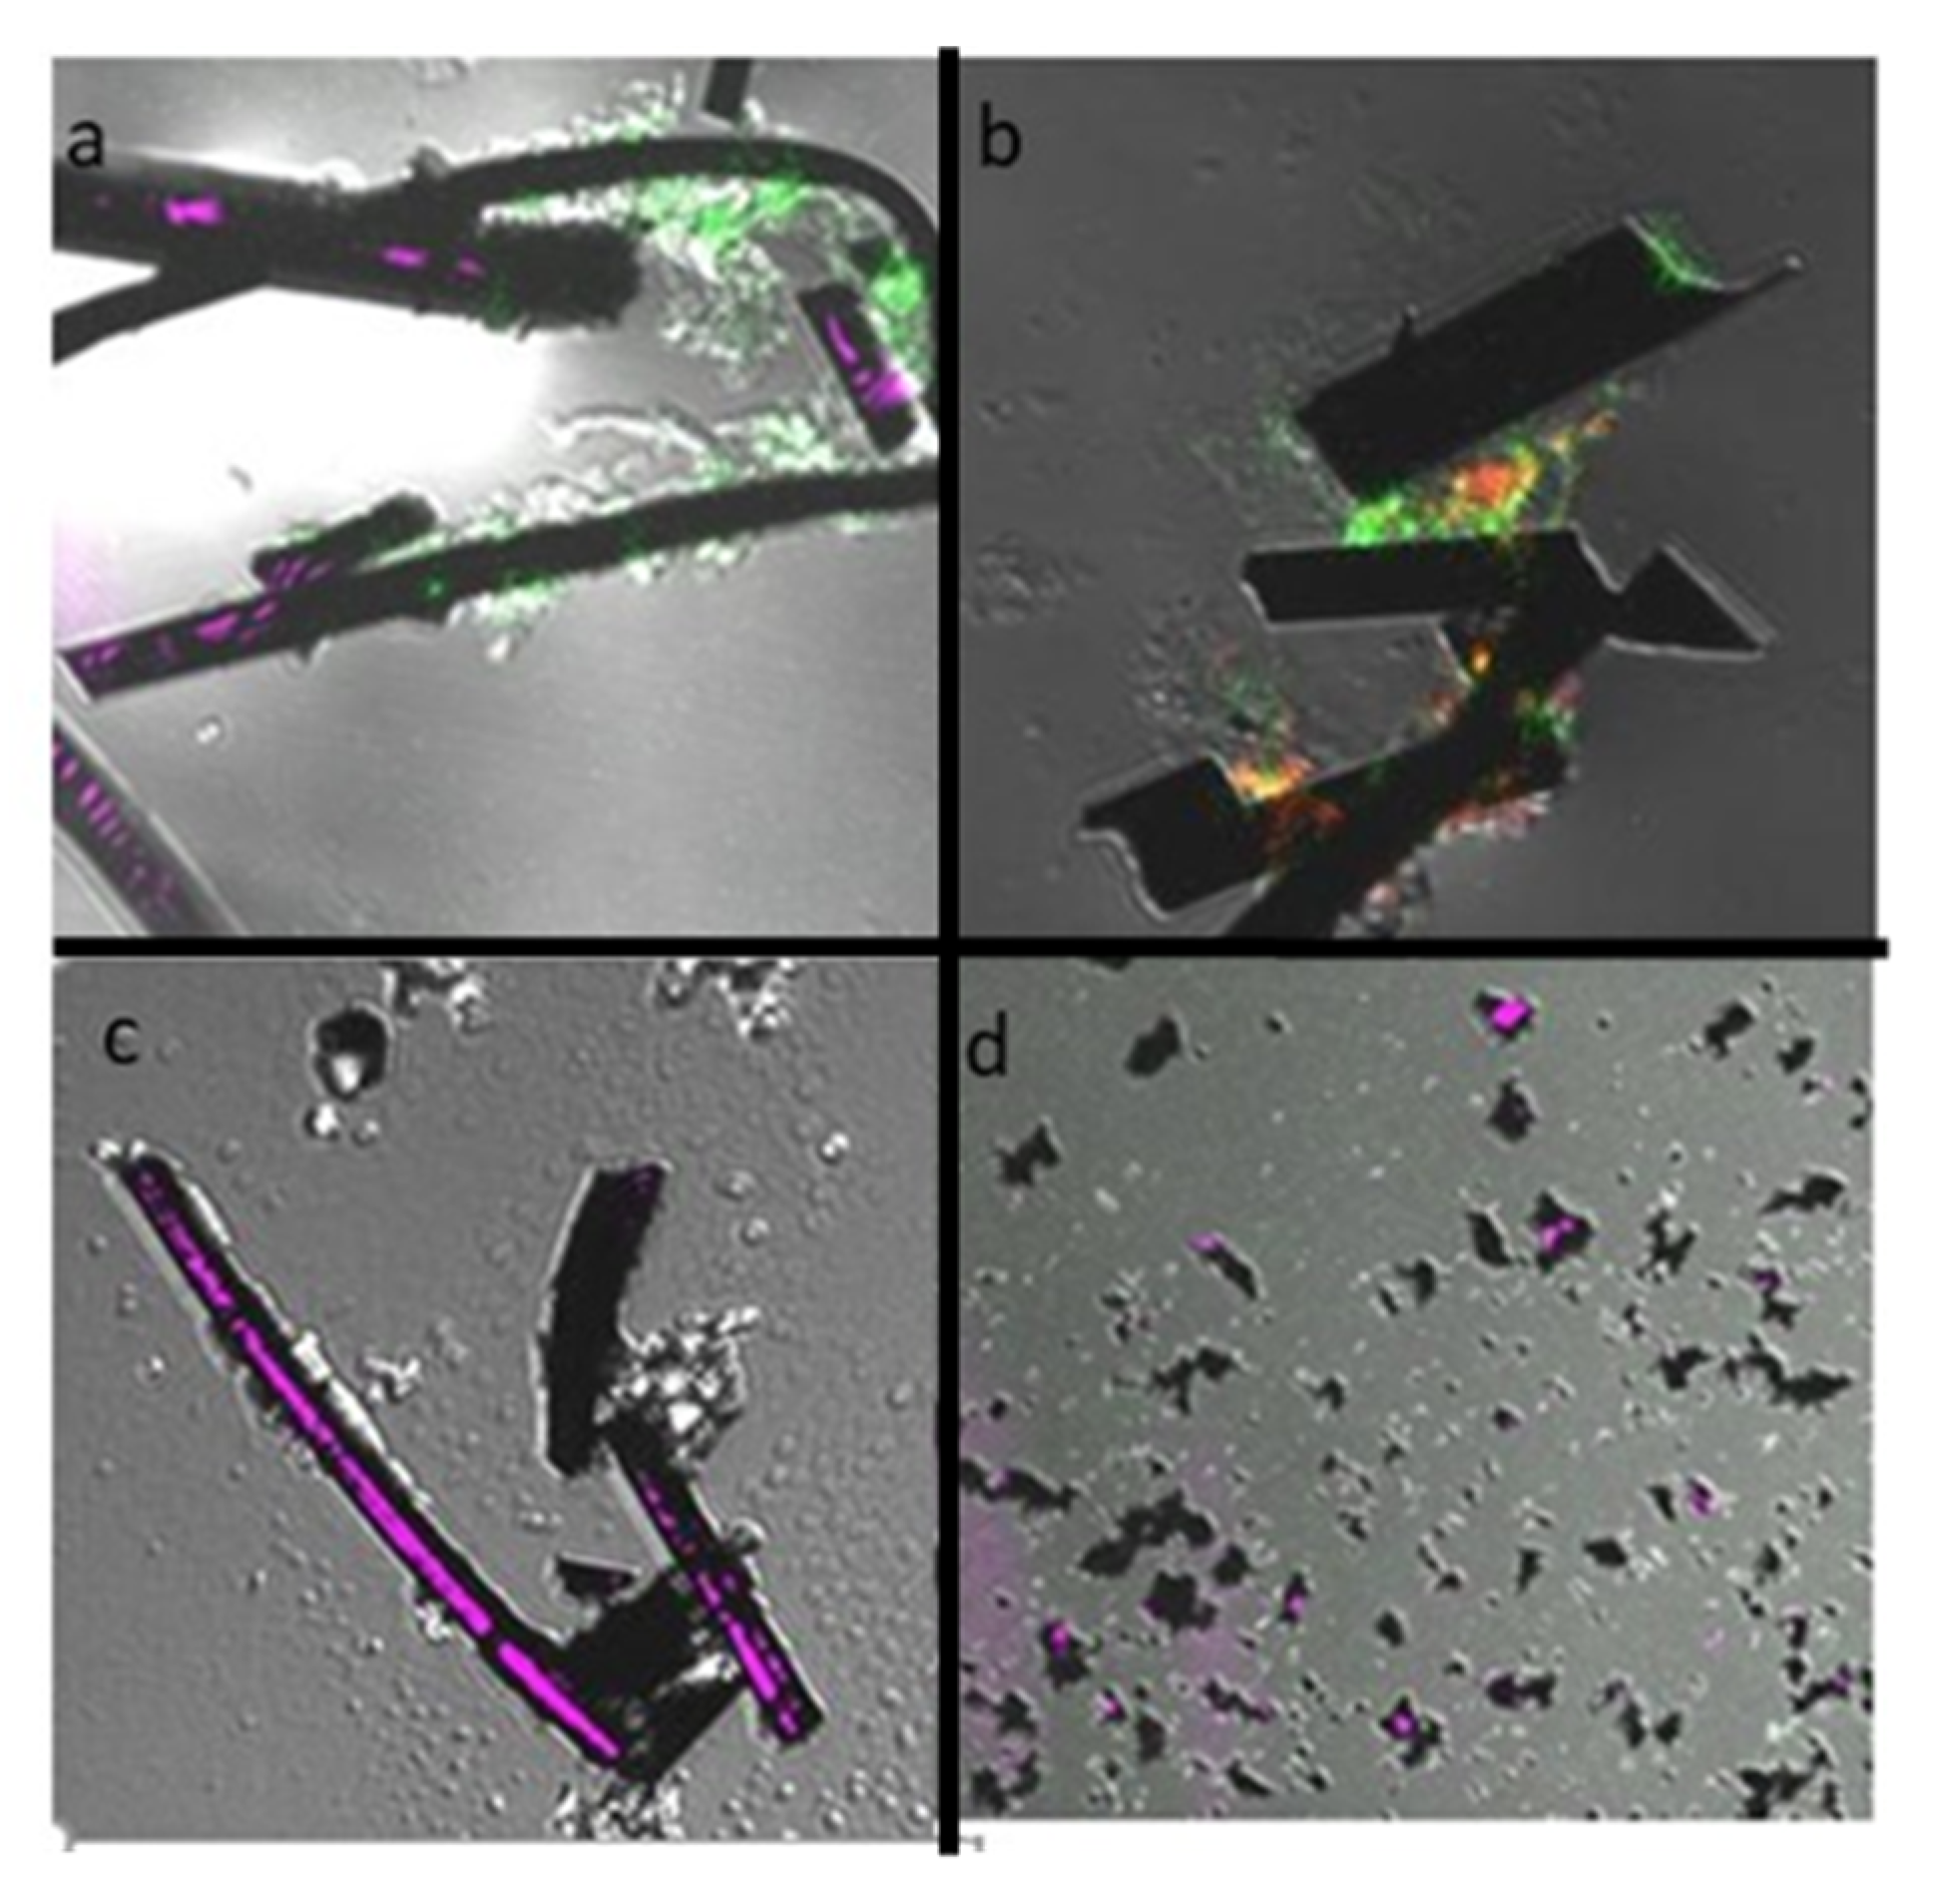
The biofilm samples from the different carbon materials were aseptically sampled and then trimmed to 1 cm2. Genomic double-stranded DNA (dsDNA) was isolated from 1 cm2 of the carbon samples from each of the anodes. These were then mechanically disrupted by bead beating and a phenol/chloroform/iso-amyl-alcohol extraction. DNA concentrations were measured using a NanoDrop™ 1000 spectrophotometer (Thermo Scientific); these values were used as a measure of biomass/biofilm growth. PCR-DGGE analysis was used as an initial population screen using Archaeal primers 0968F-GC and 1401R and universal bacterial primers 0109F-T and 0515R-GC. Microbial ecological analysis of the DGGE band profiles (Archaeal and Bacterial communities) were analysed to evaluate microbial diversity, with UPGMA (average linking method) used as the hierarchical clustering method. Sequencing of the anodic carbon was performed using a GS FLX sequencer and titanium series chemistry (Macrogen Inc., Seoul, Korea) using Archaeal and universal PCR primers ARC346-F (5-GGGGYGCAGCAGGCG-3′) and ARC915-R (5-GTGCTCCCCCGCCAATTCCT-3′). Sequencing was performed using an emPCR Lib-A kit (Roche Applied Science, Basel, Switzerland) and the BLAST algorithm was used to analyse the sequences for taxonomic assignment.

2.2.3. Microscopy

For scanning electron microscopy (SEM), the anode biofilm samples were fixed in 2.5% glutaraldehyde in 10mM HEPES (pH 7.4) overnight. The samples were dehydrated in a graded series of aqueous ethanol solutions (30–100%) and then critical point-dried using bis(trimethylsilyl)amine (Sigma, Poole, UK). Sample were then mounted on aluminium stubs, sputtered with gold and examined in a LEO 1430 SEM (Zeiss, Welwyn Garden City, UK).
For FISH confocal scanning microscopy (CLSM), the anode biofilm was fixed in 4% paraformaldehyde solution for 24 h at 4 °C. The slides were gelatin-coated with 0.1% gelatin and 0.01% CrK(SO4)2 before being embedded in Tissue-Tek OCT compound (Sakura Finetek, Torrance, CA, USA). After rapidly freezing the embedded sample at −20 °C, 10-μm-thick vertical thin sections were prepared using a cryostat microtome (Reichert-Jung Cryocut 1800, Leica, Bensheim, Germany). Fluorescence in-situ hybridization was carried out using 16S-targeted oligonucleotide probes for bacteria (EUB338), Geobacter cluster (Geo3-A), Archaea (ARC915), gamma Proteobacteria (Gamma42a) and delta bacteria (Delta495a). The probes were labelled with either FAM, TAMRA or Texas Red at the 5’ end. A confocal laser-scanning microscope (LSM510 Carl Zeiss, Oberkochen, Germany) equipped with an Ar ion laser (488 nm) and HeNe laser (543 nm) was used to carry out the microscopy work.

3. Results

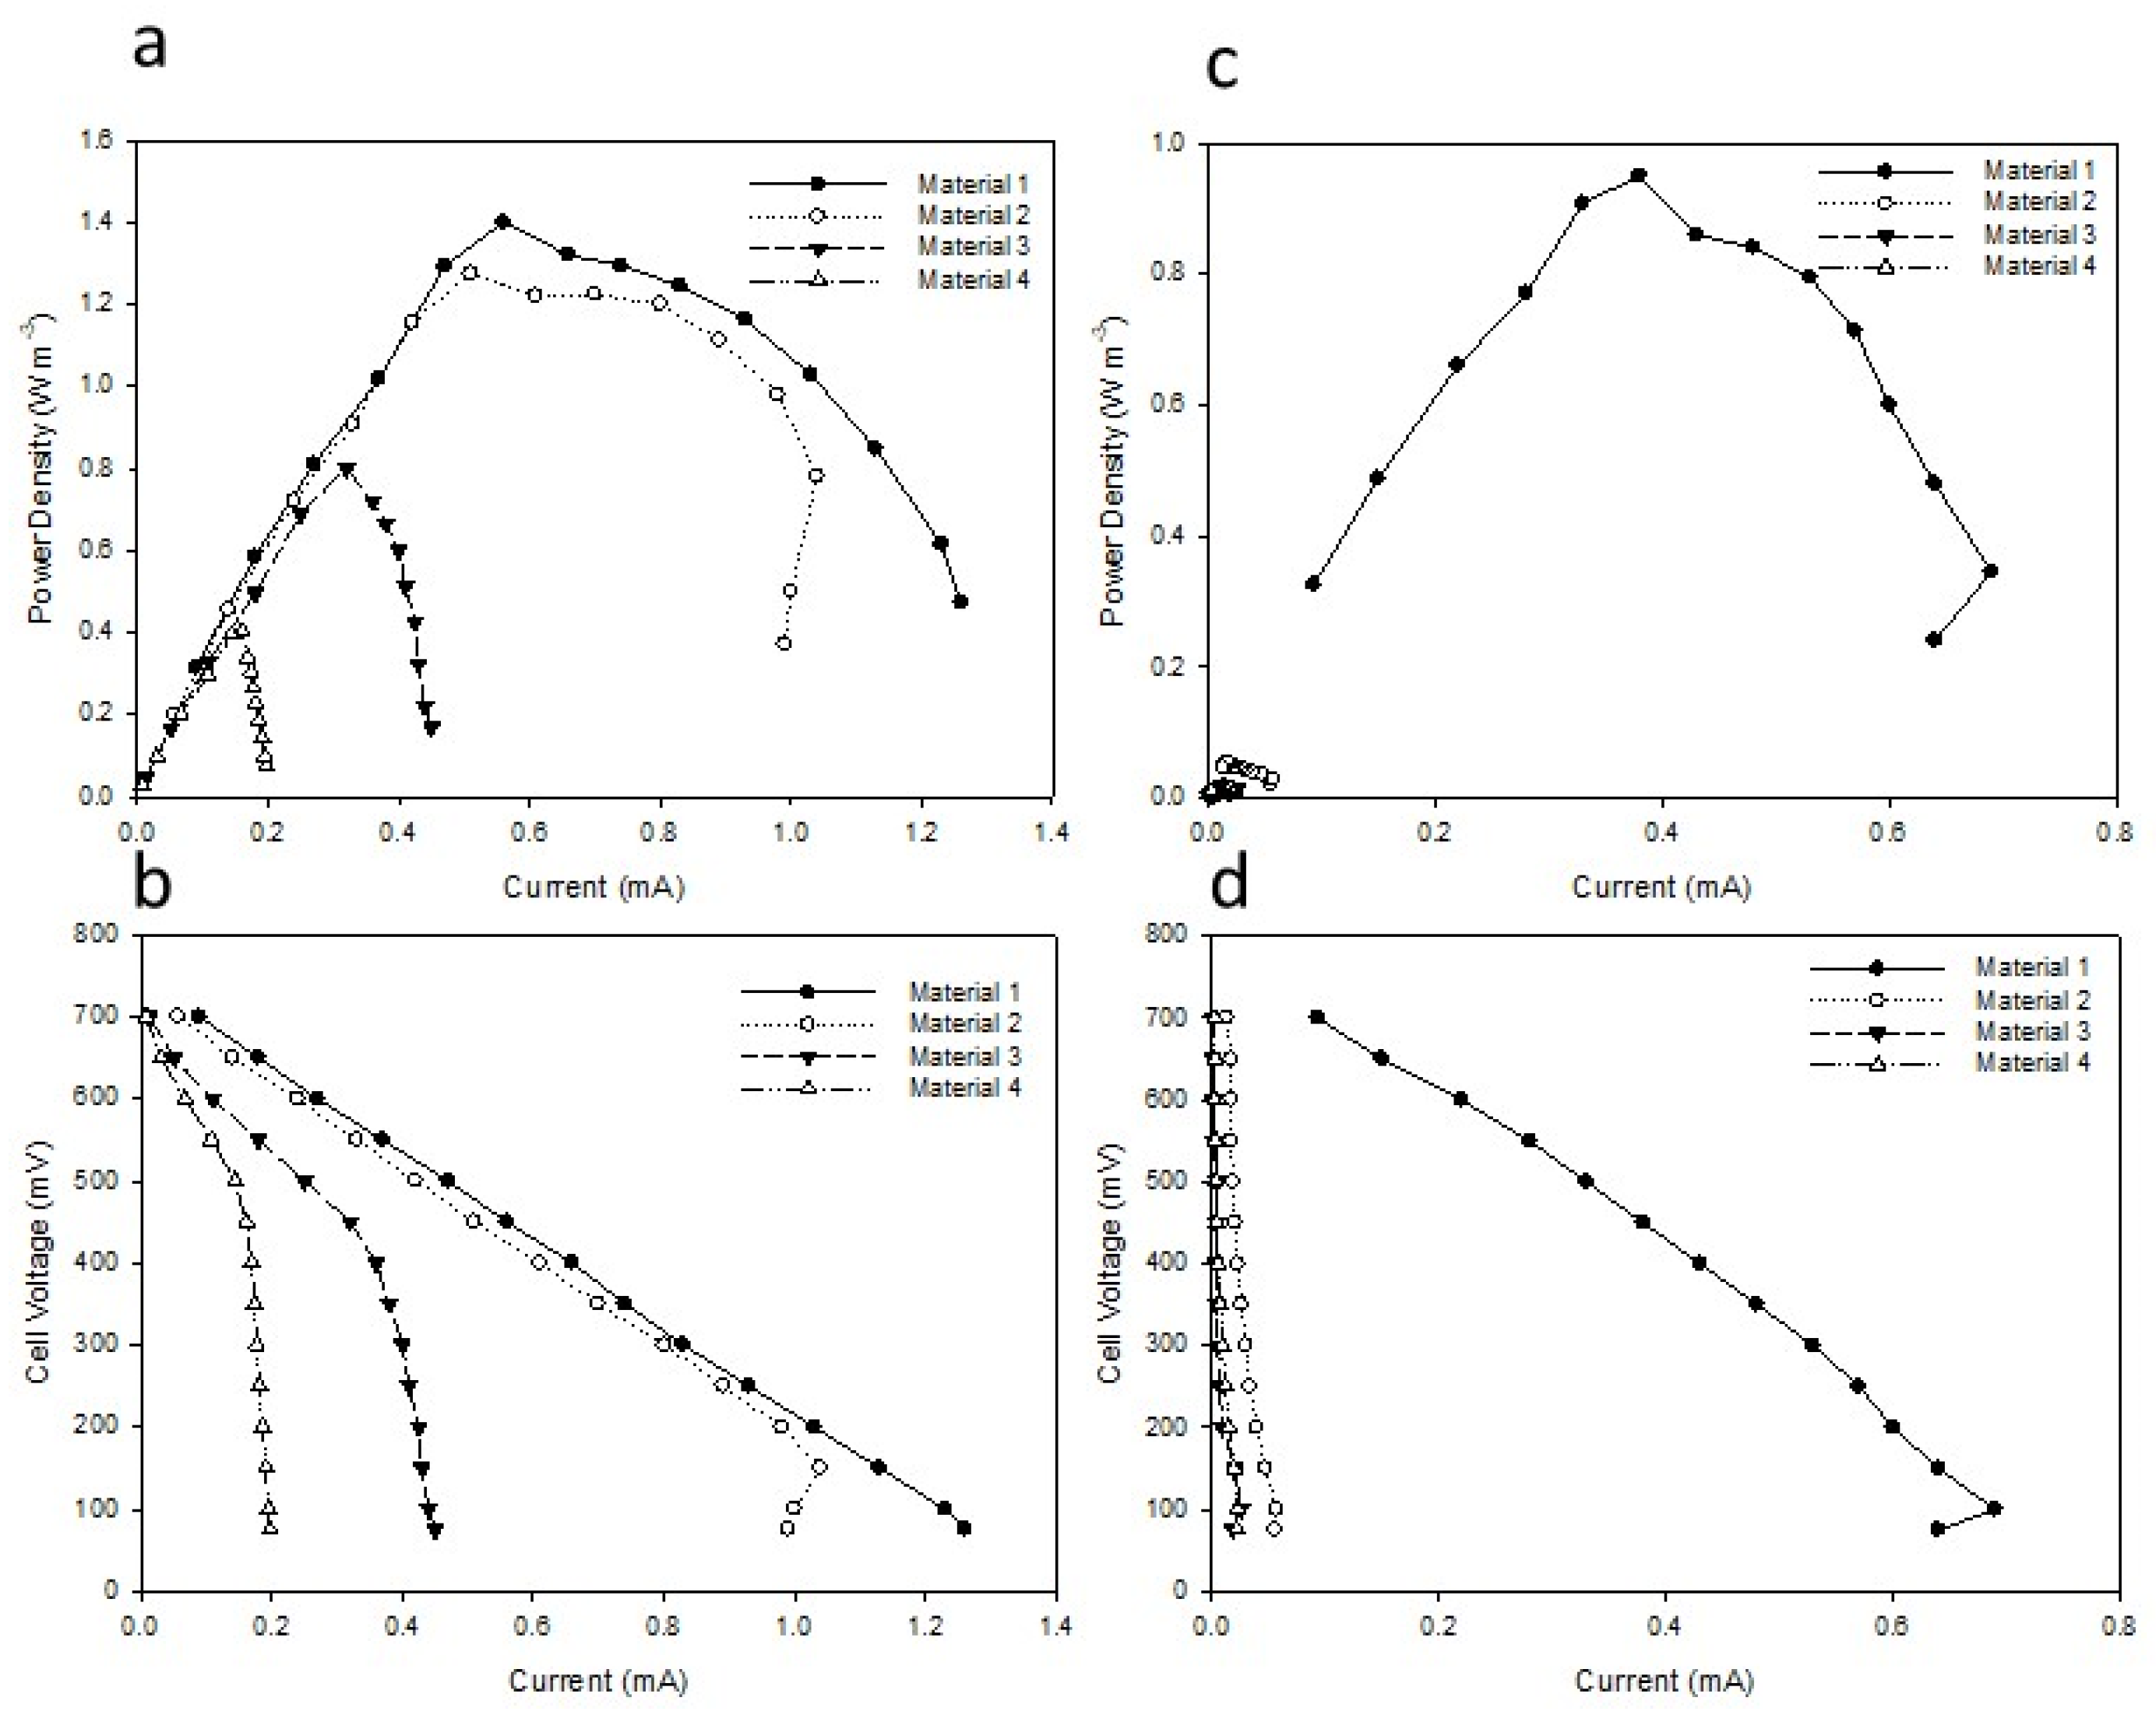
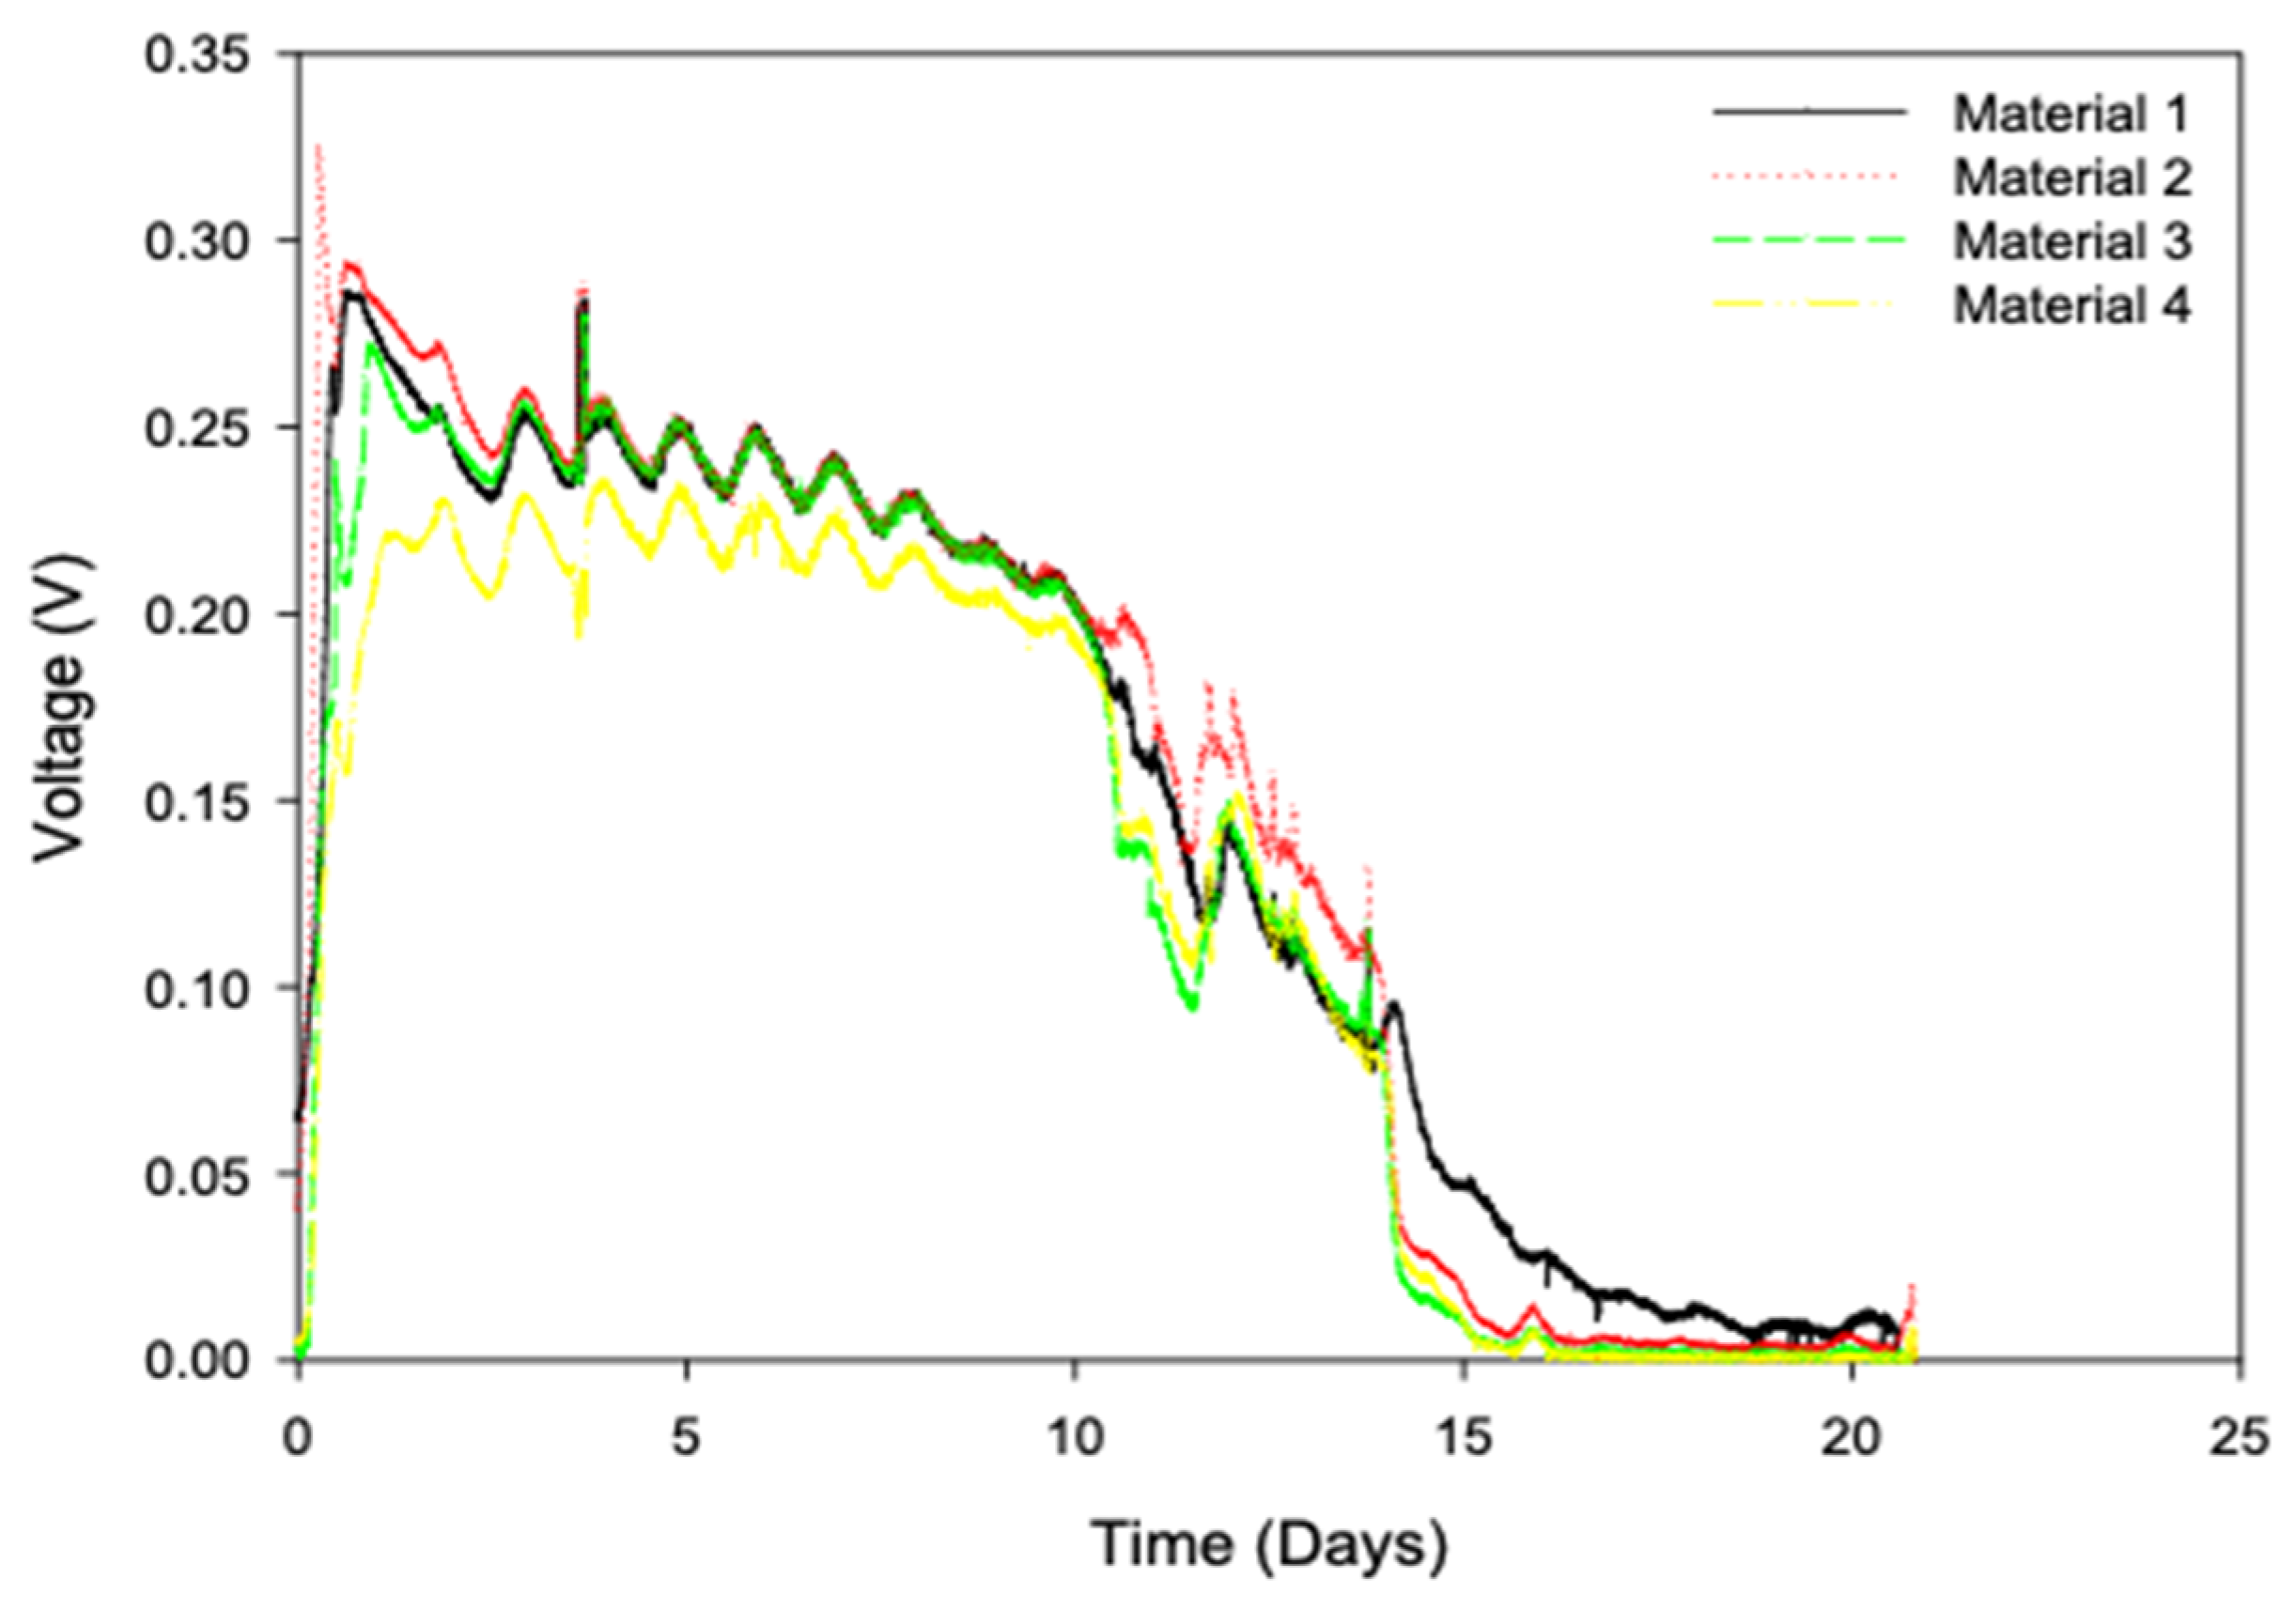
3.1. Electrogenic Biofilm Development with Different Open- and Closed-Circuit-Acclimated Carbon Anode Materials

Four weeks post-inoculation the anode biofilm was established as produced in the closed-circuit MFC. Figure 1 shows voltages for the different materials at steady-state operation over one batch feeding cycle (a number of cycles were carried out with a voltage range of +/−10%). At this point, it could be observed that carbon materials 1 and 2 (felt and paper) produced the highest maximum voltage of 0.29 V, compared to 0.27 V and 0.23 V from materials 3 and 4 (tubes and rods) respectively. Material 1 (felt) sustained a higher voltage, even when substrate depletion occurred, indicating that this biofilm contained a more efficient electrogenic biofilm and/or the porous material was able to retain substrate to continue anaerobic respiration at a higher rate for a longer period (Figure 1).
After 3 months of batch-fed operation, archaeal and bacterial community profiles were investigated in both the open-circuit and closed-circuit MFCs using DGGE analysis. The archaeal profiles of materials 1-4 showed that material type did not affect Archaeal species development in materials 2, 3 and 4, as these profiles shared 95.7–100% similarity scores. However, material 1 (felt) shared only a 78.1% similarity, having developed a richer archaeal profile. A profile from the open-circuit reactor biofilm (material 1) also produced a 75.9% similarity with the other closed-circuit material types, sharing a number of common bands with the closed-circuit anode biofilms; both open and closed-circuit anode biofilms digressed significantly from the sludge inoculum. The planktonic profile from the closed-circuit MFC had very low amounts of archaeal DNA and associated low numbers of visible bands, which may account for its low profile similarity score.
In contrast to the Archaeal community development, the bacterial profiles developed differently between open and closed-circuit conditions; with a similarity score of 62.1 between the two clusters, it was found that the similarity between the closed-circuit materials (1 to 4) was 88.7 to 96.2% but was between 70 and 86.4% with the open-circuit materials. It was also found that the closed-circuit planktonic profile was significantly different to the biofilm profiles (32.7%); this was in direct contrast with the open-circuit planktonic profile, which had a similarity value of 75.1%.
The development of distinct microbial populations between the open- and closed-circuit populations was confirmed by sequence analysis; there were no significant differences observed between the different material types. The bacterial closed-circuit biofilm was dominated by a large number of microorganisms associated with an unknown genus, followed by Alicycliphilus (10%) and then Geobacteraeceae (9.1%). The Archaeal populations were dominated by Methanosarcinaceae (87%). In contrast, the open-circuit Bacteria were dominated by Comamonadaceae (29.2%), Sedimentibacter (13.2%) and Microbacteriaceae (5.6%) and the Archaea by Methanobacteriaceae (54%); no Geobacteraeceae were detected.
Power curve analysis of the different material types in the closed circuit (Figure 2) showed that material 1 (felt) produced the highest power reading of Pmax 1.4 W/m3 or 0.7 W/m2 carbon anode. However, material 2 (paper) closely matched this reading with a measurement of 1.2 W/m3, with both materials 3 and 4 (tubes and rods) producing successively lower power densities. The power produced by material 1 (felt anode) was similar to other studies using dual-chamber reactors and a felt carbon anode, with Penteado et al. reporting a maximum power production of 420 mW/m2 [22]. When the internal resistances or ohmic overpotentials were calculated from the polarisation curves (Figure 2) this gave internal resistance values of 526 Ω, 526 Ω, 833 Ω and 2460 Ω for materials 1 to 4, respectively. As all other factors in the MFC were the same for all the material types—i.e., ionic resistances in the electrolyte and electronic resistances in the components and cathode—these differences are most likely to relate to the properties of the anode material and the levels of electrogenic biofilm development and its facility to accommodate electron transfer to the electrode. Materials 1 and 2 (felt and paper) had the same internal resistances but different power results; this shows that the former material had a lower charge transfer overpotential. This can be related to the associated properties of the biocatalytic biofilm and the association/interaction with the microstructure of the anode material itself. Hence, it is likely that material 1 facilitated more EAB to be present in a closer association with the carbon anode, enhancing electrogenesis and reducing activation losses. Figure 2 also shows the power curves of anode materials 1 to 4 from the open-circuit control reactor. The Pmax of material 1 (felt) was 0.95 W/m3 or 0.475 W/m2, 67.9% of the value achieved in the closed circuit but higher than the maximum closed-circuit power densities achieved by materials 3 and 4 (tubes and rods). The other open-circuit materials (2, 3 and 4) all produced power densities of <0.06 W/m3. Hence, even though a high number of bacterial species are common to the open and closed-circuit biofilms, there is a higher degree of similarity between the material 1 and 2 (felt and paper) open circuits than that of material 1 (felt) between the open and closed-circuit acclimations. This means that acclimation or selection of EAB species cannot be considered as the sole reason for the higher power density reading from the open-circuit material 1 (felt) system compared to the closed-circuit material 2 (paper).
Table 1 was used to characterise the physical aspects of the different carbon types; porosity values based on the BET measurements were calculated to be 74%, 69%, 32% and 14% for the felt, E-Tek paper, carbon tubes and graphite, respectively. Whilst these figures provide a good indication of the relative void volumes, BET measurements will only typically characterise 2–50 nm size ranges. The specific resistivity measurements show that the losses from the graphite-based materials were very low compared to the carbon felt and carbon paper, but this did not result in high current densities. Where metallic materials such as stainless steel have resistivity values of ~1 × 10⁻⁶ Ω/m, they will provide a 10-fold ohmic advantage over graphite; this material is rarely used in BES due to issues of cost and little clear improvement in performance to gauge the biofilm development on different carbon structures. SEM microscopy was used to assess the level of biofilm growth on the four different material structures (Figure 3). A thick and dense biofilm was observed to form on the felt material, with copious levels of biomass forming along the carbon fibres. Increasing the magnification showed that a large number of bacteria were attached both over the surface of the carbon material but also within the porous structure. High levels of biomass were also present on the fibres associated with the carbon paper, although less biofilm seemed to have accumulated within the depth on the anode due to the more compact nature of the carbon paper. It can be observed that materials 2, 3 and 4 (paper, tubes and rods) provide a less active surface area (to support biofilm/microbiological growth).

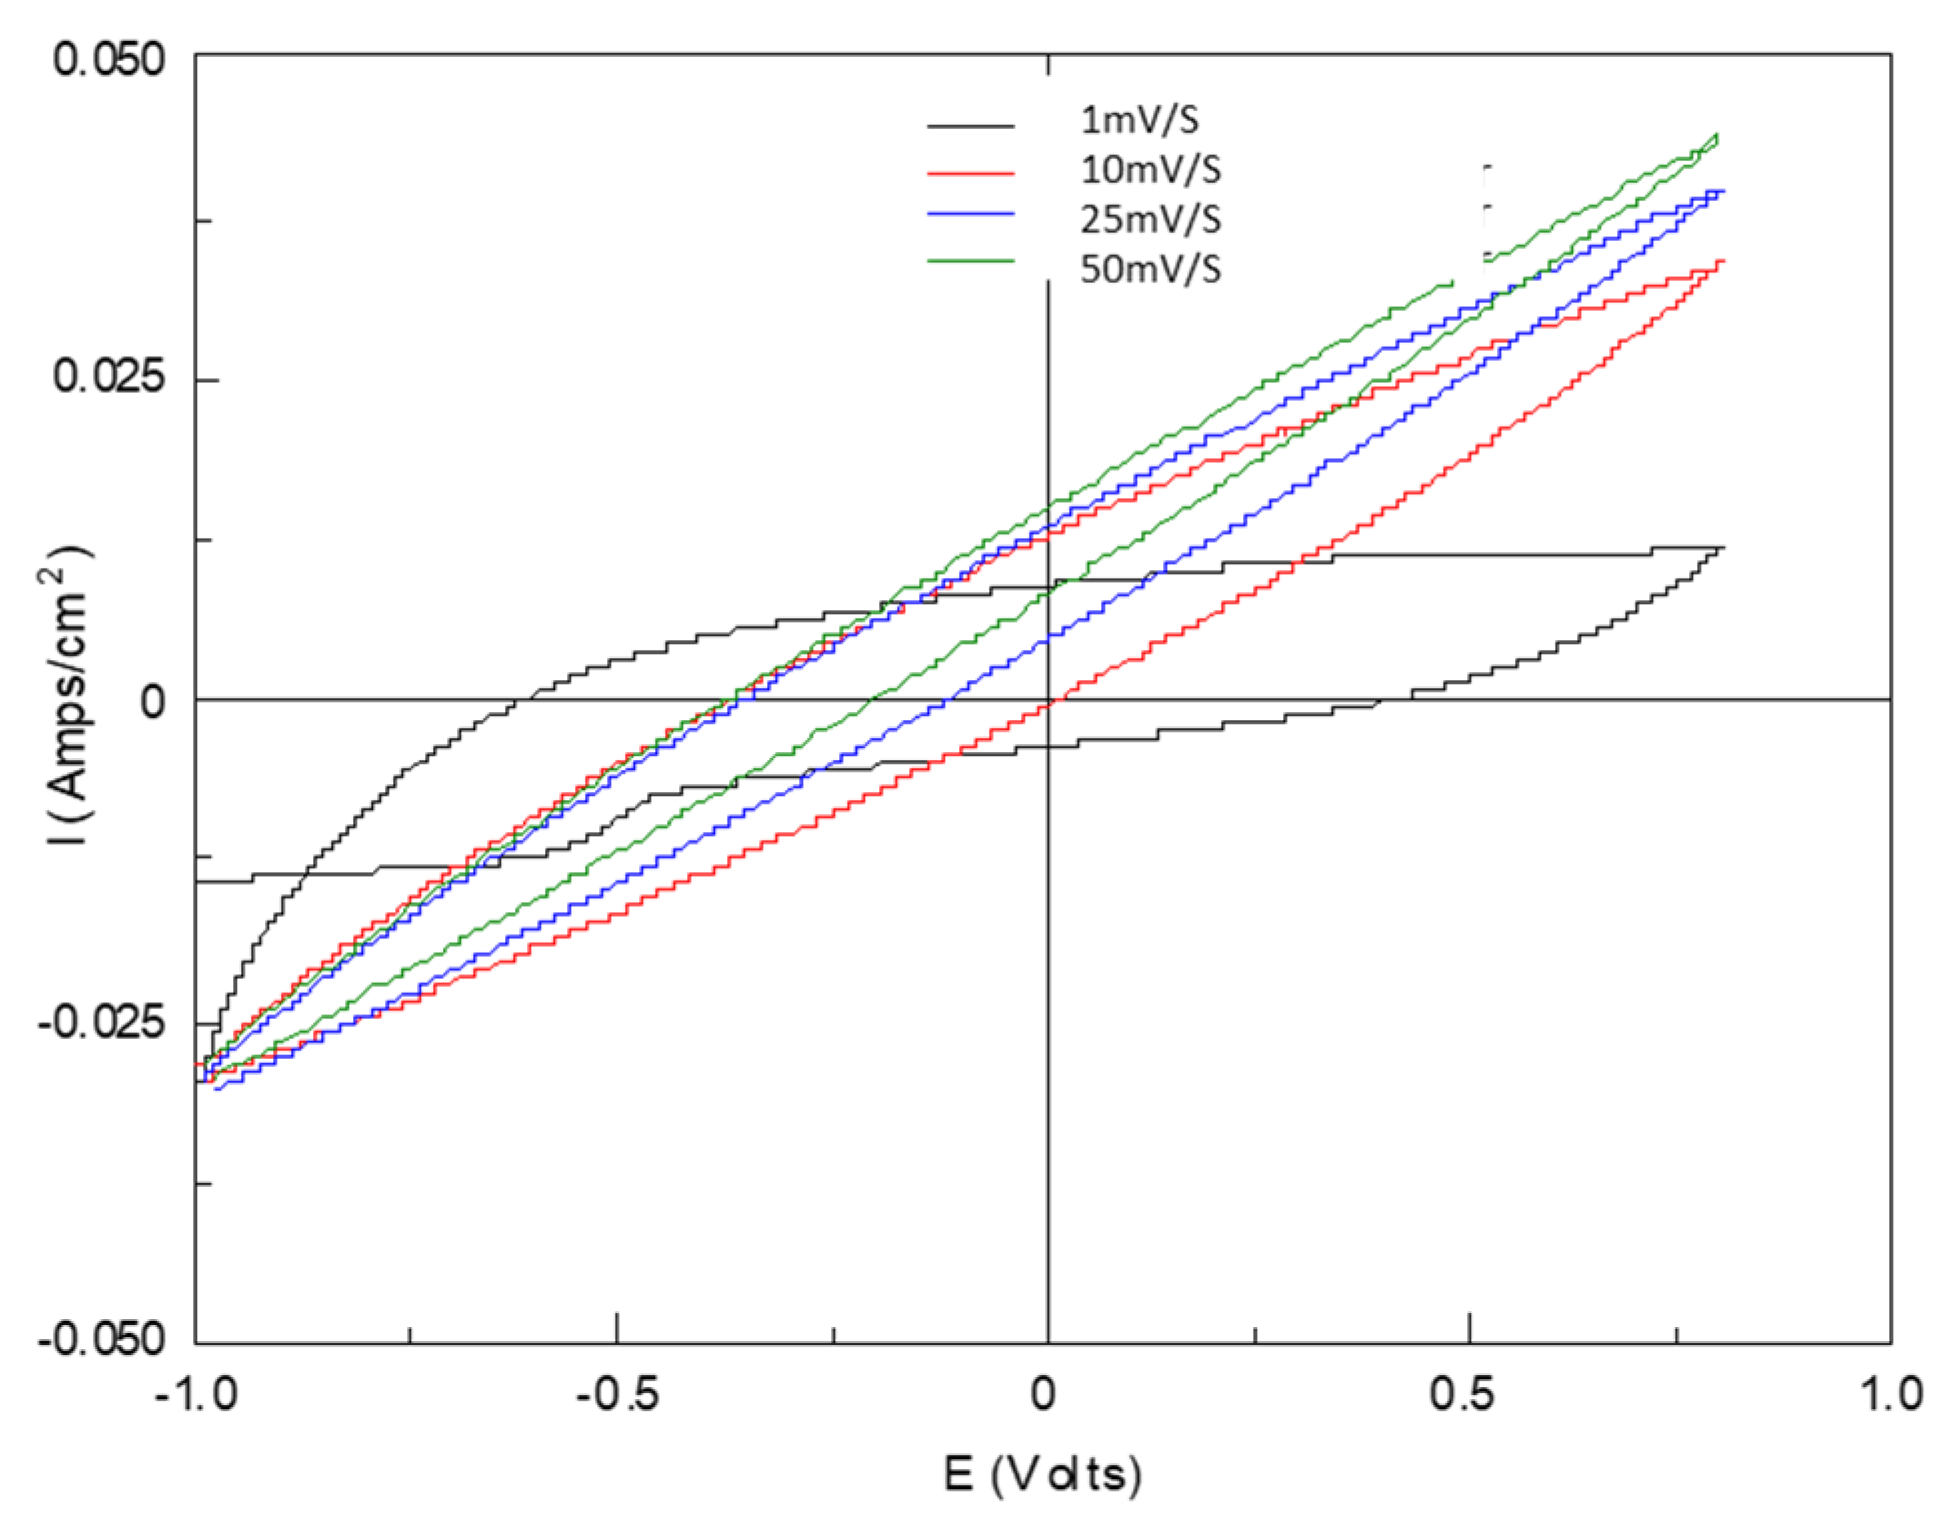
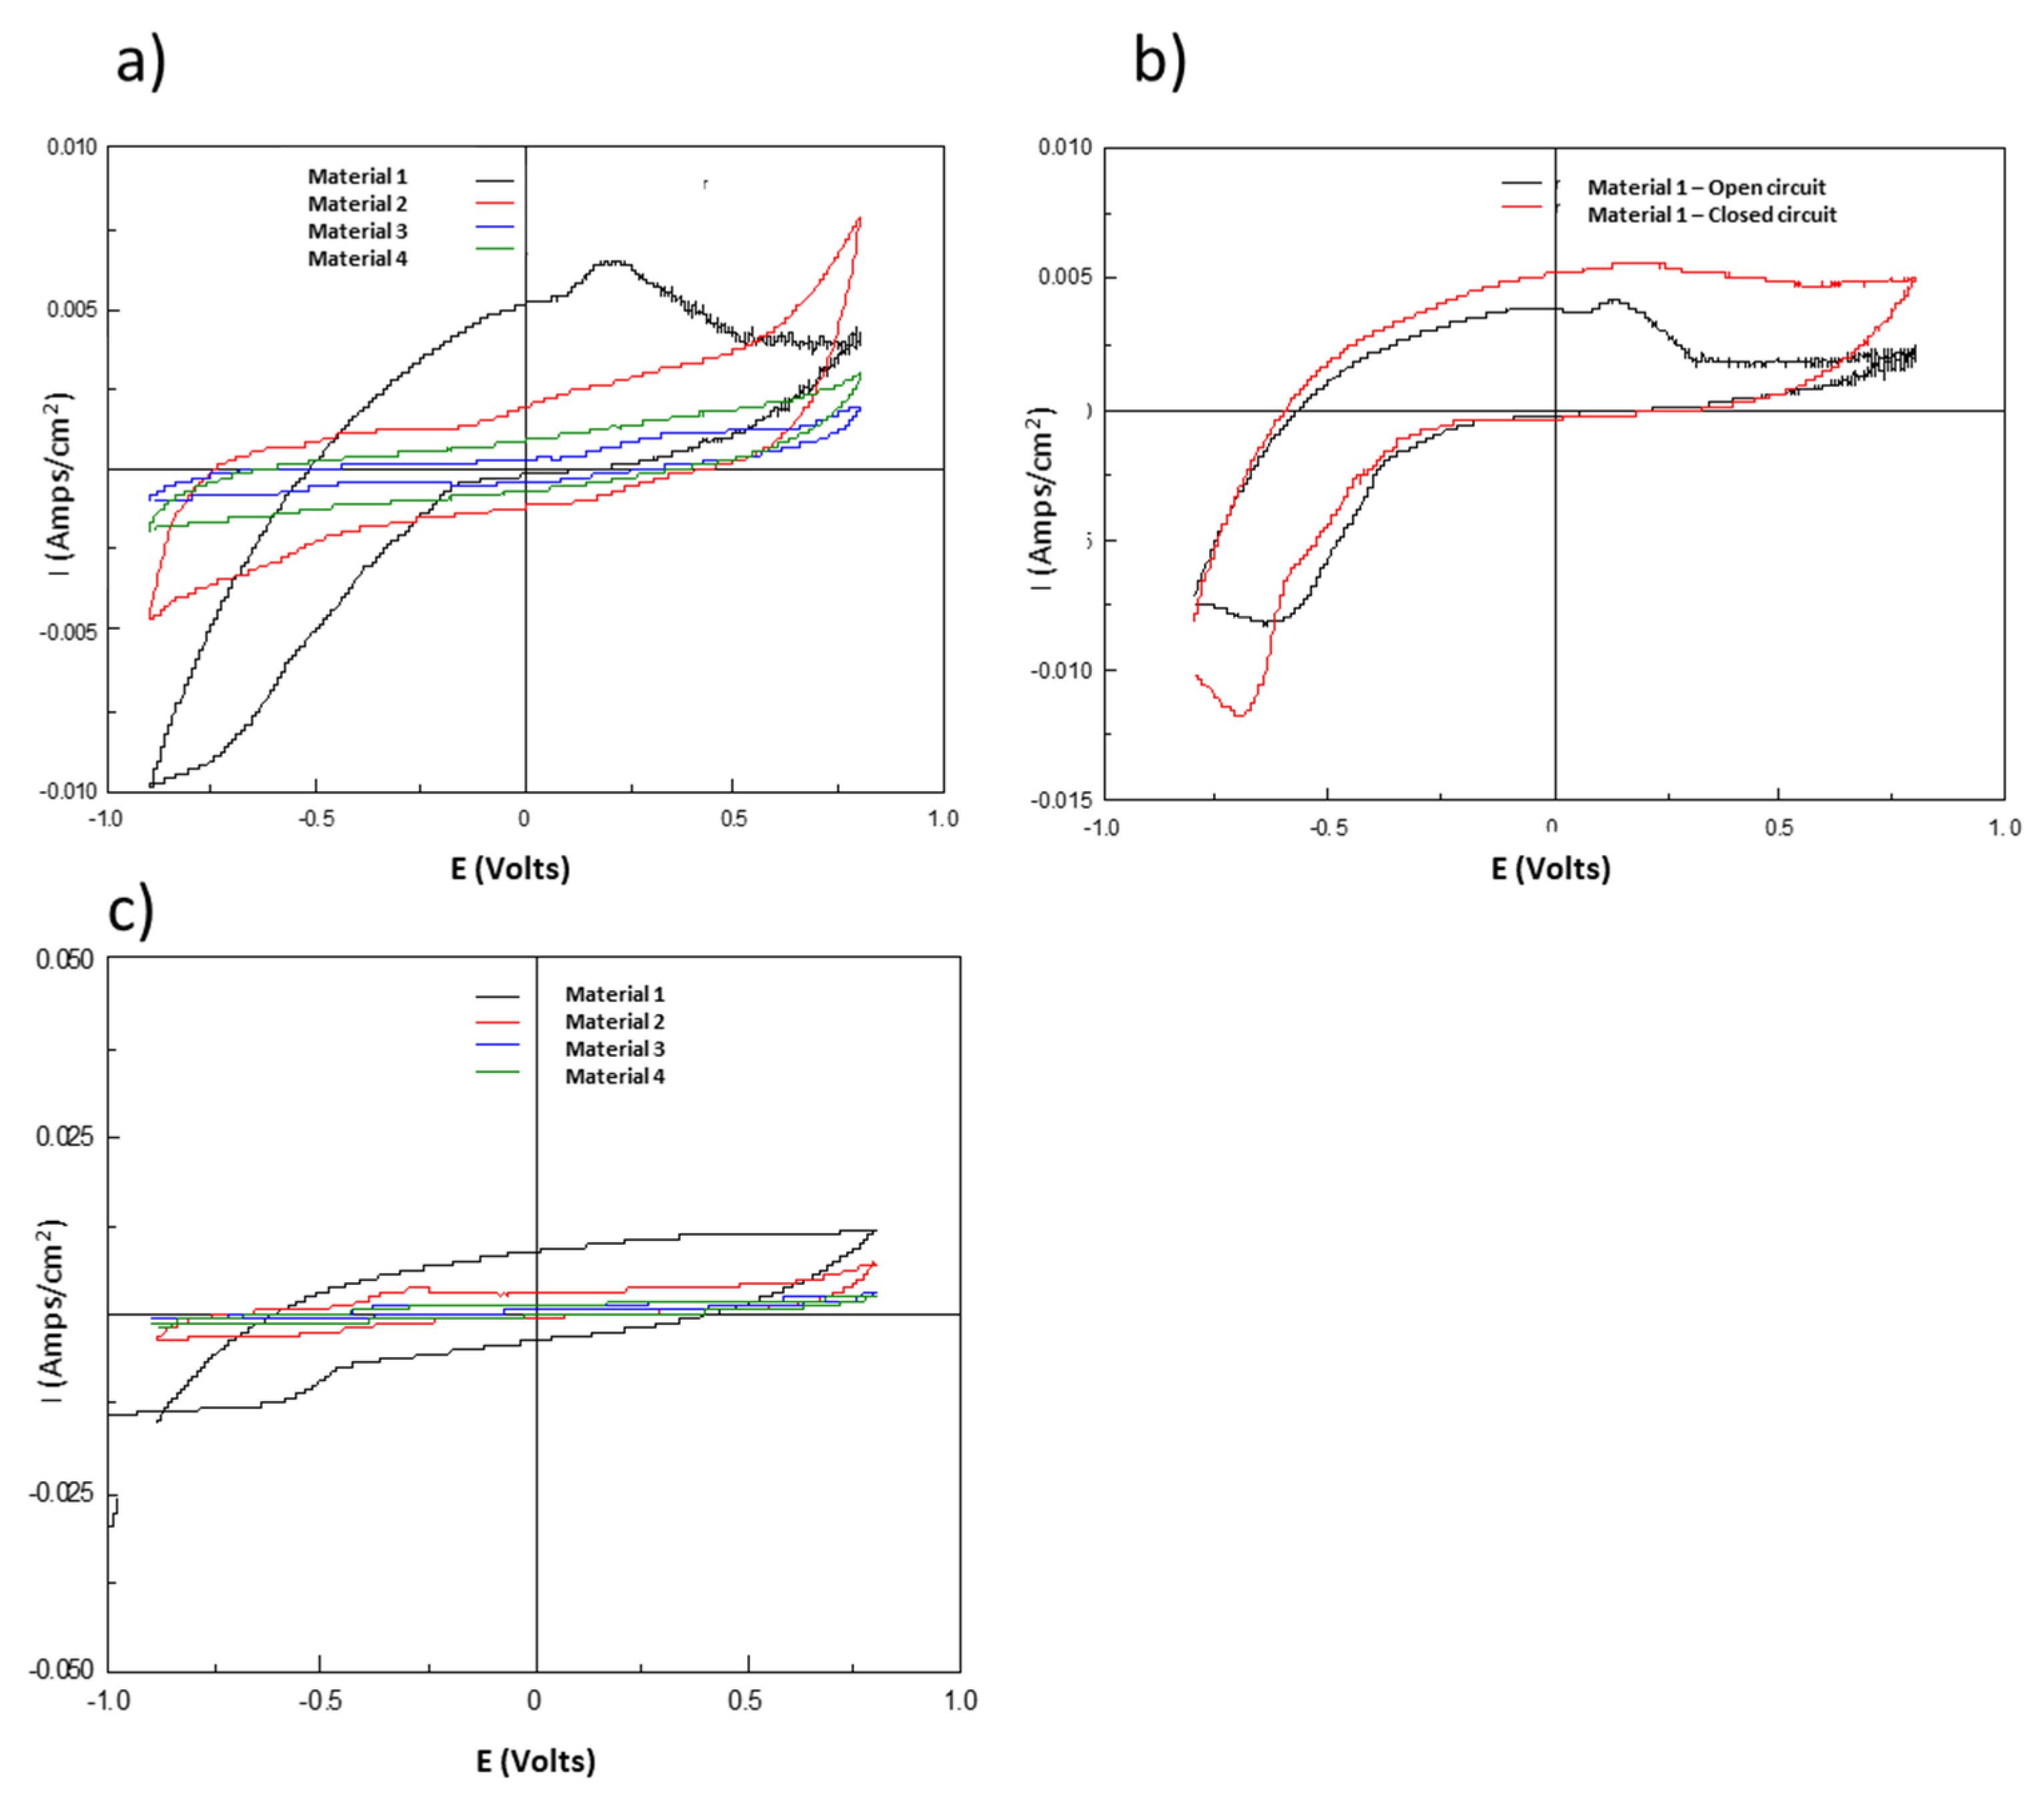
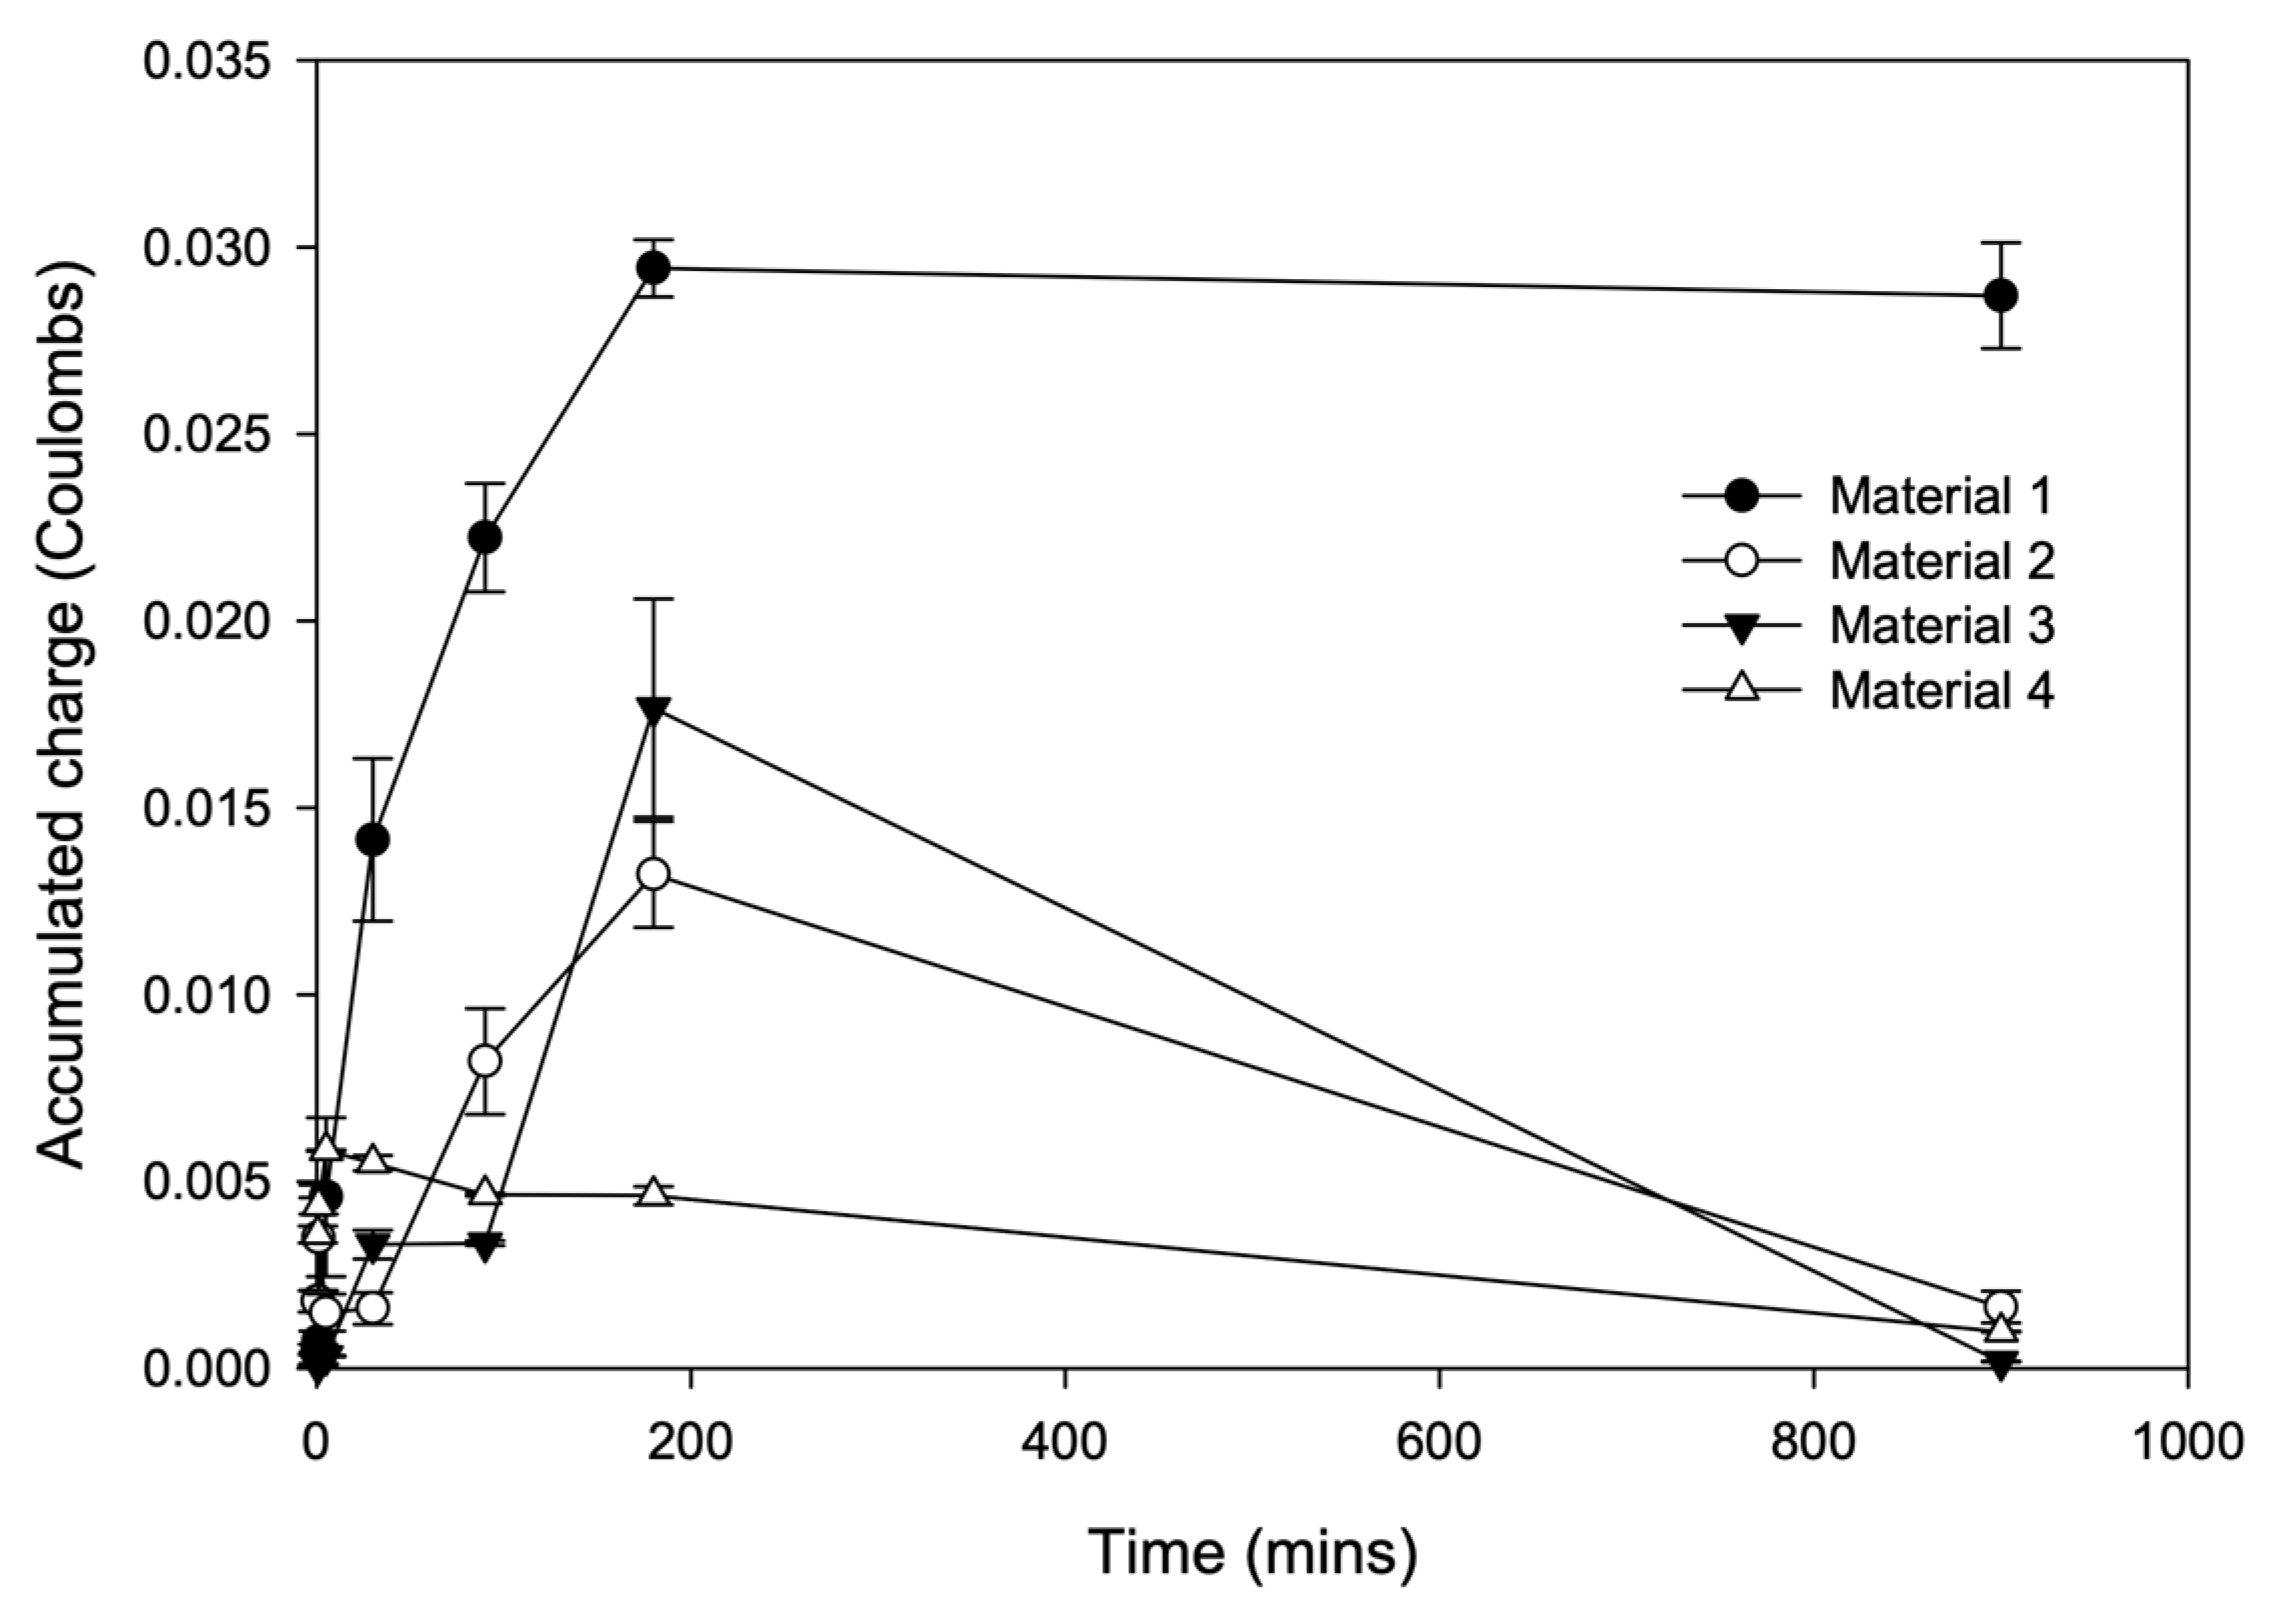
3.2. Biofilm Charge Accumulation and Electrochemical Activity

Anodic biofilms acclimated and operated in closed-circuit conditions facilitate the selective growth of electrogenic bacteria, which are able to mediate electrogenic activity and the transfer of electrons to a solid anode [23]. The selective acclimation of this electrogenic growth means that in materials 1–4 bacterial communities incubated in closed-circuit conditions were closely aligned. However, the level of difference between the open- and closed-circuit-acclimated archaeal populations was low, suggesting a lower degree of selection occurred for the archaeal populations during MFC operation. Thus, it seems that the type of carbon material did not greatly influence the selection or development of electrogenic bacteria. However, the amount of biofilm/biomass produced during open and closed acclimation and operation did have a significant effect (Table 2), with the level of closed-circuit biomass being higher by factors of 11 and 8 in materials 4 (rods) and 2 (paper), respectively. This suggests that closed-circuit conditions provide a key benefit to bacteria present by promoting electrogenic metabolic activity by facilitating electrochemically active bacterial growth. This seemed to support the visual assessment of high levels of biofilm growth on/within the felt and low levels present on the surface of the graphite (Figure 3).
Cyclic voltammetry (CV) has previously been used to examine electron transfer mechanisms and the redox species involved in interactions between anode biofilms and carbon MFC anodes [23,24]. In this study, cyclic voltammograms were run on different anode materials (1 to 4) using both open- and closed-circuit MFCs. An initial examination of material 1 (felt) from the closed-circuit reactor found that high scan rates of 10–50 mV/s produced atypical “2-pointed spike” CV plots (Figure 4), the maximum current density of which decreased with decreasing scan rates. This did not occur with materials 2, 3 and 4, but the plot profile was repeated with the open-circuit material 1 (felt) scan. It was reported by Marsili et al. [25] that at high scan rates slow electrochemical reactions may not have time to occur before the potential shifts to the next step; therefore, at these high scan rates, as the potential was stepped up, the current also accumulated over time.
The material 1 (felt) CV profile at high scan rates thus reflects redox agents that are able to undergo multiple redox turnovers, as has been previously demonstrated in immobilized enzyme systems [26,27], but with the redox kinetics masked due to the accumulation of current. The Randles–Sevcik equation (Equation (1)) describes the effect of scan rate on the peak current (ip) for reversible systems, and this demonstrates that both concentration and diffusional terms will affect ip.
i p = ( 2.687 × 10 5 ) n 3 / 2 v 1 / 2 D 1 / 2 A C
where n = the number of electrons in the redox reaction, v = the scan rate in V s−1, F = Faraday’s constant, 96,485 coulombs mole−1, A = the electrode area in cm2, R = the gas constant, 8.314 J mole−1 K−1, T = the temperature in K, and D = the analyte diffusion coefficient in cm2 s−1.
Fricke et al. [24] have previously reported a non-linear relationship between scan rates and peak current and suggested that this effect could be caused by diffusion control characteristics, which can then be explained by a change in the electrochemical process from quasi-reversible to reversible by decreasing the scan rate. Thus, the atypical build up charge with time is indicative that either a large number of redox agents are present and/or they are remotely sited from the from the carbon anode.
Figure 3 shows the comparative CV scans for closed-circuit MFC materials. Material 1 (felt) exhibits the greatest current densities (maximum peaks between oxidising and reducing sweeps) followed by materials 2, 3 and 4. A comparison between the material 1 open and closed CVs’ also demonstrates that material 1 (open-circuit) is able to generate comparatively high current densities; this data supports the power density results produced in Figure 2.
CVs performed on the open-circuit biofilms (Figure 5) also demonstrate the development of electrogenic capacity in the material 1 (felt) biofilm only, these results also being in accordance with power density measurements (Figure 2).
As a visual examination of the CV oxidative and reductive sweeps did not reveal any clear redox peaks (Figure 5), first-order derivatives ((ΔI/ΔV) were calculated in order to estimate both the potentials at which any inflections occurred and their given amplitude (Table 3).
The reductive sweeps reveal higher ΔI/ΔVmax values, indicating higher levels/rates of electron transfer to the electrode compared with electron transfer from the electrode. This would indicate that electron transfer was from cytochrome enzymes, as these have been shown to be inactive on the reverse CV sweep. No results were obtained for the material 1 (felt) forward sweeps, as the derivative values were observed to decrease from a very high value to a low value over the course of applying the potentials. It is thought that this, again, relates to a capacitive build-up of current/charge associated with the scan rates used in this experiment. The potentials produced in this study can be compared to the midpoint potentials of multiheme cytochromes, which have been determined from Geobacter spp. The open-circuit reactor midpoint potentials are comparable with the measured potentials from OmcB and OmcZ purified from G. sulfurreducens, these being of −0.39 and −0.42 V (vs. Ag/AgCl), respectively [28,29]. The maximum potential in the carbon felt open-circuit material 1 (felt) ranged from −0.6 to −0.15 Ean (V) versus Ag/AgCl), showing that there was no optimal mid-point anode potential but rather a range of active potentials capable of electron transfer. Interestingly, although the other open-circuit materials showed low current generation, their mid-point anode potentials were lower (−0.53 to −0.55 V).
Examination of the charge accumulation from open–closed-circuit cycling confirmed that material 1 (felt) biofilm was able to maintain increasing levels of charge up to a maximum of 0.03 coulombs. In contrast, materials 2 and 3 (paper and tubes) both managed to accumulate 0.02 coulombs, but longer periods of open-circuit operation not only resulted in no further accumulation of charge but also led to complete dissipation of the stored charge. Material 4 (graphite) only retained low levels of charge, 0.06 coulombs (Figure 6).
As carbon felt biofilms were found to produce the highest power densities and provided some protection from low-pH perturbation, it was decided to examine the carbon materials using a CLSM microscope to understand how the porous carbon structure affected bacterial phylogeny, colonization and growth. Biofilm development from carbon felt samples were analysed for the presence and spatial organization of Archaeal and Eubacterial species (Figure 7). Light microscopy showed that significant biofilm developed both on and between the carbon fibres. Although significant levels of Archaea (red colour) were observed, these were found to be generally located remotely from the carbon anode; in contrast, Eubacteria tended to be more closely associated with the anode carbon surfaces. When the same carbon fibres were then analysed using a probe set targeting gamma and delta Proteobacteria this again showed differences in the localized distribution of the bacterial groups, with the gamma Proteobacteria (green) being more associated with diffuse biofilm remotely sited from the anode and delta Proteobacteria tending towards a closer proximity along the length of the carbon fibres. A specific probe for Geobacter spp., was then applied to the carbon materials, which showed that these bacteria were found to reside in close proximity to the anode along the length of the carbon fibres and in lower numbers on the graphite surfaces (Figure 7c,d). A correlation between levels of Geobacter spp. and overall cell voltage was recently established by Paitier et al. [30], and it was further suggested that the presence or absence of other bacterial genera within anodic biofilms is likely to be associated with other operating parameters.
Prominent members of enriched MFCs have often been found to be members of the Geobacteraceae cluster of species [31,32], and these bacteria have demonstrated the ability to respire directly to a solid anode [33]. The delta Proteobacteria observed here may represent a predominance of this genus, as has been previously reported [34,35]. In contrast, family members of the gamma Proteobacteria group, such as Shewanella spp. and Pseudomonaceae, have a greater tendency to respire anaerobically by producing exogenous mediators such as flavins and pyocyanins to facilitate electron transfer to a remote anode surface [13,23].

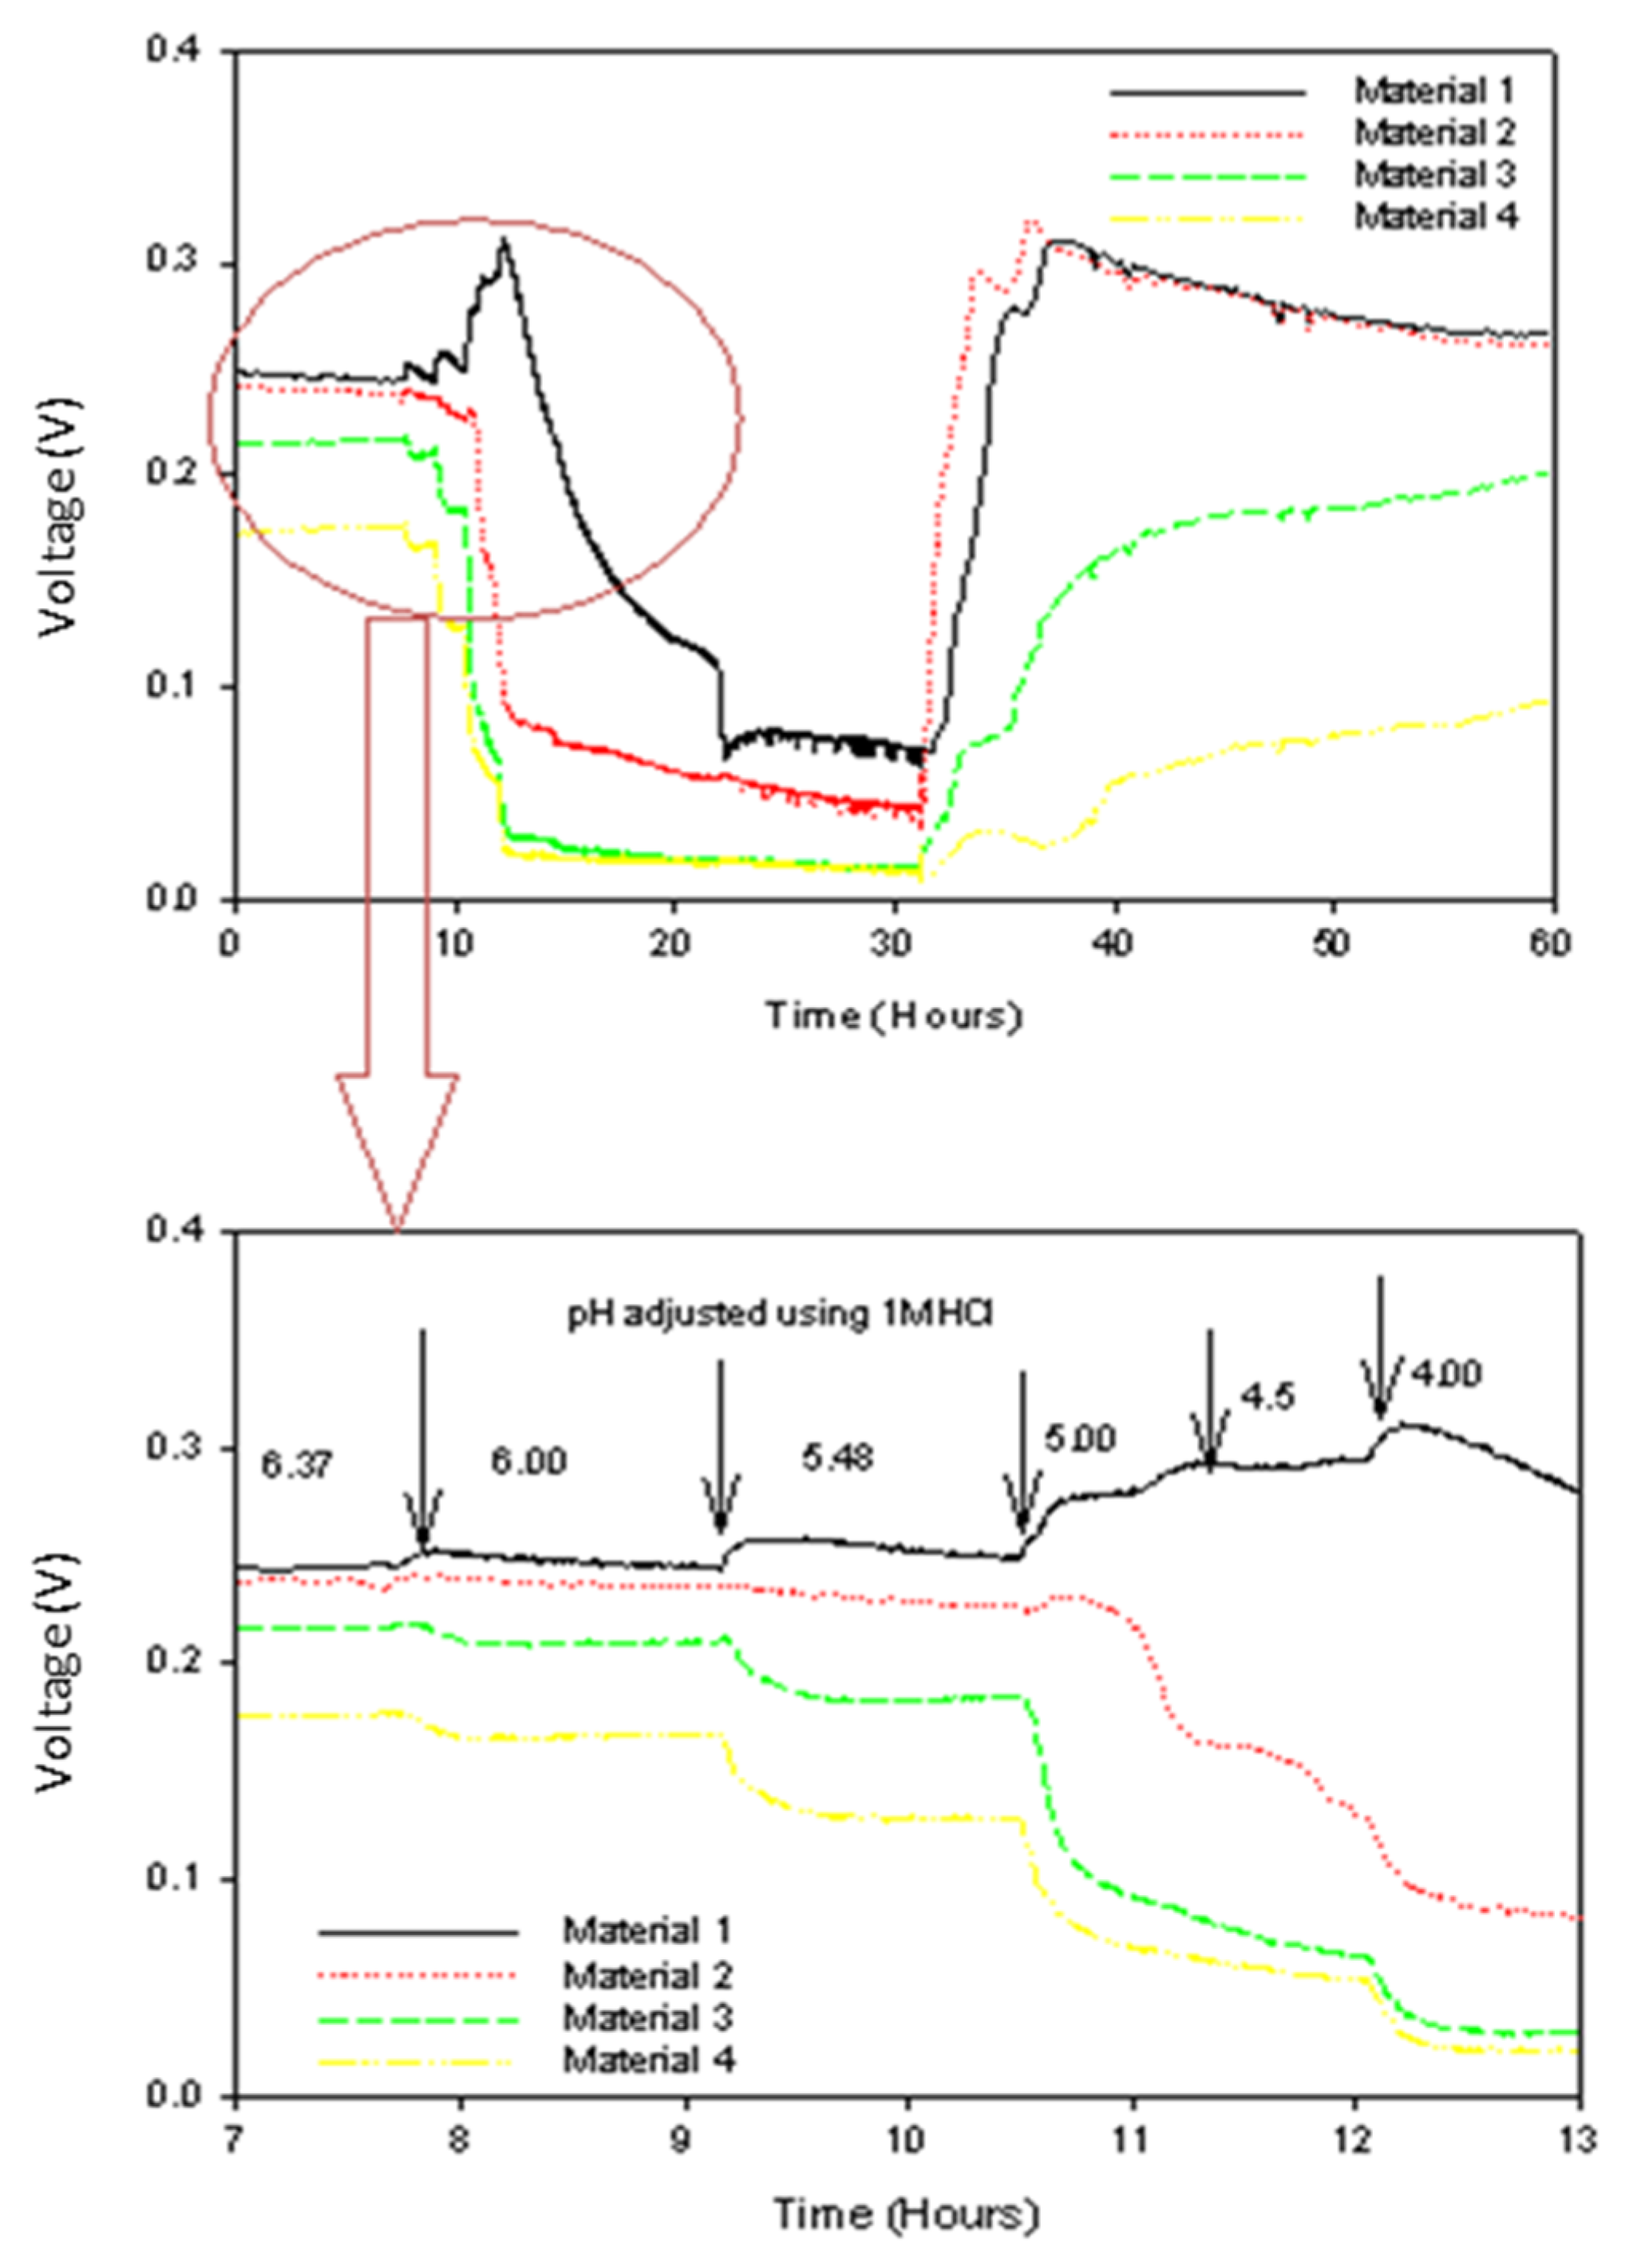
3.3. The Influence of pH Perturbation

The efficacy of the response to low-pH perturbations of the different electrogenic biofilms (formed on the four different materials) was tested (Figure 8). Changing the pH to 6.00 immediately affected the electrogenic activity of materials 3 and 4 (tubes and rods) biofilms. The material 2 (paper) biofilm was adversely affected at pH 5.5, but voltage from the material 1 biofilm (felt) was reduced when pH 4.0 was introduced into the reactor. Materials 2, 3 and 4 (paper, tubes and rods) stabilised to steady-state voltage readings until pH 5.00 was introduced into the reactor, after which voltage dropped rapidly in all 3 material types. This suggests that, down to pH 5.0, the voltage limitation was largely related to thermodynamics, but after this point the physiology of the bacteria in the biofilm was severely affected. The voltage of material 1 (felt) was observed to increase as the other voltages decreased. This is likely because the dual-chamber MFC was cathode limited due to the small surface area of the AEM, although it is also possible that the low bulk pH may have been advantageous for the system by promoting proton transfer and minimizing any potential pH gradients that may have developed between the anode and cathode chambers. Whilst pH 4.0 caused a complete cessation of electrogenic activity in the material 3 and 4 (tubes and rods) biofilms, the material 1 and 2 biofilms (felt and paper) maintained some activity. When the pH was then restored to 7.0, materials 1 and 2 recovered their initial voltage within 4 h, demonstrating that the bacterial cells had not been adversely damaged. In contrast, the material 3 and 4 voltages took >4 days to recover, showing that bacterial cell death had occurred.

4. Discussion

4.1. The Effect of Material Type on Electrogenic Developement

The importance of the carbon anode material derives from its ability to provide a support structure that maximises EAB biocatalytic activity whilst also directly functioning to harvest electrons generated by bacterial metabolism [36]. Table 1 highlights the differences in carbon density and internal structure for each of the different carbon materials, with the relatively high resistance of the carbon felt also indicates poor electrical connectivity between the carbon fibres in this material. It is clear that ohmic losses may be significant in fibrous-based carbon support structures, but the increased electrogenic activity in these biofilms mitigates against these losses. Indeed, most scaled-up BES reactor setups have tended to use fibrous carbon materials in order to get maximum power densities, meaning that levels of biocatalytic activity from the biofilm are likely to be more important than ohmic losses. SEM pictures showed that the three-dimensional structures of the four different materials differed considerably, with the felt having a loose porous network of fibres and the graphite having a solid structure with roughness exhibited only at the micro level. This 3-D form directly influenced the active surface area available for bacterial attachment and, more generally, influenced the structure of the electrogenic biofilm. Hence, carbon paper gave a lower power density compared to the carbon felt, which may be related to how tightly bound the carbon fibres were on a macro scale [37]. It is important to determine the surface area that is accessible for microbial growth, specifically as BET surface area measurements have shown very high surface areas in graphite due to its microporous structure [38], but this material also produced the lowest power density measurements (Figure 2). The power produced from the open-circuit-acclimated biofilm may in part be related to the levels of biomass that developed in the biofilm, as this was 4.5-fold higher than the carbon paper. Whilst high open-circuit biomass was produced in the carbon rods, it is thought that this may relate to large amounts of biomass building up in the internal tubes of the rod structure, which was not electrochemically active. The relatively high surface area provided by carbon veil electrodes with associated mixed electrogenic biofilms produced a significant charge accumulation and capacitive behaviour. Results from pervious impedance measurements estimated that the capacitance effect of the Helmholtz layer due to the carbon material is approximately 17 times higher than that from the contribution of the biofilm [39]. However, this work shows that, whilst the carbon is important in terms of charge and capacitance, the levels of biofilm and the microbial composition can have a significant effect. The biofilm was found to produce a significant faradaic pseudocapacitance effect (Figure 4); this charge derives from bacterial extracellular components, i.e., metabolites, cytochromes and pili, and will be driven by the selection for electrochemically active bacteria. Whilst the total surface area is likely to be an important factor in overall electrogenic development and overall reactor performance, Christwardana et al. [40] showed that the electrochemical nature of the carbon will have also have a large impact on biofilm growth, particularly via the influence of nitrogen groups that can enhance biocompatibility in carbon felt materials. However, the high overall electrogenic performance of the porous felt materials showed that high levels of colonisation were possible; the importance of having numerous open channels to improve anode performance was further demonstrated by Chong et al. [41], who showed that whilst it is possible for porous channels to support biofilm growth over several centimetres, mass transfer limitation will also act to restrict performance.
Previous work with Pseudomonas aeruginosa [42] and Shewanella oneidensis [43] biofilms have shown that the importance of double-layer capacitance is largely dependent on the electrode material, its specific surface area and the influence of other pseudocapacitive effects. The importance of the microbiological composition was further shown by Liu et al., who reported that some biofilms decreased overall capacitance [34], and another study found that the biofilm in question had no effect on overall charge accumulation [35].
It has previously been established that the electrogenic performance of acclimated biofilms is determined by the substrate feed-stock type [44], and that highly performing electrogenic/anodic biofilms are often dominated by Geobacter spp. In all the closed-circuit carbon types, high levels of biofilm and Geobacter spp. were observed, and this was also confirmed by the sequencing data.

4.2. The Development of Biofilm and Anodic Charge Accumulation

Cyclic voltammetry demonstrated that material 1 (felt) produced biofilms (in both open- and closed-circuit acclimated reactors) that had high levels of pseudocapacitive current, and this may account for the open-circuit power performance in material 1 (felt) even though no microbial acclimation had occurred. It is interesting to note the wide range of anode potentials in the open-circuit biofilm in contrast to defined potentials of −0.39 and −0.42 V (vs. Ag/AgCl) highlighted in closed-circuit operation (Table 2). This would suggest that closed-circuit operation selected for Geobacter spp. or bacteria with active cytochromes with similar mid-point potentials, as observed in the CLSM images (Figure 7). Sun et al. reported that community analysis on anodic MFCs fed with acetate and packed with either carbon felt or granular graphite have shown that Geobacter spp. are selected for in both materials but the proportion is higher in the former material [45]; this was also observed in this study, and images from FISH microscopy seemed to support the result. It would seem that colonisation of the carbon material facilitates the growth of Geobacter cluster bacteria that are suited to direct anaerobic respiration by electron transfer via c-type cytochromes externally sited on cell membranes or possibly “nanowire” conductive appendages. Other bacterial groups which may not possess a strong capability for direct electron transfer or be able to mediate remote electron transfer were observed to be more distally located from the carbon electrode surfaces. A study by Xiao et al. further showed that external resistance could impact the development of extracellular polymeric substances (EPS) in the biofilm, and that this EPS likely plays a role in biofilm electrogenic performance and power generation [46]. Indeed, it has been shown that the Shewanella oneidensis EPS layer is electrochemically active, testing with cytochrome electron transfer rate constants were 0.026 s−1 for whole cells compared to and 0.056 s−1 for EPS-depleted cells. The principal of using an external capacitor has recently been developed with an integrated anode system that incorporated capacitive material into the bioanode; this showed that capacitive anodes performed better than the non-capacitive systems [15]. Additionally where MFCs have been amended with pseudo-capacitive anode materials such as polypyrrole (PPy)/9,10-anthraquinone-2-sulfonic acid sodium salt (AQS) composite films and RuO2 nanoparticles, these also acted to increase charge storage and can function as a biocapacitor in order to improve cell performance [47]. However, it is clear that even in non-electrochemically acclimated biofilms there exists a high level of redox-active components that can facilitate a pseudo-capacitive effect, which can then result in bioelectrochemical current production. It is known that micro-organisms can produce a range of redox metabolites, e.g., phenazine, which may have a range of different metabolic/community functions including quorum sensing. The structural components of the biofilm are also likely to be redox active (DNA, proteins and carbohydrates), which would further enhance the electrochemical capacity of the system. Confocal and SEM microscopy showed that cells and EPS were spread across the electrode surfaces of all the material types, and this was particularly apparent in the carbon felt, where large levels of biomass were associated with high levels of capacitance. These results suggest that it is not only the acclimation of the biofilm but also the amount of active biomass that may facilitate power production; indeed, previous work has shown that microbial electrochemical biofilms can both alternate between storing energy and generating power, potentially enhancing the capacity of bioelectrochemical systems [48].

4.3. Biofilm and Resistance to pH Perturbation

Previous studies on the influence of pH perturbation on MFC/anodic performance have shown that pH 7.0 is generally a preferred pH for high power production [18,49], but pH 6.0 has also been found to be optimal in one dual-chamber MFC reactor [50]. However, this study demonstrates that pH effects on electrogenic biofilms may be mediated by the three-dimensional structure of the carbon material and its influence on biofilm development. pH affects the biofilm by changing electrostatic molecular interactions [51] with a drop of pH 7.0 to 6.0 being reported to severely limit the growth and metabolism of Geobacter sulfurreductans [52]. However, high numbers of EAB close to the electrode and large amounts of biofilm between fibres may have acted to reduce pH effects; it is also possible that there may also have been a cell-density-based modulated adaption to the low-pH conditions [53].
The optimal operational pH level in an air cathode MFC system was found to be 6.5 by Jadhev et al. [54], and when MFC anodes were run for a period of time at pHs 4, 5, 6 and 7 in dual-chamber MFCs, Zhang et al. [55] found that operation at pH 5 and 6 only reduced voltage production by 16% and 8% and power density by 32% and 0%, respectively. In common with other biofilms, a stable and robust electrogenic biofilm will act to not only enhance bioelectrochemical performance but also serve to protect and mitigate against adverse environmental factors. The capacity for anodic biofilms to tolerate low-pH conditions was recently reported by Jannelli et al. [56]; in this study, MFC reactors using carbon-fibre brush anodes were operated at pHs of 3.00 (+/−0.5), suggesting that electrogenic biofilms may not only withstand low-pH perturbations but are also able to be acclimated to low-pH operation. FISH CLSM also demonstrated that Geobacter spp. were closely associated with the electrode surfaces’ Archaeal and other Bacterial groups in the inter-fibre spaces bedded in an EPS matrix. This would provide a mechanism to mitigate against pH perturbation effects.

5. Conclusions

The structure of the carbon anode materials determined the power density achieved by modulating the level and type of electrogenic biofilm development. It was found that power production was highest (1.40 W/m3) using carbon felt, but significant power was also produced when felt carbon was open-circuit acclimated in a control reactor (0.95 W/m3). Biofilm development was greatest in felt anodes (closed-circuit acclimated 1209 ng/μL DNA), and this facilitated the highest pseudo-capacitive values due to the presence of redox-active species; this accumulated 0.03 coulombs in charge/discharge experiments and was associated with higher levels of power production. This meant that open-circuit acclimation with anodic carbon felt was also capable of producing electrogenic activity. Confocal microscopy showed that Geobacter spp. were enriched in closed-circuit operation, and these were found in close physical proximity with the carbon anode, with mid-point anode potentials close to values reported for cytochromes of Geobacter sulfurreductans, and this served to enhance anodic performance. The development of enhanced biofilm structures associated with the felt electrodes was also able to protect the EABs from the effects of low-pH perturbations.

Author Contributions

I.S.M. contributed to the investigation and writing/original draft preparation, G.C.P., R.M.D. and A.J.G. to the review and editing. All authors have read and agreed to the published version of the manuscript.

Funding

This work was supported by the EPSRC Multi-Disciplinary Fuels RCUK Energy Programme; the Liquid Fuels and Bioenergy from CO2 Reduction (Lifes-CO2R) Project [EP/N009746/1]; and the FLEXIS research project [grant number: WEFO 80835]. Dinsdale would also like to acknowledge the Royal Academy of Engineering Fellowship Chair in Emerging Technologies—CiET1819/2/86.

Acknowledgments

We thank S Cho at Pusan National University for the supply of the FISH probes and FISH microscopy. The authors would like to express sincere gratitude to the Researcher Links programme of the British Council for the financial support of this publication.

Conflicts of Interest

The authors declare no conflict of interest.

References

  1. Stein, N.E.; Hamelers, H.M.V.; van Straten, G.; Keesman, K.J. On-line detection of toxic components using a microbial fuel cell-based biosensor. J. Process Control 2012, 22, 1755–1761. [Google Scholar] [CrossRef]
  2. Michie, I.S.; Kim, J.R.; Dinsdale, R.M.; Guwy, A.J.; Premier, G.C. The influence of psychrophilic and mesophilic start-up temperature on microbial fuel cell system performance. Energy Environ. Sci. 2011, 4, 1011–1019. [Google Scholar] [CrossRef]
  3. Morozan, A.; Stamatin, I.; Stamatin, L.; Dumitru, A.; Scott, K. Carbon electrodes for microbial fuel cells. J. Optoelectron. Adv. Mater. 2007, 9, 221–224. [Google Scholar]
  4. Cheng, S.; Logan, B.E. Ammonia treatment of carbon cloth anodes to enhance power generation of microbial fuel cells. Electrochem. Commun. 2007, 9, 492–496. [Google Scholar] [CrossRef]
  5. Zhao, Y.; Ma, Y.; Li, T.; Dong, Z.; Wang, Y. Modification of carbon felt anodes using double-oxidant HNO3/H2O2 for application in microbial fuel cells. RSC Adv. 2018, 8, 2059–2064. [Google Scholar] [CrossRef] [Green Version]
  6. Yu, Y.Y.; Zhai, D.D.; Si, R.W.; Sun, J.Z.; Liu, X.; Yong, Y.C. Three-Dimensional Electrodes for High-Performance Bioelectrochemical Systems. Int. J. Mol. Sci. 2017, 18, 90. [Google Scholar] [CrossRef] [Green Version]
  7. Logan, B.; Cheng, S.; Watson, V.; Estadt, G. Graphite Fiber Brush Anodes for Increased Power Production in Air-Cathode Microbial Fuel Cells. Environ. Sci. Technol. 2007, 41, 3341–3346. [Google Scholar] [CrossRef]
  8. Larrosa-Guerrero, A.; Scott, K.; Katuri, K.P.; Godinez, C.; Head, I.M.; Curtis, T. Open circuit versus closed circuit enrichment of anodic biofilms in MFC: Effect on performance and anodic communities. Appl. Microbiol. Biotechnol. 2010, 87, 1699–1713. [Google Scholar] [CrossRef]
  9. Sleutels, T.H.J.A.; Lodder, R.; Hamelers, H.V.M.; Buisman, C.J.N. Improved performance of porous bio-anodes in microbial electrolysis cells by enhancing mass and charge transport. Int. J. Hydrog. Energy 2009, 34, 9655–9661. [Google Scholar] [CrossRef]
  10. Xie, X.; Criddle, C.; Cui, Y. Design and fabrication of bioelectrodes for microbial bioelectrochemical systems. Energy Environ. Sci. 2015, 8, 3418–3441. [Google Scholar] [CrossRef]
  11. Roubaud, E.; Lacroix, R.; Da Silva, S.; Etcheverry, L.; Bergel, A.; Basséguy, R.; Erable, B. Benchmarking of Industrial Synthetic Graphite Grades, Carbon Felt, and Carbon Cloth as Cost-Efficient Bioanode Materials for Domestic Wastewater Fed Microbial Electrolysis Cells. Front. Energy Res. 2019, 7. [Google Scholar] [CrossRef] [Green Version]
  12. Schrott, G.D.; Bonanni, P.S.; Robuschi, L.; Esteve-Nuñez, A.; Busalmen, J.P. Electrochemical insight into the mechanism of electron transport in biofilms of Geobacter sulfurreducens. Electrochim. Acta 2011, 56, 10791–10795. [Google Scholar] [CrossRef]
  13. Marsili, E.; Baron, D.B.; Shikhare, I.D.; Coursolle, D.; Gralnick, J.A.; Bond, D.R. Shewanella secretes flavins that mediate extracellular electron transfer. Proc. Natl. Acad. Sci. USA 2008, 105, 3968–3973. [Google Scholar] [CrossRef] [PubMed] [Green Version]
  14. Malvankar, N.S.; Mester, T.; Tuominen, M.T.; Lovley, D.R. Supercapacitors Based on c-Type Cytochromes Using Conductive Nanostructured Networks of Living Bacteria. ChemPhysChem 2012, 13, 463–468. [Google Scholar] [CrossRef] [Green Version]
  15. Krige, A.; Sjöblom, M.; Ramser, K.; Christakopoulos, P.; Rova, U. On-Line Raman Spectroscopic Study of Cytochromes’ Redox State of Biofilms in Microbial Fuel Cells. Molecules 2019, 24, 646. [Google Scholar] [CrossRef] [Green Version]
  16. Peng, X.; Yu, H.; Yu, H.; Wang, X. Lack of anodic capacitance causes power overshoot in microbial fuel cells. Bioresour. Technol. 2013, 138, 353–358. [Google Scholar] [CrossRef]
  17. Blanchet, E.; Erable, B.; De Solan, M.-L.; Bergel, A. Two-dimensional carbon cloth and three-dimensional carbon felt perform similarly to form bioanode fed with food waste. Electrochem. Commun. 2016, 66, 38–41. [Google Scholar] [CrossRef] [Green Version]
  18. He, Z.; Huang, Y.; Manohar, A.K.; Mansfeld, F. Effect of electrolyte pH on the rate of the anodic and cathodic reactions in an air-cathode microbial fuel cell. Bioelectrochemistry 2008, 74, 78–82. [Google Scholar] [CrossRef]
  19. Ren, Z.; Ward, T.E.; Regan, J.M. Electricity Production from Cellulose in a Microbial Fuel Cell Using a Defined Binary Culture. Environ. Sci. Technol. 2007, 41, 4781–4786. [Google Scholar] [CrossRef]
  20. Torres, C.I.; Kato Marcus, A.; Rittmann, B.E. Proton transport inside the biofilm limits electrical current generation by anode-respiring bacteria. Biotechnol. Bioeng. 2008, 100, 872–881. [Google Scholar] [CrossRef]
  21. Biffinger, J.C.; Pietron, J.; Bretschger, O.; Nadeau, L.J.; Johnson, G.R.; Williams, C.C.; Nealson, K.H.; Ringeisen, B.R. The influence of acidity on microbial fuel cells containing Shewanella oneidensis. Biosens. Bioelectron. 2008, 24, 900–905. [Google Scholar] [CrossRef] [PubMed] [Green Version]
  22. Penteado, E.D.; Fernandez-Marchante, C.M.; Zaiat, M.; Gonzalez, E.R.; Rodrigo, M.A. Influence of carbon electrode material on energy recovery from winery wastewater using a dual-chamber microbial fuel cell. Environ. Technol. 2017, 38, 1333–1341. [Google Scholar] [CrossRef] [PubMed]
  23. Rabaey, K.; Boon, N.; Siciliiano, S.; Verhaege, M.; Verstraete, W. Biofuel cells select for consortia that self-mediate electron transfer. Appl. Environ. Microbiol. 2004, 70, 5373–5382. [Google Scholar] [CrossRef] [PubMed] [Green Version]
  24. Fricke, K.; Harnisch, F.; Schroder, U. On the use of cyclic voltammetry for the study of anodic electron transfer in microbial fuel cells. Energy Environ. Sci. 2008, 1, 144–147. [Google Scholar] [CrossRef]
  25. Marsili, E.; Rollefson, J.B.; Baron, D.B.; Hozalski, R.M.; Bond, D.R. Microbial Biofilm Voltammetry: Direct Electrochemical Characterization of Catalytic Electrode-Attached Biofilms. Appl. Environ. Microbiol. 2008, 74, 7329–7337. [Google Scholar] [CrossRef] [Green Version]
  26. Heering, H.A.; Hirst, J.; Armstrong, F.A. Interpreting the catalytic voltammetry of electroactive enzymes adsorbed on electrodes. J. Phys. Chem. B 1998, 102, 6889–6902. [Google Scholar] [CrossRef]
  27. Armstrong, F.A. Recent developments in dynamic electrochemical studies of adsorbed enzymes and their active sites. Curr. Opin. Chem. Biol. 2005, 9, 110–117. [Google Scholar] [CrossRef]
  28. Magnuson, T.S.; Isoyama, N.; Hodges-Myerson, A.L.; Davidson, G.; Maroney, M.J.; Geesey, G.G.; Lovley, D.R. Isolation, characterization and gene sequence analysis of a membrane-associated 89 kDa Fe(III) reducing cytochrome c from Geobacter sulfurreducens. Biochem. J. 2001, 359, 147–152. [Google Scholar] [CrossRef]
  29. Inoue, K.; Qian, X.; Morgado, L.; Kim, B.-C.; Mester, T.n.; Izallalen, M.; Salgueiro, C.A.; Lovley, D.R. Purification and Characterization of OmcZ, an Outer-Surface, Octaheme c-Type Cytochrome Essential for Optimal Current Production by Geobacter sulfurreducens. Appl. Environ. Microbiol. 2010, 76, 3999–4007. [Google Scholar] [CrossRef] [Green Version]
  30. Paitier, A.; Godain, A.; Lyon, D.; Haddour, N.; Vogel, T.M.; Monier, J.-M. Microbial fuel cell anodic microbial population dynamics during MFC start-up. Biosens. Bioelectron. 2017, 92, 357–363. [Google Scholar] [CrossRef]
  31. Chae, K.-J.; Choi, M.-J.; Lee, J.-W.; Kim, K.-Y.; Kim, I.S. Effect of different substrates on the performance, bacterial diversity, and bacterial viability in microbial fuel cells. Bioresour. Technol. 2009, 100, 3518–3525. [Google Scholar] [CrossRef] [PubMed]
  32. Torres, C.I.; Krajmalnik-Brown, R.; Parameswaran, P.; Marcus, A.K.; Wanger, G.; Gorby, Y.A.; Rittmann, B.E. Selecting Anode-Respiring Bacteria Based on Anode Potential: Phylogenetic, Electrochemical, and Microscopic Characterization. Environ. Sci. Technol. 2009, 43, 9519–9524. [Google Scholar] [CrossRef] [PubMed]
  33. Mehta, T.; Coppi, M.V.; Childers, S.E.; Lovley, D.R. Outer Membrane c-Type Cytochromes Required for Fe(III) and Mn(IV) Oxide Reduction in Geobacter sulfurreducens. Appl. Environ. Microbiol. 2005, 71, 8634–8641. [Google Scholar] [CrossRef] [Green Version]
  34. Lee, J.; Phung, N.T.; SeopChang, I.; Kim, B.H.; Sung, H.C. Use of acetate for enrichment of electrochemically active microorganisms and their 16S rDNA analyses. FEMS Microbiol. Lett. 2003, 223, 185–191. [Google Scholar] [CrossRef] [Green Version]
  35. Kiely, P.; Call, D.; Yates, M.; Regan, J.; Logan, B. Anodic biofilms in microbial fuel cells harbor low numbers of higher-power-producing bacteria than abundant genera. Appl. Microbiol. Biotechnol. 2010, 88, 371–380. [Google Scholar] [CrossRef] [PubMed]
  36. Rabaey, K.; Clauwaert, P.; Aelterman, P.; Verstraete, W. Tubular Microbial Fuel Cells for Efficient Electricity Generation. Environ. Sci. Technol. 2005, 39, 8077–8082. [Google Scholar] [CrossRef]
  37. Xie, X.; Hu, L.; Pasta, M.; Wells, G.F.; Kong, D.; Criddle, C.S.; Cui, Y. Three-Dimensional Carbon Nanotube–Textile Anode for High-Performance Microbial Fuel Cells. Nano Lett. 2011, 11, 291–296. [Google Scholar] [CrossRef]
  38. Liu, Y.; Harnisch, F.; Fricke, K.; Schröder, U.; Climent, V.; Feliu, J.M. The study of electrochemically active microbial biofilms on different carbon-based anode materials in microbial fuel cells. Biosens. Bioelectron. 2010, 25, 2167–2171. [Google Scholar] [CrossRef]
  39. Fradler, K.R.; Kim, J.R.; Boghani, H.C.; Dinsdale, R.M.; Guwy, A.J.; Premier, G.C. The effect of internal capacitance on power quality and energy efficiency in a tubular microbial fuel cell. Process Biochem. 2014, 49, 973–980. [Google Scholar] [CrossRef]
  40. Christwardana, M.; Frattini, D.; Accardo, G.; Yoon, S.P.; Kwon, Y. Early-stage performance evaluation of flowing microbial fuel cells using chemically treated carbon felt and yeast biocatalyst. Appl. Energy 2018, 222, 369–382. [Google Scholar] [CrossRef]
  41. Chong, P.; Erable, B.; Bergel, A. Microbial anodes: What actually occurs inside pores? Int. J. Hydrog. Energy 2019, 44, 4484–4495. [Google Scholar] [CrossRef] [Green Version]
  42. Kim, T.; Kang, J.; Lee, J.-H.; Yoon, J. Influence of attached bacteria and biofilm on double-layer capacitance during biofilm monitoring by electrochemical impedance spectroscopy. Water Res. 2011, 45, 4615–4622. [Google Scholar] [CrossRef] [PubMed]
  43. Manohar, A.K.; Bretschger, O.; Nealson, K.H.; Mansfeld, F. The use of electrochemical impedance spectroscopy (EIS) in the evaluation of the electrochemical properties of a microbial fuel cell. Bioelectrochemistry 2008, 72, 149–154. [Google Scholar] [CrossRef] [PubMed]
  44. Michie, I.S.; Kim, J.R.; Dinsdale, R.M.; Guwy, A.J.; Premier, G.C. Factors affecting microbial fuel cell acclimation and operation in temperate climates. Water Sci. Technol. 2013, 67, 2568–2575. [Google Scholar] [CrossRef] [PubMed]
  45. Sun, Y.; Wei, J.; Liang, P.; Huang, X. Electricity generation and microbial community changes in microbial fuel cells packed with different anodic materials. Bioresour. Technol. 2011, 102, 10886–10891. [Google Scholar] [CrossRef]
  46. Xiao, Y.; Zhao, F. Electrochemical roles of extracellular polymeric substances in biofilms. Curr. Opin. Electrochem. 2017, 4, 206–211. [Google Scholar] [CrossRef]
  47. Lv, Z.; Xie, D.; Li, F.; Hu, Y.; Wei, C.; Feng, C. Microbial fuel cell as a biocapacitor by using pseudo-capacitive anode materials. J. Power Sources 2014, 246, 642–649. [Google Scholar] [CrossRef]
  48. Yates, M.D.; Ma, L.; Sack, J.; Golden, J.P.; Strycharz-Glaven, S.M.; Yates, S.R.; Tender, L.M. Microbial Electrochemical Energy Storage and Recovery in a Combined Electrotrophic and Electrogenic Biofilm. Environ. Sci. Technol. Lett. 2017, 4, 374–379. [Google Scholar] [CrossRef] [Green Version]
  49. Yuan, Y.; Zhou, S.; Xu, N.; Zhuang, L. Electrochemical characterization of anodic biofilms enriched with glucose and acetate in single-chamber microbial fuel cells. Colloids Surf. B Biointerfaces 2011, 82, 641–646. [Google Scholar] [CrossRef]
  50. Raghavulu, S.V.; Mohan, S.V.; Goud, R.K.; Sarma, P.N. Effect of anodic pH microenvironment on microbial fuel cell (MFC) performance in concurrence with aerated and ferricyanide catholytes. Electrochem. Commun. 2009, 11, 371–375. [Google Scholar] [CrossRef]
  51. Stoodley, P.; deBeer, D.; Lappin-Scott, H.M. Influence of electric fields and pH on biofilm structure as related to the bioelectric effect. Antimicrob. Agents Chemother. 1997, 41, 1876–1879. [Google Scholar] [CrossRef] [PubMed] [Green Version]
  52. Franks, A.E.; Nevin, K.P.; Jia, H.; Izallalen, M.; Woodard, T.L.; Lovley, D.R. Novel strategy for three-dimensional real-time imaging of microbial fuel cell communities: Monitoring the inhibitory effects of proton accumulation within the anode biofilm. Energy Environ. Sci. 2009, 2, 113–119. [Google Scholar] [CrossRef] [Green Version]
  53. Li, Y.-H.; Hanna, M.N.; Svensäter, G.; Ellen, R.P.; Cvitkovitch, D.G. Cell Density Modulates Acid Adaptation in Streptococcus mutans: Implications for Survival in Biofilms. J. Bacteriol. 2001, 183, 6875–6884. [Google Scholar] [CrossRef] [Green Version]
  54. Jadhav, G.S.; Ghangrekar, M.M. Performance of microbial fuel cell subjected to variation in pH, temperature, external load and substrate concentration. Bioresour. Technol. 2009, 100, 717–723. [Google Scholar] [CrossRef]
  55. Zhang, L.; Li, C.; Ding, L.; Xu, K.; Ren, H. Influences of initial pH on performance and anodic microbes of fed-batch microbial fuel cells. J. Chem. Technol. Biotechnol. 2011, 86, 1226–1232. [Google Scholar] [CrossRef]
  56. Jannelli, N.; Anna Nastro, R.; Cigolotti, V.; Minutillo, M.; Falcucci, G. Low pH, high salinity: Too much for microbial fuel cells? Appl. Energy 2017, 192, 543–550. [Google Scholar] [CrossRef] [Green Version]
Figure 1. MFC potential development of four different carbon material types (1—felt, 2—E-Tech, 3—graphite rods, 4—graphite) fed with 5mMol sucrose. Closed-circuit MFC with a fixed resistance of 1000 Ω.
Energies 13 03521 g001
Figure 2. Cell potential and power density curves produced by Materials 1, 2, 3 and 4 operated in MFCs acclimated under closed-circuit (a,b) and open-circuit (c,d) conditions. Testing was carried out after 8 weeks of operation using a fixed resistance of 1000 Ω.
Energies 13 03521 g002
Figure 3. SEM pictures showing biofilm build-up and microbial growth on different test carbon materials: (a) 450 X and (b) 4000 X magnification (carbon felt).
Energies 13 03521 g003
Figure 4. Cyclic voltammogram sweeps of material 1 (felt) (closed-circuit) using 1, 10, 25 and 50 mV/s scan rates. E (V) versus Ag/AgCl.
Energies 13 03521 g004
Figure 5. Cyclic voltammogram sweeps of materials 1, 2, 3 and 4: (a) closed-circuit and (b) cyclic voltammogram sweeps of material 1 (felt) open and closed circuits using a 0.5 mV/s scan rate. E (V) versus Ag/AgCl and (c) open circuit using 1 mV/s scan rates for material 1 and 25 mV/s scan rates for materials 2, 3 and 4. E (V) versus Ag/AgCl.
Energies 13 03521 g005
Figure 6. Charge accumulation with materials 1, 2, 3 and 4 (8 weeks’ operation) after different open-circuit time periods.
Energies 13 03521 g006
Figure 7. CLSM images of (a) gamma Proteobacteria spp. (purple) and delta Proteobacteria spp. (green) bacteria. (b) Archaeal (red) and Eubacterial (green) bacteria within the biofilm (c) Geobacter spp. cluster (felt) (d) Geobacter spp. cluster (graphite).
Energies 13 03521 g007
Figure 8. The effect of pH shifts on biofilms formed on materials 1, 2, 3 and 4.
Energies 13 03521 g008
Table 1. Physical and electrical properties of the four different experimental anode carbon materials.
Carbon Material TypeExperimental Reactor—Mass (g)Material Resistance
(Ω/4 cm2)
Specific Resistivity
(Ω/m2)
Suface BET (Brunauer–Emmett–Teller)
SBET (m2/g)
Material 1—Felt0.1553.90.20.97
Material 2—E-Tek carbon paper0.110.70.080.87
Material 3—Engineered carbon tubes1.30.2 12.2
Material 4—Graphite rod2.291.21.00 × 10−514
Table 2. Biofilm biomass (DNA ng/µL) in open- and closed-circuit materials 1, 2, 3 and 4.
MaterialDNA (ng/μL)
Open CircuitClosed Circuit
15821209
21421107
3597767
470819
Planktonic158120
Table 3. First derivative potentials and amplitudes for closed- and open-circuit oxidative and reductive sweeps. E (V) versus Ag/AgCl.
Open CircuitClosed Circuit
Reductive Sweep (towards a Positive Ean)Oxidative Sweep (towards a Negative Ean)Reductive Sweep (towards a Positive Ean)Oxidative Sweep (towards a Negative Ean)
MaterialVoltage Ean (V)ΔI/ΔVmax (ΔI/ΔVAn)Voltage
Ean (V)
ΔI/ΔVmax (ΔI/ΔVAn)Voltage Ean (V)ΔI/ΔVmax (ΔI/ΔVAn)Voltage
Ean (V)
ΔI/ΔVmax (ΔI/ΔVAn)
1n/an/a−0.6 to −0.15−0.01n/an/a−0.49−0.03
2−0.50.004−0.55−0.005−0.390.021−0.44−0.011
3n/dn/d−0.53−0.0025−0.390.016−0.4−0.006
4−0.510.002−0.55−0.0025−0.380.006−0.39−0.003

