Article

Machine Learning: A Useful Tool in Geomechanical Studies, a Case Study from an Offshore Gas Field

by
Seyedalireza Khatibi
1,* and
Azadeh Aghajanpour
2
1
Jackson School of Geosciences, University of Texas at Austin, Austin, TX 78712, USA
2
Department of Geoscience and Petroleum, Norwegian University of Science and Technology, 7031 Trondheim, Norway
*
Author to whom correspondence should be addressed.
Energies 2020, 13(14), 3528; https://doi.org/10.3390/en13143528
Submission received: 2 May 2020 / Revised: 1 July 2020 / Accepted: 3 July 2020 / Published: 8 July 2020
(This article belongs to the Special Issue Advances in Shale Oil and Shale Gas Technologies)

Abstract

:
For a safe drilling operation with the of minimum borehole instability challenges, building a mechanical earth model (MEM) has proven to be extremely valuable. However, the natural complexity of reservoirs along with the lack of reliable information leads to a poor prediction of geomechanical parameters. Shear wave velocity has many applications, such as in petrophysical and geophysical as well as geomechanical studies. However, occasionally, wells lack shear wave velocity (especially in old wells), and estimating this parameter using other well logs is the optimum solution. Generally, available empirical relationships are being used, while they can only describe similar formations and their validation needs calibration. In this study, machine learning approaches for shear sonic log prediction were used. The results were then compared with each other and the empirical Greenberg–Castagna method. Results showed that the artificial neural network has the highest accuracy of the predictions over the single and multiple linear regression models. This improvement is more highlighted in hydrocarbon-bearing intervals, which is considered as a limitation of the empirical or any linear method. In the next step, rock elastic properties and in-situ stresses were calculated. Afterwards, in-situ stresses were predicted and coupled with a failure criterion to yield safe mud weight windows for wells in the field. Predicted drilling events matched quite well with the observed drilling reports.

1. Introduction

Geomechanics has shown its potential to cover a broad range of work during the lifespan of a field from exploration to production and then abandonment [1,2]. By examining the available data and comprehending the key issues observed while drilling previous wells, we can predict the optimum way of drilling and finding proper casing shoe locations in the development phase. By coupling fluid-flow with the stress–strain regime in the field, compaction and subsidence analyses can be performed [3,4]. The basic approach to geomechanics analysis is to process available data for predicting rock elastic properties, in-situ stresses, and pore pressures. Shear velocity (Vs) is a kind of data that is not always available for wells, especially old wells, and needs to be predicted.
The main methods for shear wave velocity prediction categorized in the following ones: heuristic models [5], effective medium models [6], and empirical methods, most importantly the Greenberg–Castagna model [7]. Empirical methods are easy and fast to apply [8] compared to other methods [9,10]. However, in most cases, results from the empirical relationships are not accurate enough due to the [10]:
  • simplicity in which other parameters affecting the shear wave velocity are not included,
  • the fact that such relationships derived from a particular formation, and
  • the fact there are few studies on the carbonate rocks (i.e., most of the empirical relationships are derived from sandstone reservoirs).
During the last decade, improved computing hardware and software has led to the prosperous application of machine learning (ML) in different areas of oil industry such as seismic data, petrophysical analysis including synthetic log generation or prediction [11,12,13,14,15,16,17,18,19,20,21,22,23,24,25], which has shown to be a promising tool to help address their problems in a rigorous, repeatable way. Such methods, by considering various available parameters, can give a better prediction of the missing data than simple linear methods [10,26,27]. ML techniques can be categorized into two main types, known as supervised and unsupervised learning. Supervised learning applies to cases in which we have a set of inputs and known responses, while in unsupervised learning, the response is not available, and the method tries to identify natural patterns or cluster in the data [28].
Linear regression as a common ML algorithm intends to find a linear relationship between inputs and a response based on minimizing the sum of squared difference of distance between actual data points and the predicted ones [29,30]. Depending on the number of inputs, this technique can be called simple (having only one input) or multiple (having more than one input) linear regression, and results in slope(s) and intercept. The artificial neural network (ANN) as a nonlinear statistical data modeling tool tries to simulate the behavior of a system composed of neurons and can model complex relationships between inputs and outputs or find patterns between them [10]. Neural networks may have the input layers, hidden layers, and output layers representing the raw information, processing units by finding some weight functions, and results, respectively [31]. Different researchers have used such methods successfully in different disciplines of the oil industry, e.g., [10,32,33,34].
In this study, we used data from three wells located in an offshore field in the Persian Gulf to demonstrate the potential of high accuracy shear velocity prediction in hydrocarbon-bearing and non-bearing intervals. The field is located in the Persian Gulf and the structural trap (carbonate reservoir) is formed by basal forces and salt diapirism [35]. Then, we calculated the rocks elastic properties followed by in-situ stresses to make a 1D mechanical earth model (MEM) for each well. It was shown that the ANN method can predict shear wave velocity employing other available logs with high accuracy.
Numerical representation of the stress states and rock mechanical properties are known as the mechanical earth model (MEM). As mentioned before, shear wave velocity is one of the main components in geomechanical studies. In a gas field of the southern part of Iran, due to harsh drilling conditions, a geomechanical study should be performed to find the safe mud weight of future wells. There are three available wells and two of them (Well-2 and Well-3) have dipole sonic logs (including shear and compressional velocities), while the old well (Well-1) excludes shear wave velocity. Due to the necessity of including all wells in the study, machine learning methods along with conventional methods for shear wave velocity prediction were used and a comparison was drawn. It should be noted that Well-3 as the longest well was considered for fitting the models and Well-2 as the validation.
In order to investigate a relationship between a dependent variable and an independent variable (or a set of them), regression analyses are usually employed [36]. One of the most common correlations for shear wave velocity prediction is Castagna equations. Castagna et al. [37] proposed empirical equations for shear wave velocity prediction in sandstone, limestone, shale, and dolomite rocks as below [38]:
Sandstone   V s = 0.856 + 0.804 V p
Limestone   V s = 1.031 + 1.017 V p 0.055 V p 2
Dolomite   V s = 0.078 + 0.583 V p
Shale   V s = 0.867 + 0.770 V p
where Vp and Vs are compressional and shear velocity in km/s.
Following the Castagna equation, a simple linear regression (SLR) model between available Vp and Vs data was also fitted. Equation (5) shows the linear regression model from the Well-3, which gives a better insight into the way shear velocity changes with compressional velocity in our filed, compared with the empirical models by Castagna. As seen in Figure 1, empirical equations do not present a good response as they are derived from a particular area or reservoir rocks comparing with the linear model from the data. Table 1 also corroborates this fact by comparing the standard error of the estimate from different models.
In the next step, along with compressional wave as the main predictor, other logged properties such as gamma ray and bulk density were also considered (Equation (6)). This method known as multiple linear regression (MLR), will help to consider different rock properties for predicting the shear velocity.
D T S = 14.067 + 2.09173   D T C
D T S = 21.51 + 2.00851   D T C 0.09748   G R 10.406   R H O B
where DTS, DTC, GR, and RHOZ are shear and compressional sonic (us/ft), Gamma ray (API), and density (gr/cc) logs, respectively. Note that, in Figure 1, Equation (5) is transformed into the velocity form (green line) rather than slowness to be compared with Castagna equations.
Finally, the artificial neural network (ANN) was used, which has the ability to learn and model non-linear and complex relationships [10] and is known to produce good fitting functions. ANNs constitute a set of artificial neurons designed in a manner that exchange signals on the communicational links [39]. The nodes of the input layer do not change the data but send them to the hidden layer. In the hidden layers, some sort of transformations is applied to the input data through some weight functions and then are linked to the output layer that corresponds to the results we are looking for.
In this study, initially, to remove the effect of bad data (e.g., null values, bad log measurements) available data were processed. Afterward, data from wells 2 and 3 were selected as the training (25596 samples), test (5484 samples), and validation set (5484 samples). Then, a three-layer feed forward neural network (Figure 2) with sigmoid hidden neurons and linear output neurons was used to build the model. The network was trained with the Levenberg–Marquardt backpropagation algorithm.
After gathering all required data, by assuming elastic isotropy and using the following equations, elastic moduli such as dynamic Young’s modulus and Poisson’s ratio were calculated [40],
ν = 1 2 ( D T S D T C ) 2 1 ( D T S D T C ) 2 1 ,
E D = R H O B ( 1 D T S ) 2 3 ( D T S D T C ) 2 4 ( D T S D T C ) 2 1 ,
where ν and ED represent Poisson’s ratio and dynamic Young’s modulus. However, Equation (8) will provide a dynamic elastic modulus which needs to be converted to static modulus using available correlations such as the equation presented by Eissa and Kazi [41]. The reason for this conversion is due to the difference in the measurement condition [42,43]. Uniaxial compressive strength (UCS) and friction angle (φ) were also estimated based on Plumb’s correlation [44]. Calculated rock properties for Well-1 are presented in Figure 3.
The next step in analyzing wellbore stability is predicting pore pressure. In this study, MDT (modular formation dynamics tester) data in the reservoir section, and Eaton method in the clay-rich intervals were used to predict pore pressure and interpolated for other sections as well [45]. In order to find the clay-rich intervals, the cross plot of the Gamma ray versus density log, as in Figure 4, was used. The pore pressure profile was then calibrated by used mud weight and observed kicks while drilling. The Eaton equation is presented below [46],
P p g = O B G ( O B G P p n ) ( D T C n D T C ) 3 ,
where Ppg is pore pressure gradient, OBG is overburden gradient, Ppn is normal pore pressure gradient, and DTCn is the transient time of compressional wave in the normally pressured zone.
Vertical stress (σv) was then calculated based on the weight of overburden [47],
σ v = g 0 z = T V D R H O B   d z ,
where g is the gravitational acceleration, RHOB is bulk density log, and z refers to depth. Principal horizontal stresses should be predicted using indirect methods such as poroelastic horizontal strain method [48], by considering the tectonic strains:
σ h = υ 1 υ σ v + 1 2 υ 1 υ α P p + E 1 υ 2 ε x + υ E 1 υ 2 ε y ,
σ H = υ 1 υ σ v + 1 2 υ 1 υ α P p + E 1 υ 2 ε y + υ E 1 υ 2 ε x ,
where σh, σH, ν, E, σv, and Pp are minimum horizontal stress, maximum horizontal stress, Poisson’s ratio, Young’s modulus, vertical stress and pore pressure, respectively. α as Biot’s coefficient was set as 1.0, and εx and εy are two horizontal tectonic strains [35,49]. Trial and error on a range of values of εx and εy should be performed in a way that makes a balance between the value of σh from Leak off test/Extended Leak off test [50] and observed drilling events [51]. Generally, εx and εy are tuned in a way to predict losses and breakouts, respectively, i.e., tectonic strains are calibration factors [48]. Figure 3 shows the in-situ stress for Well-1. As can be seen, a normal tectonic system (σv > σH > σh) is the dominant stress regime, which has been detected in all three wells and also corroborated with seismic data.
Safe mud weight window (SMWW) comprises of four mud weight limits by which different conditions are defined: pore (formation) pressure, breakout, minimum horizontal stress and breakdown. Drilling with lower mud pressure compared to formation pore pressure, wellbore washout and/or kick might be expected. On the other hand, drilling with higher mud pressure compared with the breakout limit of the formation, rock shearing and wellbore enlargement may occur. To calculate breakout (PwBO) and breakdown (PwBD) boundaries, the following equations were used [52]:
p w B O = 3 σ H σ h U C S 1 + t a n 2 ( π 4 + φ 2 )
p w B D = U C S + t a n 2 ( π 4 + φ 2 ) ( 3 σ h σ H ) 1 + t a n 2 ( π 4 + φ 2 )

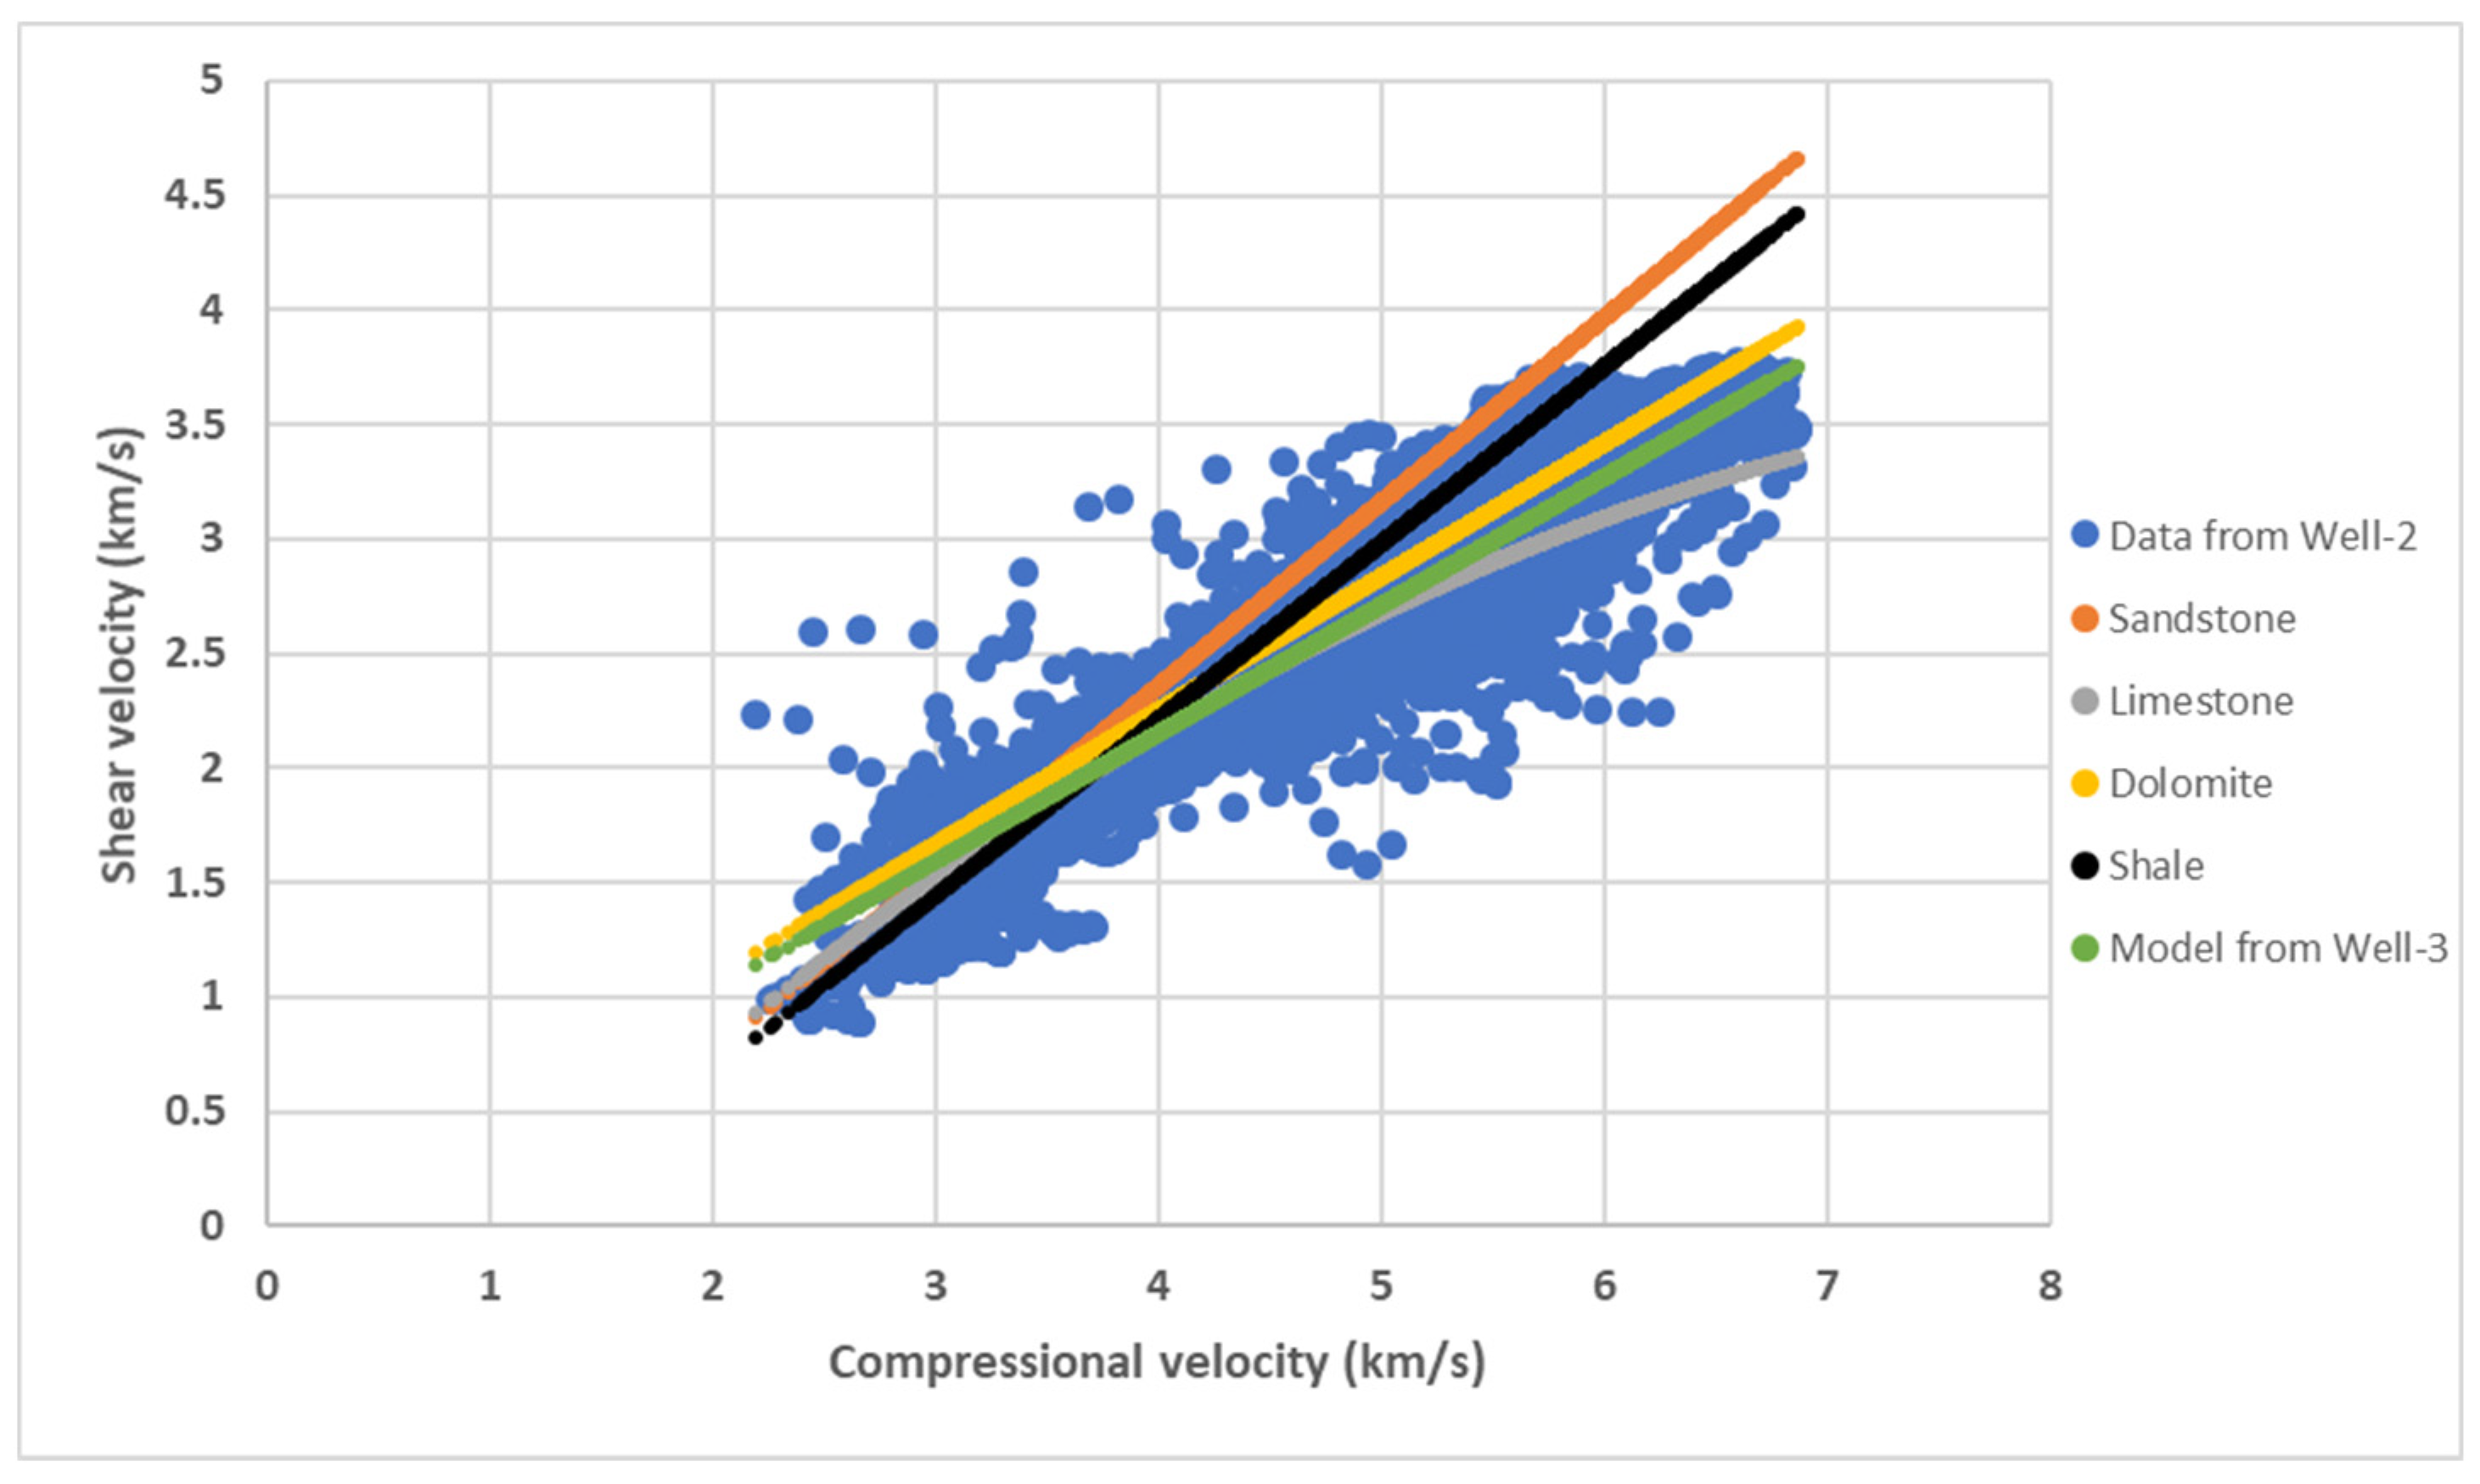
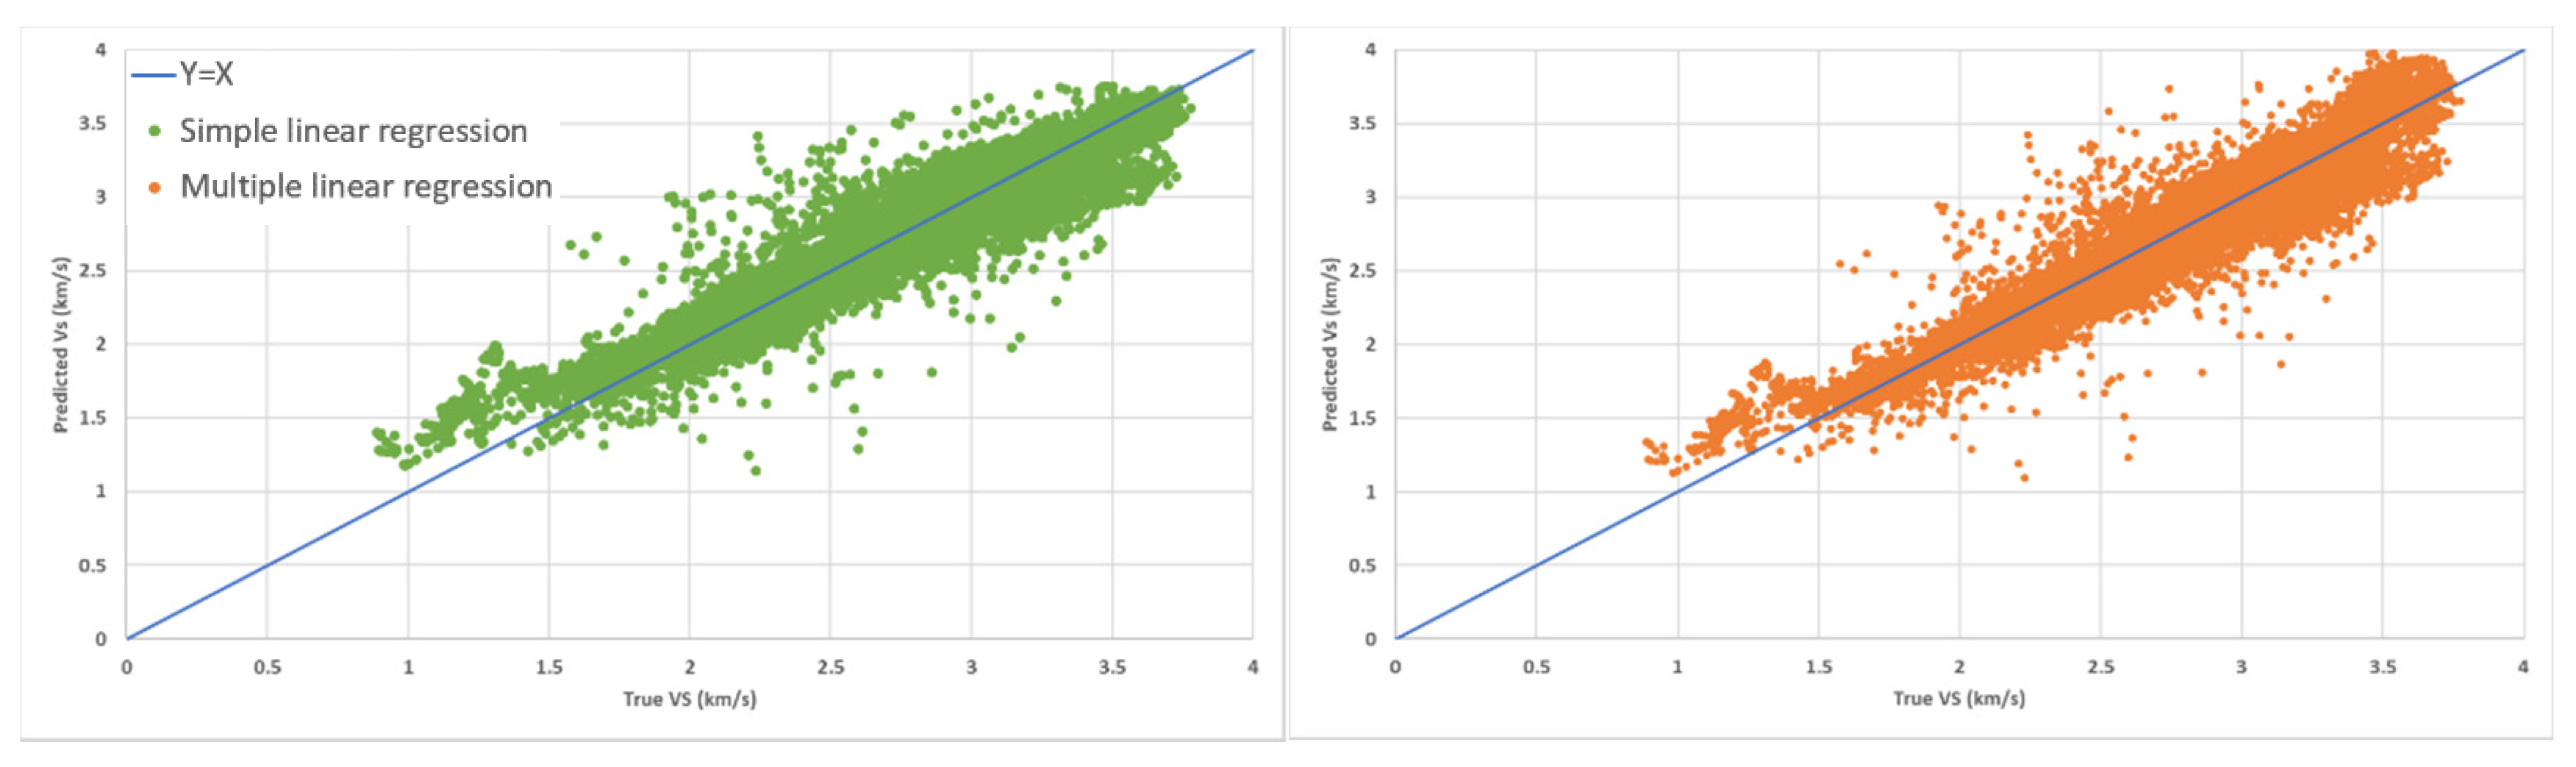
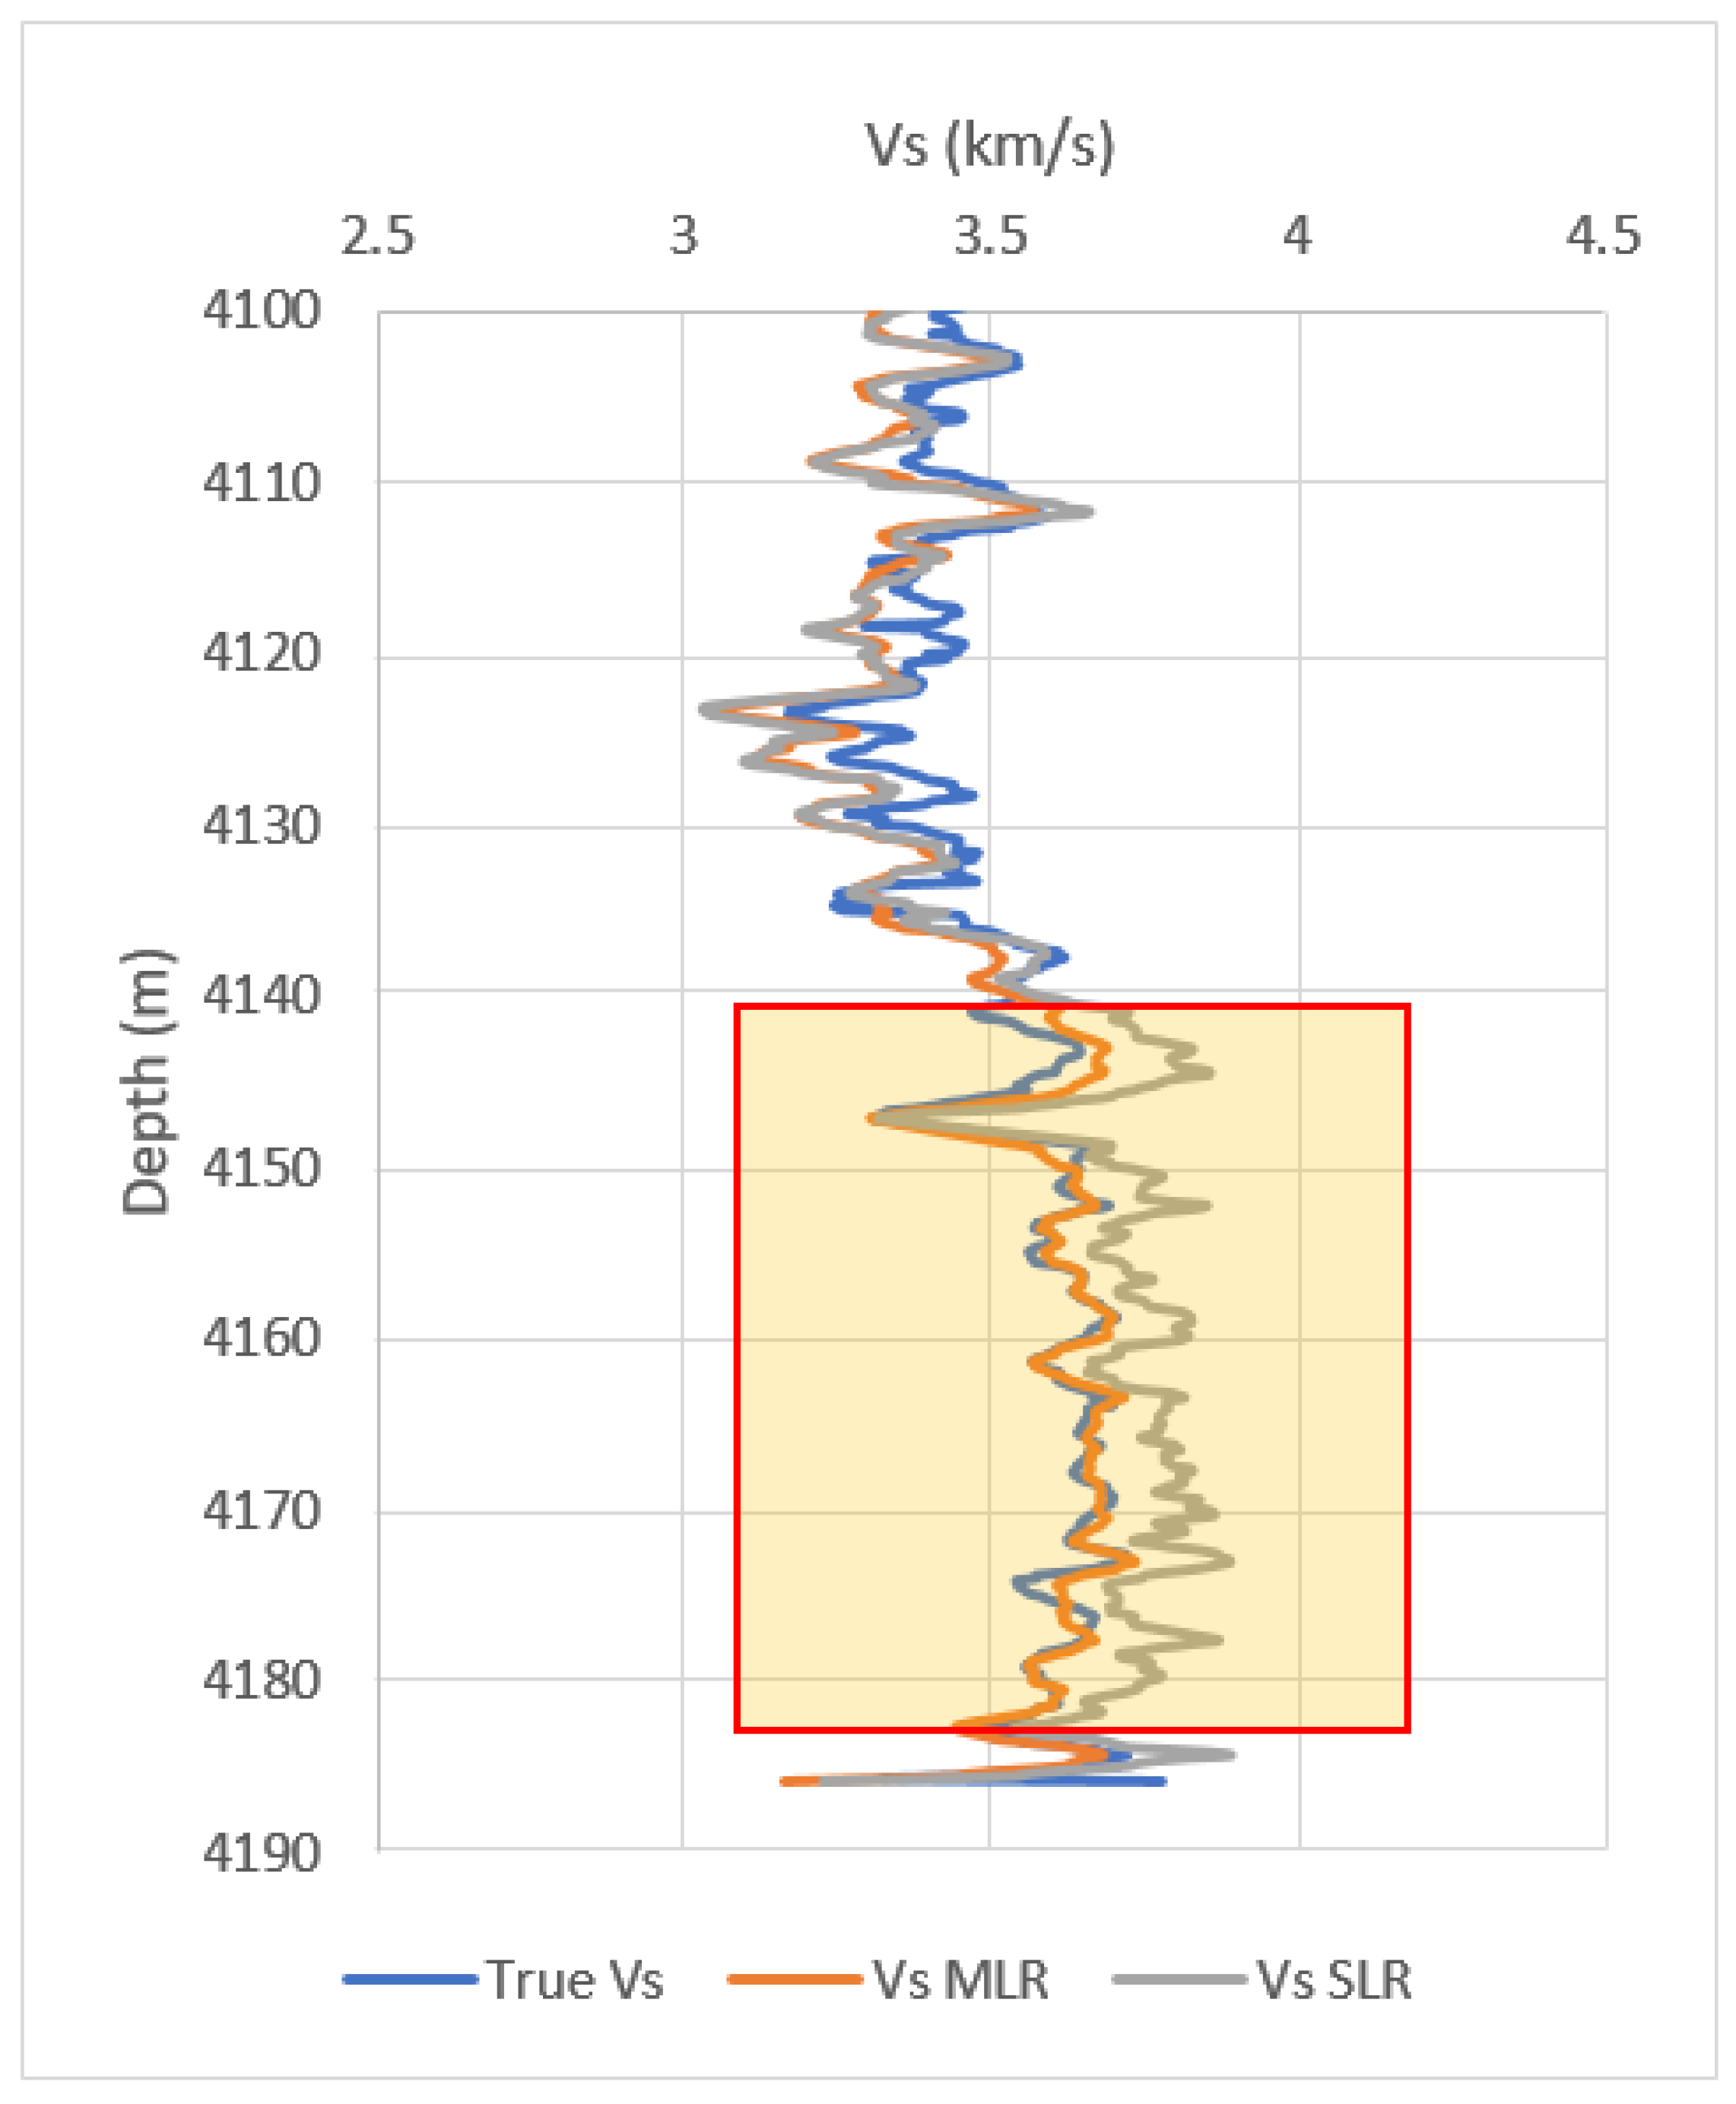
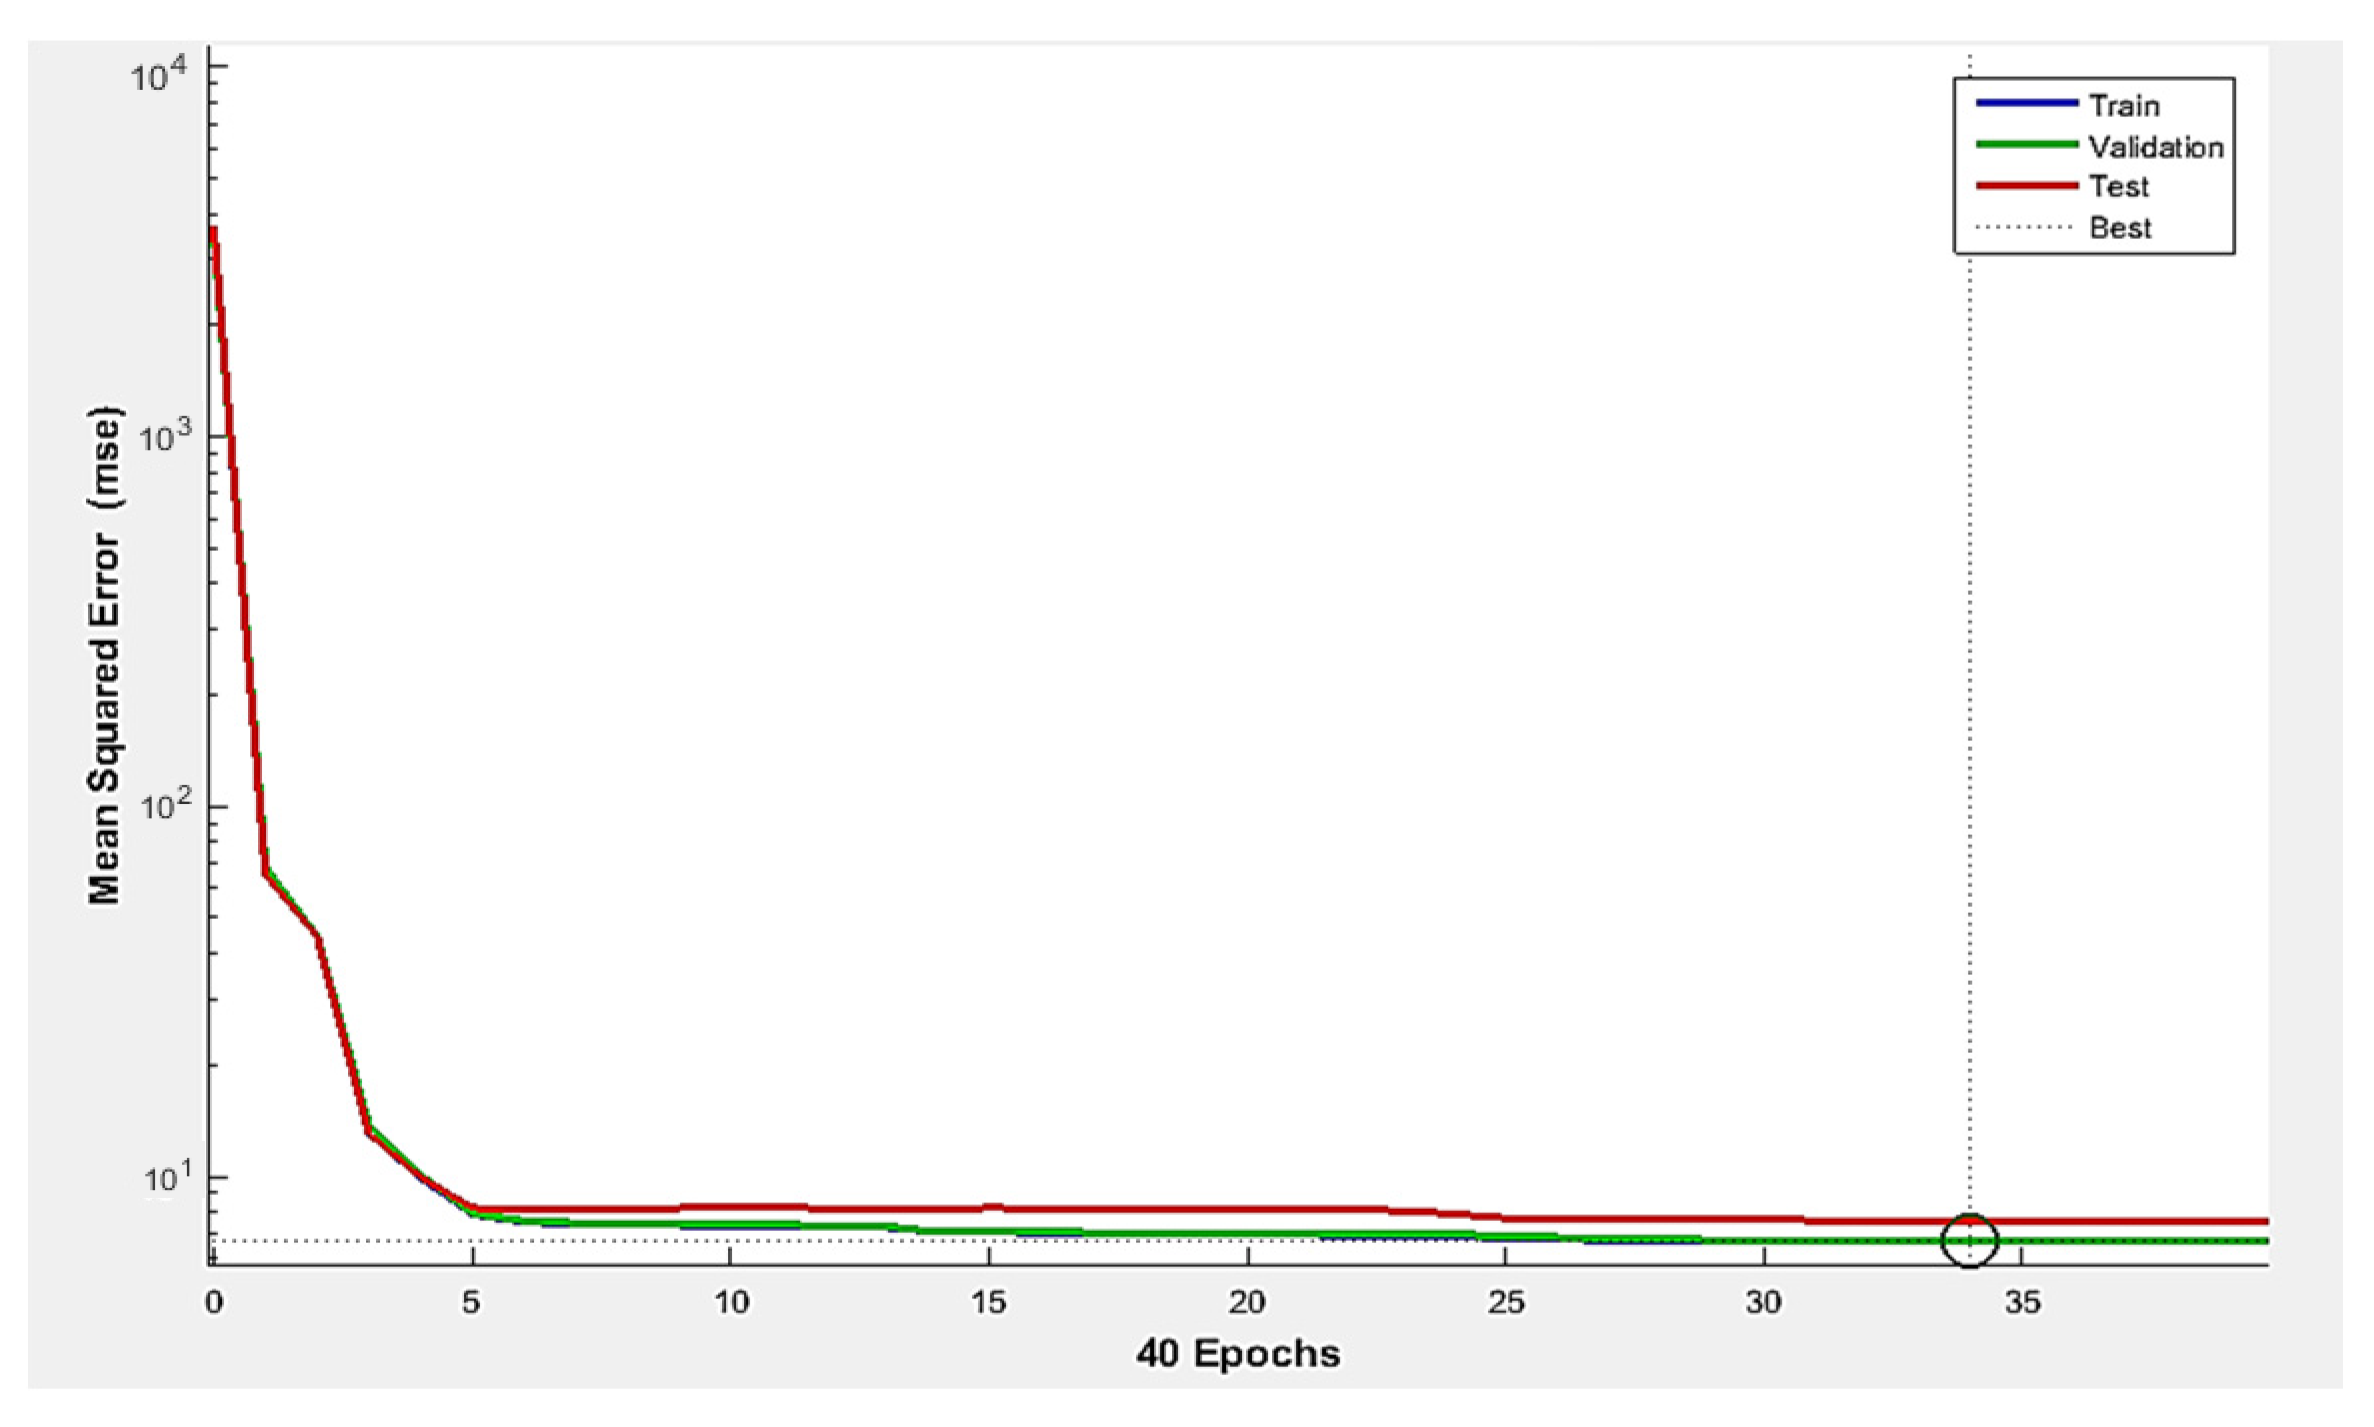
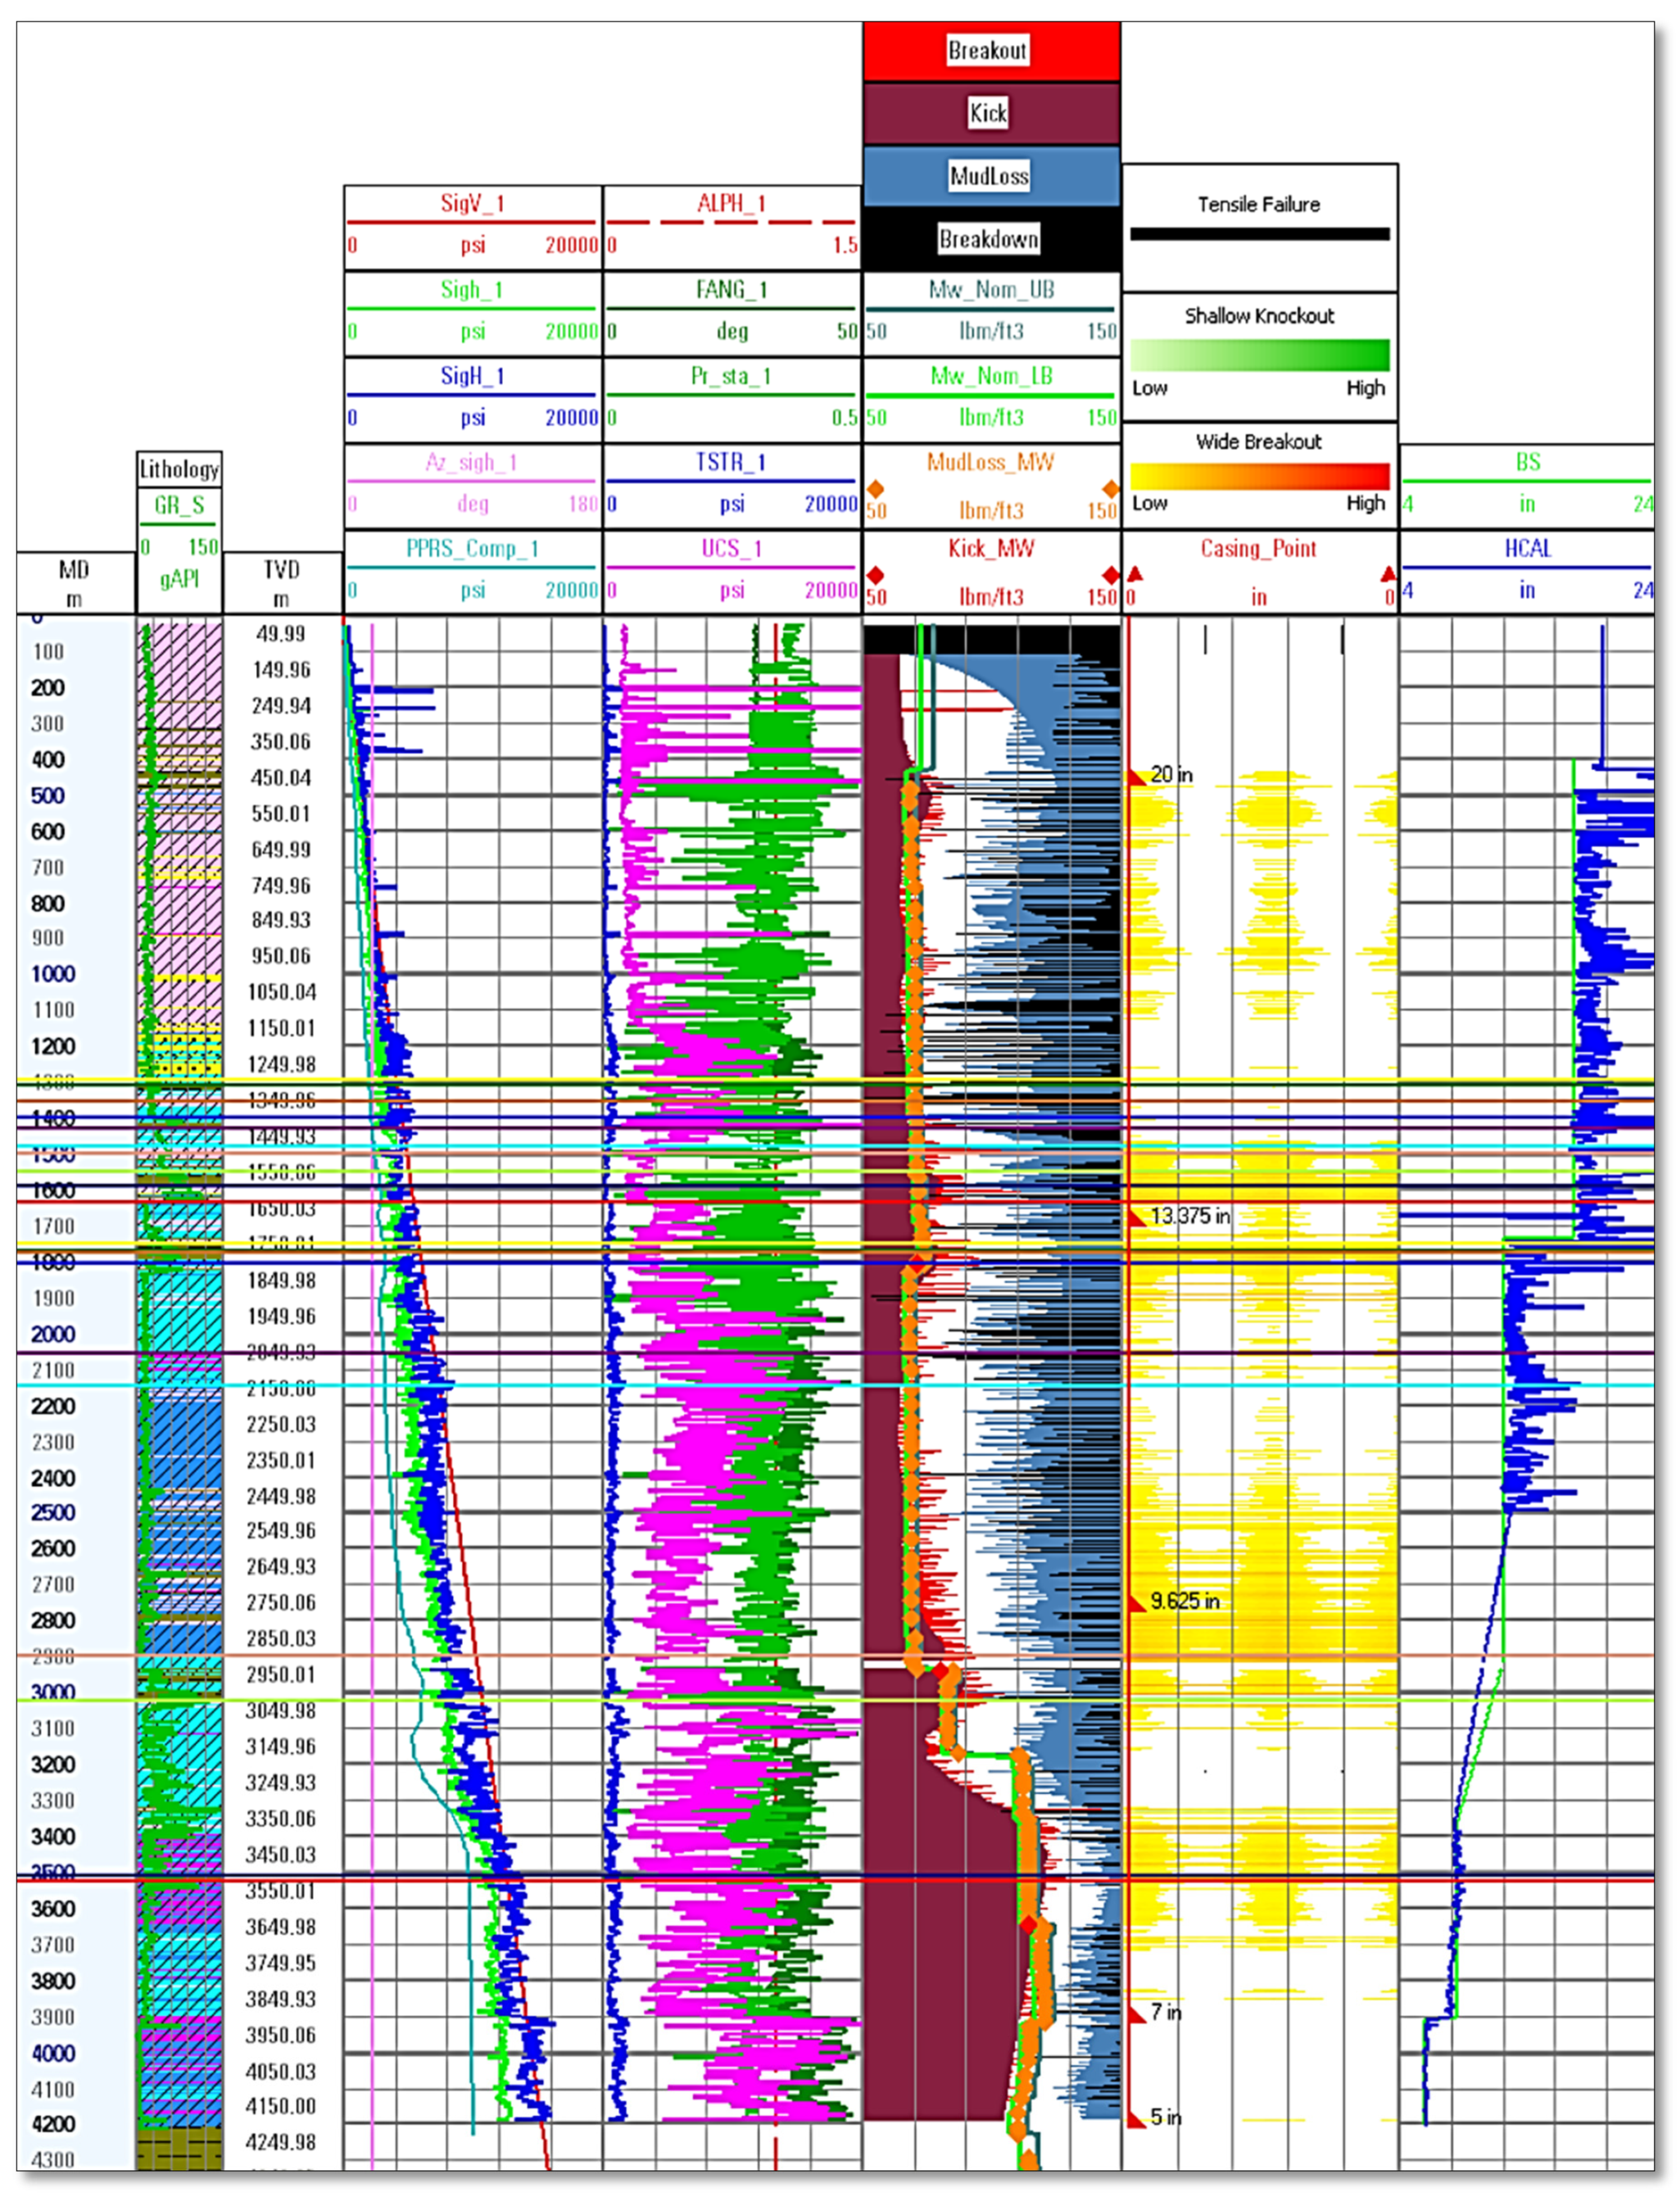
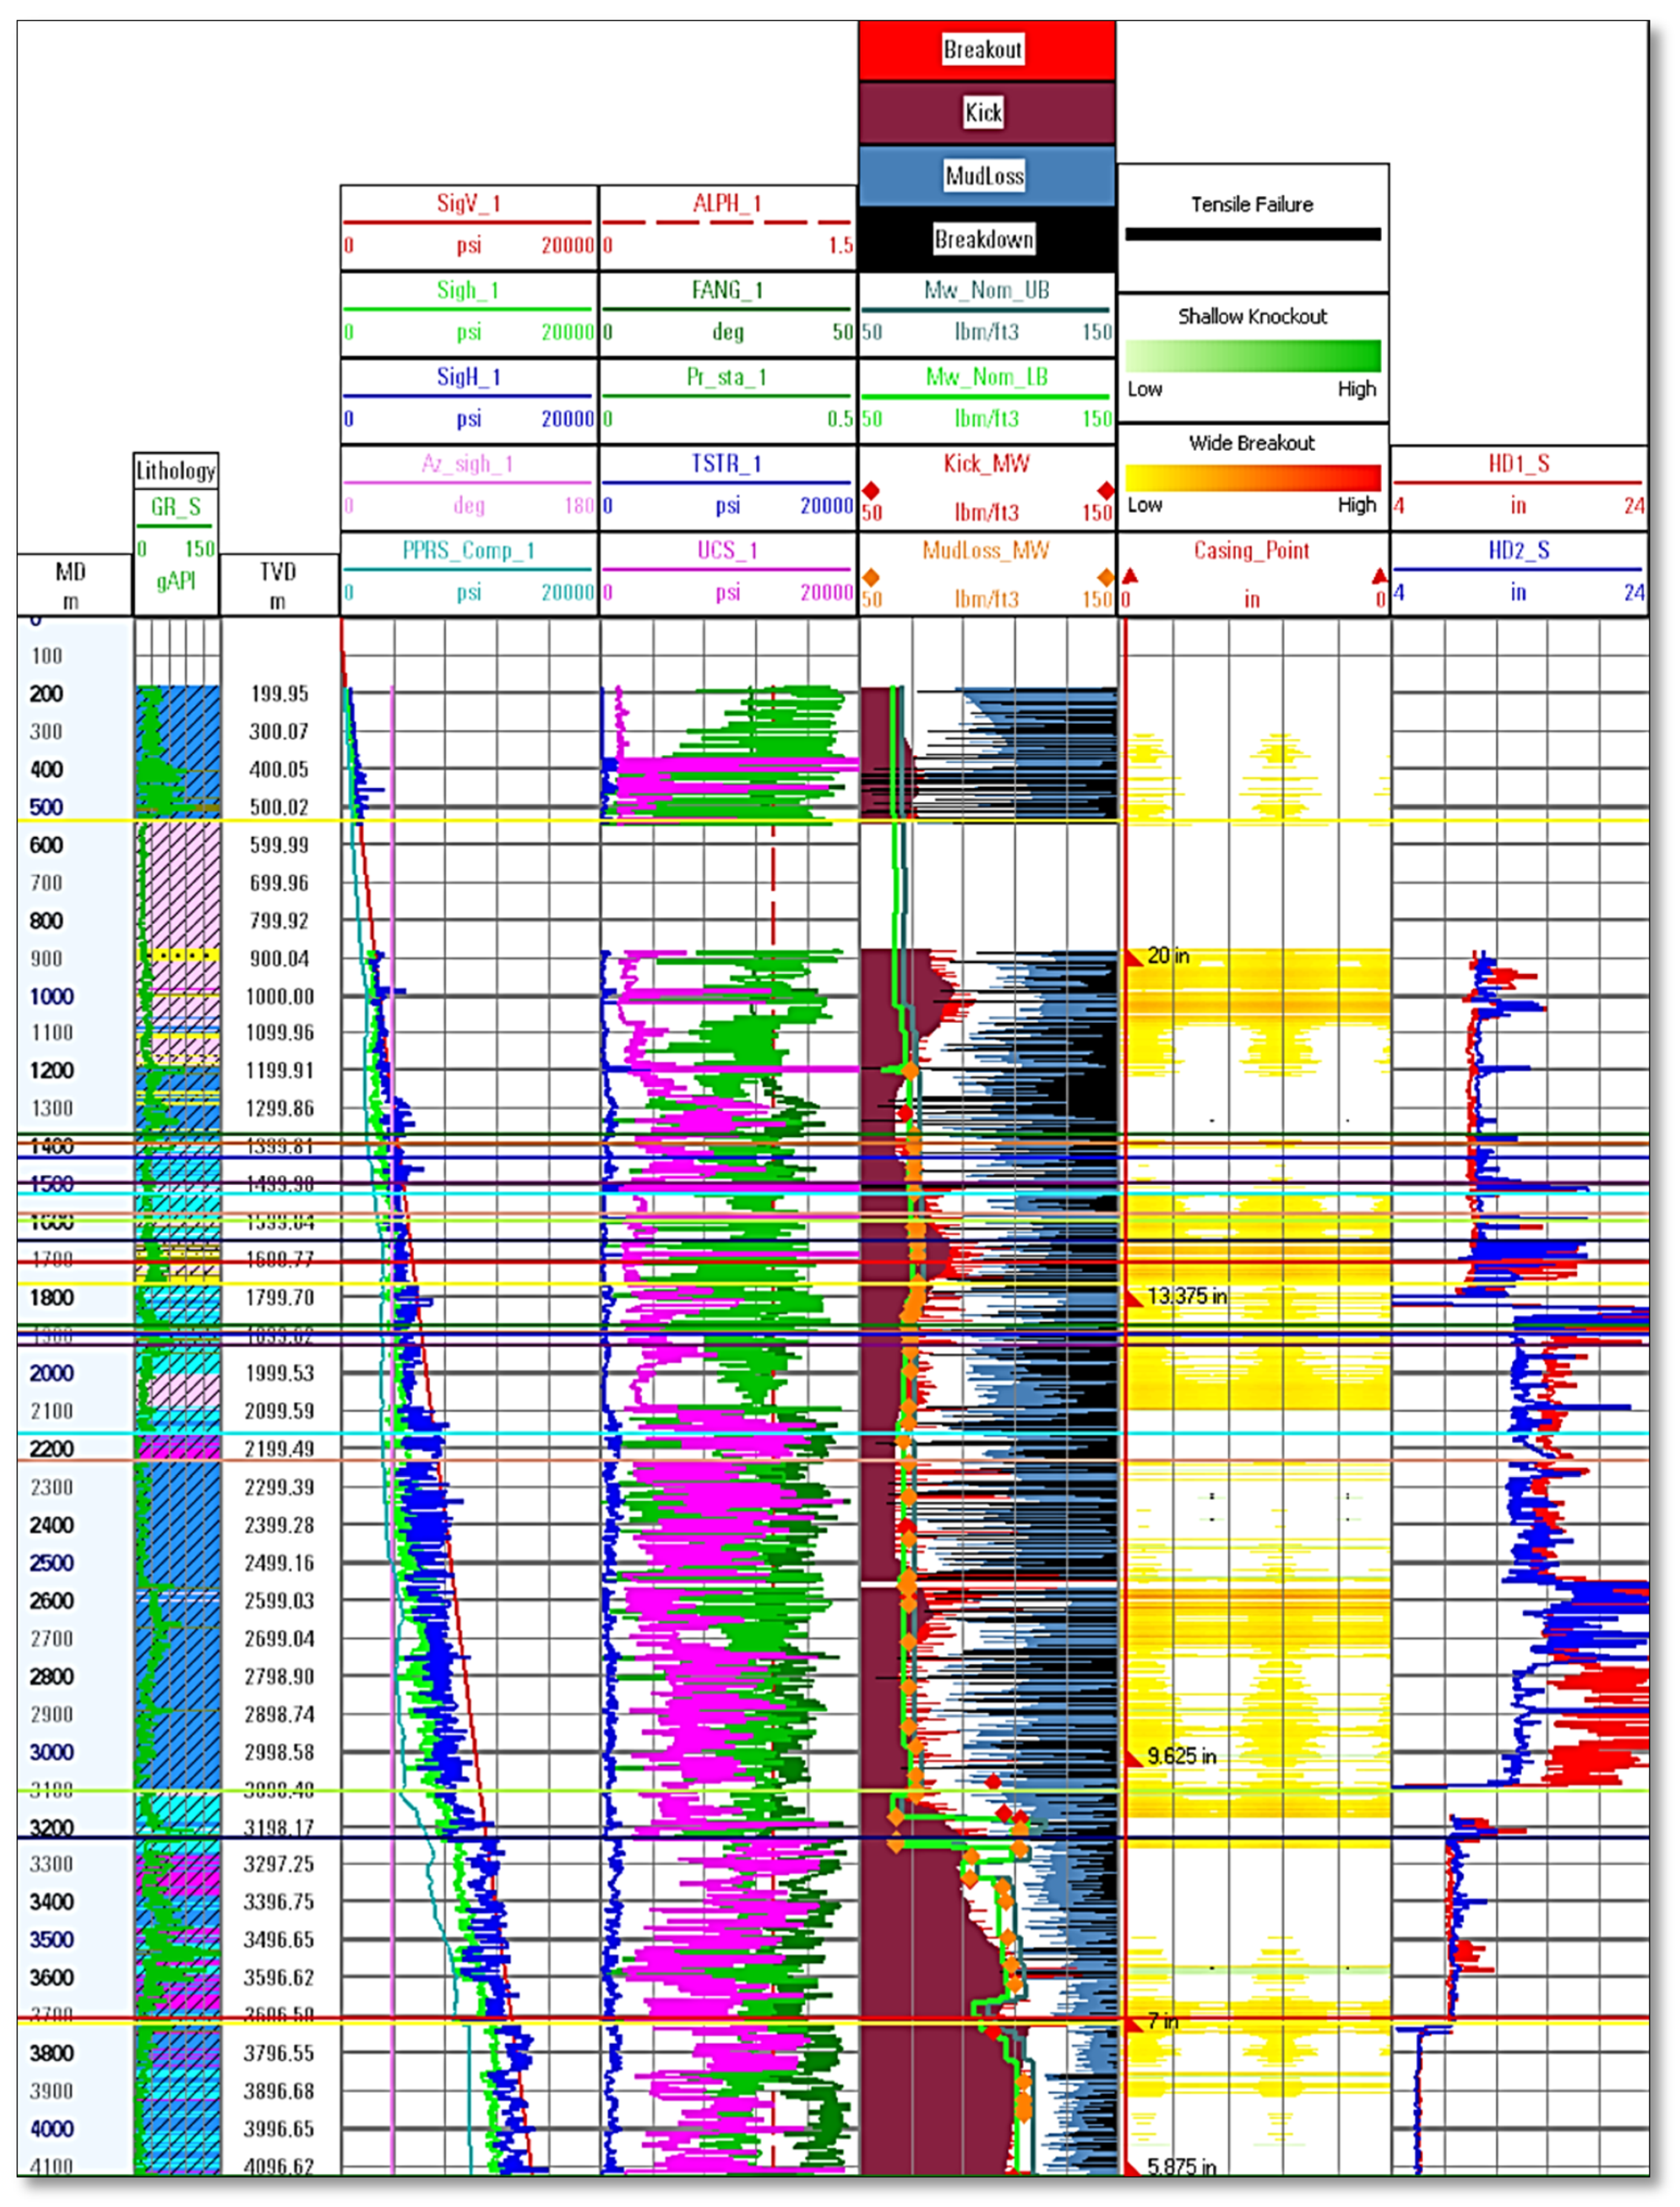
2. Results and Discussion

Different methods are available to predict shear wave velocity using available petrophysical logs. Initially, a simple linear regression using DTC as the sole independent variable was created; which works similar to a locally calibrated Greenberg–Castagna (GC) method. Table 2 shows the statistical properties of such a single linear regression model. As mentioned before, Well-3 as the longest well was considered for fitting the models and Well-2 as the validation. It is worth mentioning that to avoid data bias, we selected 70% of the data [53] randomly in a way that covers the whole well path. Figure 5 shows the division of the training set and testing set. As seen, both train and test data are covering the entire profile.
Shear velocity is a function of different rock properties, and merely using DTC is not accurate enough. Therefore, in the next step, multiple linear regression was performed to incorporate other properties as well. Table 3 shows the statistical properties of the multiple linear regression model. T-value is the value of each coefficient divided by its standard error. High (absolute) T-values in the regression shows the importance of each parameter in DTS prediction. As expected, DTC, GR, and Density had the highest T-values and consequently the highest impact on the results, respectively. In addition to the overall improvement in the accuracy of predictions compared to the simple linear regression model (Figure 6), a further improvement was noticed in the hydrocarbon-bearing zone (Figure 7) backed up by the MSE (mean squared error) and R2 (R-squared).
At the final step for Vs prediction, the neural network was used. Mean square error (MSE) curve plotted vs. the number of the training courses which is showing after 34 rounds model arrived to the best learning and the lowest error (Figure 8). According to the MSE and R2 results (Table 4), the efficacy of ANN in estimating shear wave velocity is very high. So, the ANN model is an accurate method to predict the shear wave velocity for Well-1 with no such log. Bukar et al. [9] and Akhundi et al. [10] also had similar results and mentioned ANN and multiple linear regression yield better results than empirical relations and single linear regression. By comparing the predicted wellbore instabilities with the observed drilling events, the robustness of the methodology is tested. Figure 9 shows the generated safe mud weight window for all three wells in the field. Borehole breakouts and breakdown in reservoir and overburden sections matched fairly well with caliper data. From the caliper data shown in Figure 9 for Well-3, breakouts are observed in the depth intervals of 850–1250 m, 1530–2080 m, and 2440–3130 m. The deepest breakout caused pipe sticking. The figure also shows that there is not a SMWW at the interval of 2515–2600 m, corroborated by the observed breakouts and complete mud loss. As can be seen in Figure 9, drilling events were predicted robustly. This infers that the rock elastic parameters were precited accurately enough using the proposed method.

3. Conclusions

Geomechanical studies have become a critical discipline in petroleum engineering and offer solutions for safe drilling, compaction, and subsidence in the field, CO2 sequestration, etc. Available data play a key role in such studies where shear velocity data are one of the necessary types of data.
In the current study, simple and multiple linear regression and ANN were utilized to estimate the shear wave velocity, and results showed ANN was very powerful. The neural network method can grasp the convoluted relationship between shear velocity and other petrophysical parameters, specifically where there is heterogeneity in the reservoir, which can provide more accurate results than linear regressions. Moreover, results also corroborate the fact that empirical relationships are not accurate enough as they are derived from particular fields in the world.
In the next step, 1D MEM was built for the wells in the field, where drilling events such as wellbore breakouts were well predicted with the developed MEM.

Author Contributions

Methodology, S.K.; Visualization, A.A.; Writing—original draft, S.K.; Writing—review & editing, A.A. All authors have read and agreed to the published version of the manuscript.

Funding

This research received no specific fundings.

Acknowledgments

Authors would like to acknowledge researchers from Petropars Company for sharing the data with us.

Conflicts of Interest

The authors declare no conflict of interest.

References

  1. Dusseault, M.B. Geomechanical challenges in petroleum reservoir exploitation. KSCE J. Civ. Eng. 2011, 15, 669–678. [Google Scholar] [CrossRef]
  2. Olson, J.E.; Laubach, S.E.; Lander, R.H. Natural fracture characterization in tight gas sandstones: Integrating mechanics and diagenesis. AAPG Bull. 2009, 93, 1535–1549. [Google Scholar] [CrossRef]
  3. Giani, G.P.; Gotta, A.; Marzano, F.; Rocca, V. How to address subsidence evaluation for a fractured carbonate gas reservoir through a multi-disciplinary approach. Geotech. Geol. Eng. 2017, 35, 2977–2989. [Google Scholar] [CrossRef]
  4. Grazia, G.; Orsatti, S.; Peter, G.; Rocca, V. A coupled fluid flow—Geomechanical approach for subsidence numerical simulation. Energies 2018, 11, 1804. [Google Scholar]
  5. Xu, S.; White, R. A new velocity model for clay-sand mixtures 1. Geophys. Prospect. 1995, 43, 91–118. [Google Scholar] [CrossRef]
  6. Kuster, G.T.; Toksöz, M.N. Velocity and attenuation of seismic waves in two-phase media: Part I. Theoretical formulations. Geophysics 1974, 39, 587–606. [Google Scholar] [CrossRef]
  7. Greenberg, M.L.; Castagnam, J.P. Shear-wave velocity estimation in porous rocks: Theoretical formulation, preliminary verification and applications1. Geophys. Prospect. 1992, 40, 195–209. [Google Scholar] [CrossRef]
  8. Mavko, G.; Mukerji, T.; Dvorkin, J. Tools for seismic analysis of porous media. In The Rock Physics Handbook; Cambridge University Press: Cambridge, UK, 2010. [Google Scholar]
  9. Bukar, I.; Adamu, M.B.; Hassan, U. A machine learning approach to shear sonic log prediction. In Proceedings of the Nigeria Annual International Conference and Exhibition, Lagos, Nigeria, 5–7 August 2019. [Google Scholar]
  10. Akhundi, H.; Ghafoori, M.; Lashkaripour, G.R. Prediction of shear wave velocity using artificial neural network technique, multiple regression and petrophysical data: A case study in Asmari reservoir (South West Iran). Open J. Geol. 2014, 4, 303–313. [Google Scholar] [CrossRef] [Green Version]
  11. Rajabi, M.; Bohloli, B.; Ahangar, E.G. Intelligent approaches for prediction of compressional, shear and Stoneley wave velocities from conventional well log data: A case study from the Sarvak carbonate reservoir in the Abadan Plain (Southwestern Iran). Comput. Geosci. 2010, 36, 647–664. [Google Scholar] [CrossRef]
  12. Asoodeh, M.; Bagheripour, P. Prediction of compressional, shear, and stoneley wave velocities from conventional well log data using a committee machine with intelligent systems. Rock Mech. Rock Eng. 2012, 45, 45–63. [Google Scholar] [CrossRef]
  13. Maleki, S.; Moradzadeh, A.; Riabi, R.G.; Gholami, R.; Sadeghzadeh, F. Prediction of shear wave velocity using empirical correlations and artificial intelligence methods. NRIAG J. Astron. Geophys. 2014, 3, 70–81. [Google Scholar] [CrossRef] [Green Version]
  14. Bagheripour, P.; Gholami, A.; Asoodeh, M.; Vaezzadeh-Asadi, M. Support vector regression-based determination of shear wave velocity. J. Pet. Sci. Eng. 2015, 125, 95–99. [Google Scholar] [CrossRef]
  15. Anemangely, M.; Ramezanzadeh, A.; Tokhmechi, B. Shear wave travel time estimation from petrophysical logs using ANFIS-PSO algorithm: A case study from Ab-Teymour Oilfield. J. Nat. Gas. Sci. Eng. 2017, 38, 373–387. [Google Scholar] [CrossRef]
  16. Behnia, D.; Ahangari, K.; Moeinossadat, S.R. Modeling of shear wave velocity in limestone by soft computing methods. Int. J. Min. Sci. Technol. 2017, 27, 423–430. [Google Scholar] [CrossRef]
  17. Mehrgini, B.; Izadi, H.; Memarian, M. Shear wave velocity prediction using Elman artificial neural network. Carbonates Evaporites 2017. [Google Scholar] [CrossRef]
  18. Akinnikawe, O.; Lyne, S.; Roberts, J. Synthetic well log generation using machine learning techniques. In Proceedings of the Unconventional Resources Technology Conference, Houston, TX, USA, 23–25 July 2018; pp. 1507–1522. [Google Scholar]
  19. Meng, M.; Qiu, Z.; Zhong, R.; Liu, Z.; Liu, Y.; Chen, P. Adsorption characteristics of supercritical CO2/CH4 on different types of coal and a machine learning approach. Chem. Eng. J. 2019, 368, 847–864. [Google Scholar] [CrossRef]
  20. Anemangely, M.; Ramezanzadeh, A.; Behboud, M.M. Geomechanical parameter estimation from mechanical specific energy using artificial intelligence. J. Pet. Sci. Eng. 2019, 175, 407–429. [Google Scholar] [CrossRef]
  21. Wang, D.; Peng, J.; Yu, Q.; Chen, Y.; Yu, H. Support vector machine algorithm for automatically identifying depositional microfacies using well logs. Sustainability 2019, 11, 1919. [Google Scholar] [CrossRef] [Green Version]
  22. Gholami, A.; Seyedali, S.; Ansari, H.R. Smart model for determining the shear wave velocity from seismic data. J. Pet. Sci. Eng. 2020. [Google Scholar] [CrossRef]
  23. Qiang, Z.; Yasin, Q.; Golsanami, N.; Du, Q. Prediction of reservoir quality from log-core and seismic inversion analysis with an artificial neural network: A case study from the Sawan Gas Field, Pakistan. Energies 2020, 13, 486. [Google Scholar] [CrossRef] [Green Version]
  24. Babaei, A. Longitudinal vibration responses of axially functionally graded optimized MEMS gyroscope using Rayleigh–Ritz method, determination of discernible patterns and chaotic regimes. SN Appl. Sci. 2019, 1, 831. [Google Scholar] [CrossRef] [Green Version]
  25. Babaei, A.; Yang, C.X. Vibration analysis of rotating rods based on the nonlocal elasticity theory and coupled displacement field. Microsyst. Technol. 2019, 25, 1077–1085. [Google Scholar] [CrossRef]
  26. Babaei, A.; Noorani, M.-R.S.N.; Ghanbari, A. Temperature-dependent free vibration analysis of functionally graded micro-beams based on the modified couple stress theory. Microsyst. Technol. 2017, 23, 4599–4610. [Google Scholar] [CrossRef]
  27. Babaei, A.; Rahmani, A. Vibration analysis of rotating thermally stressed gyroscope, based on modified coupled displacement field method. Mech. Base. Des. Struct. Mach. 2020. [Google Scholar] [CrossRef]
  28. McGregor, A.; Hall, M.; Lorier, P.; Brunskill, J. Flow clustering using machine learning techniques. In International Workshop on Passive and Active Network Measurement; Springer: Berlin/Heidelberg, Germany, 2004; pp. 205–214. [Google Scholar]
  29. Goldberger, A.S. Best linear unbiased prediction in the generalized linear regression model. J. Am. Stat. Assoc. 1962, 57, 369–375. [Google Scholar] [CrossRef]
  30. Forkuor, G.; Hounkpatin, O.K.L.; Welp, G.; Thiel, M. High resolution mapping of soil properties using remote sensing variables in south-western Burkina Faso: A comparison of machine learning and multiple linear regression models. PLoS ONE 2017, 12. [Google Scholar] [CrossRef]
  31. Heiat, A. Comparison of artificial neural network and regression models for estimating software development effort. Inf. Softw. Technol. 2002, 44, 911–922. [Google Scholar] [CrossRef]
  32. Eskandari, H.; Rezaee, M.R.; Mohammadnia, M. Application of multiple regression and artificial neural network techniques to predict shear wave velocity from wireline log data for a carbonate reservoir South-West Iran. CSEG Recorder 2004, 42, 40–48. [Google Scholar]
  33. Roden, R.; Smith, T.; Sacrey, D. Geologic pattern recognition from seismic attributes: Principal component analysis and self-organizing maps. Interpretation 2015, 3, SAE59–SAE83. [Google Scholar] [CrossRef]
  34. Wrona, T.; Pan, I.; Gawthorpe, R.L.; Fossen, H. Seismic facies analysis using machine learning. Geophysics 2018, 83, O83–O95. [Google Scholar] [CrossRef]
  35. Seyedalireza, K.; Aghajanpour, A.; Ostadhassan, M.; Farzay, O. Evaluating single-parameter parabolic failure criterion in wellbore stability analysis. J. Nat. Gas. Sci. Eng. 2018, 50, 166–180. [Google Scholar]
  36. Alexopoulos, E.C. Introduction to multivariate regression analysis. Hippokratia 2010, 14, 23–28. [Google Scholar]
  37. Castagna, J.P.; Batzle, M.L.; Eastwood, R.L. Relationships between compressional and shear-wave velocities in clastic silicate rocks. In Geophysics; Society of Exploration Geophysicists and the European Association of Geoscientists and Engineers: Tulsa, OK, USA, 1985; Volume 50, p. 334. [Google Scholar]
  38. Hilterman, F.J. Seismic Amplitude Interpretation; Society of Exploration Geophysicists and the European Association of Geoscientists and Engineers: Tulsa, OK, USA, 2001. [Google Scholar]
  39. Balan, B.; Mohaghegh, S.; Ameri, S. State-of-art in permeability determination from well log data. In Proceedings of the Eastern Regional Conference, Morgantown, WV, USA, 18–20 September 1995. [Google Scholar]
  40. Fjar Erling, R.M.; Holt, R.M.; Raaen, A.M.; Horsrud, P. Petroleum Related Rock Mechanics; Elsevier Science Publisher: Amsterdam, The Netherlands, 2008. [Google Scholar]
  41. Eissa, E.A.; Kazi, A. Relation between static and dynamic Young’s moduli of rocks. lnt. J. Rock Mech. Min. Sci. Geomech. Abstr. 1988, 24, 381–385. [Google Scholar] [CrossRef]
  42. Ciccotti, M.; Mulargia, F. Differences between static and dynamic elastic moduli of a typical seismogenic rock. Geophys. J. Int. 2004, 157, 474–477. [Google Scholar] [CrossRef] [Green Version]
  43. Słota-Valim, M. Static and dynamic elastic properties, the cause of the difference and conversion methods–case study. Nafta Gaz 2015, 11, 816–826. [Google Scholar] [CrossRef]
  44. Plumb, R.A. Influence of composition and texture on the failure properties of clastic rocks. In Proceedings of the Rock Mechanics in Petroleum Engineering, Delft, The Netherlands, 29–31 August 1994. [Google Scholar]
  45. Zhang, J. Pore pressure prediction from well logs: Methods, modifications, and new approaches. Earth Sci. Rev. 2011, 108, 50–63. [Google Scholar] [CrossRef]
  46. Eaton, B.A. The equation for geopressure prediction from well logs. In Proceedings of the Fall Meeting of the Society of Petroleum Engineers of AIME, Dallas, TX, USA, 28 September–1 October 1975. [Google Scholar]
  47. Song, L. Measurement of Minimum Horizontal Stress from Logging and Drilling Data in Unconventional Oil and Gas. Ph.D. Thesis, University of Calgary, Calgary, AB, Canada, August 2012. [Google Scholar]
  48. Blanton, T.L.; Olson, J.E. Stress magnitudes from logs: Effects of tectonic strains and temperature. SPE Reserv. Eval. Eng. 1999, 2. [Google Scholar] [CrossRef]
  49. Aghajanpour, A.; Fallahzadeh, S.H.; Khatibi, S.; Hossain, M.M.; Kadkhodaie, A. Full waveform acoustic data as an aid in reducing uncertainty of mud window design in the absence of leak-off test. J. Nat. Gas. Sci. Eng. 2017, 45, 786–796. [Google Scholar] [CrossRef] [Green Version]
  50. Khatibi, S.; Ostadhassan, M.; Farzay, O.; Aghajanpour, A. Seismic driven geomechanical studies: A case study in an Offshore Gas Field. In Proceedings of the 53rd US Rock Mechanics/Geomechanics Symposium, New York, NY, USA, 23–26 June 2019. [Google Scholar]
  51. Zoback, M.D. Reservoir Geomechanics; Cambridge University Press: Cambridge, UK, 2010. [Google Scholar]
  52. Al-Ajmi, A.M.; Zimmerman, R.W. Stability analysis of vertical boreholes using the Mogi–Coulomb failure criterion. Int. J. Rock Mech. Min. Sci. 2006, 43, 1200–1211. [Google Scholar] [CrossRef]
  53. Meng, M.; Zhong, R.; Wei, Z. Prediction of methane adsorption in shale: Classical models and machine learning based models. Fuel 2020, 278, 118358. [Google Scholar] [CrossRef]
Figure 1. Shear velocity vs. compressional velocity for Well-2 (blue dots) along with the empirical equations (Castagna) and linear model from Well-3. Note the misfit of the empirical equations.
Energies 13 03528 g001
Figure 2. Neural network model including 3 hidden layers. 3 inputs are DTC, GR, RHOZ, and the single output is DTS.
Energies 13 03528 g002
Figure 3. (top) Various elastic parameters for Well-1 after predicting the DTS; First track is showing: DT and DTS in μs/ft along with RHOB (density) in g/cc, Second track is showing: Dynamic and static Young’s modulus in MPsi, Third track is showing: Dynamic and static Poisson’s Ratio along with Biot’s coefficient, Forth track is showing: Dynamic and static Bulk and shear Modulus in MPsi. (bottom) in-situ stresses of Well-1. The first track is showing: Poisson’s Ratio, Biot’s coefficient and Young’s modulus, the second track is showing: Vertical stress, minimum horizontal stress, maximum horizontal stress along with the pore pressure, the third track is showing friction angle and horizontal stress azimuth.
Energies 13 03528 g003aEnergies 13 03528 g003b
Figure 4. Using cross plot to differentiate between grain and clay supported units.
Energies 13 03528 g004
Figure 5. Training (red dots) and test (blue squares) data cover the whole well path to avoid data bias.
Energies 13 03528 g005
Figure 6. Predicted vs. True shear velocity for Well-2 using (left) Simple linear and (right) multiple linear regression methods from Well-3.
Energies 13 03528 g006
Figure 7. Improvement in the prediction of shear velocity in the hydrocarbon-bearing zone (highlighted zone): As seen MLR can predict Vs more accurate than SLR. Models were fitted in Well-3 and are validated in Well-2.
Energies 13 03528 g007
Figure 8. Number of iterations (epochs) versus mean square error (MSE).
Energies 13 03528 g008
Figure 9. 1D MEM for three available wells in the field (Well-1: top, Well-2: middle, Well-3: bottom). Note the accurate match between observed drilling events and the predicted ones. First tracks are showing: Vertical stress, minimum horizontal stress, maximum horizontal stress and along with pore pressure, Second tracks are showing: Biot’s coefficient, Friction angle, Poisson’s ratio, Tensile strength and UCS, Third tracks are showing: Kick, breakout, loss and breakdown boundaries along with the mud weight used while drilling, Forth tracks are showing: Failures predicted from the model, Fifth tracks are showing: caliper data. A good match between predicted failures and caliper data can be noted.
Energies 13 03528 g009aEnergies 13 03528 g009bEnergies 13 03528 g009c
Table 1. Standard error of the estimate for different models.
ModelStandard Error of The Estimate
Model from Well-30.167
Vs Limestone equation0.206
Vs Dolomite equation0.213
Vs Shale equation0.404
Vs Sandstone equation0.575
Table 2. Simple linear regression model properties.
TermCoefficientT-ValueError Analysis
Constant−14.067−39.35R2 = 87%
DTC2.091359.82MSE = 11.32
Table 3. Multiple linear regression model properties.
TermCoefficientT-ValueError Analysis
Constant21.5112.91R2 = 89%
MSE = 9.12
DTC2.00851239.96
GR−0.09748−27.86
RHOZ−10.406−21.50
Table 4. Neural network properties.
MethodStepMSER2
Neural networkTraining6.3195.58
Testing6.8795.21
Validating7.6795.55

