Numerical Study on the Gravity Effect on Heat Transfer of Supercritical CO2 in a Vertical Tube

1
Key Laboratory of Ocean Energy Utilization and Energy Conservation of Ministry of Education, Dalian University of Technology, Dalian 116024, China
2
Shenyang Aeroengine Research Institute, Aero Engine Corporation of China, Shenyang 110015, China
*
Author to whom correspondence should be addressed.
Energies 2020, 13(13), 3502; https://doi.org/10.3390/en13133502
Submission received: 26 May 2020
/
Revised: 22 June 2020
/
Accepted: 4 July 2020
/
Published: 7 July 2020
Abstract
:The effects of gravity on the heat transfer performance of supercritical CO2 flowing within a vertical tube with a diameter of 4.75 mm are numerically studied in this paper. The main objectives are to comprehensively investigate the action of gravity and buoyancy on the supercritical heat transfer. An effective numerical method, which employs a modified Shear Stress Transfer k-ω model (SST k-ω), is applied at various gravity conditions. It is found that, for both upward and downward flows, the heat transfer of supercritical CO2 is improved with increased gravity magnitude. The effect of gravity on heat transfer are more pronounced under a low mass flux condition than that under a high mass flux condition and it is closely related to the variations of thermal properties. For the upward flow, the increased gravity magnitude accelerates the near wall fluid and creates a classic “M-shaped” radial velocity distribution. For the downward flow, the increased gravity magnitude decelerates the near wall fluid and creates a parabola-like radial velocity distribution. On one hand, the turbulent kinetic energies of both the upward and downward flows are enhanced as the gravity magnitude increases, which benefits heat transfer dominated by turbulent eddy diffusion. On the other hand, high-density fluid with high thermal conductivity occupies the near wall region as the gravity magnitude increases, which benefits heat transfer dominated by molecular diffusion. The results might provide some instructive advice to improve the design and operation safety of heat exchanger at various gravity conditions.
1. Introduction
With the development of aero-engine technology, the operation parameters, for example, pressure, heat flux and wall temperature, are becoming increasingly higher to meet the demand for a new generation of aero-engines. To protect aircraft engines and improve system efficiency, the high efficiency heat transfer technologies are essential. Supercritical fluids, such as hydrogen, nitrogen, carbon dioxide and other fluid materials are therefore adopted or are under consideration as the working medium due to their high heat absorption capacity [1]. Many studies have thus been conducted to improve the industrial applications of supercritical fluid. Khmelinskii and Woodcock [2] conducted a comprehensive review of the research on the supercritical fluid gaseous and liquid states. By reviewing the experimental evidence from both historic and modern literature, they concluded that the non-continuity description of liquid-gas criticality is the only plausible description that is consistent with the results of 150 years of experimental thermodynamic measurement research. Gkountas et al. [3] conducted a thermodynamic analysis of a 600 MW supercritical carbon dioxide (S-CO2) Brayton cycle. The factors affecting the performance of cycle were discussed in detail. They found that the performance of the Printed Circuit Heat Exchanger (PCHE) recuperator should be essential to the attainment of 46% and beyond for appropriate operating conditions. Jacob et al. [4] comprehensively discussed the possibility of using a S-CO2 bottoming cycle to reduce the fuel burn over an advanced geared turbofan engine. They concluded that the goal of 15% fuel burn reduction can be expected from more integrated simulations of combined cycles withthe further addition of inter-turbine reheat and/or intercooling. Using the carbon dioxide as a working medium, Zhou [5] found that the Grashof number (Gr) in the vicinity of the pseudo-critical temperature of supercritical fluid is large, which means the buoyancy effect in this region definitely cannot be ignored. By analyzing the combined actions of buoyancy and thermal acceleration, they concluded that buoyancy and thermal acceleration both induce heat transfer deterioration at low mass velocity. Jackson et al. [6] proposed a criterion formula that uses the Grashof number and Reynolds number, Gr/Re2.7 < 10−5 to evaluate the effect of buoyancy on heat transfer. They believed that when the value of Gr/Re2.7 is less than 10−5, the effect of buoyancy can be ignored for the supercritical heat transfer process; otherwise, it cannot be ignored for flow and heat transfer within a vertical tube. Petukhov et al. [7] proposed the criterion of the buoyancy effect for the heat transfer process of supercritical water within a horizontal tube. Based on these classical research findings of Jackson et al. [6] and Petukhov et al. [7] many researchers subsequentlyconducted investigations to extend knowledge in this field further.
Liao and Zhao [8] conducted an experimental investigation of convective heat transfer to supercritical CO2 in miniature tubes. Various tube diameters and flow orientations were tested. It was found that the effects of buoyancy were significant for all flow orientations, although the Reynolds numbers were up to 105. Correlations were finally developed based on the experimental data for the axially averaged Nusselt number of convective heat transfer to supercritical CO2 in both horizontal and vertical miniature heated tubes. Jiang et al. [9,10,11,12] conducted a series of experimental and numerical studies to assess the heat transfer performance of supercritical CO2 in a miniature tube within a wide Reynolds number range. It was found that the effects of buoyancy within miniature tubes are quite small, even when the heating was strong at a low Reynolds number. For a higher Reynolds number (9000), buoyancy can weaken or enhance the heat transfer of supercritical CO2 when Bo* is less than 6 × 10⁻⁷ or greater than 2 × 10⁻⁵. In addition, Jiang et al. [12] discussed the action mechanism of buoyancy. They found that when the pseudo-critical temperature of supercritical CO2 is reached inside the laminar sublayer (y+ < 5), heat transfer is enhanced for the upward flow and weakened for the downward flow. This was due to the velocity gradient increase for the upward flow and decrease for the downward flow by the strong buoyancy effect. These findings are different from the numerical results of our previous studies [13,14,15] and that by Bazargan and Mohseni [16]. Differences in the tube diameter (macro-scale in our study and Bazargan’s study and micro-scale in Jiang’s studies) might be the main cause of the qualitative difference. Hasan and Farouk [17] numerically studied buoyancy-driven convection in near-critical and supercritical CO2 using a two-dimensional model. The effect of the pseudo-critical conditions on thermal transport as well as the development of a correlation to predict the thermal transport behavior of supercritical CO2 both near and far from the critical point were demonstrated. Li et al. [18] experimentally and numerically studied the heat transfer characteristics of supercritical CO2 in an internally ribbed tube over a wide range of buoyancy effects. Their purpose was to improve the heat transfer performance of a gas heater in the supercritical CO2 Rankine cycle. It was found that the effect of buoyancy is closely related to the rib geometries of the tube. Bae et al. [19] established a functional relation between the dimensionless damping length and shear stress in the buffer layer and proposed a new model for Reynolds Average Navier-Stockes (RANS)-type numerical calculation of supercritical fluid flows under strong buoyancy. They found that the simulation results obtained using the new model agree very well with the experimental data. Tian et al. [20] conducted a numerical study to understand the effect of buoyancy on the mixed convection flow and heat transfer of supercritical R134a in heated horizontal tubes. It was found that the turbulent kinetic energy on the top and bottom of a horizontal tube is the dominating factor resulting in non-uniform heat transfer and that it is greatly affected by buoyancy. Kim et al. [21] experimentally studied the heat transfer of supercritical CO2 in a horizontal tube. The buoyancy parameter, BuC and Jackson’s buoyancy parameter, BuJ, were compared and their relationship with heat transfer behavior were analyzed. Kim et al. [21] concluded that these two parameters are not sufficient to develop a heat transfer model for horizontal flows. Zhang et al. [22] numerically studied the heat transfer of supercritical CO2 in a helically coiled tube to explore the relationship between the curvature and buoyancy effect. A new buoyancy parameter that considers the overall curvature effect was proposed and the relationship between the buoyancy and geometry of a helically coiled tube were discussed in detail.
These research results indicate that buoyancy is closely related to the heat transfer performance of supercritical fluids. Its action mechanism is subject to certain objective conditions, of which gravity is very important, especially for the heat exchanger used in aircraft. This is because the transient acceleration and deceleration motions in practice can cause high-gravity and low-gravity that rapidly change the buoyancy action [1]. Until now, most of the research on the gravity effect has mainly focused on boiling heat transfer. Kawanami et al. [23] experimentally studied the effect of gravity on cryogenic boiling heat transfer during tube quenching. It was found that heat transfer under microgravity conditions increases by up to 20% compared to that under 1 g. Xie et al. [24] conducted an experiment to study the boiling heat transfer of water flowing in helical coils under a condition of high gravity. They found that high-gravity acceleration had an adverse superheat influence on the flow boiling heat transfer, particularly with low mass and low vapor quality. Vlachou et al. [25] conducted an experimental study on the highly subcooled flow boiling of water to assess the effect of gravitational acceleration on flow boiling heat transfer. It was found that the hyper-g heat transfer coefficient in a horizontal channel is approximately 10% to 15% higher than 1 g and this value is approximately 20% to 40% lower than 1 g in a vertical channel. For the horizontal condition, buoyancy widens the thermal boundary layer and promotes bubbles detachment, whereas for the vertical condition, buoyancy promotes bubble sliding and enhances bubble coalescence. Some other valuable results can be found in several papers in the literature [26,27,28,29,30], which all explored two-phase heat transfer performance under various gravity conditions.
For supercritical fluids, although the phase transition phenomenon disappears during heat transfer, the variations of thermal properties (such as density and specific heat) near the pseudo-critical point are very sharp with increasing fluid temperature and pressure. This, to a certain extent, makes the heat transfer process of supercritical fluid similar to that of sub-critical fluid. However, without phase transition, the thermal dynamics of supercritical fluid within the boundary layer is quite different from that of boiling heat transfer of subcritical fluid. Therefore, the action mechanisms of buoyancy and gravity on the heat transfer process of supercritical fluid is different. The buoyancy effects at normal gravity condition have been studied by many scholars, however, little information of supercritical heat transfer performance at various gravity conditions can be found in open literatures. Herein, the commercial Computational Fluid Dynamics (CFD) code FLUENT of Ansys 16.1 is used as the working platform and a modified SST k-ω model is used as the turbulence model to evaluate the effects of gravity on the heat transfer performance of supercritical CO2 flowing in a vertical round tube. The novelty of this study is to thoroughly investigate the effects of gravity condition on heat transfer for a vertical flow of supercritical CO2 and acquire both qualitative and quantitative information of heat transfer performance under various working conditions. The results might provide some instructive advices to improve the design and operation safety of heat exchanger at various gravity conditions.
2. Methodology
2.1. Governing Equation and Turbulent Model
In this paper, the SST k-ω turbulence model was adopted as the turbulence model to deal with the forced convection of SC-CO2 within a vertical round tube. The governing equations employed were the energy, momentum and continuity equations. The SST k-ω model is well known for its near-wall treatment for low-Re computation and it can offer high-accuracy simulations in the boundary layer [31].
The steady-state continuity and momentum equations for a 2D axisymmetric model in cylindrical coordinates are omitted while the energy equation in the form of enthalpy is shown for a clear understanding of the effect of Prt on heat transfer:
Pr and Prt in Equation (1) are the molecular and turbulent Prandtl numbers, respectively. μt is the turbulent viscosity in the SST k-ω model, which is defined as
where α* is the damping coefficient of the turbulent viscosity causing a low-Reynolds number correction.
The transport equations for the turbulent kinetic energy k and specific dissipation rate ω are defined as follows:
2.2. Turbulent Prandtl Number Modification
In a turbulent flow, the generalized diffusivity of enthalpy consists of two parts, shown in Equation (5), where the first term represents the heat transfer contribution of molecular conduction and the second term represents the contribution of turbulent mixing:
In our previous paper [32], a variable Prt model in the form of a piecewise function was proposed with the following assumptions and descriptions:
where the correction factors in Prt for the tube diameter (fd) and system pressure (fP) are defined, respectively, as
The correction factors in the range of μt/μ for the tube diameter (α1 and α2) are determined as
More detailed information onthis model can be found in our previous work [32] and will not be repeated in this paper.
2.3. Validation of Turbulent Model
To validate the applicability of turbulence model introduced above, the experimental data of supercritical CO2 obtained by Song et al. [33] and Kline et al. [34] are used here to make comparisons with simulation results using this modified SST k-ω model at various working conditions. The volume mesh for numerical simulation is fine enough to make sure the near wall y+ is less than 1.0. All cases for the validation are listed in Table 1.
Figure 1a,b show the experimental data obtained by Song et al. [33] in comparison with the simulation results of this study at different working conditions, including two tube diameters of 9 mm and 4.4 mm. A clear Heat Transfer Deterioration (HTD) phenomenon can be observed from Figure 1a,b when the heat flux is 50 kW/m2 and mass velocity is 400 kg/m2s. The simulations of this study using the current turbulent model can nearly reproduce this HTD phenomenon with a certain degree of overestimation heat transfer deteriorationof wall temperature, except for the case in Figure 1a when the heat flux is 30 kW/m2, where the prediction underestimates and shows only a slight increase in the wall temperature. For the HTE cases in Figure 1a,b, represented by the green triangular points and red round points respectively, the simulation results match well with the experimental data.
Figure 1c,d show the experimental data obtained by Kline et al. [34] in comparison with the simulation results of this study at different working conditions. The experiment conducted by Kline et al. [34] highlighted interesting features about the onset of HTD from aquantitative perspective. Although more or less quantitative differences between the simulation results and experimental data can be found in Figure 1c,d, the current turbulent model qualitatively shows a good ability to predict the onset of HTD of SC-CO2.
Generally speaking, the normal and enhanced heat transfer can be easier and more accurately predicted using numerical method compared to that of deteriorated heat transfer of supercritical fluid. For the current turbulent model, we modify the Prt to accommodate the heat transfer contribution rate affected by buoyancy and make the turbulent model more suitable for the prediction of HTD induced by buoyancy effect [32]. Based on the above comparison results, it can be concluded that the current model can well predict the forced convective heat transfer of SC-CO2 and therefore, it is adopted in this paper for the rest of simulations.
2.4. Boundary Conditions and Mesh Dependency
Figure 2 presents the physical model studied in this paper. It is a vertical round tube that is 4.57 mm in diameter and 3000 mm in total length. The 500 mm adiabatic part near the inlet is to ensure that the flow within the tube can be fully developed before it is heated. A constant heat flux is uniformly added to the heating part of the tube wall. The inlet and outlet are set as the mass flow inlet and pressure outlet, respectively. The gravity is set along and against the flow direction to obtain the vertically downward and upward flows. The gravity varied from 1 to 100 m/s2 to create a series of abnormal gravity conditions, enabling a full evaluation of the effects of microgravity or hyper-gravity conditions on the heat transfer performance of supercritical CO2. The corresponding working conditions are listed in Table 2. Since the pressure drop along the tube is much smaller than operation pressure, physical properties of supercritical CO2 are treated as independent of pressure and obtained from the NIST Standard Reference Database.
Figure 3 shows a comparison of simulation results of five cases using different mesh structures, including the mesh number and near wall y+. The corresponding mesh number and near wall y+ for each case are listed in Table 3. The variations of wall temperature plotted against the bulk enthalpy are given for the working conditions of P = 8.12 MPa, G = 400 kg/m2s, q = 50 kW/m2 and Tin = 5 °C for the upward flow.
It can be seen that two obvious peaks of wall temperature appear in succession with increasing bulk enthalpy of supercritical CO2, indicating that the HTD appears under the given working condition. The simulation results of all five cases reflect the features of sharply increasing wall temperature. The calculation results of cases 4 and 5 almost overlap each other in a wide bulk enthalpy region, as illustrated in the sub-figures of Figure 3. This indicates that the simulation results are approximately mesh-independent when the minimum near wall y+ was less than 0.03 in this study. Therefore, the mesh system of case 4 was adopted as a baseline for the rest of the CFD analysis based on consideration of the computational time.
3. Results and Discussions
3.1. Effect of Gravity for the Upward Flow
3.1.1. Variations of HTC
Figure 4 shows the effect of gravity on variation of the heat transfer coefficient (HTC) as the bulk temperature of supercritical CO2 increases under various working conditions. The gravity magnitude was varied from zero gravity (0 g) to ten times normal gravity (10 g), to create a series of micro-gravity and hyper-gravity conditions. As seen in Figure 4a, under a normal gravity condition (1 g), the HTC increases with increasing bulk temperature and reaches a peak value before the pseudo-critical temperature (PCT) is reached. Subsequently, the HTC decreases rapidly as the bulk temperature further increases. This is the so called heat transfer enhancement of supercritical CO2, which has been proved in most open literature to be caused by the sharp variation of thermal properties near the pseudo-critical temperature, especially the specific heat [6,9,13,16]. The interesting point here is that the HTC clearly increases with increasing gravity magnitude. This phenomenon exists in a wide bulk temperature region from 292 K to approximately 330 K, including the PCT. When the bulk temperature is higher than 330 K (where the thermal properties vary slightly), no obvious differences in HTC are found at different gravity magnitudes, indicating that gravity has much less effect on the heat transfer performance in the high bulk temperature region. A similar HTE phenomena is also observed in Figure 4b, where the working condition is totally different from that of Figure 4a, suggesting that the special HTE phenomena caused by gravity variation is not a special case that only appears under a particular condition. Based on the phenomena discussed above, it can be concluded that the gravity effect on the heat transfer of supercritical CO2 is more pronounced in the middle and low bulk temperature regions where the density and specific heat vary significantly with changes in fluid temperature. In another words, the effect of gravity is closely related to variations in the thermal properties.
In Figure 4a, when the gravity magnitude is 0.5 g, it can be seen that the HTC decreases quickly first with the increase in bulk temperature and then slowly increases until the PCT is almost reached. Subsequently, the HTC decreases quickly again and then remains nearly constant as the bulk temperature further increases. As the gravity magnitudes decrease to 0.2 g and 0.1 g, an obvious HTD phenomenon appears in the low bulk temperature region. The HTC sharply decreases to a very low value and then increases slightly. When the PCT is passed, the HTC has a quick but slight increment and then also remains nearly constant as the bulk temperature increases, which is similar to the condition of 0.5 g.
In Figure 4b, although the HTD is not observed when the gravity magnitude is 0.5 g, it still appears under the conditions that the gravity magnitudes are 0.2 g and 0.1 g. All of these phenomena indicate that the micro-gravity condition has a negative effect on the heat transfer of supercritical CO2 flowing upward within a round tube.
As the gravity magnitude decreases to zero, the variation rule of HTC does not follow the same tendency as that when the gravity magnitude is from 0.5 g to 0.1 g. Under the working condition shown in Figure 4a, the HTC decreases first and then increases to reach an obvious peak near the PCT. Subsequently, it decreases gradually and remains almost constant when the bulk temperature is high. The value of HTC under the zero gravity condition is much higher than those under the 0.2 g and 0.1 g conditions. In Figure 4b, the obvious peak of HTC is not found when the gravity magnitude is zero. However, the value of HTC at the zero gravity condition is much higher than those at the 0.2 g and 0.1 g conditions.
To analyze the corresponding mechanism of special heat transfer performance caused by gravity variation, the radial distributions of several thermal parameters on the cross section of Tb = 305 K, which was randomly selected from the liquid-like region shown in Figure 4b, are shown in Figure 5a–e. These parameters include the temperature, velocity, density, thermal conductivity, turbulent kinetic energy and specific heat.
3.1.2. Radial Distribution of Thermal Properties for Upward Flow
Figure 5a shows the variation of temperature plotted against the dimensionless radius, R/R0, under various gravity conditions. Here, R represents the radial location and R0 represents the radius of the tube. It can be seen that for all gravity conditions, the temperature decreases continually in the radial direction. However, the greatest decrement of temperature appears in the region very close to the tube wall (approximately R/R0 < 0.05), indicating that the most thermal resistance exists in the region of R/R0 < 0.05. Beyond this region, the temperature almost remains constant and very little temperature decrement can be observed. The gravity condition has a great effect on the temperature distribution, not only in the region very close to the wall but also in the turbulent core region. As the gravity magnitude increases, the temperature decreases in the near wall region and increases in the turbulent core region. This means that the temperature gradient in the radial direction is greatly increased as the gravity magnitude decreases.
Figure 5b shows the variation of velocity plotted against the dimensionless radius. It can be seen that the fluid very close to the wall accelerates as the gravity magnitude increases from 0.2 to 10 g and forms a series of M-shaped velocity distributions on the cross section (with an inverted form to the other wall). The higher the gravity magnitude is, the higher and sharper the shoulder of the M-shape is, suggesting an enhanced buoyancy effect near the wall with the increment of gravity magnitude. The M-shaped velocity distribution is a classic distribution induced by strong buoyancy at a relatively low mass flux [12]. When the gravity magnitude decreases to 0.1 g, the variation rule of velocity changes because the cross section of Tb = 305 K is just the cross section at which the lowest HTC (highest wall temperature) appears (refer to Figure 4b) under the 0.1 g condition. A stronger thermal acceleration effect induces higher axial velocity in the near wall region in comparison with the 0.2 and 0.5 g cases. As the gravity magnitude further decreases to zero, the buoyancy effect disappears, as well as the M-shaped distribution of velocity and the flow within the vertical tube is now more like the flow within a small horizontal tube.
Figure 6a shows the density distribution plotted against the dimensionless radius for various gravity conditions. It can be seen that in the near wall region, the fluid density increases with increasing gravity magnitude. A similar phenomenon is found in Figure 6b, which shows the radial variations of thermal conductivity at various gravity magnitudes. This means that higher density and higher thermal conductivity occupy the region very close to the tube wall, where molecular diffusion might dominate heat transfer as the gravity magnitude increases gradually.
When the tube wall is heated, the fluid very close to the tube wall absorbs heat from the wall first, inducing a lower density and larger specific volume. Hence, the fluid accelerates in the near wall region and forms the shoulder of the M-shape. Meanwhile, the fluid temperature in the turbulent core region remains almost constant (refer to Figure 5a), inducing a very small density variation (refer to Figure 6a). The buoyancy can hardly affect the fluid in the turbulent core region and a flattened velocity distribution is created. Thus, the M-shaped velocity distribution is formed. In most open literature that concerns the HTD mechanism of supercritical fluid, this type of M-shaped distribution of velocity is usually considered as a symbol of the HTD phenomenon of supercritical fluid, just like that of the 0.1 g case shown in Figure 5b. However, in the present study, the increment of gravity magnitude increases the buoyancy effect and even a high-density fluid can be effectively accelerated in the near wall region due to the density reduction. This is the main reason that the higher and sharper shoulder at higher gravity magnitude exists. However, in the turbulent core region, the buoyancy hardly affects the fluid with very little density variation. A greater gravity magnitude more effectively decelerates the fluid and creates lower velocity in the turbulent core region. The flattened velocity distribution (similar to that of the 0.1 g case) does not exist for higher gravity conditions.
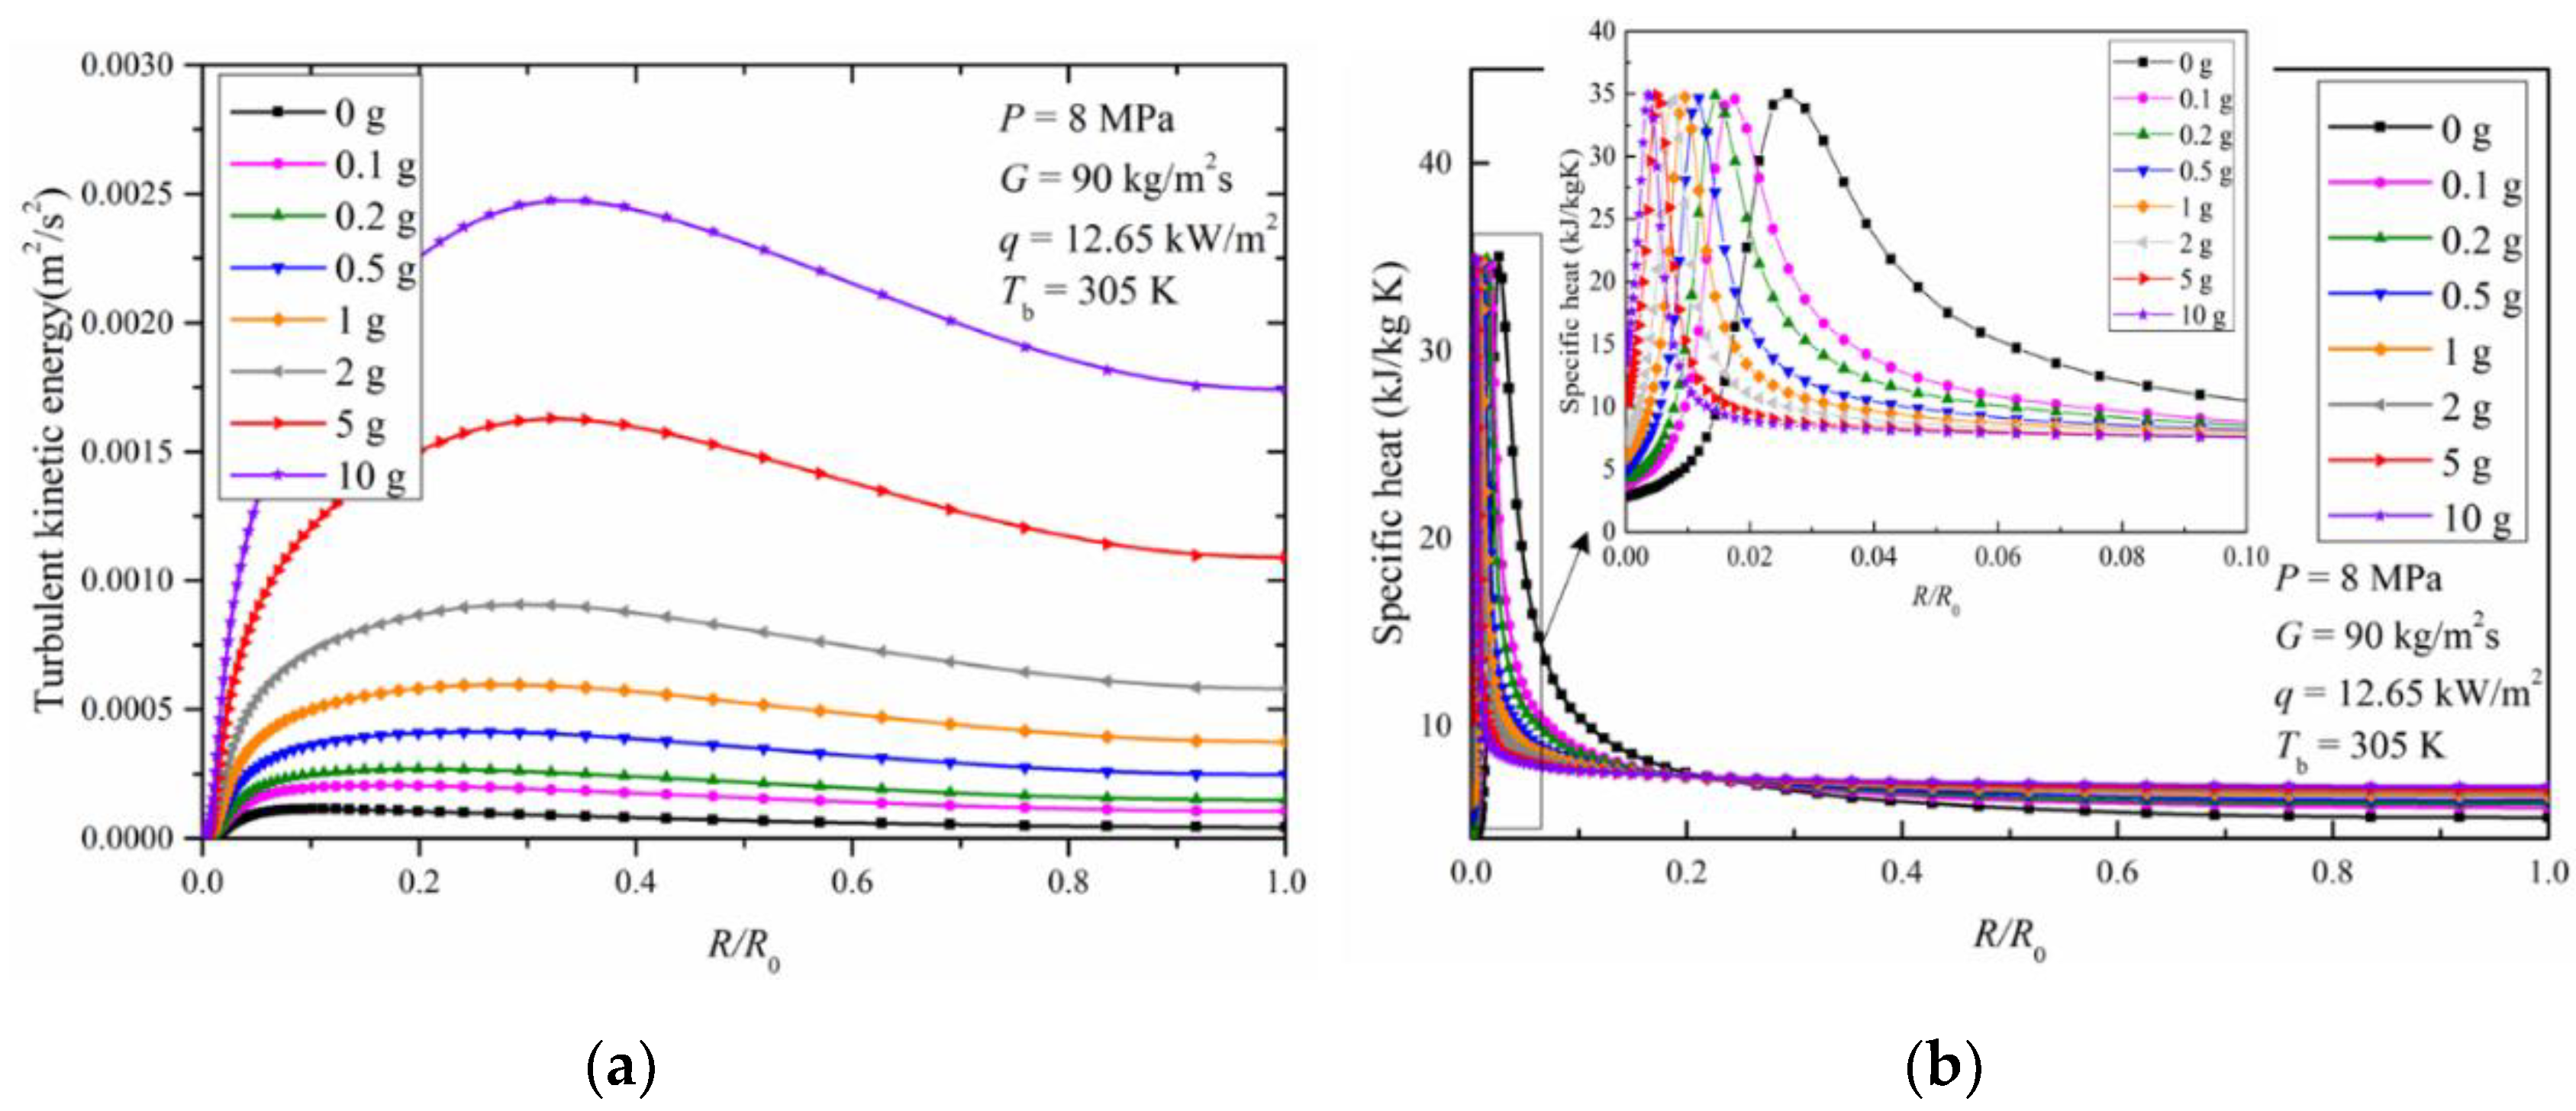
Figure 7a shows the radial distribution of turbulent kinetic energy for various gravity conditions. It can be seen that the turbulent kinetic energy increases first in the radial direction and then decreases after a peak value is reached. As the gravity magnitude increases, the turbulent kinetic energy increases, except for the case with zero gravity. The variation trend of turbulent kinetic energy corresponds with the radial distribution of velocity shown in Figure 5b. That is, greater gravity magnitude induces a greater velocity gradient in the radial direction and thus enhances the turbulent convective heat transfer from the tube wall to the turbulent core region. The boundary layer is a special region where the main thermal resistance exists. The region of 0 < y+ < 5 is usually called the laminar sub-layer in which the heat transfer is dominated by molecular diffusion. The region of y+ > 50 is usually called the log-law layer, in which the heat transfer is dominated by turbulent vortex diffusion. The region between the laminar sub-layer and the log-law layer (5 < y+ < 50) is called the buffer layer, in which the heat transfer is dominated by the combined action of molecular and turbulent vortex diffusion. Figure 8 shows the radial distribution of turbulent kinetic energy plotted against the near wall y+. It can be seen that, in the laminar sub-layer (y+ < 5), the effect of gravity magnitude on the turbulent kinetic energy is very weak and no obvious differences can be found. However, in the buffer layer and the log-law layer (y+ > 50), the turbulent kinetic energy of the fluid is greatly increased with increasing gravity magnitude. Because the turbulent kinetic energy increases with the increment of gravity magnitude, the turbulent diffusion and heat transfer are enhanced in the buffer and log-law layers.
Figure 7b shows the radial distribution of specific heat for various gravity conditions. The peak of specific heat is observed for each gravity condition and the peak gradually moves away from the tube wall as the gravity magnitude decreases, indicating that the fluid temperature very close to the tube wall exceeds the PCT (also refer to Figure 5a). It can be clearly seen that the specific heat increases as the gravity magnitude increases in the region very close to the tube wall. The average specific heat in the laminar sub-layer (y+ < 5, refer to the sub-figure of Figure 7b) under the 10 g condition is over ten times that under the 0.1 g condition, which means the hyper-gravity condition greatly enhances the heat absorption capacity of fluid in the laminar sub-layer in this case.
3.1.3. Heat Transfer Mechanism Analysis for Upward Flow
From the variation rules of thermal properties mentioned above, we can summarize the mechanism of gravity effect on the upward flow as follows. On one hand, increasing gravity magnitude enhances the buoyancy effect and accelerates the fluid in the near wall region (refer to Figure 5b). The turbulent eddy diffusion in the boundary layer is enhanced owing to the greatly increased turbulent kinetic energy (refer to Figure 7a and Figure 8). This means that the heat transfer dominated by the turbulent eddy diffusion in the buffer layer (5 < y+ < 50) and the log-law layer (50 < y+ < 500) is thus enhanced. On the other hand, the laminar sub-layer is occupied by fluid with higher density and higher thermal conductivity as the gravity magnitude increases (refer to Figure 6a,b), which is good for heat transfer dominated by molecular diffusion. In other words, the increment of gravity magnitude benefits the heat transfer in the boundary layer and evidently promotes the efficiency of heat transfer from the tube wall to the bulk fluid. Fang et al. [30] conducted an experimental study to explore how hyper-gravity can affect the boiling heat transfer of R134a in a 4.07 mm tube. They also found that the boiling heat transfer under hyper-gravity was greater than that under normal gravity and it was attributed in part to the decrement of temperature difference between the tube wall and fluid. In our case, the temperature difference between the tube wall and bulk fluid indeed decreases with increasing gravity magnitude, as seen in Figure 5a and this phenomenon not only appears at hyper-gravity but also appears at micro-gravity (except for the condition of zero gravity).
3.2. Effect of Gravity on Downward Flow
3.2.1. Variations of HTC
Figure 9 shows the variations of HTC plotted against the bulk temperature of supercritical CO2 at various gravity magnitudes to illustrate the effect of gravity condition on the heat transfer of downward flow. The working condition shown in Figure 9a is the same as that in Figure 4a except for the flow direction. As seen in Figure 9a, the HTC is obviously increased with the increment of gravity magnitude at hyper-gravity. When the gravity magnitude increases from 1 to 10 g, the HTC peak is increased by approximately 90%. Similar to the upward flow, the differences in HTC among different gravity conditions within the low bulk temperature region and middle bulk temperature region (less than 330 K) are much greater than those within the high bulk temperature region (greater than 330 K).
The HTD phenomenon observed in Figure 4a,b no longer exists at the micro-gravity conditions of 0.1 and 0.2 g, suggesting that a much better heat transfer performance can be achieved under a micro-gravity condition for downward flow than that for upward flow. Similar results were also reported by Jiang et al. [9] and they conducted both experimental and numerical investigations to prove that the heat transfer performance of supercritical CO2 flowing downward was better than that flowing upward. It is interesting to note that the HTC at zero gravity is lower than those at 0.1 and 0.2 g, which is totally different from the variation rules for upward flow. This means that buoyancy (even very slight buoyancy) can promote the heat transfer performance of supercritical CO2 flowing downward.
Figure 9b shows variations of HTC plotted against the bulk temperature of supercritical CO2 at various gravity magnitudes when the mass flux was 400 kg/m2s, which is counted as a higher mass flux case in comparison with that shown in Figure 9a. It can be seen that, although the HTC increases with the increment of gravity magnitude under micro-gravity conditions, the differences in HTC among the gravity magnitudes ranging from 0.0 to 0.5 g are very small in comparison with the low mass flux case shown in Figure 9a. This indicates that the effect of gravity on the heat transfer of supercritical CO2 is more pronounced for the low mass flux condition.
3.2.2. Radial Distribution of Thermal Properties for Downward Flow
Figure 10 shows the radial distributions of temperature and velocity on the cross section of Tb = 305 K under the same working condition as that of Figure 9a. In Figure 10a, it can be seen that in the region near the tube wall, R/R0 < 0.2 approximately, the fluid temperature decreases with increasing gravity magnitude, whereas in the region of R/R0 > 0.2, the fluid temperature increases with increasing gravity magnitude. This variation trend is the same as that of the upward flow case. The radial temperature gradient is decreased as the gravity magnitude increases.
As seen in Figure 10b, the radial distribution of velocity is no longer M-shaped for the downward flow, which accords with the results of most of the open literature that concerns the downward flow. The velocity increases sharply in the region close to the tube wall and continues to increase mildly in the radial direction when the value of R/R0 is high. An interesting phenomenon caused by the variations of gravity magnitude is found here. In the region where R/R0 is less than approximately 0.3, the fluid decelerates with the increment of gravity magnitude; beyond this region, the fluid accelerates with the increment of gravity magnitude.
A clear diagram is presented in Figure 11 to highlight the variation rule of velocity with gravity conditions. It is apparent that higher gravity causes a greater buoyancy effect. Because the direction of buoyancy is vertically upward, it decelerates the fluid flowing downward in the near wall region of which the fluid density varies very sharply (refer to Figure 12a). In the turbulent core region, the fluid density varies very slightly and the fluid is accelerated by the higher gravity condition. Based on these facts, it can be seen that the velocity distribution in the radial direction under a higher gravity condition is more parabolic, rather than flattened as in lower or zero gravity conditions. The parabolic velocity distribution induces a larger velocity gradient in the turbulent core region and enhances the radial turbulence. Although the distribution model of downward flow is quite different from that of upward flow, the radial velocity differences between the near wall region and the turbulent core region of both downward flow and upward flow are increased with increasing gravity magnitude.
Figure 12 shows the radial distributions of density and thermal conductivity on the cross section of Tb = 305 K, respectively, for the downward flow. Compared to Figure 6, which shows the same properties for upward flow, no obvious qualitative differences are found in Figure 12. The high-density and high-thermal-conductivity fluid occupies the region near the wall as the gravity magnitude increases and definitely enhances the heat transfer dominated by the molecular diffusion in the boundary layer.
Figure 13 shows the radial distributions of turbulent kinetic energy and specific heat on the cross section of Tb = 305 K, respectively, for the downward flow. Although the radial velocity distribution for downward flow is different from that of upward flow, the variation trends of turbulent kinetic energy appear similar. The turbulent kinetic energy increases with increasing gravity magnitude, as seen in Figure 13a, suggesting that an enhancement of turbulent convective heat transfer is induced. As for Figure 13b, the distribution trend of specific heat is also similar to the one shown in Figure 7b for upward flow.
3.2.3. Heat Transfer Mechanism Analysis for Downward Flow
Based on the simulation results presented in Figure 10, Figure 11, Figure 12 and Figure 13, it can be concluded that the flow direction does not qualitatively affect the radial distributions of thermo-physical properties, including the density, thermal conductivity and specific heat. However, the radial distribution of velocity is totally changed. Higher gravity magnitude induces a greater buoyancy effect and creates a parabolic velocity distribution for downward flow. The flattened velocity distribution in the turbulent core at low or zero gravity disappears and the turbulent kinetic energy is greatly increased. Like the upward flow case, this benefits the turbulent convective heat transfer and improves the heat transfer efficiency from the tube wall to turbulent core.
4. Conclusions
Numerical simulations are conducted in this study to evaluate the effects of gravity on the heat transfer of supercritical CO2 flowing in a vertical round tube. The novelty is to thoroughly investigate the effects of gravity condition on heat transfer for a vertical flow of supercritical CO2 and acquire both qualitative and quantitative information of heat transfer performance at various working conditions. The findings have led us to draw the following conclusions:
- A modified SST k-ω model is recommended as a turbulence model for the prediction of heat transfer of supercritical CO2 flowing in a vertical tube. Comparison results show that the modified turbulence model is more suitable for the prediction of HTD of supercritical fluid induced by buoyancy effect.
- For both the upward and downward flows, the heat transfer of supercritical CO2 is enhanced with increased gravity magnitude. The effect of gravity on heat transfer is closely related to the variations of thermal properties and it is more pronounced under a low mass flux condition than a high mass flux condition.
- For the upward flow, increased gravity magnitude enhances the effect of buoyancy within the tube. The fluid in the near wall region accelerates and the fluid in the turbulent core decelerates. A classic M-shaped radial velocity distribution is thus created. The radial velocity difference between the near wall region and the turbulent core region is increased and the turbulent kinetic energy is greatly increased. This benefits the heat transfer dominated by turbulent eddy diffusion. Meanwhile, high density and high thermal conductivity fluid occupies the near wall region and enhances the heat transfer dominated by molecular diffusion.
- For the downward flow, the fluid in the near wall region decelerates and the fluid in the turbulent core region accelerates with increasing gravity magnitude. A parabolic radial velocity distribution is created and this is the main qualitative difference between the upward flow and downward flow as the gravity magnitude increases. The flattened velocity distribution in the turbulent core at low or zero gravity disappears and the turbulent kinetic energy is greatly increased. Similar to the upward flow case, this benefits the turbulent convective heat transfer and improves the heat transfer efficiency from the tube wall to the turbulent core.
All of the above results are included in the first phase of our project on exploring the heat transfer performance of supercritical CO2 under normal and abnormal gravity conditions. The results might provide some instructive advice to improve the design and operation safety of a heat exchanger at various gravity conditions. In future work, the range of parameters considered in the present study should be widened to evaluate the effects of system parameters under abnormal gravity conditions more fully, such as the onset of HTD under hyper-gravity conditions.
Author Contributions
Conceptualization, X.Z.; methodology, X.Z. and R.Z.; formal analysis, R.Z. and X.Y.; writing—Original draft preparation, X.Z.; writing—review and editing, X.Z., X.Y., M.C. and Y.R.; project administration, M.C. and Y.R. All authors have read and agreed to the published version of the manuscript.
Funding
This research was funded by the National Natural Science Foundation of China [No. 51876024 and 51976204] and the Science and Technology on Reactor System Design Technology Laboratory.
Conflicts of Interest
The authors declare no conflict of interest.
Nomenclature
| Bo* | buoyancy parameter, expressed as: |
| cp | specific heat (J/kgK) |
| D, d | diameter (mm) |
| g | gravitational acceleration (m/s2) |
| G | mass flux (kg/m2s) |
| Gk and Gω | generation of k and ω due to the mean velocity gradients |
| Gr | Grash of number, expressed as: |
| h | local heat transfer coefficient (W/m2K) |
| h0 | reference heat transfer coefficient (W/m2K) |
| k | turbulent kinetic energy (m2/s2) |
| Nu | Nusselt number |
| P | pressure (MPa) |
| Pr | Prandtl number |
| q | heat flux (W/m2) |
| Re | Reynolds number |
| T | temperature (K) |
| x | distance (mm) |
| y+ | non-dimensional wall distance |
| Yk and Yω | dissipation of k and ω due to the turbulence |
| Greek symbols | |
| α1 and α2 | correction factor |
| α* | damping coefficient |
| ω | turbulent frequency |
| β | thermal expansion coefficient (1/K) |
| λ | thermal conductivity (W/m K) |
| μ | molecular viscosity (kg/ms) |
| μt | turbulent viscosity (kg/ms) |
| v | kinematic viscosity (m2/s) |
| ρ | density (kg/m3) |
| Γk and Γω | the effective diffusivity of k and ω |
| Subscripts | |
| b | evaluated at bulk |
| C | critical point |
| in | inlet |
| pc | pseudo-critical |
| w | evaluated at wall |
| Abbreviation | |
| HTC | heat transfer coefficient |
| HTE | heat transfer enhancement |
| HTD | heat transfer deterioration |
| PCHE | printed circuit heat exchanger |
| SCO2 | supercritical carbon dioxide |
References
- Chen, M.; Sun, X.; Christensen, R.N.; Shi, S.; Skavdahl, I.; Utgikar, V.; Sabharwall, P. Experimental and numerical study of a printed circuit heat exchanger. Ann. Nucl. Energy 2016, 97, 221–231. [Google Scholar] [CrossRef] [Green Version]
- Khmelinskii, I.; Woodcock, L.V. Supercritical Fluid Gaseous and Liquid States: A Review of Experimental Results. Entropy 2020, 22, 437. [Google Scholar] [CrossRef] [Green Version]
- Gkountas, A.A.; Stamatelos, A.; Kalfas, A. Recuperators investigation for high temperature supercritical carbon dioxide power generation cycles. Appl. Therm. Eng. 2017, 125, 1094–1102. [Google Scholar] [CrossRef]
- Jacob, F.; Rolt, A.M.; Sebastiampillai, J.; Sethi, V.; Belmonte, M.; Cobas, P. Performance of a Supercritical CO2 Bottoming Cycle for Aero Applications. Appl. Sci. 2017, 7, 255. [Google Scholar] [CrossRef] [Green Version]
- Zhou, Q.T. Effects of buoyancy on the heat transfer of supercritical water in vertical tube. J. Eng. Thermophys. 1983, 4, 165–172. (In Chinese) [Google Scholar]
- Jackson, J.D.; Hall, W.B.; Fewster, J.; Watson, A.; Watts, M.J. Heat Transfer to Supercritical Pressure Fluids; UKAEA, AERER 8158. Design Report 34; Intech: Rijeka, Croatia, 1975. [Google Scholar]
- Petukhov, B.S.; Polyakof, A.F.; Kuleshov, V.A.; Sheckter, Y.L. Turbulent Flow and Heat Transfer in Horizontal Tubes with Substantial Influence of Thermo-Gravitational Forces; International Heat Transfer Conference: Tokyo, Japan, 1974. [Google Scholar]
- Liao, S.; Zhao, T. An experimental investigation of convection heat transfer to supercritical carbon dioxide in miniature tubes. Int. J. Heat Mass Transf. 2002, 45, 5025–5034. [Google Scholar] [CrossRef]
- Jiang, P.-X.; Zhang, Y.; Xu, Y.-J.; Shi, R.-F. Experimental and numerical investigation of convection heat transfer of CO2 at supercritical pressures in a vertical tube at low Reynolds numbers. Int. J. Therm. Sci. 2008, 47, 998–1011. [Google Scholar] [CrossRef]
- Li, Z.; Jiang, P.; Zhao, C.-R.; Zhang, Y. Experimental investigation of convection heat transfer of CO2 at supercritical pressures in a vertical circular tube. Exp. Therm. Fluid Sci. 2010, 34, 1162–1171. [Google Scholar] [CrossRef]
- Xu, R.; Luo, F.; Jiang, P. Buoyancy effects on turbulent heat transfer of supercritical CO 2 in a vertical mini-tube based on continuous wall temperature measurements. Int. J. Heat Mass Transf. 2017, 110, 576–586. [Google Scholar] [CrossRef]
- Zhao, C.-R.; Liu, Q.; Zhang, Z.; Jiang, P.; Bo, H.-L. Investigation of buoyancy-enhanced heat transfer of supercritical CO2 in upward and downward tube flows. J. Supercrit. Fluids 2018, 138, 154–166. [Google Scholar] [CrossRef]
- Zhu, X.; Du, X.; Ding, Y.; Qiu, Q. Analysis of entropy generation behavior of supercritical water flow in a hexagon rod bundle. Int. J. Heat Mass Transf. 2017, 114, 20–30. [Google Scholar] [CrossRef]
- Qiu, Q.; Du, X.; Zhao, S.; Zhu, X.; Shen, S. Numerical study on heat transfer of SCW near the pseudo-critical temperature in a hexagon sub-channel. Nucl. Eng. Des. 2018, 331, 263–273. [Google Scholar] [CrossRef]
- Du, X.; Lv, Z.; Zhao, S.; Qiu, Q.; Zhu, X. Numerical analysis of diameter effects on convective supercritical water flow in a vertical round tube. Appl. Therm. Eng. 2019, 160, 114095. [Google Scholar] [CrossRef]
- Bazargan, M.; Mohseni, M. The significance of the buffer zone of boundary layer on convective heat transfer to a vertical turbulent flow of a supercritical fluid. J. Supercrit. Fluids 2009, 51, 221–229. [Google Scholar] [CrossRef]
- Hasan, N.; Farouk, B. Buoyancy driven convection in near-critical and supercritical fluids. Int. J. Heat Mass Transf. 2012, 55, 4207–4216. [Google Scholar] [CrossRef]
- Li, Z.; Tang, G.; Wu, Y.; Zhai, Y.; Xu, J.; Wang, H.; Lu, J. Improved gas heaters for supercritical CO2 Rankine cycles: Considerations on forced and mixed convection heat transfer enhancement. Appl. Energy 2016, 178, 126–141. [Google Scholar] [CrossRef]
- Bae, Y.-Y.; Kim, E.-S.; Kim, M. Numerical simulation of upward flowing supercritical fluids using buoyancy-influence-reflected turbulence model. Nucl. Eng. Des. 2017, 324, 231–249. [Google Scholar] [CrossRef]
- Tian, R.; Zhang, Y.; Ma, Y.; Li, H.; Shi, L. Experimental study of buoyancy effect and its criteria for heat transfer of supercritical R134a in horizontal tubes. Int. J. Heat Mass Transf. 2018, 127, 555–567. [Google Scholar] [CrossRef]
- Kim, T.H.; Kwon, J.G.; Kim, M.H.; Park, H.S. Experimental investigation on validity of buoyancy parameters to heat transfer of CO2 at supercritical pressures in a horizontal tube. Exp. Therm. Fluid Sci. 2018, 92, 222–230. [Google Scholar] [CrossRef]
- Zhang, S.; Xu, X.; Liu, C.; Liu, X.; Zhang, Y.; Dang, C. The heat transfer of supercritical CO2 in helically coiled tube: Trade-off between curvature and buoyancy effect. Energy 2019, 176, 765–777. [Google Scholar] [CrossRef]
- Kawanami, O.; Azuma, H.; Ohta, H. Effect of gravity on cryogenic boiling heat transfer during tube quenching. Int. J. Heat Mass Transf. 2007, 50, 3490–3497. [Google Scholar] [CrossRef]
- Xie, L.-Y.; Xie, Y.; Wu, H.; Yu, J. High gravity influence on boiling heat transfer in helical coils. Int. J. Heat Mass Transf. 2014, 73, 706–715. [Google Scholar] [CrossRef]
- Vlachou, M.C.; Lioumbas, J.S.; Kostoglou, M.; David, K.; Chasapis, D.; Schwarz, C.; Van Loon, J.J.W.A.; Karapantsios, T.D. Subcooled flow boiling in horizontal and vertical macro-channel under Earth-gravity and hyper-gravity conditions. Int. J. Heat Mass Transf. 2019, 133, 36–51. [Google Scholar] [CrossRef]
- Li, X.; Ma, T.; Liu, J.; Zhang, H.; Wang, Q. Pore-scale investigation of gravity effects on phase change heat transfer characteristics using lattice Boltzmann method. Appl. Energy 2018, 222, 92–103. [Google Scholar] [CrossRef]
- Lebon, M.; Hammer, C.F.; Kim, J. Gravity effects on subcooled flow boiling heat transfer. Int. J. Heat Mass Transf. 2019, 128, 700–714. [Google Scholar] [CrossRef]
- Yi, T.-H.; Lei, Z.; Zhao, J.F. Numerical investigation of bubble dynamics and heat transfer in subcooling pool boiling under low gravity. Int. J. Heat Mass Transf. 2019, 132, 1176–1186. [Google Scholar] [CrossRef] [Green Version]
- Fang, X.; Tang, D.; Zheng, L.; Li, G.; Yuan, Y. Experimental investigation of gravity and channel size effects on flow boiling heat transfer under hyper gravity. Aerosp. Sci. Technol. 2019, 94, 105372. [Google Scholar] [CrossRef]
- Fang, X.; Li, G.; Li, D.; Xu, Y. An experimental study of R134a flow boiling heat transfer in a 4.07 mm tube under Earth’s gravity and hyper gravity. Int. J. Heat Mass Transf. 2015, 87, 399–408. [Google Scholar] [CrossRef]
- ANSYS Inc. ANSYS Fluent Theory Guide Release 15.0; ANSYS: Pennsylvania, PA, USA, 2013. [Google Scholar]
- Du, X.; Lv, Z.; Yu, X.; Cao, M.; Zhou, J.; Ren, Y.; Qiu, Q.; Zhu, X. Heat transfer of supercritical CO2 in vertical round tube: A considerate turbulent Prandtl number modification. Energy 2020, 192, 116612. [Google Scholar] [CrossRef]
- Song, J.; Kim, H.; Kim, H.; Bae, Y. Heat transfer characteristics of a supercritical fluid flow in a vertical pipe. J. Supercrit. Fluids 2008, 44, 164–171. [Google Scholar] [CrossRef]
- Kline, N.; Feuerstein, F.; Tavoularis, S. Onset of heat transfer deterioration in vertical pipe flow of CO2 at supercritical pressure. Int. J. Heat Mass Transf. 2018, 118, 1056–1068. [Google Scholar] [CrossRef]
Figure 1.
Comparisons of simulation results of this study to the experimental data obtained by: (a) and (b) Song et al. [33] and (c,d) Kline et al. [34].
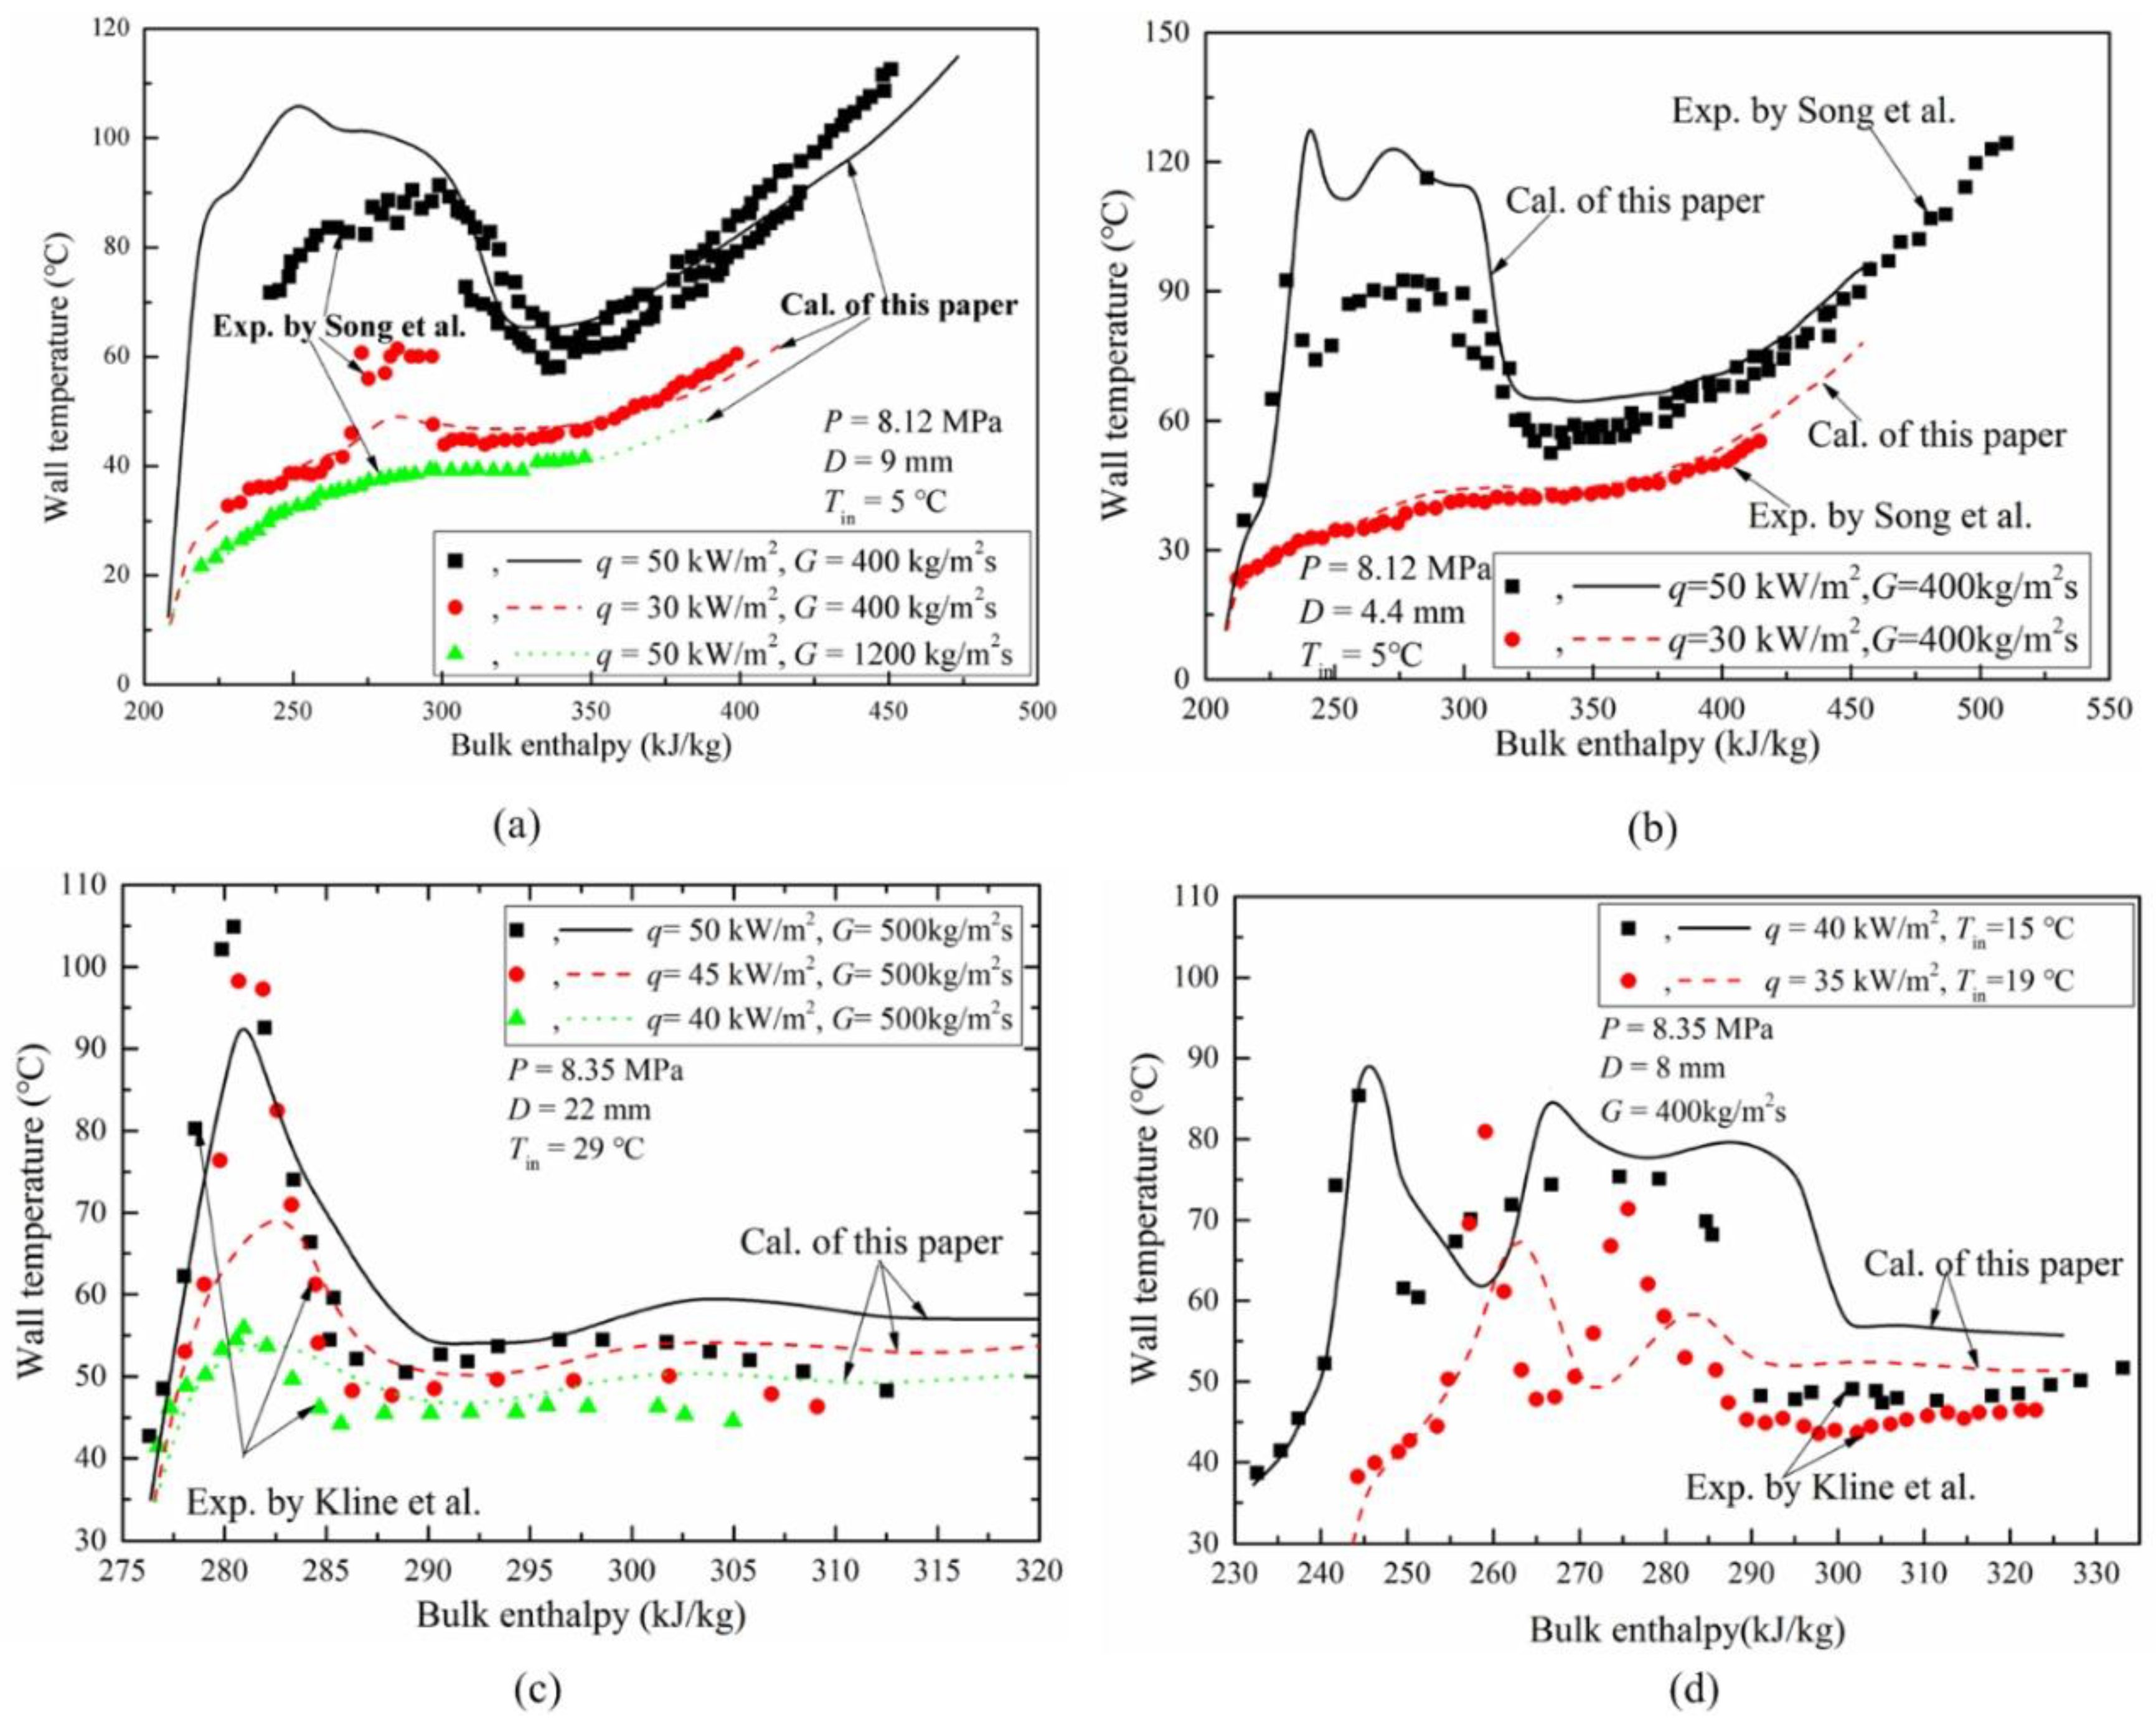
Figure 2.
Diagram of physical model studied in this paper.
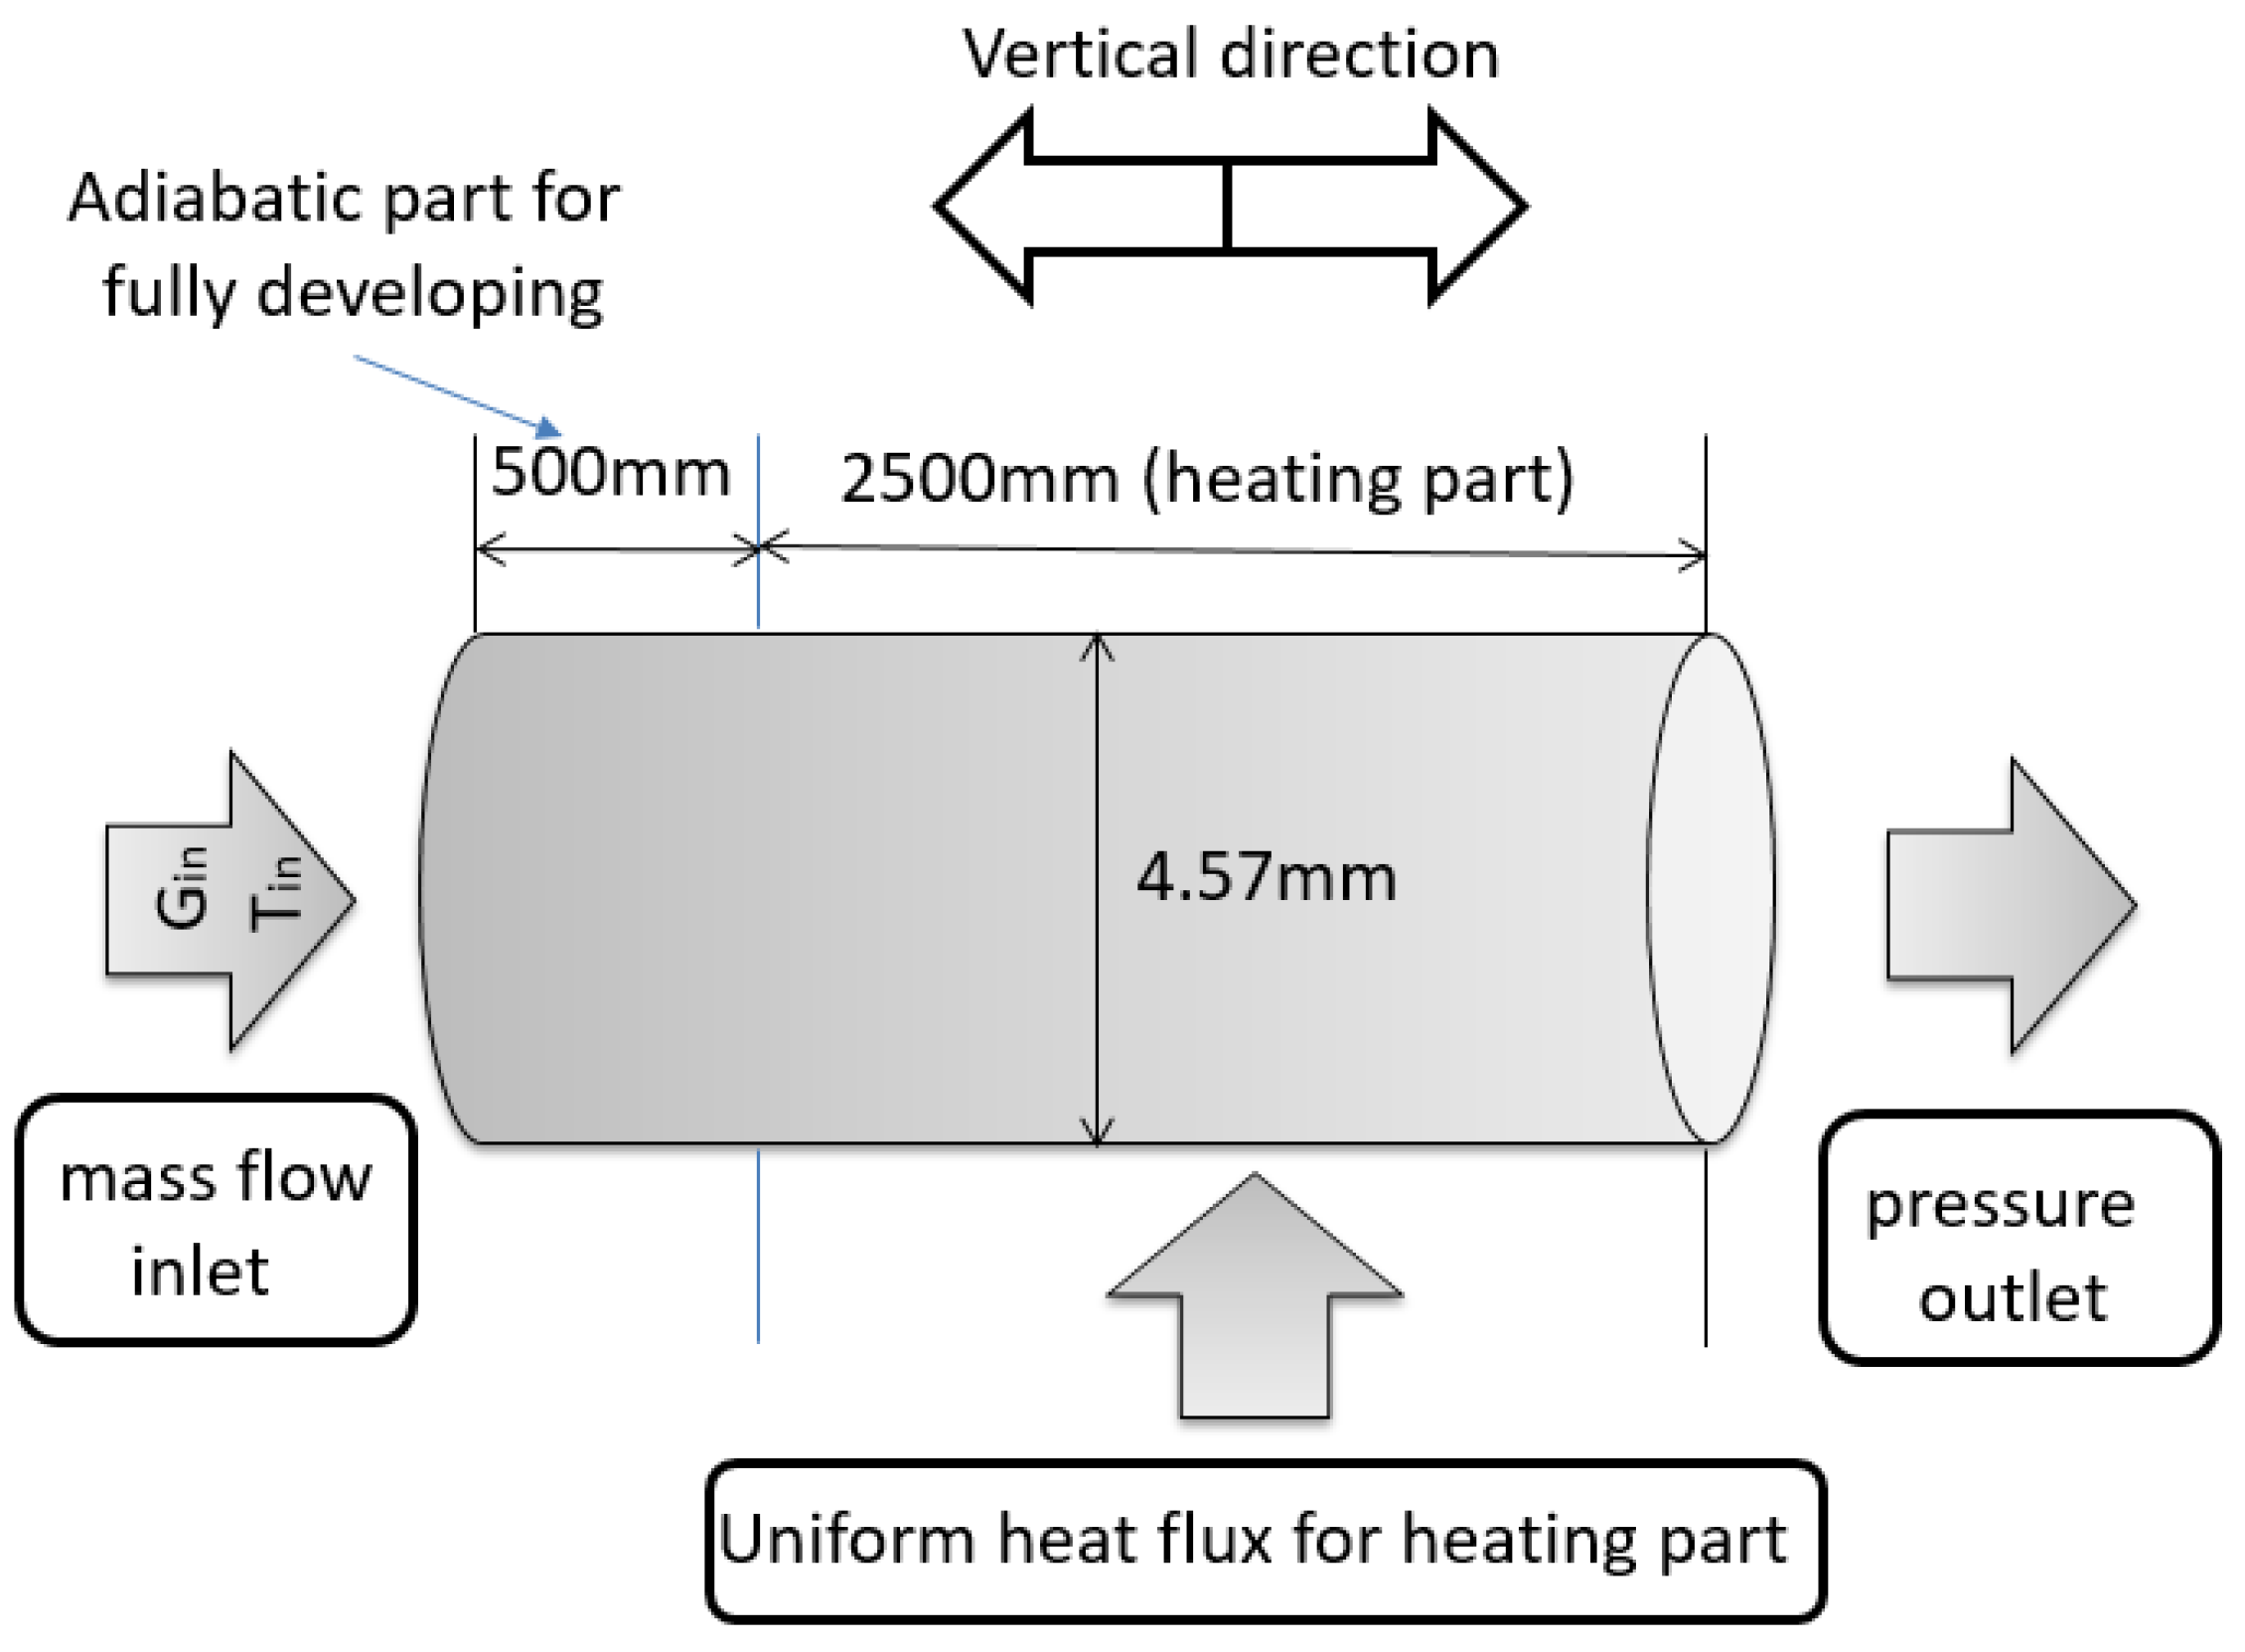
Figure 3.
Distributions of wall temperature versus bulk enthalpy calculated from five cases listed in Table 2.
Figure 3.
Distributions of wall temperature versus bulk enthalpy calculated from five cases listed in Table 2.
Figure 4.
Gravity effect on the variations of heat transfer coefficient plotted against the bulk temperature for upward flow, (a) P = 8 MPa, G = 90 kg/m2s, q = 12.65 kW/m2 and Tin = 292 K; and (b) P = 10.5 MPa, G = 100 kg/m2s, q = 25 kW/m2 and Tin = 289 K.
Figure 4.
Gravity effect on the variations of heat transfer coefficient plotted against the bulk temperature for upward flow, (a) P = 8 MPa, G = 90 kg/m2s, q = 12.65 kW/m2 and Tin = 292 K; and (b) P = 10.5 MPa, G = 100 kg/m2s, q = 25 kW/m2 and Tin = 289 K.

Figure 5.
Radial distributions of (a) temperature and (b) velocity at various gravity magnitudes for upward flow.
Figure 5.
Radial distributions of (a) temperature and (b) velocity at various gravity magnitudes for upward flow.
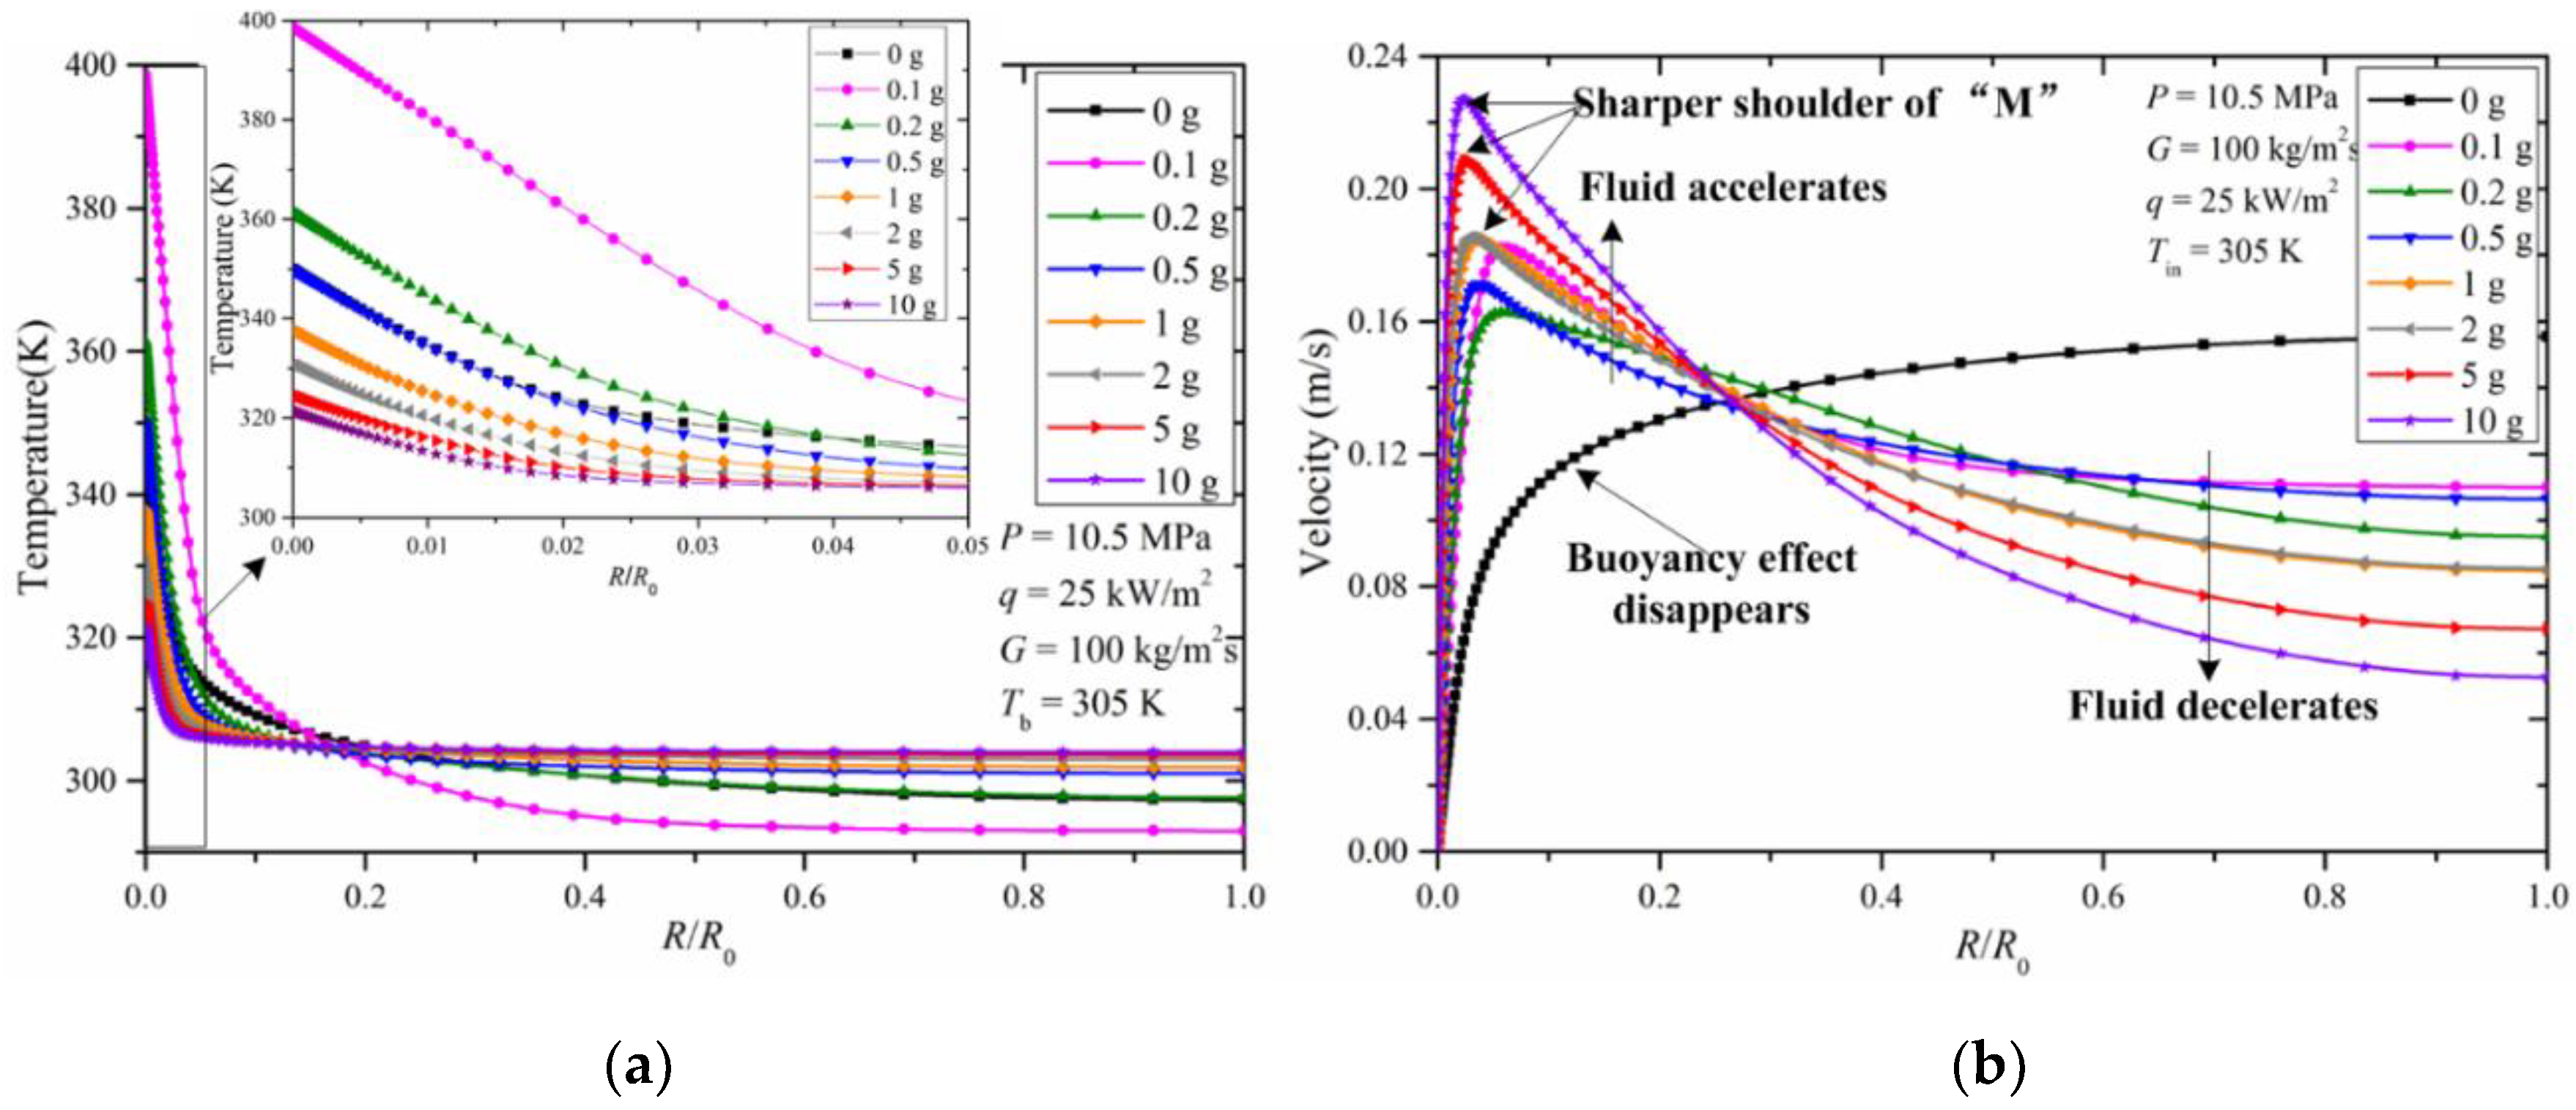
Figure 6.
Radial distributions of (a) density and (b) thermal conductivity at various gravity magnitudes for upward flow.
Figure 6.
Radial distributions of (a) density and (b) thermal conductivity at various gravity magnitudes for upward flow.
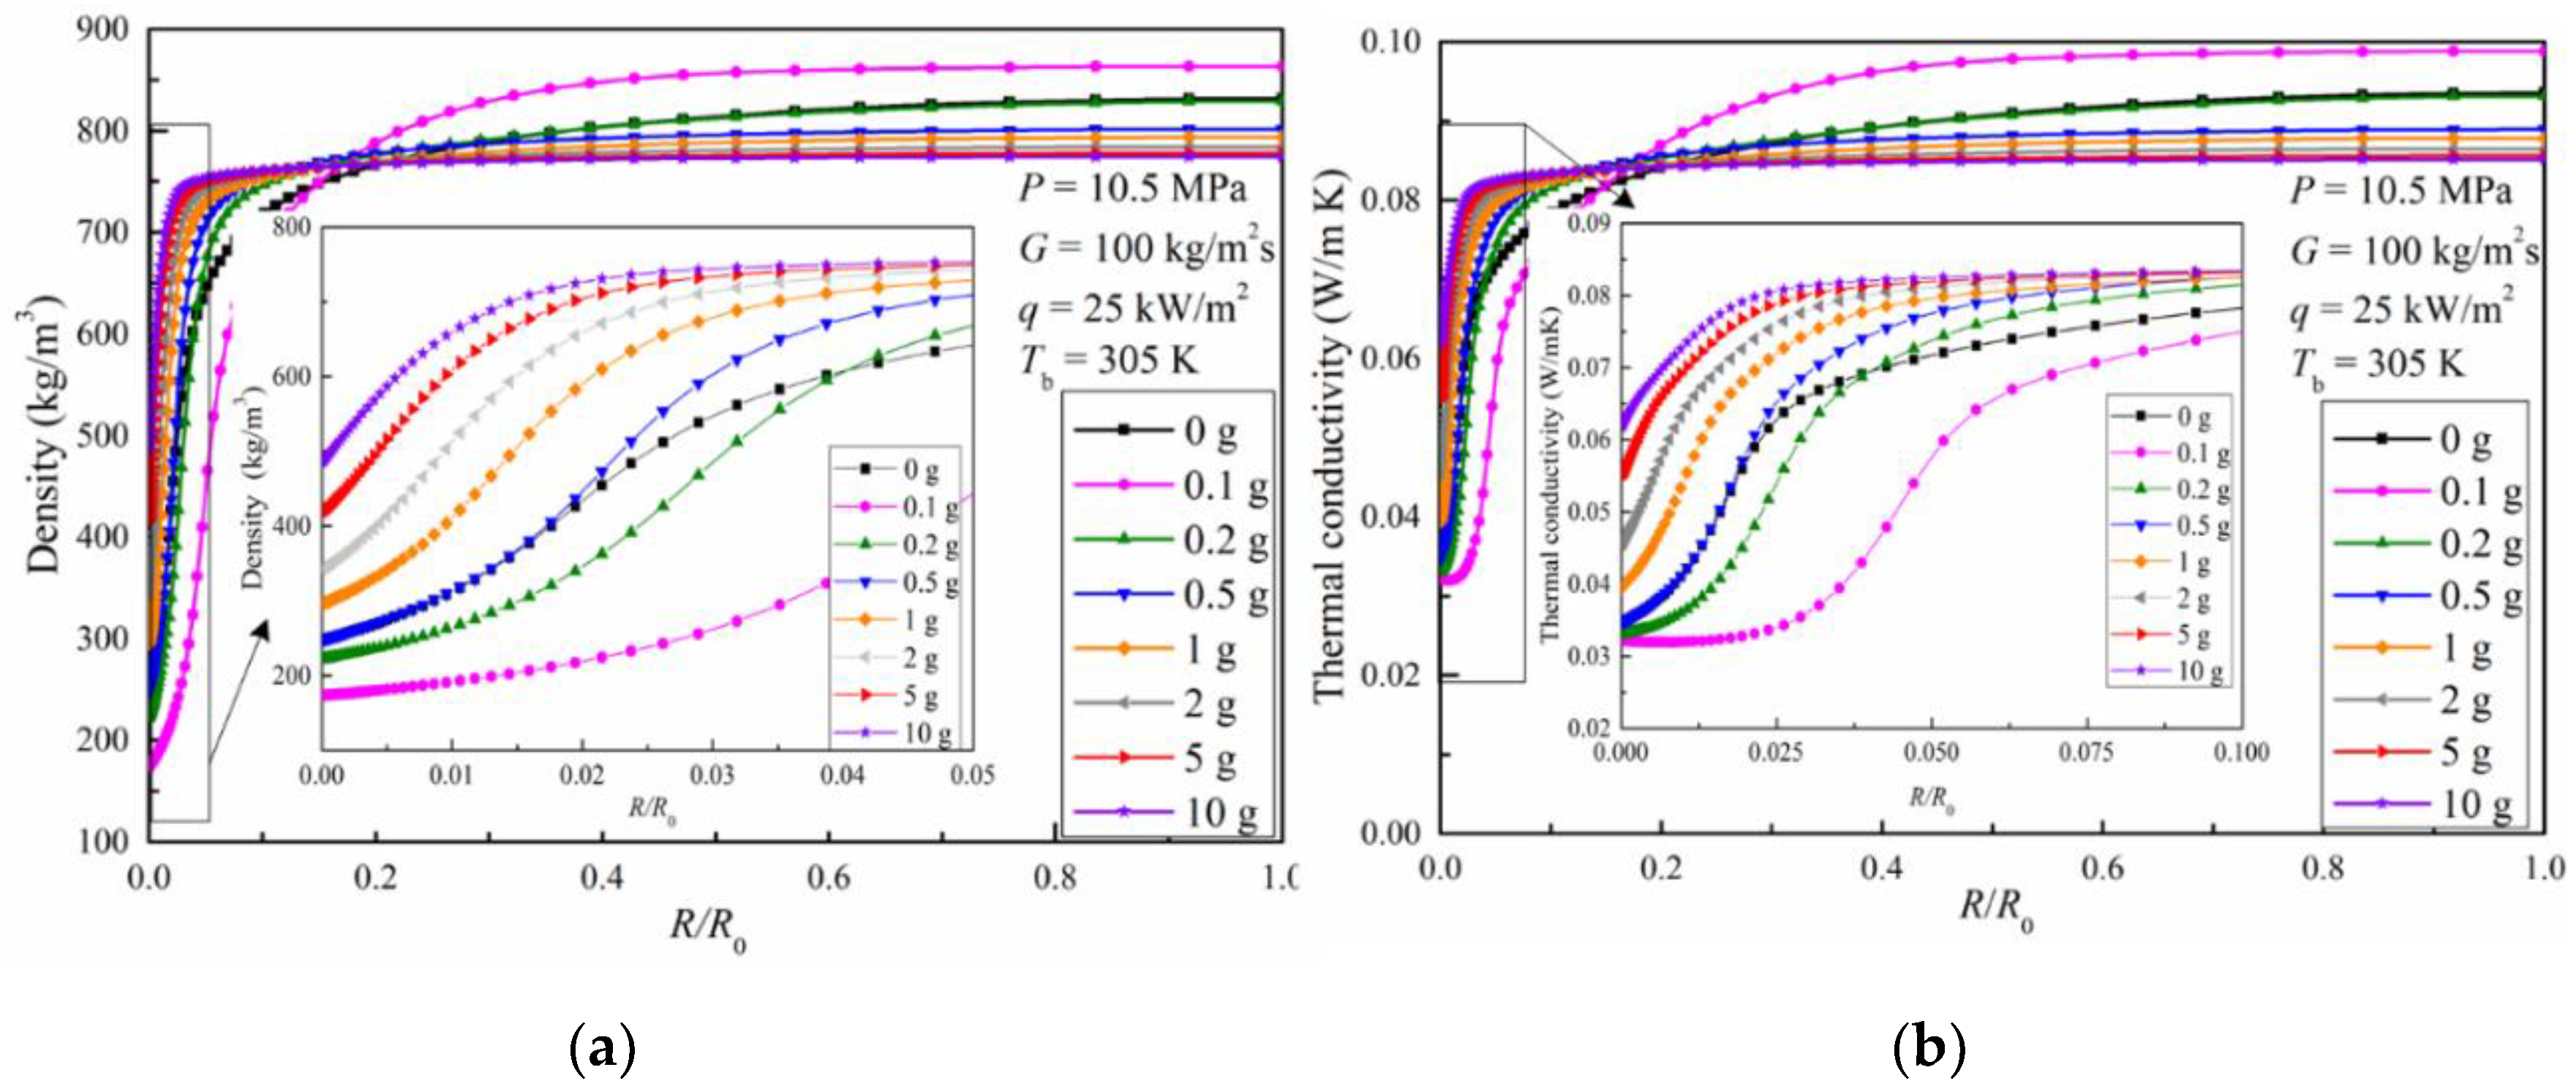
Figure 7.
Radial distributions of (a) turbulent kinetic energy and (b) specific heat at various gravity magnitudes for upward flow.
Figure 7.
Radial distributions of (a) turbulent kinetic energy and (b) specific heat at various gravity magnitudes for upward flow.
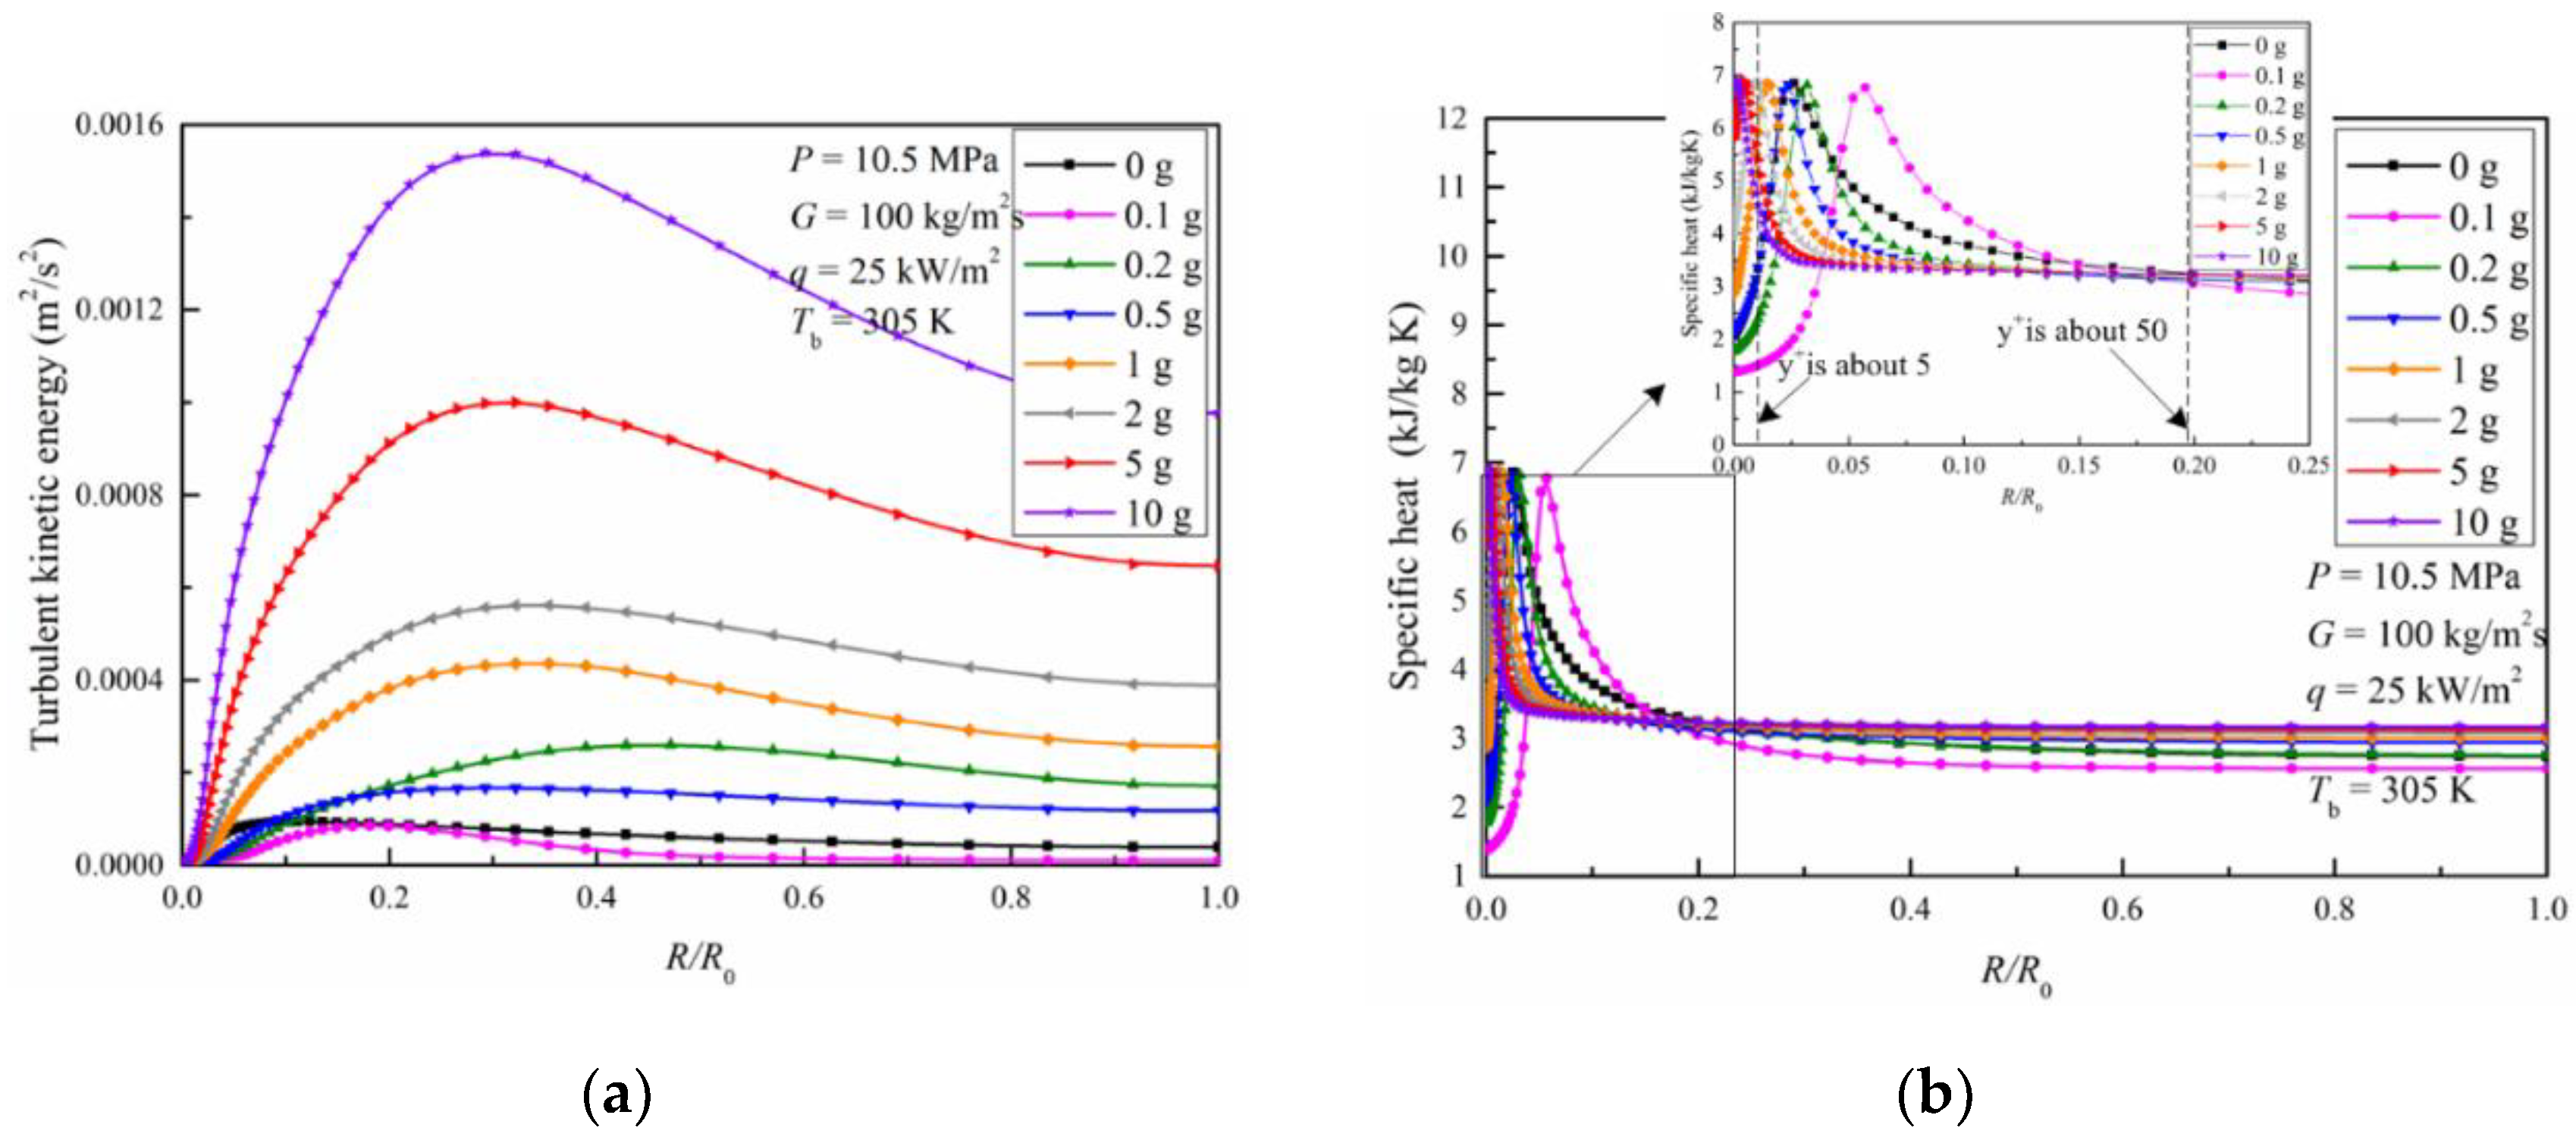
Figure 8.
Turbulent kinetic energy distribution in the boundary layer under various gravity conditions for upward flow.
Figure 8.
Turbulent kinetic energy distribution in the boundary layer under various gravity conditions for upward flow.
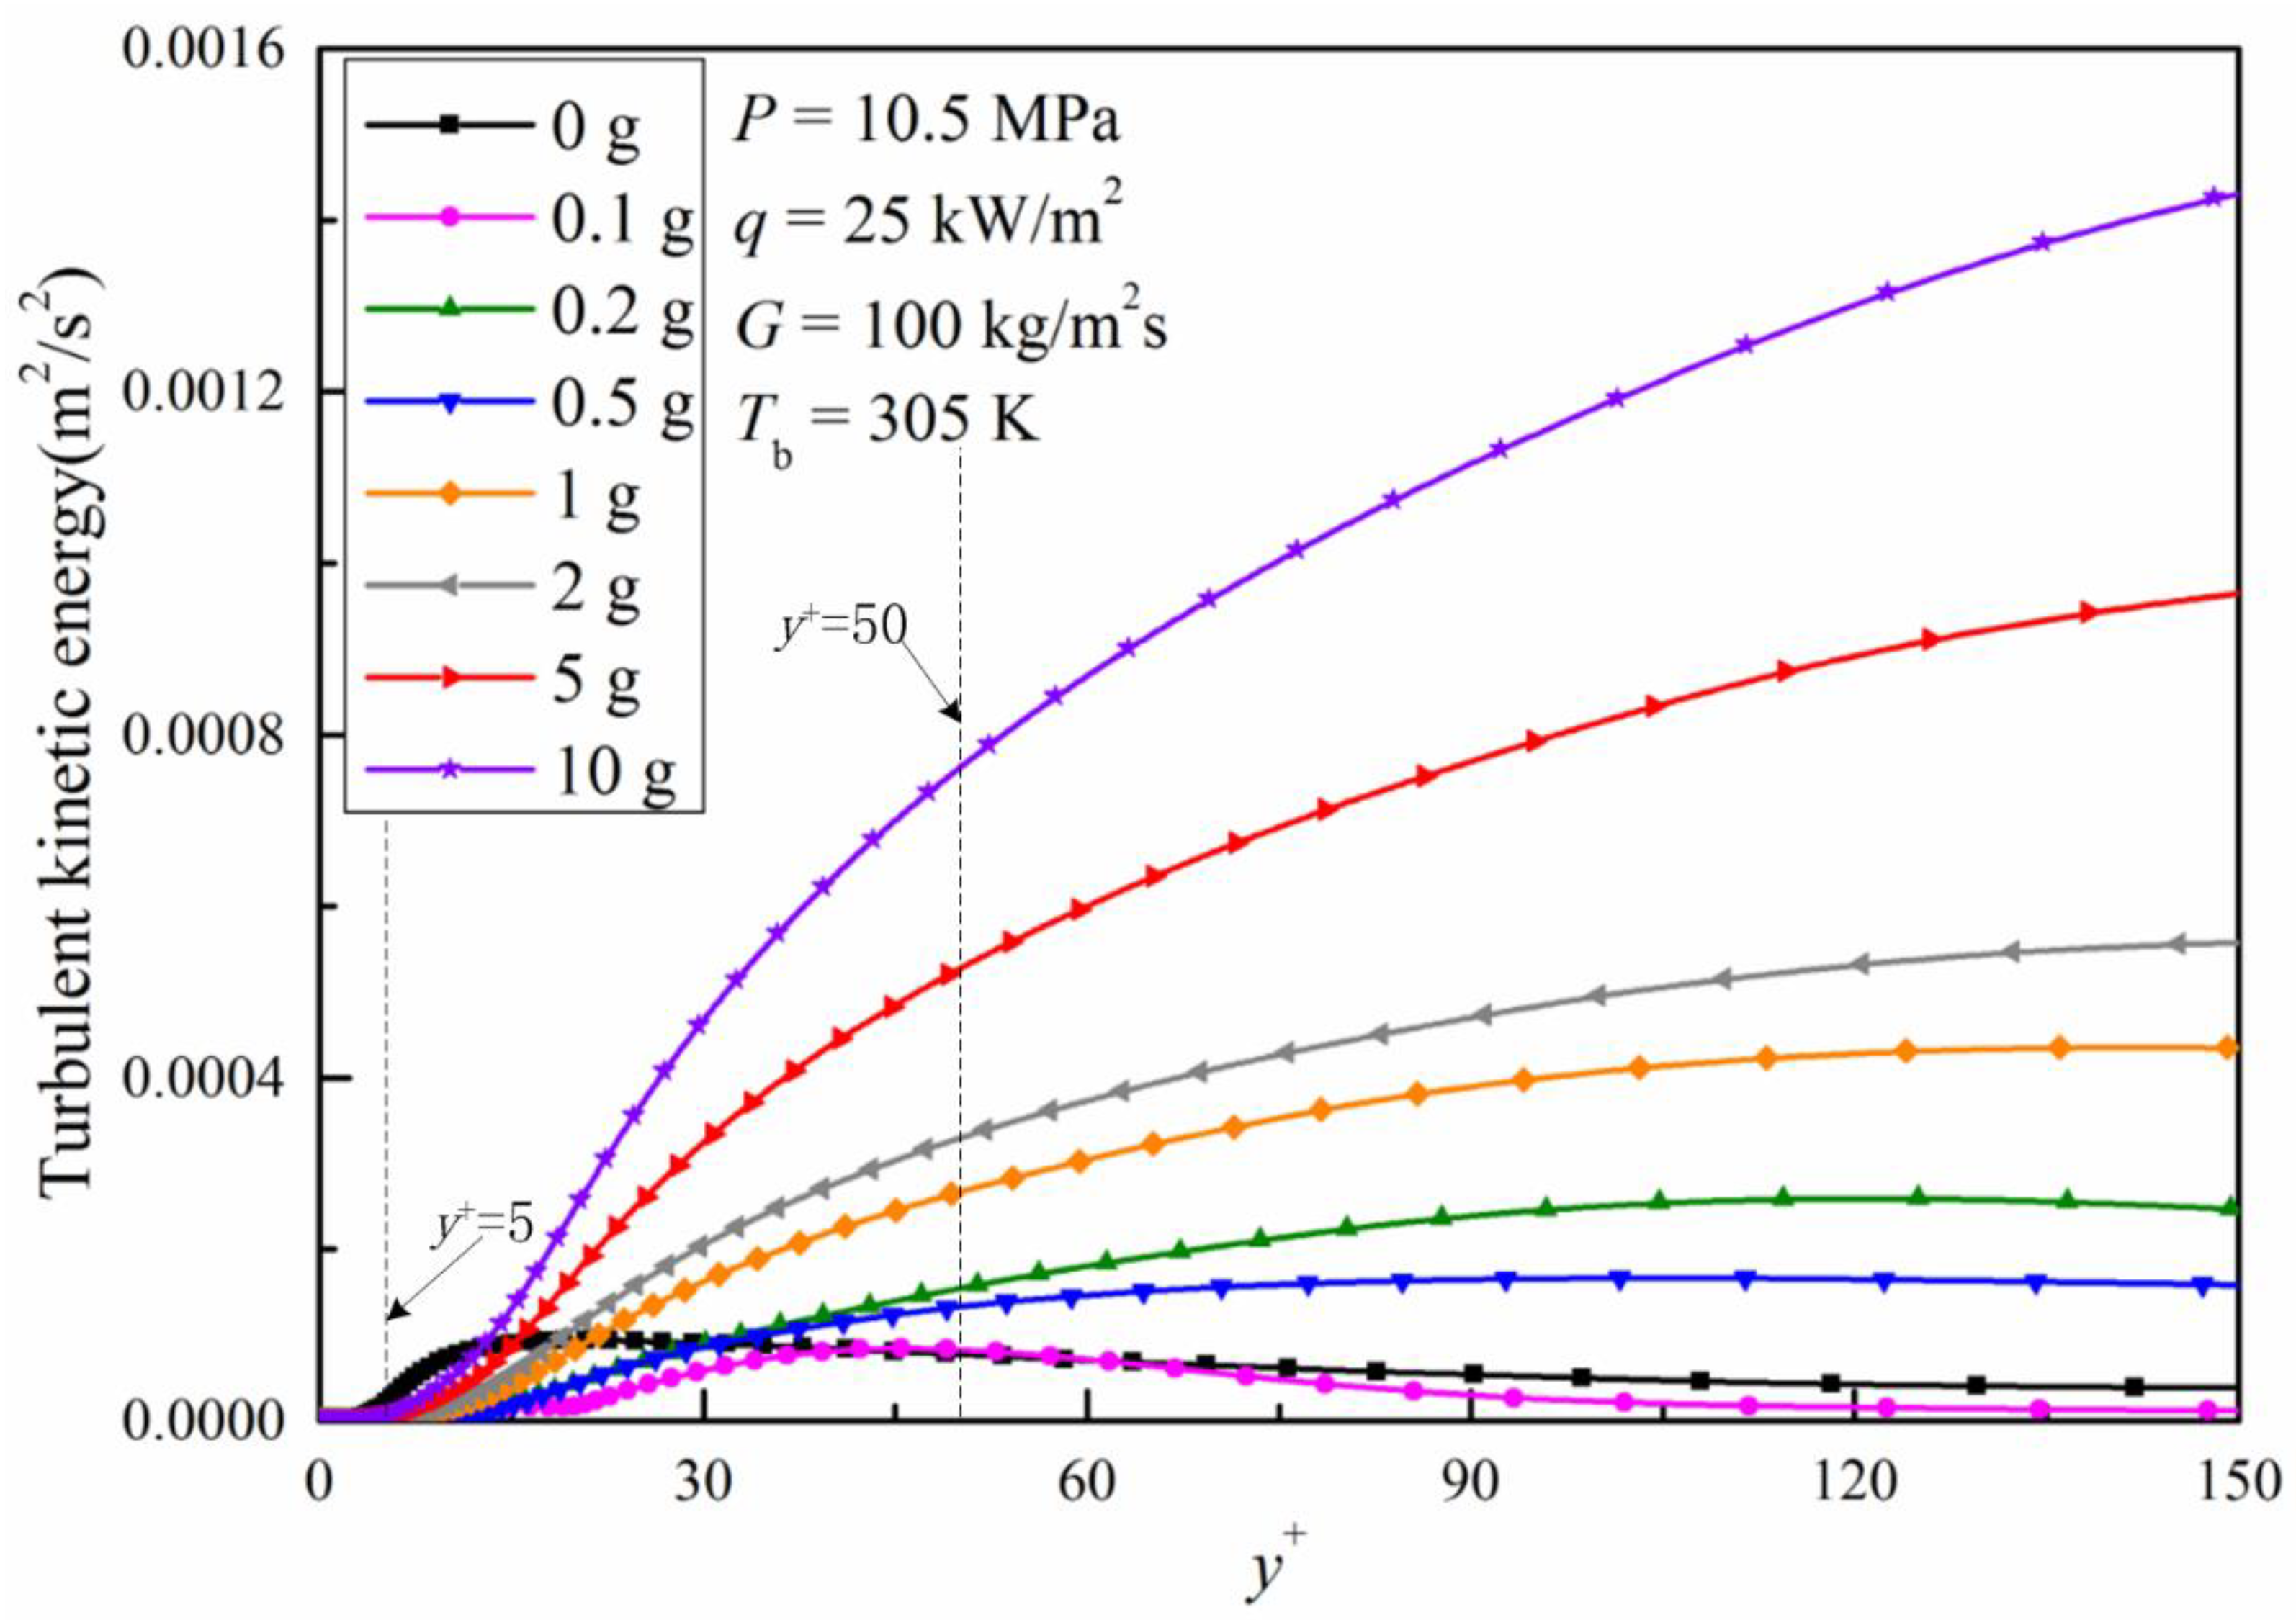
Figure 9.
Gravity effect on variations of heat transfer coefficient plotted against the bulk temperature for downward flow, (a) P = 8 MPa, G = 90 kg/m2s, q = 12.65 kW/m2 and Tin = 292 K; and (b) P = 8.12 MPa, G = 400 kg/m2s, q = 50 kW/m2 and Tin = 278 K.
Figure 9.
Gravity effect on variations of heat transfer coefficient plotted against the bulk temperature for downward flow, (a) P = 8 MPa, G = 90 kg/m2s, q = 12.65 kW/m2 and Tin = 292 K; and (b) P = 8.12 MPa, G = 400 kg/m2s, q = 50 kW/m2 and Tin = 278 K.
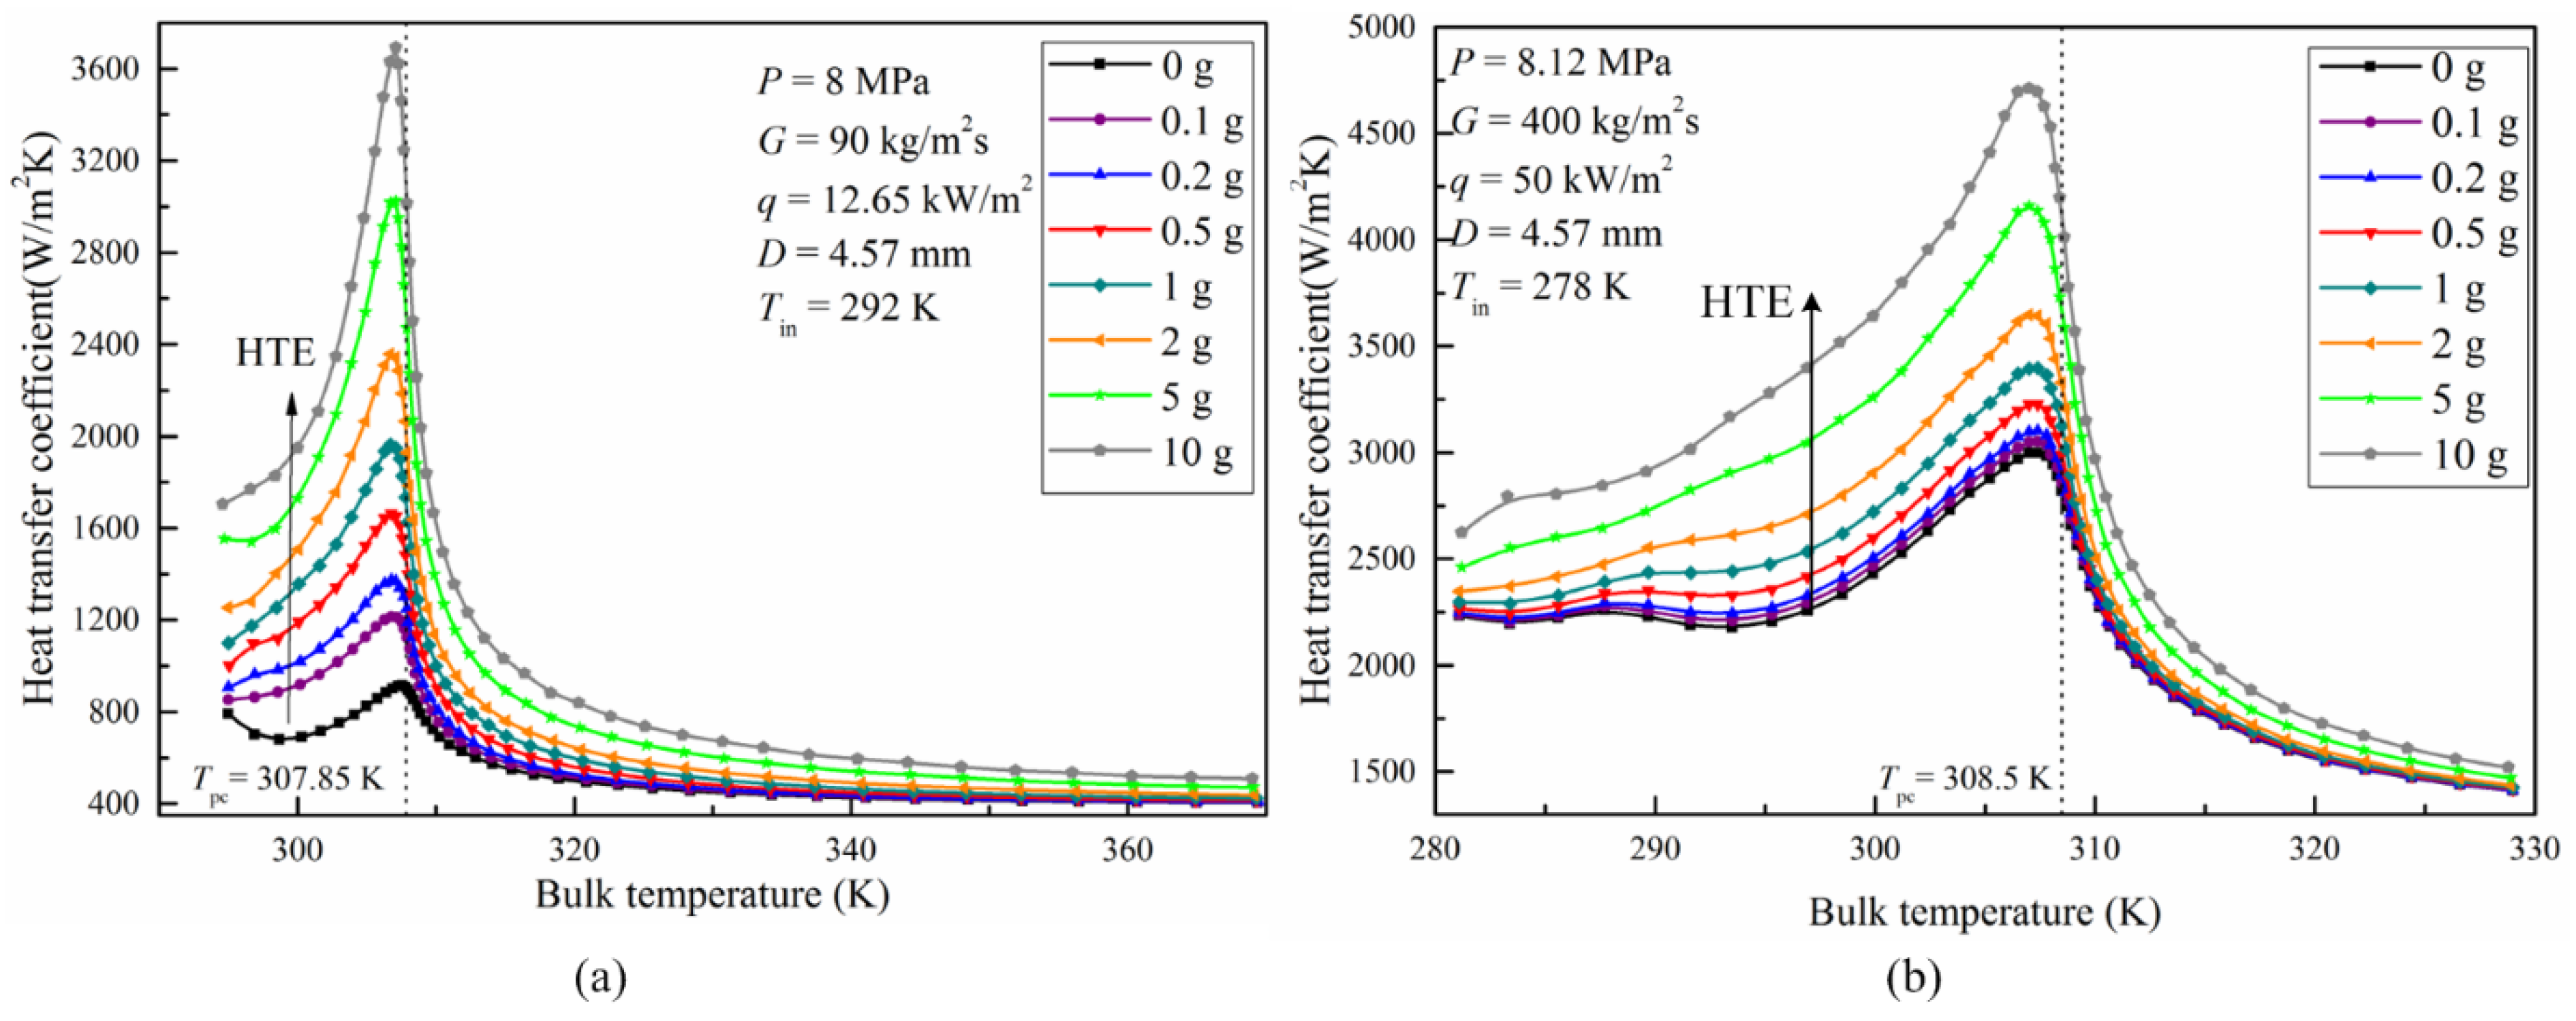
Figure 10.
Radial distribution of (a) temperature and (b) velocity at various gravity magnitudes for downward flow.
Figure 10.
Radial distribution of (a) temperature and (b) velocity at various gravity magnitudes for downward flow.
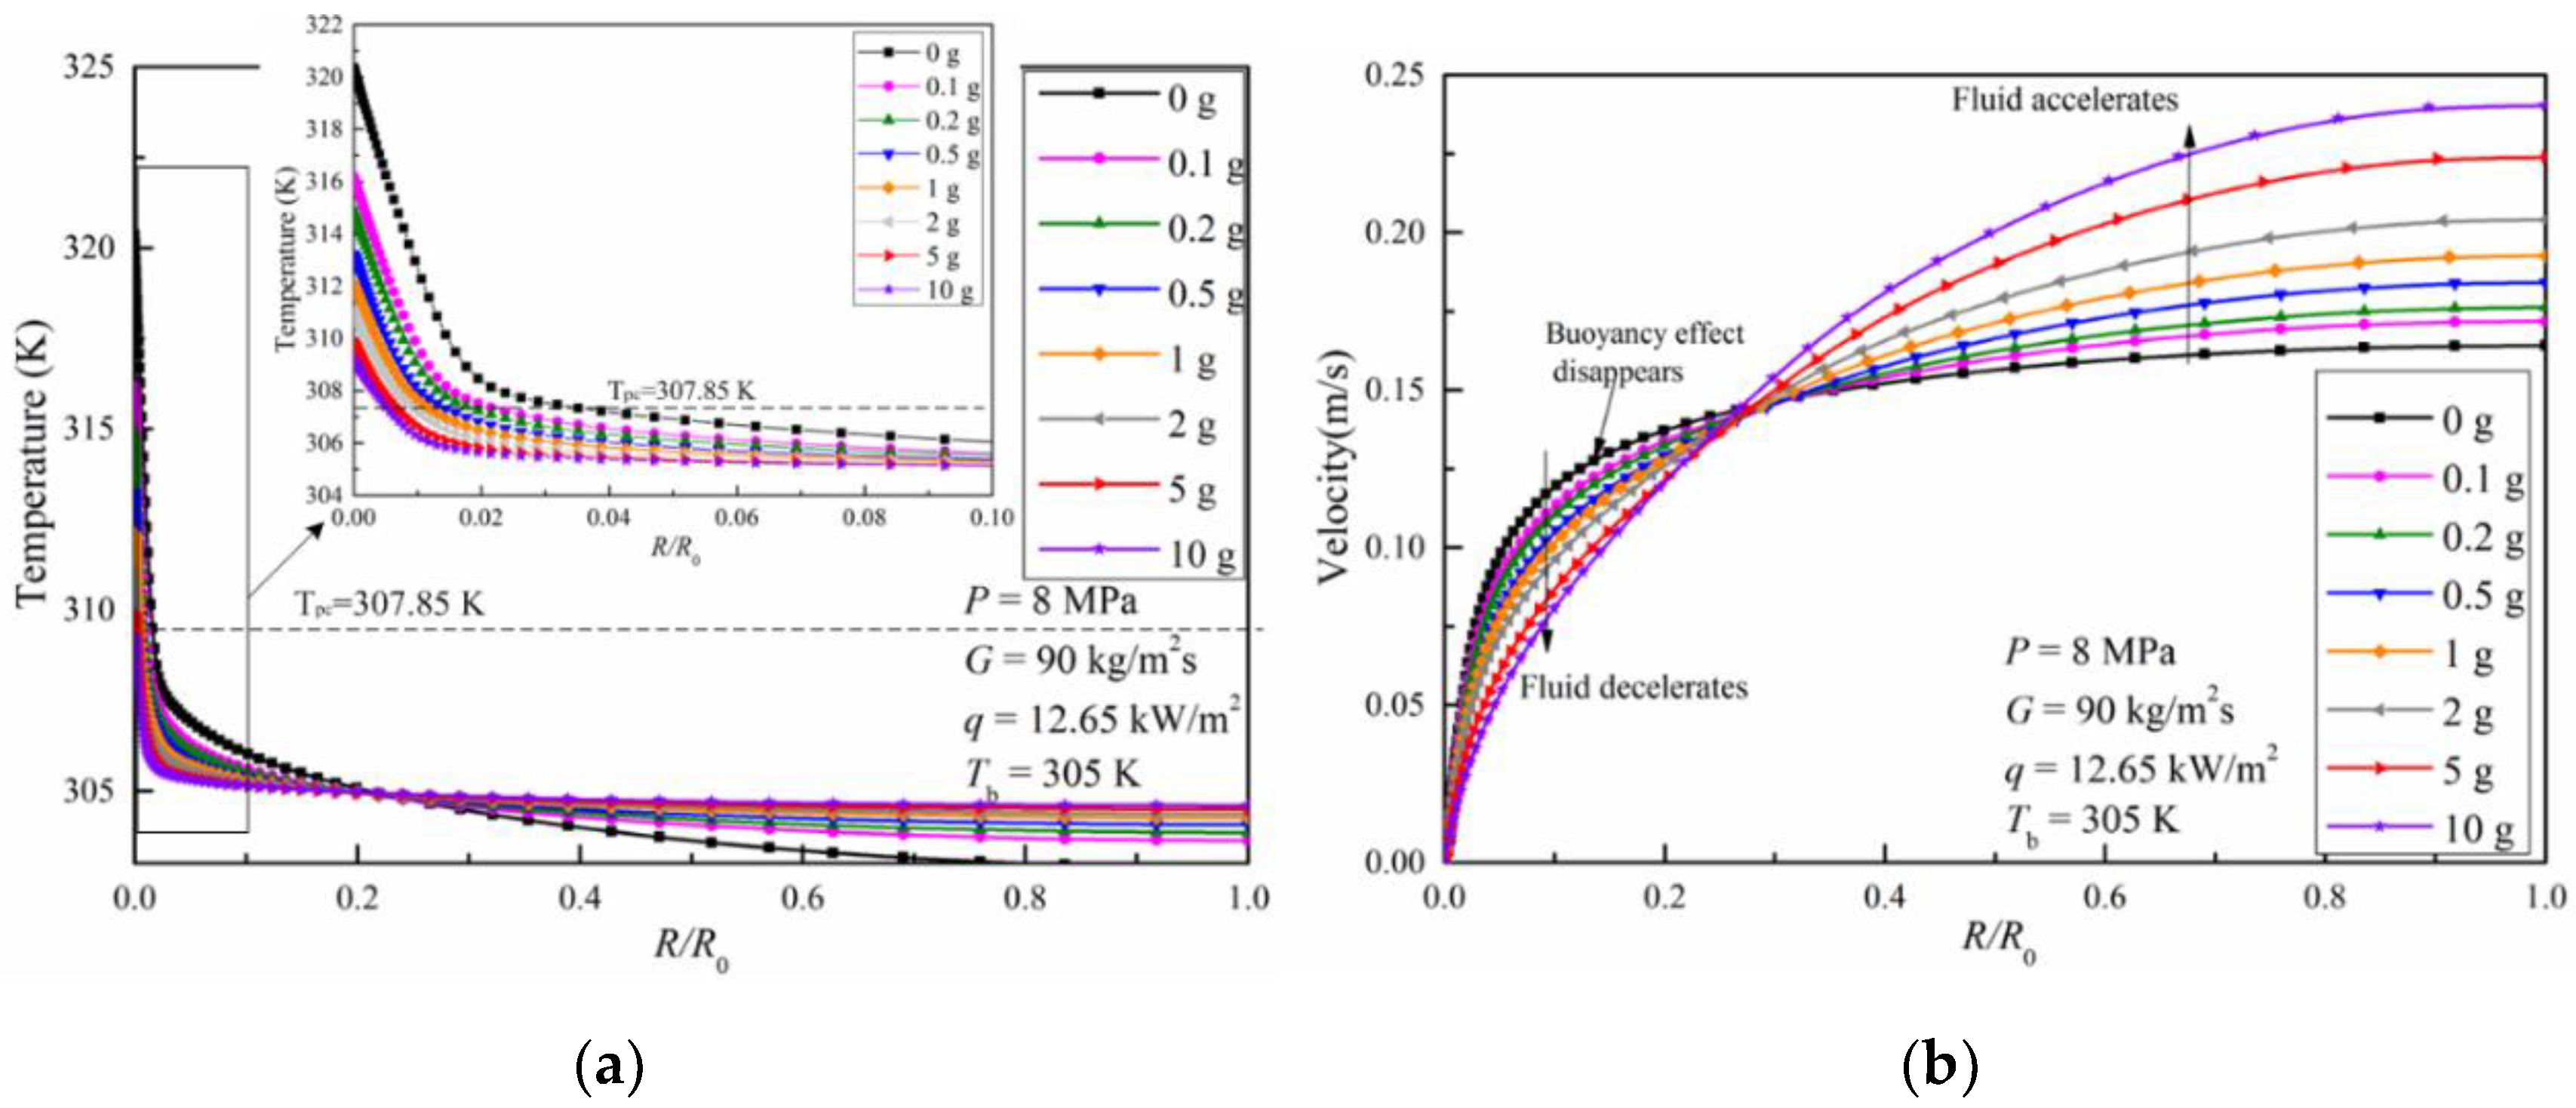
Figure 11.
Diagram to explain the variation rule of velocity with the gravity conditions for downward flow.
Figure 11.
Diagram to explain the variation rule of velocity with the gravity conditions for downward flow.
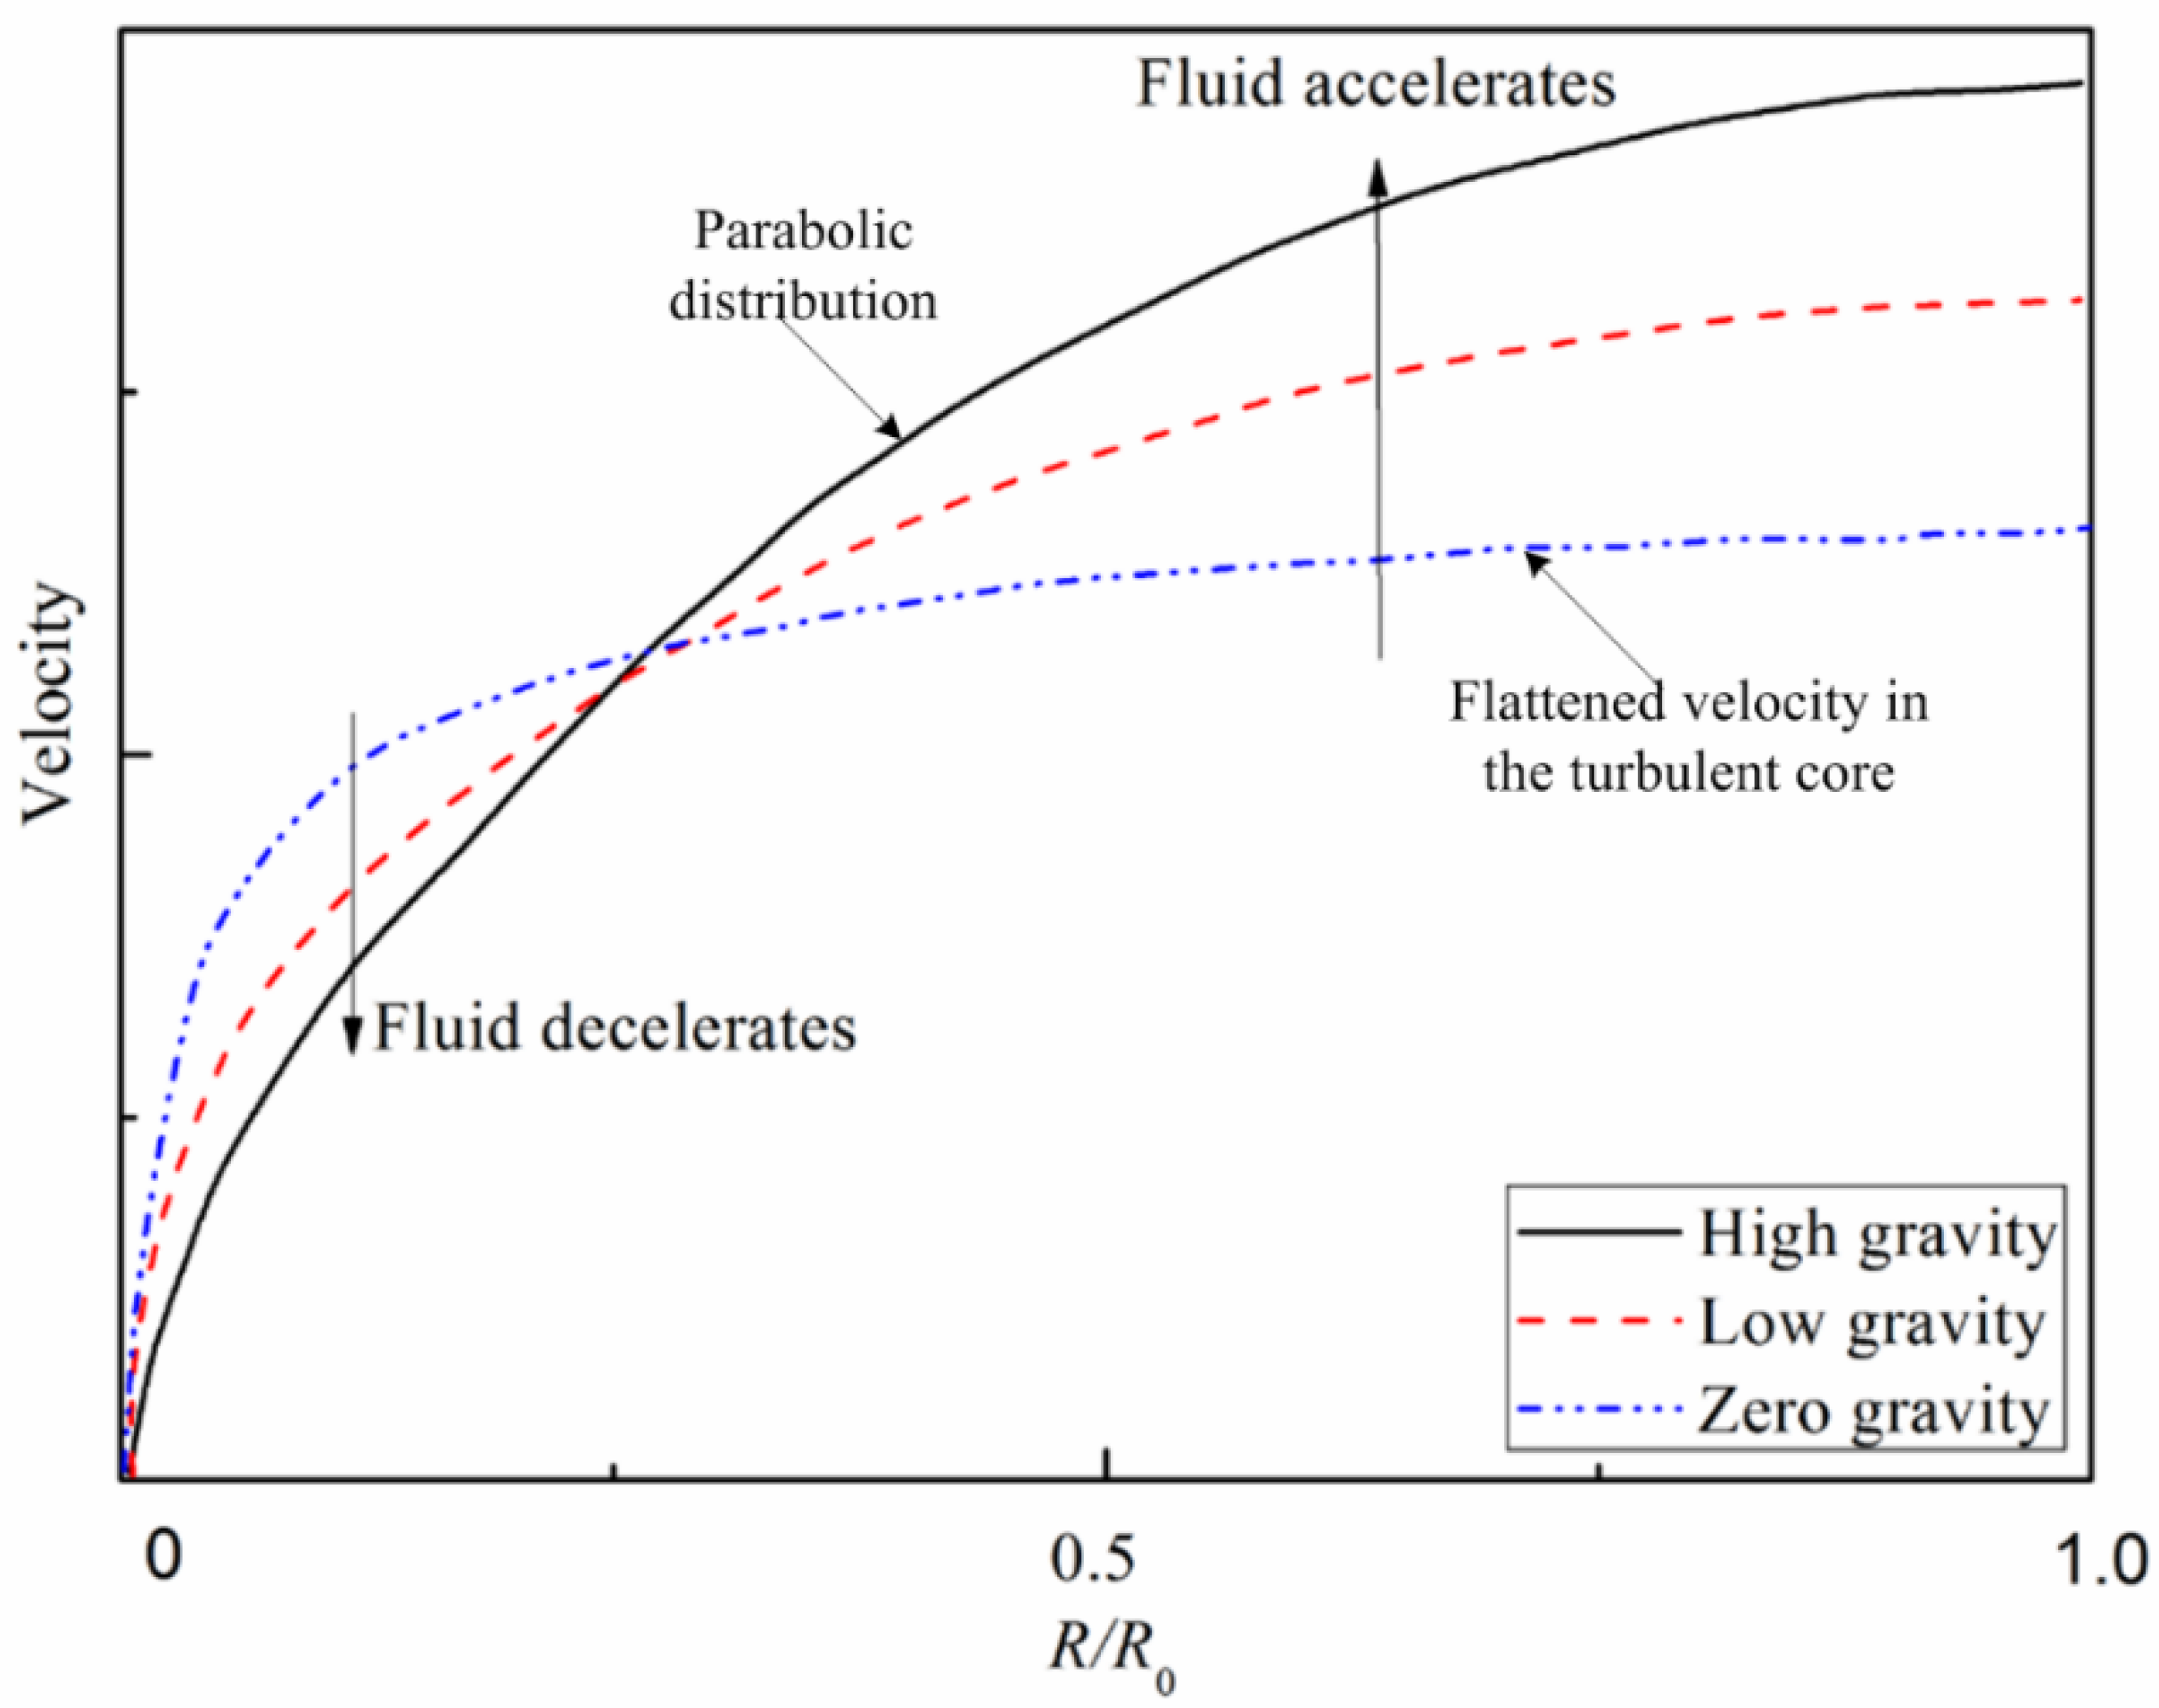
Figure 12.
Radial distributions of (a) density and (b) thermal conductivity at various gravity magnitudes for downward flow.
Figure 12.
Radial distributions of (a) density and (b) thermal conductivity at various gravity magnitudes for downward flow.
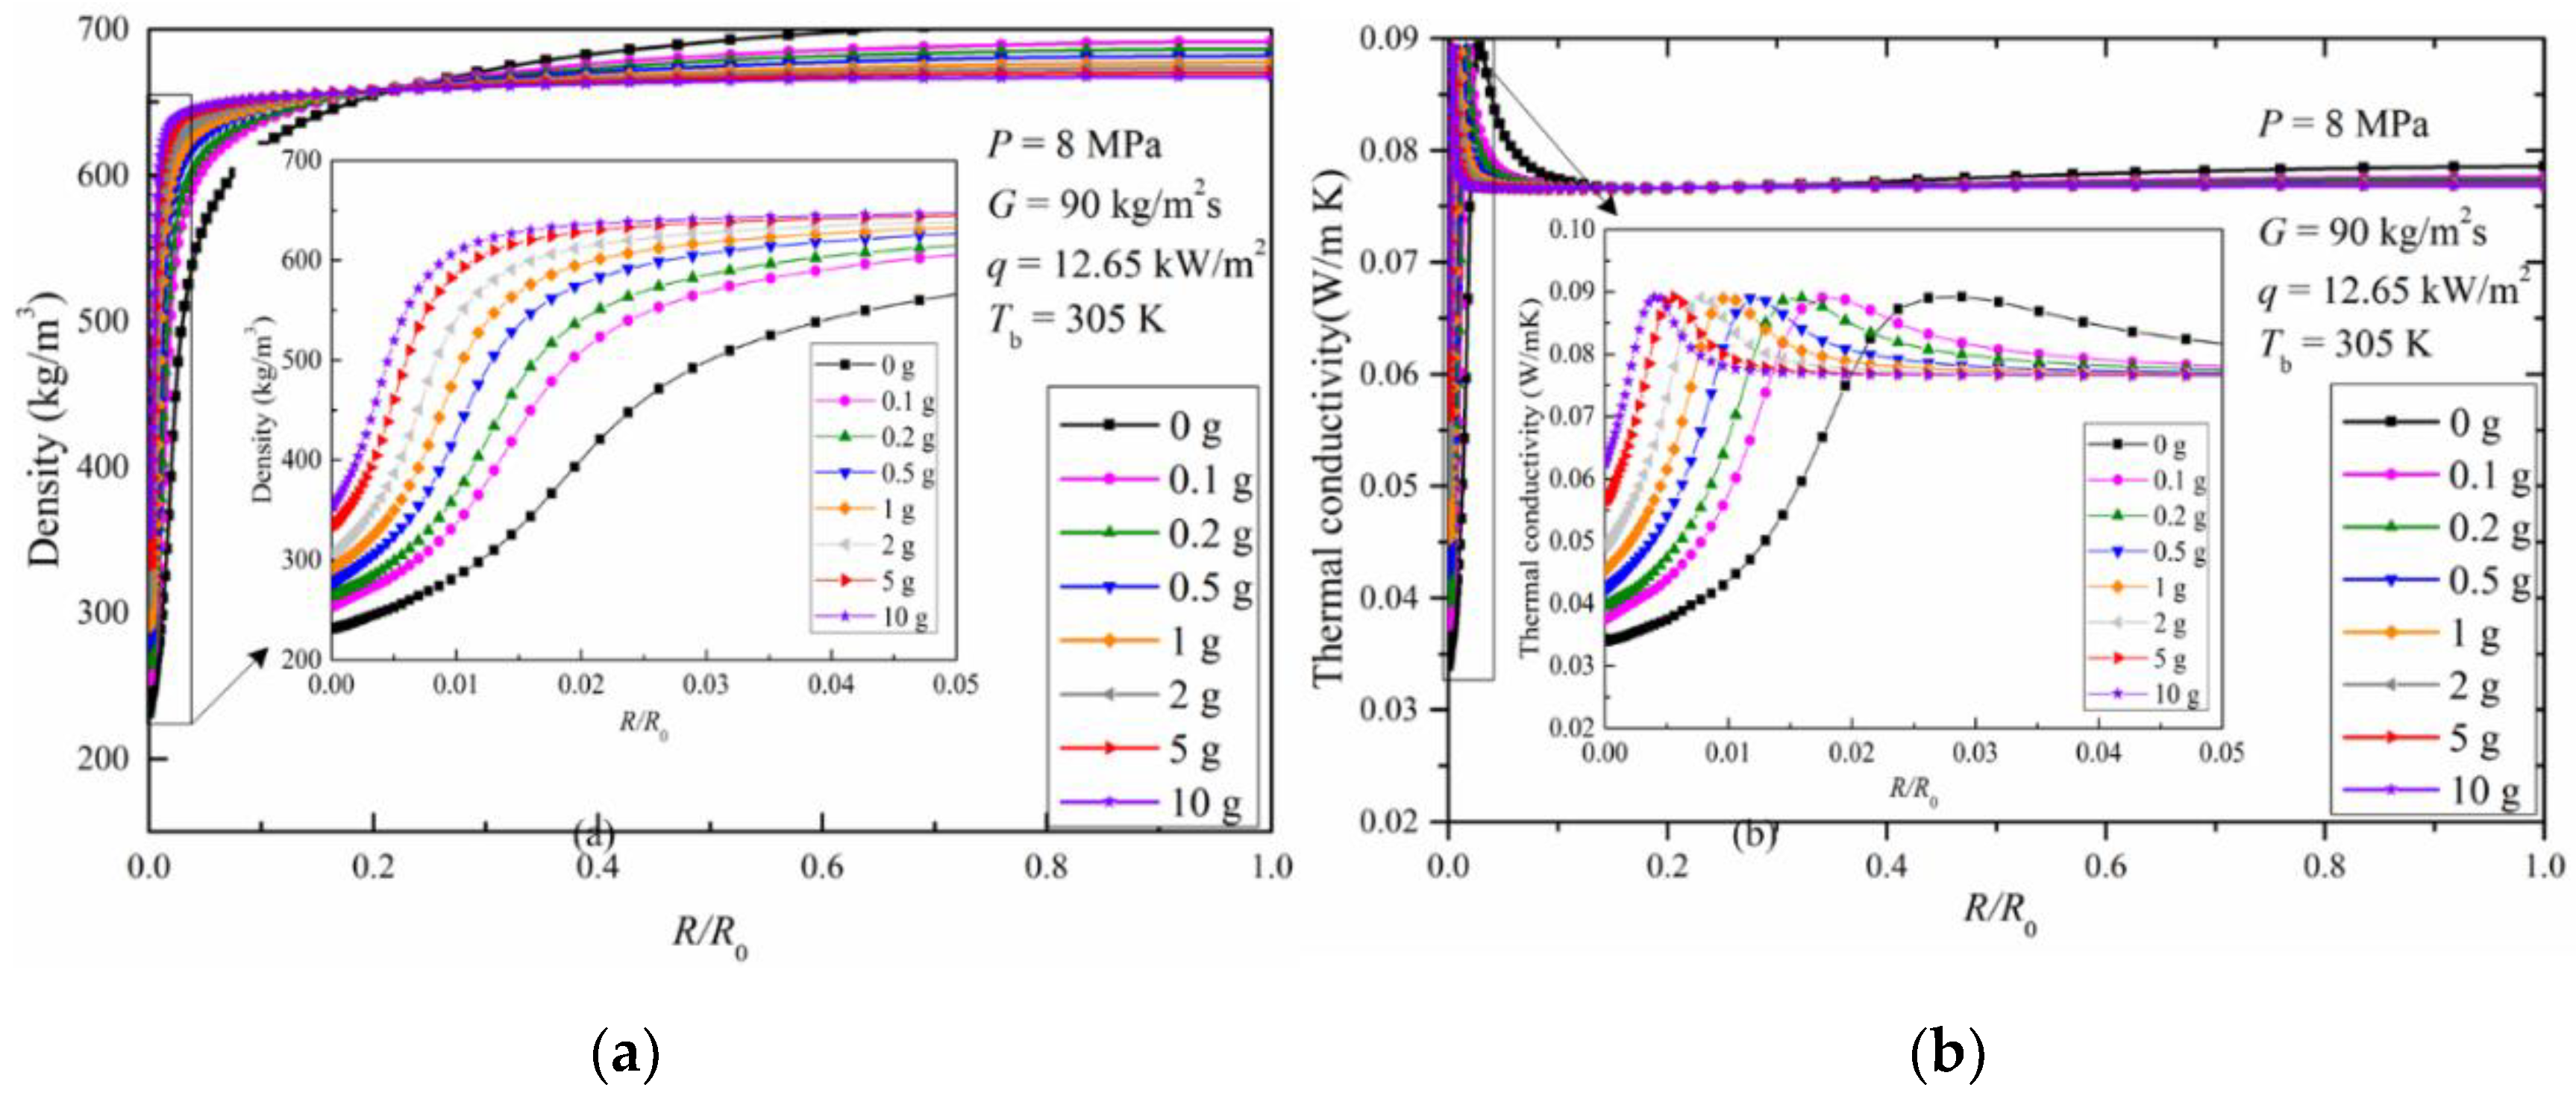
Figure 13.
Radial distributions of (a) turbulent kinetic energy and (b) specific heat at various gravity magnitudes for downward flow.
Figure 13.
Radial distributions of (a) turbulent kinetic energy and (b) specific heat at various gravity magnitudes for downward flow.

Table 1.
Working conditions for validation of turbulence model.
| Researcher | Geometry | Flow Direction | Working Conditions |
|---|---|---|---|
| Song et al. [33] | Round tube D = 9 mm | Verticalupward | Case1: P = 8.12 MPa, G = 400 kg/m2s, q = 50 kW/m2, Tin = 5 °C Case2: P = 8.12 MPa, G = 400 kg/m2s, q = 30 kW/m2, Tin = 5 °C Case3: P = 8.12 MPa, G = 1200 kg/m2s, q = 50 kW/m2, Tin = 5 °C |
| Song et al. [33] | Round tube D = 4.4 mm | Verticalupward | Case4: P = 8.12 MPa, G = 400 kg/m2s, q = 50 kW/m2, Tin = 5 °C Case5: P = 8.12 MPa, G = 400 kg/m2s, q = 30 kW/m2, Tin = 5 °C |
| Kline et al. [34] | Round tube D = 22 mm | Vertical upward | Case6: P = 8.35 MPa, G = 500 kg/m2s, q = 50 kW/m2, Tin = 29 °C Case7: P = 8.35 MPa, G = 500 kg/m2s, q = 45 kW/m2, Tin = 29 °C Case8: P = 8.35 MPa, G = 500 kg/m2s, q = 40 kW/m2, Tin = 29 °C |
| Kline et al. [34] | Round tube D = 8 mm | Vertical upward | Case9: P = 8.35 MPa, G = 400 kg/m2s, q = 40 kW/m2, Tin = 15 °C Case10: P = 8.35 MPa, G = 400 kg/m2s, q = 35 kW/m2, Tin = 19 °C |
Table 2.
Working conditions in this paper.
| Geometry | Flow Direction | Working Pressure | Mass Flux | Heat Flux | Gravity Magnitude |
|---|---|---|---|---|---|
| P, MPa | G, kg/m2s | q, kW/m2 | |||
| Round tube D = 4.57 mm | Downward and upward | 8, 8.12, 10.5 | 90, 100, 400 | 12.65, 25, 50 | 0 g–10 g |
Table 3.
Mesh number and average near wall y+ of cases for mesh sensitive study.
| Case | Number of Meshes | Minimum Near-Wall y+ |
|---|---|---|
| 1 | 35,052 | 1.18 |
| 2 | 42,567 | 0.51 |
| 3 | 45,058 | 0.17 |
| 4 | 52,580 | 0.03 |
| 5 | 62,596 | 0.01 |
© 2020 by the authors. Licensee MDPI, Basel, Switzerland. This article is an open access article distributed under the terms and conditions of the Creative Commons Attribution (CC BY) license (http://creativecommons.org/licenses/by/4.0/).
Share and Cite
MDPI and ACS Style
Zhu, X.; Zhang, R.; Yu, X.; Cao, M.; Ren, Y. Numerical Study on the Gravity Effect on Heat Transfer of Supercritical CO2 in a Vertical Tube. Energies 2020, 13, 3502. https://doi.org/10.3390/en13133502
AMA Style
Zhu X, Zhang R, Yu X, Cao M, Ren Y. Numerical Study on the Gravity Effect on Heat Transfer of Supercritical CO2 in a Vertical Tube. Energies. 2020; 13(13):3502. https://doi.org/10.3390/en13133502
Chicago/Turabian StyleZhu, Xiaojing, Ruizeng Zhang, Xiao Yu, Maoguo Cao, and Yongxiang Ren. 2020. "Numerical Study on the Gravity Effect on Heat Transfer of Supercritical CO2 in a Vertical Tube" Energies 13, no. 13: 3502. https://doi.org/10.3390/en13133502
Note that from the first issue of 2016, this journal uses article numbers instead of page numbers. See further details here.