Article

Techno-Economic Analysis of Pressurized Oxy-Fuel Combustion of Petroleum Coke

1
Chemical Engineering Department, University of Waterloo, Waterloo, Ontario N2L 3G1, Canada
2
Clean Combustion Research Center, Physical Sciences and Engineering Division, King Abdullah University of Science and Technology, Thuwal 23955-6900, Saudi Arabia
*
Author to whom correspondence should be addressed.
Energies 2020, 13(13), 3463; https://doi.org/10.3390/en13133463
Submission received: 28 April 2020 / Revised: 11 June 2020 / Accepted: 1 July 2020 / Published: 4 July 2020

Abstract

:
Petroleum coke (petcoke) is a by-product of heavy petroleum refining, with heating values comparable to that of coal. It is readily available in oil-producing countries such as the United States of America (USA) and the Kingdom of Saudi Arabia (KSA) at minimum costs and can be used as an inexpensive fossil fuel for power generation. Oxy-petcoke combustion is an attractive CO2 capture option as it avoids the use of additional absorption units and chemicals, and results in a CO2 + H2O flue gas stream that is compressed and dehydrated in a CO2 capture and purification unit (CO2CPU). The additional cost of the CO2CPU can be reduced through high pressure combustion. Hence, this paper reports a techno-economic analysis of an oxy-petcoke plant with CO2 capture simulated at pressures between 1 and 15 bars in Aspen PlusTM based on USA and KSA scenarios. Operating at high pressures leads to reduced equipment sizes and numbers of units, specifically compressors in CO2CPU, resulting in increased efficiencies and decreased costs. An optimum pressure of ~10 bars was found to maximize the plant efficiency (~29.7%) and minimize the levelized cost of electricity (LCOE), cost of CO2 avoided and cost of CO2 captured for both the USA and KSA scenarios. The LCOE was found to be moderately sensitive to changes in the capital cost (~0.7% per %) and increases in cost of petcoke (~0.5% per USD/tonne) and insensitive to the costs of labour, utilities and waste treatment.

1. Introduction

According to the 2016 Paris Agreement, crucial steps are required to mitigate the emissions of greenhouse gases (GHG) and thereby limit the earth temperature increase to 2 °C above pre-industrial levels. One option is to capture CO2 from fossil fuel combustion processes. Due to increased heavy oil production, petroleum coke (petcoke), a by-product of petroleum refining, is readily available in oil-producing countries at economical costs [1]. In addition, petcoke has a high heating value, which makes it a viable option for economical energy production [2].
There are three main approaches to capture CO2 in fossil fuel combustion processes [3]:
  • Post combustion: CO2 is removed from the flue gas using techniques such as absorption.
  • Pre combustion: Pre-reformed fuel is used, where, after reformation, CO2 is removed from the fuel before combustion.
  • Oxy-fuel combustion: Fuel is combusted in oxygen (>95%) instead of air, leading to high CO2 concentrations in the flue gas due to the near absence of nitrogen in the combustion process.
Post and pre-combustion routes require additional units such as absorption/adsorption towers, cryogenic distillation or membrane separators for CO2 capture. On the other hand, in oxy-fuel combustion, the flue gas comprises mostly CO2 and H2O, and only dehydration is needed to produce a high purity (>90% CO2) stream [4]. The absence of large quantities of nitrogen (from the air in air-fired plants) reduces the flow rate of flue gas and hence the size of downstream units, subsequently reducing equipment costs [5]. These characteristics make oxy-fuel combustion an attractive carbon capture and storage (CCS) technique.
Although oxy-fuel combustion is promising, associated challenges remain. Additional air separation units (ASU) are required, typically working at 5 to 10 bars [6], for the production of a high purity (>95%) O2 stream, which leads to increased initial investment and manufacturing costs. The ASU is amongst the highest power consuming units of an oxy-fuel plant [4]. Another option is to operate the plant at high pressure, as this can further decrease the equipment cost by promoting the use of smaller equipment and off-set the power requirement of the downstream CO2 capture and purification unit (CO2CPU) [4,7]. A higher pressure operation also allows for recovering the latent heat from high moisture flue gases, as pointed out by Hong et al. [8], Zebian et al. [9], and Soundarajan and Gundersen [10], who all simulated pressurized oxy-combustion systems in Aspen Plus, and who all have shown that pressurized oxy-fuel combustion leads to higher efficiencies than for the atmospheric case. Gopan et al. [11] presented and simulated in Aspen Plus a concept of a staged pressurized oxy-combustion process. They found that the net efficiency of their process is about 7% higher than “conventional” atmospheric oxy-fuel combustion systems. More recently, Chen et al. [12] and Shi et al. [13] presented simulation of pressurized oxy-fuel combustion, but in the context of circulating fluidized bed. An interesting result from most of the studies on pressurized oxy-fuel combustion simulation reported here is that the net plant efficiency is usually found to be a maximum at an operating pressure of around 10 bars.
As a first step to assess its viability, system modelling for oxy-fuel combustion using petcoke is required. The main objective of this paper is therefore to conduct a techno-economical study of using petroleum coke as a feedstock to generate power through pressurized oxy-fuel combustion technology with CO2 capture. This study considers two country-scenarios where petcoke is readily available: the United States of America (USA) and the Kingdom of Saudi Arabia (KSA). Several researchers have presented techno-economic studies on coal-based integrated oxy-fuel combustion systems including an ASU, a combustion boiler section (CBS), a balance of plant (BOP), and a CO2CPU [7,14,15,16]. However, to the authors’ knowledge, no work has been published pertaining to oxy-fuel combustion of petcoke. The present paper presents a techno-economic Aspen PlusTM model of an integrated high-pressure oxy-combustion power plant that uses petcoke as fuel. The ASU, BOP and CO2CPU are based on the work of Fu and Gundersen [7], the US Department of Energy [17], and Shafeen [15], respectively.

2. Methodology

For this study, the fuels are petcoke and Illinois No. 6 coal (coal). Table 1 summarizes the composition of both fuels used here. Illinois No. 6 coal was chosen because it was used in several oxy-coal combustion studies, allowing for direct comparison of the results of our base case atmospheric pressure oxy-coal combustion model with those of these studies [7,17].

2.1. Process Simulation Model

The integrated oxy-petcoke plant comprises of four major sections; the ASU, CBS, the BOP, and the CO2CPU, as shown in Figure 1. The oxygen stream from the ASU is used in the CBS for petcoke combustion to produce a hot flue gas. This hot flue gas is used to produce steam, and then electric power in the BOP. The cooled flue gas from the CBS is then fed to the CO2CPU to produce a concentrated high-pressure CO2 stream.
Aspen PlusTM 8.8 was used to model this system. The ASU is adapted from a study by Fu and Gundersen [7], referred to as Norwegian University of Science and Technology (NTNU) throughout the text. The CBS and BOP sections are based on a study by the US DOE on the oxy-combustion of pulverized coal [17]. The CO2CPU was developed based on a patented design by Zanganeh and Shafeen [18]. Finally, an economic model, based on literature by Towler and Sinnott [19] and Turton et al. [20], was used to assess the economics of the plant.
In all simulations presented in this study, what remains constant is the gross power output of the plant (792 MW) or, said differently, the rate of heat transferred from the combustion boiler section to the balance of plant (1877 MWth). Those values were calculated based on an atmospheric pressure oxy-coal combustion simulation for a net power output of around 550 MW burning Illinois No. 6 coal [7,17]. The adiabatic flame temperature was set at 1830 °C for coal and 1866 °C for petcoke, as determined by running separate combustion simulations in air. The primary focus of this work is to explore oxy-fuel combustion of petcoke from atmospheric to pressurized conditions followed by carbon capture. Since the operating pressure does not affect the BOP and requires only the installation of one compressor at the ASU outlet to bring the oxygen stream up to the operating pressure, descriptions of only the CBS and CO2CPU are given in the text. The ASU [21,22] and BOP [23,24] are commonly used units with information readily available. The overall Aspen Plus flowsheet is shown in Figure 2 and includes three “hierarchy” blocks representing detailed models of the ASU, BOP and CO2CPU sections. Detailed descriptions of the ASU, BOP, and CO2CPU are provided in the supplementary information along with their unit flowsheets (Figures S1–S3).

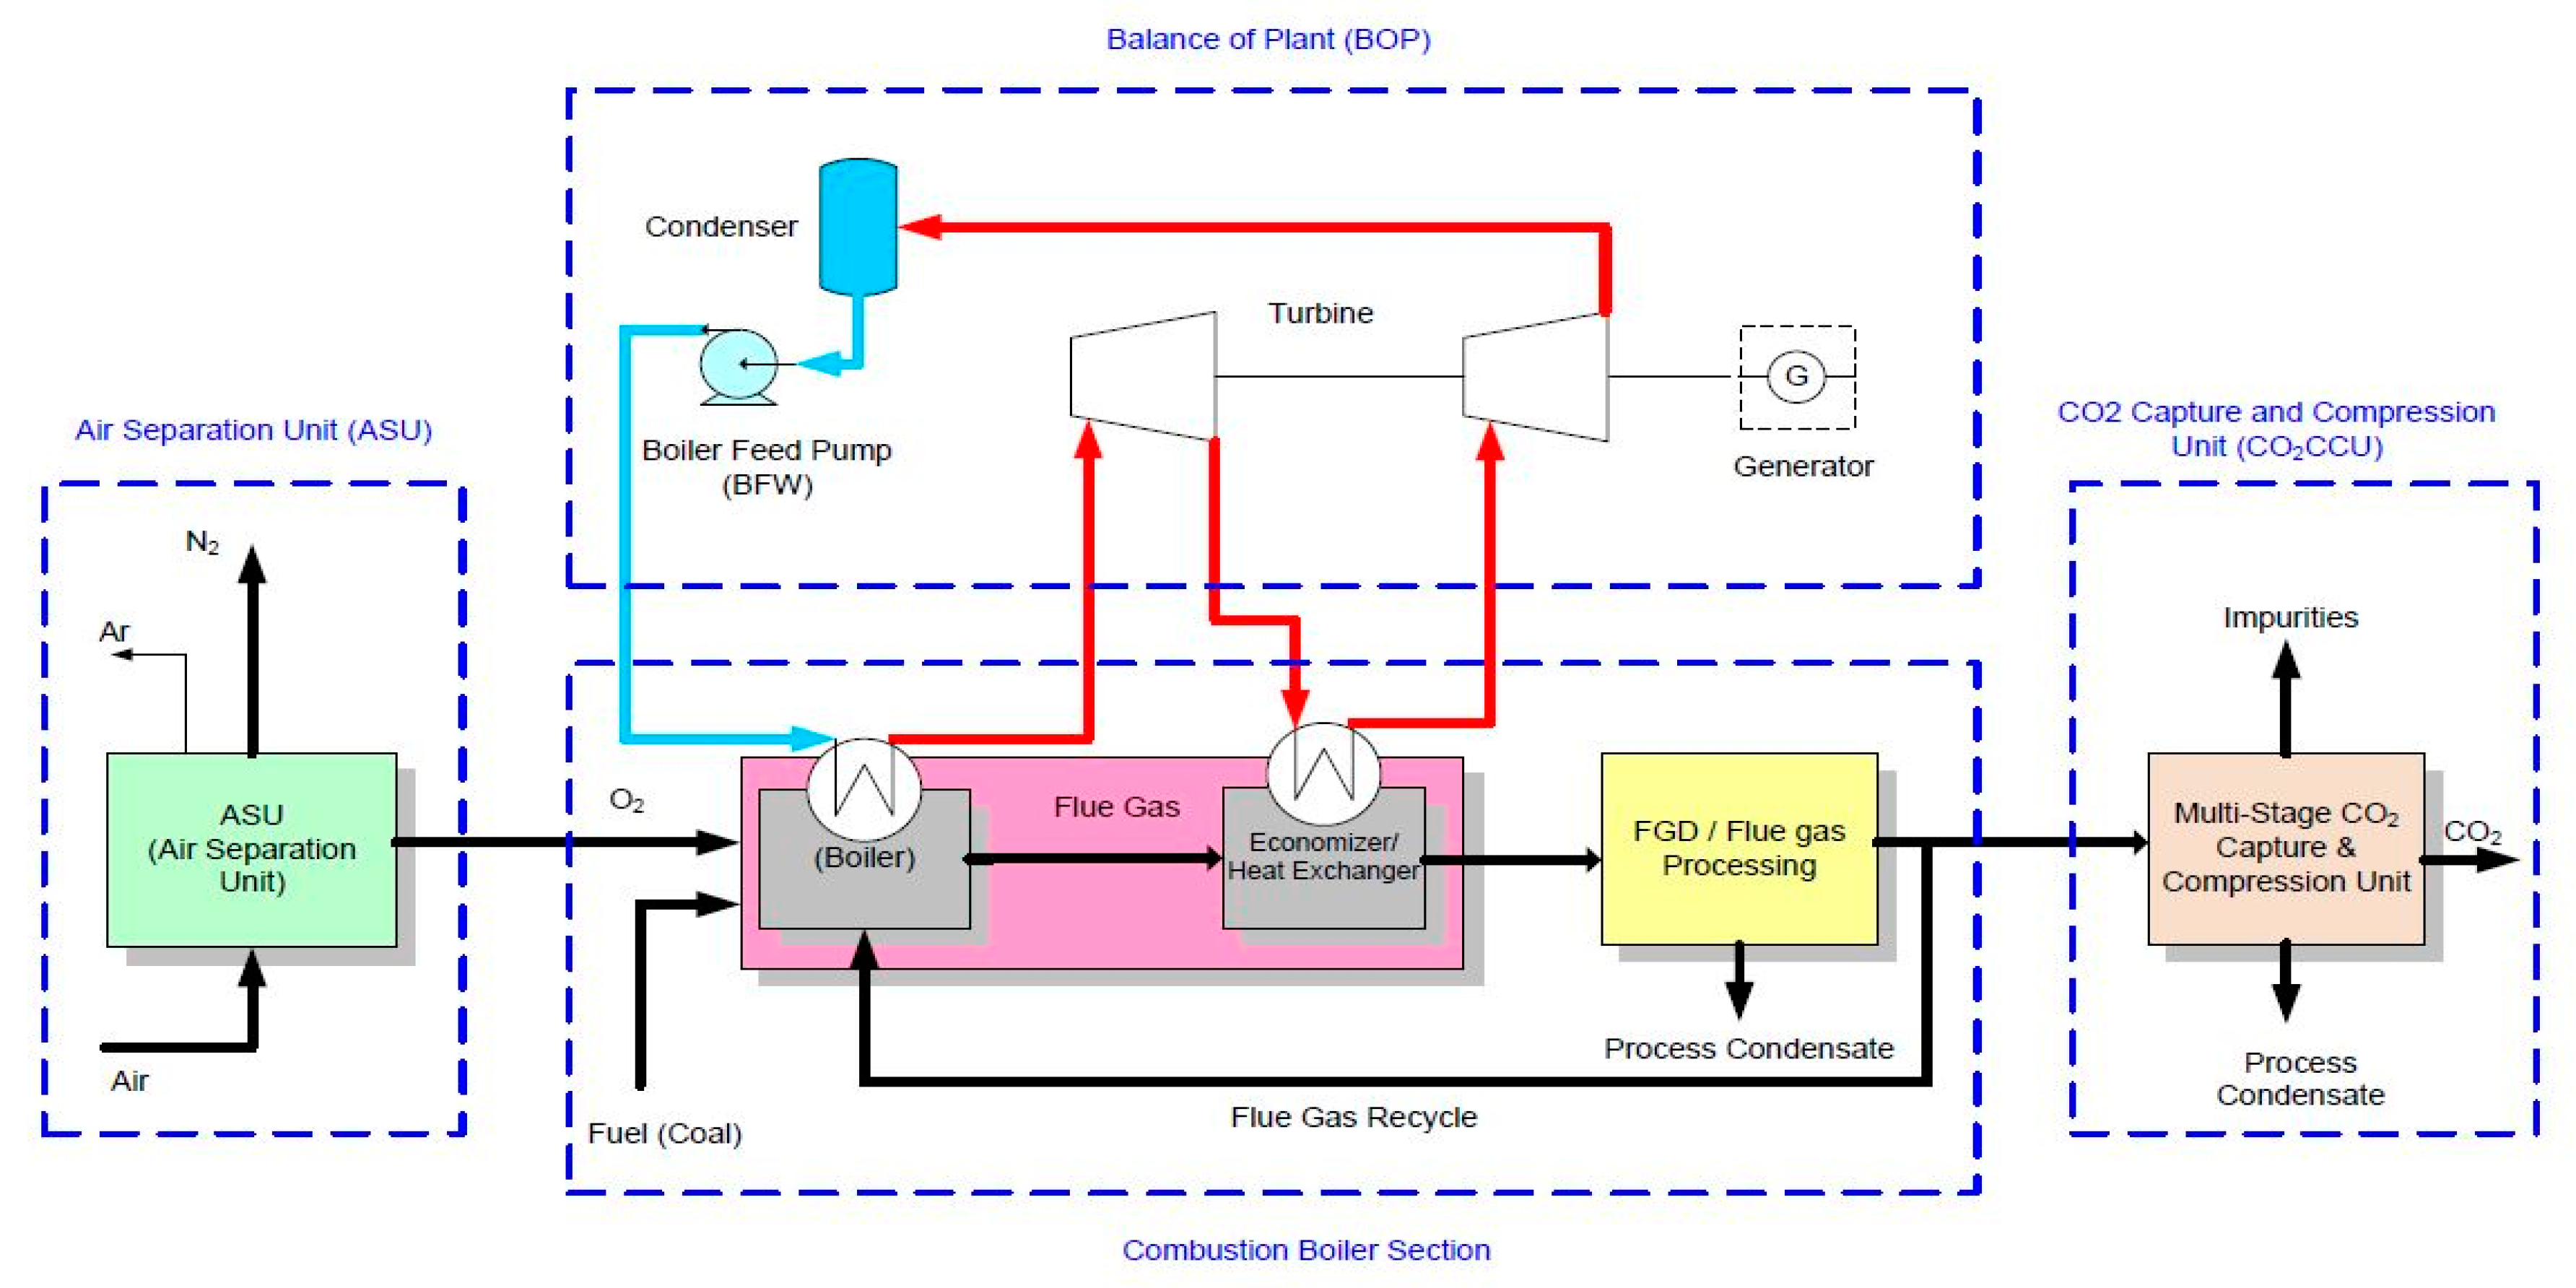
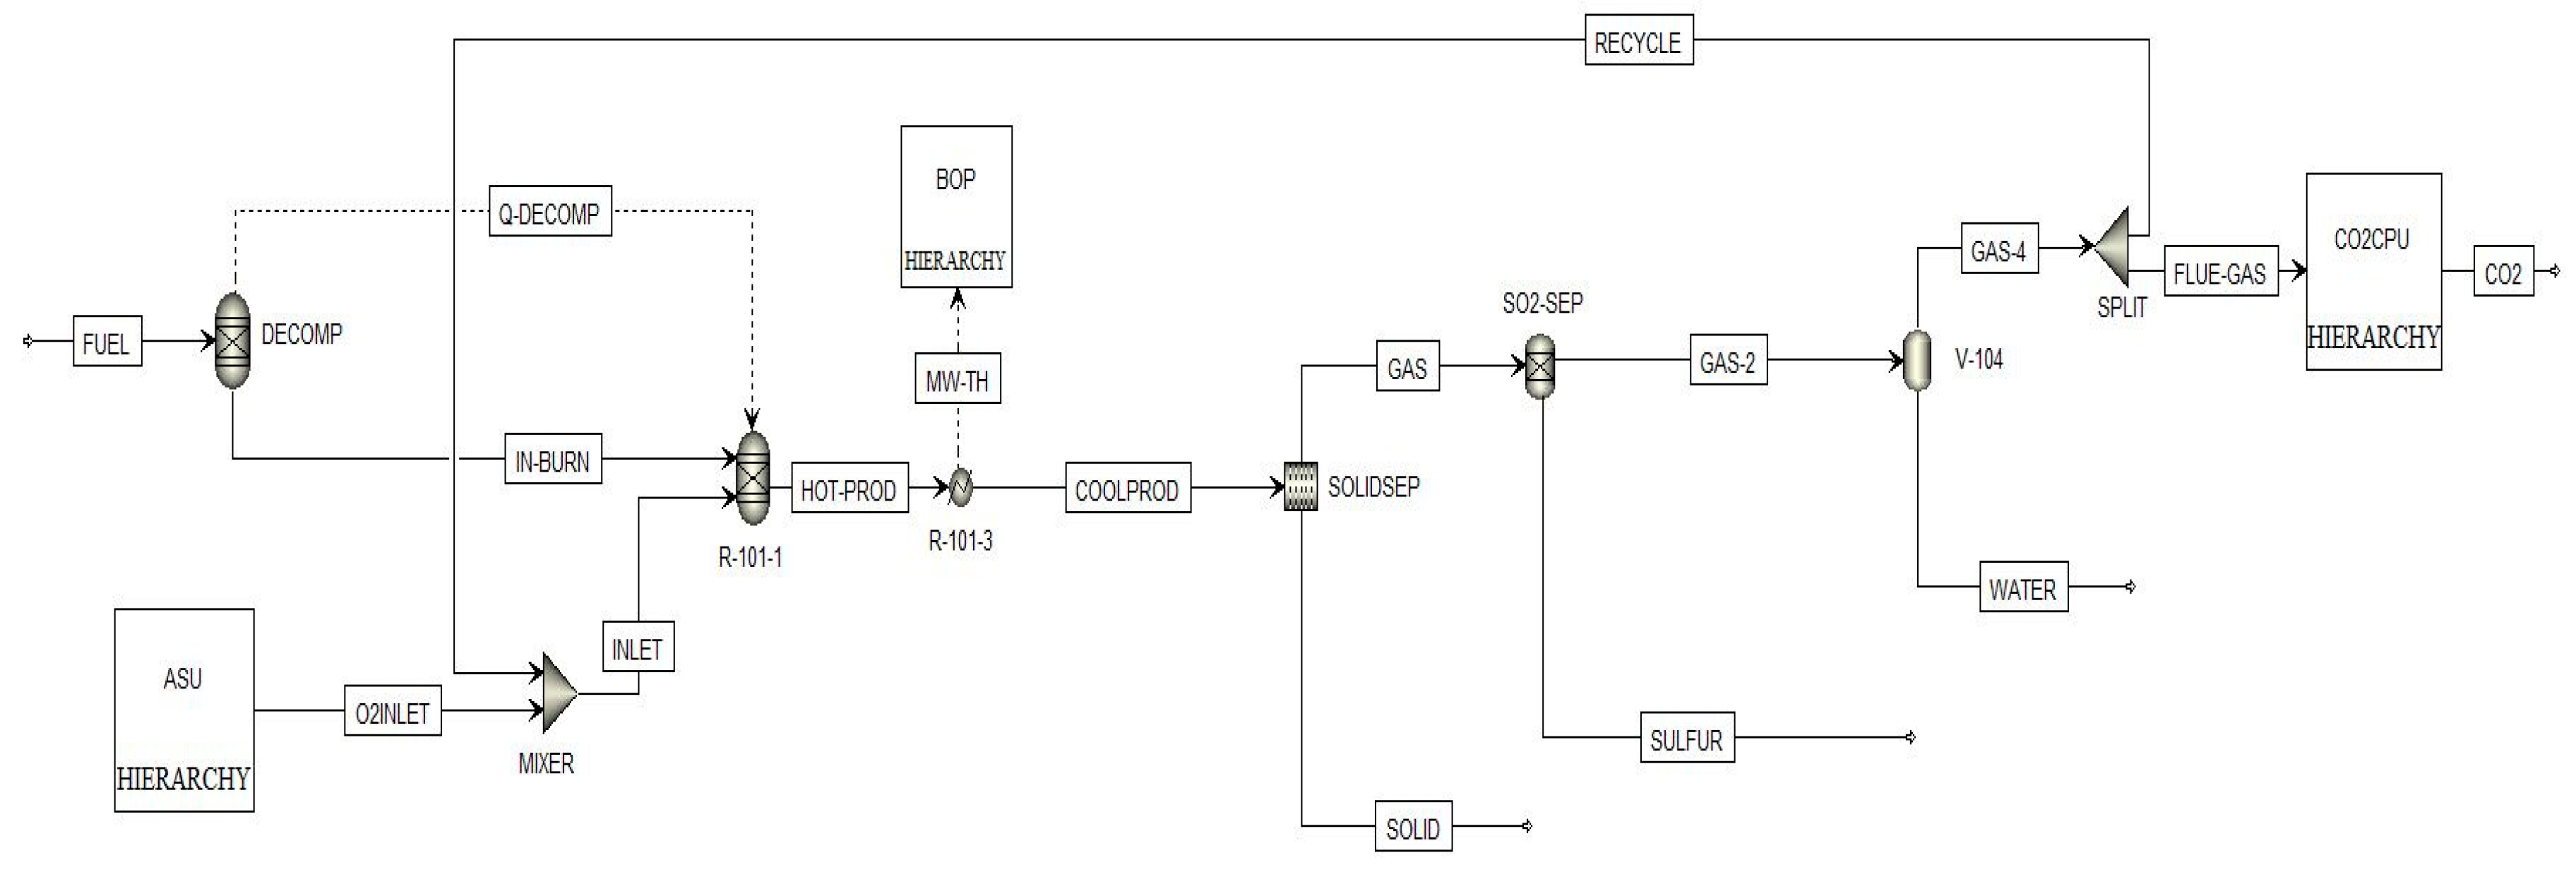
2.1.1. Combustion Boiler Section (CBS)

To simulate the combustor, combinations of RYield and RGibbs models were used. RYield simulates the decomposition of the solid fuel components based on its ultimate analysis, while RGibbs calculates the chemical equilibrium of the combustion reaction by minimizing the system’s Gibbs free energy [25,26]. In Figure 2, FUEL enters the DECOMP (RYield) and then the R-101-1 (RGibbs), simulating the combustion process. Along with FUEL, INLET enters R-101-1 carrying the O2 with which the fuel is reacting. INLET is a mixture of O2 (from the ASU) and the flue gas recycle stream (RECYCLE) and is made up of about 26% O2, 54% CO2, 14% H2O and 6% other species, essentially Ar and N2. The combustion inside R-101-1 takes place at 1866 °C (in the case of petcoke), which means that the resulting flue gas, HOT-PROD, comes out of R-101-1 at this temperature. To maintain the boiler temperature at this temperature, a design spec was used to regulate the recycle ratio of the flue gas produced. Similarly, a design spec was used to maintain 3% excess oxygen (dry basis) to ensure complete combustion by controlling the flow through the ASU. HOT-PROD then passes through a heat recovery steam generator, represented by R-101-3, where it is cooled to 176 °C. A temperature of 176 °C is needed to avoid any condensation before the stream (COOLPROD) enters the bag filter, SOLIDSEP, where 99.8% of particulate matter is removed. The temperature is further increased to 185 °C as the stream enters a separator unit (SO2-SEP) that represents a flue gas desulphurization (FGD) unit, removing 98% of the sulphur dioxide (SO2) present in the flue gas, GAS-1 [17]. After removing SO2, the stream (GAS-2) enters a flash separator (V-104) to remove some H2O through condensation, resulting in a flue gas that is about 75% CO2, 16% H2O, 2.6% O2 and 2.8% Ar (GAS-4). Approximately, 70% to 75% of GAS-4 is recycled back into R-101-1 as RECYCLE to maintain the required combustion temperature; and the remaining FLUE-GAS is sent into the CO2CPU for further processing, as will be described later in this section.

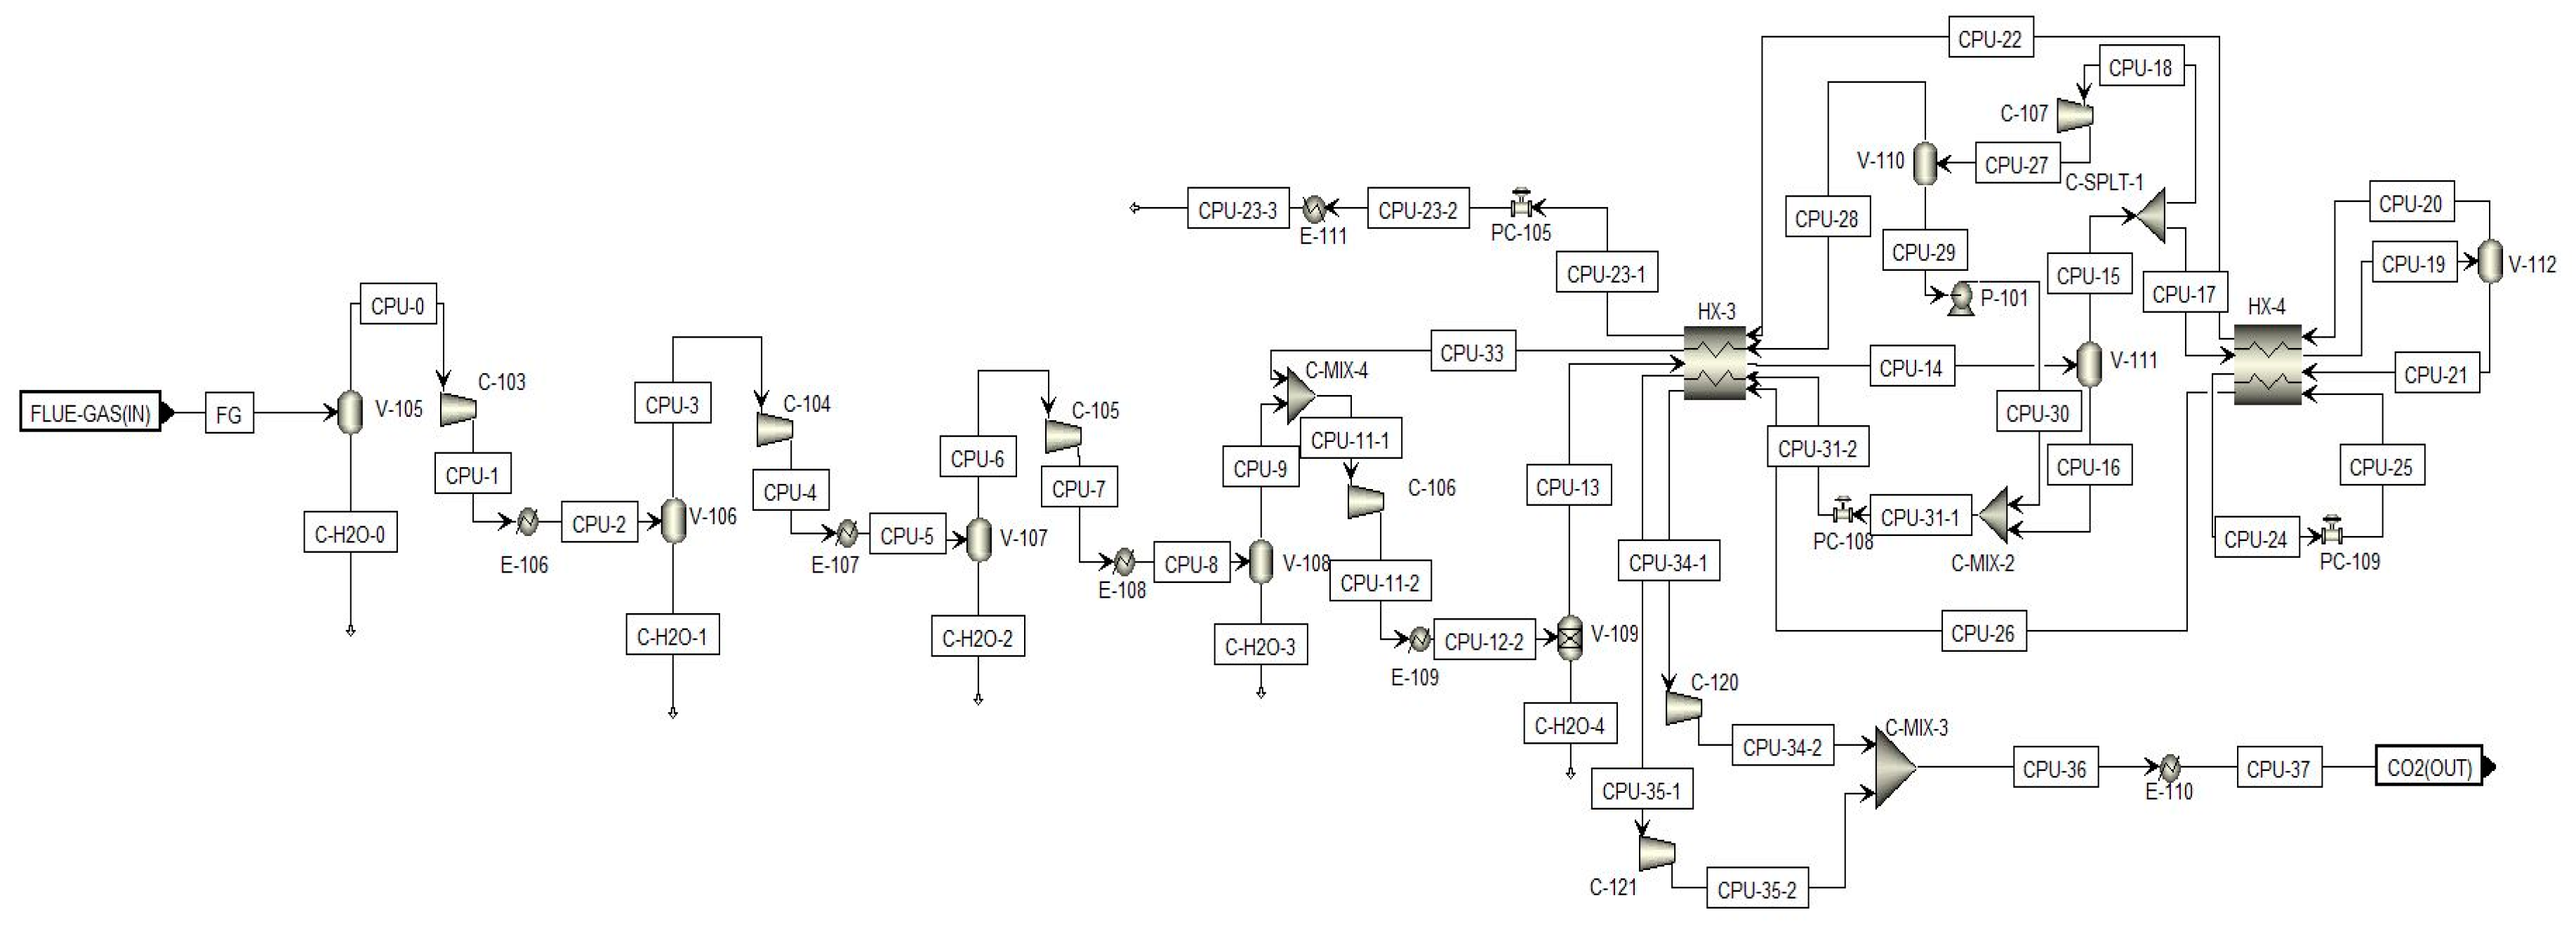
2.1.2. CO2 Capture and Purification Unit (CO2CPU)

The CO2CPU section is shown in Figure 3.
The CO2CPU is comprised of two sections: the first section consists of multistage compression with intercooling and the second section consists of cooling and compression to bring the pressure of the final concentrated CO2 stream to 110 bars. The first section contains four compressors: the first three compressors sequentially take the flue gas (FLUE-GAS) to 5, 10 and 15 bars. The flue gas is then mixed with a recycle stream and compressed to 30 bars using the fourth compressor. The stream temperature is 35 °C at the end of the compressor train. To completely remove water and impurities, the second section couples two multi-stream heat exchangers and expanders to cool down the stream to −38 °C. Impurities are then removed using flash separation before the final stream is pressurized to 110 bars. More information can be found in [15]. It is important to mention that when the operating pressure of the CBS section is increased, it reduces the need for compressors in the first section of the CO2CPU. For example, when the boiler operates at 5 bars, the first compressor will be removed in the CO2CPU. Therefore, the operating pressure considered in the CBS section is varied between 1 and 15 bars.

2.2. Economic Model

While various economic assessments of oxy-fuel developments are available, differences result from the calculation basis, variation in costs, policies and legislation among jurisdictions. With no commercial oxy-fuel plants available yet, there is also considerable uncertainty in regards to costs, efficiency and CO2 utilization [27]. However, comprehensive reviews comparing techno-economic studies of carbon capture technologies published by Kanniche et al. [28] and Rubin et al. [29] assessed the current cost of CO2 capture technologies in comparison to government reports published up to a decade ago.
The main outcomes of this economic model are the levelized cost of electricity (LCOE), cost of CO2 avoided, and cost of CO2 captured as calculated by Equations (1), (3) and (4) respectively. All costs are reported in 2017 US dollars (USD).
L C O E = C C F P ( Total   Capital   Cos t ) + 0.16 F C I + 1.55 C O L + 1.03 ( C R M + C W T + C U T ) C F ( E )
CCFP is the capital charge factor discounted over the plant’s lifetime, which is calculated using Equation (2).
C C F P = i ( 1 + i ) n ( 1 + i ) n 1
where i is the fractional discount rate, and n is the plant’s lifetime in years. FCI is the fixed capital investment (USD) which is the total investment cost of the plant, COL is the annual cost of labour (USD/year), CRM is the annual cost of raw material (USD/year), CWT is the annual cost of waste treatment (USD/year), CUT is the annual cost of utilities (USD/year), CF is the capacity factor and E is the electrical power throughput (MWe).
Cos t   of   CO 2   Avoided   = L C O E L C O E CO 2   Emitted   without   CO 2   Capture     CO 2   Emitted   with   CO 2   Capture
Cos t   of   CO 2   Captured   = L C O E L C O E CO 2   Captured
LCOE’ is the levelized cost of electricity for an atmospheric air-fired power plant without CO2 capture discounted at the same interest rate and time-period as the LCOE. In Equations (3) and (4) the CO2 emitted and captured terms are in metric tonnes/year.
The procedure for calculating FCI and cost of manufacturing (COM) is taken from [20]. The COM is composed of direct costs (e.g., labour, raw materials), fixed costs (e.g., depreciation) and general expenses (e.g., administration costs) and is calculated using Equation (5), where COL is the cost of operating labour, CUT the cost of utilities, CWT the cost of waste treatment and CRM the cost of raw materials. CUT was taken as 1.7% of installed cost [30].
COM   = 0.280   FCI   + 2.73   C O L + 1.23   ( C U T +   C W T +   C R M )
These require specifications pertaining to the size of equipment, material of equipment, and cost of raw material, labour and utilities. For brevity, cost of equipment, sizing, and material used are provided in the supplemental information (Table S1). Since the economic analysis was performed for the USA and the KSA, the discount rate, cost of labour, and raw material were different in both cases. Table 2 provides a summary of the assumptions used in the economic model.

3. Results and Discussion

3.1. Simulation Results

3.1.1. Atmospheric Oxy-Petcoke Combustion

Using the flowsheet and conditions discussed in the methodology section, the oxy-combustion of petcoke and coal were simulated at a combustion temperature of 1866 °C and 1830 °C, respectively. The main simulation results are shown in Table 3, while Table 4 presents the composition of the flue gas produced by the combustion before being cleaned, dried and processed.
Table 3 shows that despite a higher net power in the case of petcoke, the net efficiency for oxy-petcoke at 1 atm is lower than that of oxy-coal combustion by nearly 2%. This is due to the higher heating value of petcoke than that of coal. The higher net power output achieved with petcoke is due to the lower oxygen requirement (hence lower ASU duty), and lower gas flow rate to be treated in the CO2CPU (hence lower CO2CPU duty). However, the case of petcoke requires a higher recycle ratio. Comparison between the two petcoke scenarios reveals the effect of the AFT on the plant performance. The lower AFT (1830 °C) leads to a slightly higher net efficiency (27.2% vs. 27.1%) than at the higher AFT of 1866 °C. The reason is that when decreasing the AFT, the ASU duty remains almost unchanged while CO2CPU duty decreases because of the larger recycle ratio at lower AFT.

3.1.2. Pressurized Oxy-Petcoke Combustion

Oxy-petcoke combustion was simulated at operating pressures between 1 and 15 bars by increasing the pressure at which the oxygen and fuel are introduced into the system. Since the ASU and CO2CPU are the major power-consuming units, they have the largest effect on plant efficiency. Figure 4 illustrates the power consumption of the ASU, CO2CPU, net power and the net efficiency with changes in the operating pressure.
Increasing the operating pressure increases the power requirement of the ASU due to additional compression requirement for the O2 stream. On the other hand, the CO2CPU requires fewer compressors since the flue gas enters at an already elevated pressure. According to Figure 4, the net efficiency increases as the pressure increases above 1 bar, but appears to reach a plateau of ~28.5% at 10 bars. At a constant gross power, the net power output goes through a maximum between 5 and 10 bars. The overall conclusion from Figure 4 is that operating at 10 bars offers conditions of both high net power and high net efficiency.

3.2. Economic Evaluation

The economic model was used to assess operation in the USA and the KSA. Primarily, as mentioned previously, the differences will be due to the cost of raw materials, labour and the discount rate (shown in Table 2). Furthermore, the effect of varying pressure will be similar in both regions; hence, the differences in total investment and operating costs with pressure is only shown for USA.

3.2.1. Economic Analysis of Oxy-Petcoke Power Plant in the USA

The economics of oxy-petcoke combustion were studied over various pressures (1, 5, 10 and 15 bars). It should be noted that changing the operating pressure can change both the total capital cost and the cost of manufacturing (COM). Table 5 shows costing of oxy-petcoke plant at different operating pressures. The total capital cost is the sum of all the bare module costs and the other indirect costs associated with the installation of equipment.
The majority of the equipment cost comes from the ASU and the CBS followed by the CO2CPU and BOP. Variations in the operating pressure lead to changes in total cost of only the CBS, ASU and CO2CPU sections. Where the CBS experiences changes in only equipment sizing, the ASU and CO2CPU sections experience changes in equipment sizing as well as the number of compressors used. With increasing pressure, compressors need to be added to the ASU and correspondingly removed from the CO2CPU. Generally, increasing pressure results in reduced equipment size and increased wall thickness. Hence, pressure allowance for equipment cost comes from two sources: one is the size of the equipment and the other is a pressure factor for the wall thickness of the equipment (details in [20]). For the combustor in the CBS (responsible for major costs in that section), the wall thickness pressure factor has a moderate effect on cost up to 10 bars, but its effect increases notably above 10 bars [20]; therefore, the reduction in total capital cost up to 10 bars is mostly due to a decrease in equipment size. However, further increases in pressure (beyond 10 bars) increases the cost because of additional cost related to much thicker equipment walls. The non-linear trend in the cost of the CBS section is due to the cost of the flash vessel ‘V-104’, which, in the operating pressure range (1−15 bars), faces cost changes because of vessel size and vessel wall thickness. Hence, the reduction in cost due to vessel size is offset by an increase in cost due to vessel wall thickness. Since the correlations for cost and size, and cost and wall thickness are non-linear, the effect of increasing pressure on the total cost of the vessel is non-linear.
The change in cost of the ASU and CO2CPU is primarily due to the addition and removal of equipment rather than changes in equipment size. Since compressors are added to the ASU with increasing pressure, its cost increases. Likewise, since compressors and heat exchangers are removed from the CO2CPU at high pressures, its cost decreases.
It is clear from Table 5 that high-pressure operation (10−15 bars) is desirable as the lowest costs are all found at 10 bars. The lowest LCOE cost of 9.37 cent/kWh is achieved at 10 bars. Furthermore, at 10 bars, the cost of the CO2 avoided is 65.13 USD/tonne versus 65.97 USD/tonne at 15 bars; and the cost of capturing CO2 is 44.79 USD/tonne compared to 45.37 USD/tonne at 15 bars. These values are within 2% of each other, and given the similar LCOE value, it means that operating between 10 and 15 bars should be economically optimal for an oxy-petcoke power plant built in the USA.

3.2.2. Economic Analysis of Oxy-Petcoke Plant in the KSA

Assumptions pertaining to cost of labour, electricity, and interest rate are given in Table 2. These assumptions do not change the total capital cost of the plant, hence total capital cost is not reported here, as it is the same as that of a plant in the USA. However, the cost of manufacturing (COM) will change due to the change in cost of operating labour (COL); which in turn will change LCOE, LCOE’, cost of CO2 captured, and cost of CO2 avoided (see Equations (1)−(4)). Therefore, data pertaining to only LCOE, and cost of CO2 avoided and captured are reported in this section (Table 6).
As was the case in the USA, the lowest LCOE, as well as the lowest costs of CO2 avoided and captured are found for an operating pressure of 10 bars. However, the costs are lower for the KSA because of lower discount rate and cost of labour (see Table 2). For example, at 10 bars, LCOE decreases by ~37% in the case of the KSA compared to that of the USA, and costs of CO2 avoided and captured decrease by ~65%.
Since the costs (LCOE, CO2 captured and avoided) are lowest for operation at 10 bars, sensitivity analysis was performed at 10 bars. Figure 5 and Figure 6 show the effect of total capital cost, cost of raw material and cost of labour on LCOE and cost of CO2 avoided for the USA. Note that in the case of petcoke price, the sensitivity analysis was performed using an absolute change in cost (from 0 to 50 USD/tonne [33]) rather than percentage change in cost.
Figure 5 and Figure 6 are sensitivity plots and show that percentage changes in the operating labour, waste treatment and utilities costs have an insignificant effect on the LCOE and cost of CO2 avoided. Compared to other costs (total capital cost and raw material), these costs are small and hence they do not have a substantial effect. Figure 5 shows that the percentage change in LCOE increases linearly with the absolute cost of petcoke. At a cost of 50 USD/tonne, the LCOE increases by 22.6%, i.e., from 9.4 to 11.5 cent/kWh. Figure 6 shows that the absolute cost of petcoke does not affect the cost of CO2 avoided. This is because LCOE and LCOE’ increase by the same factor when the cost of petcoke is increased, therefore the changes cancel each other (see Equation (3)).

4. Conclusions

The main conclusions for this work are summarized below (recalling that the basis for all simulation is a constant gross power of 792 MW):
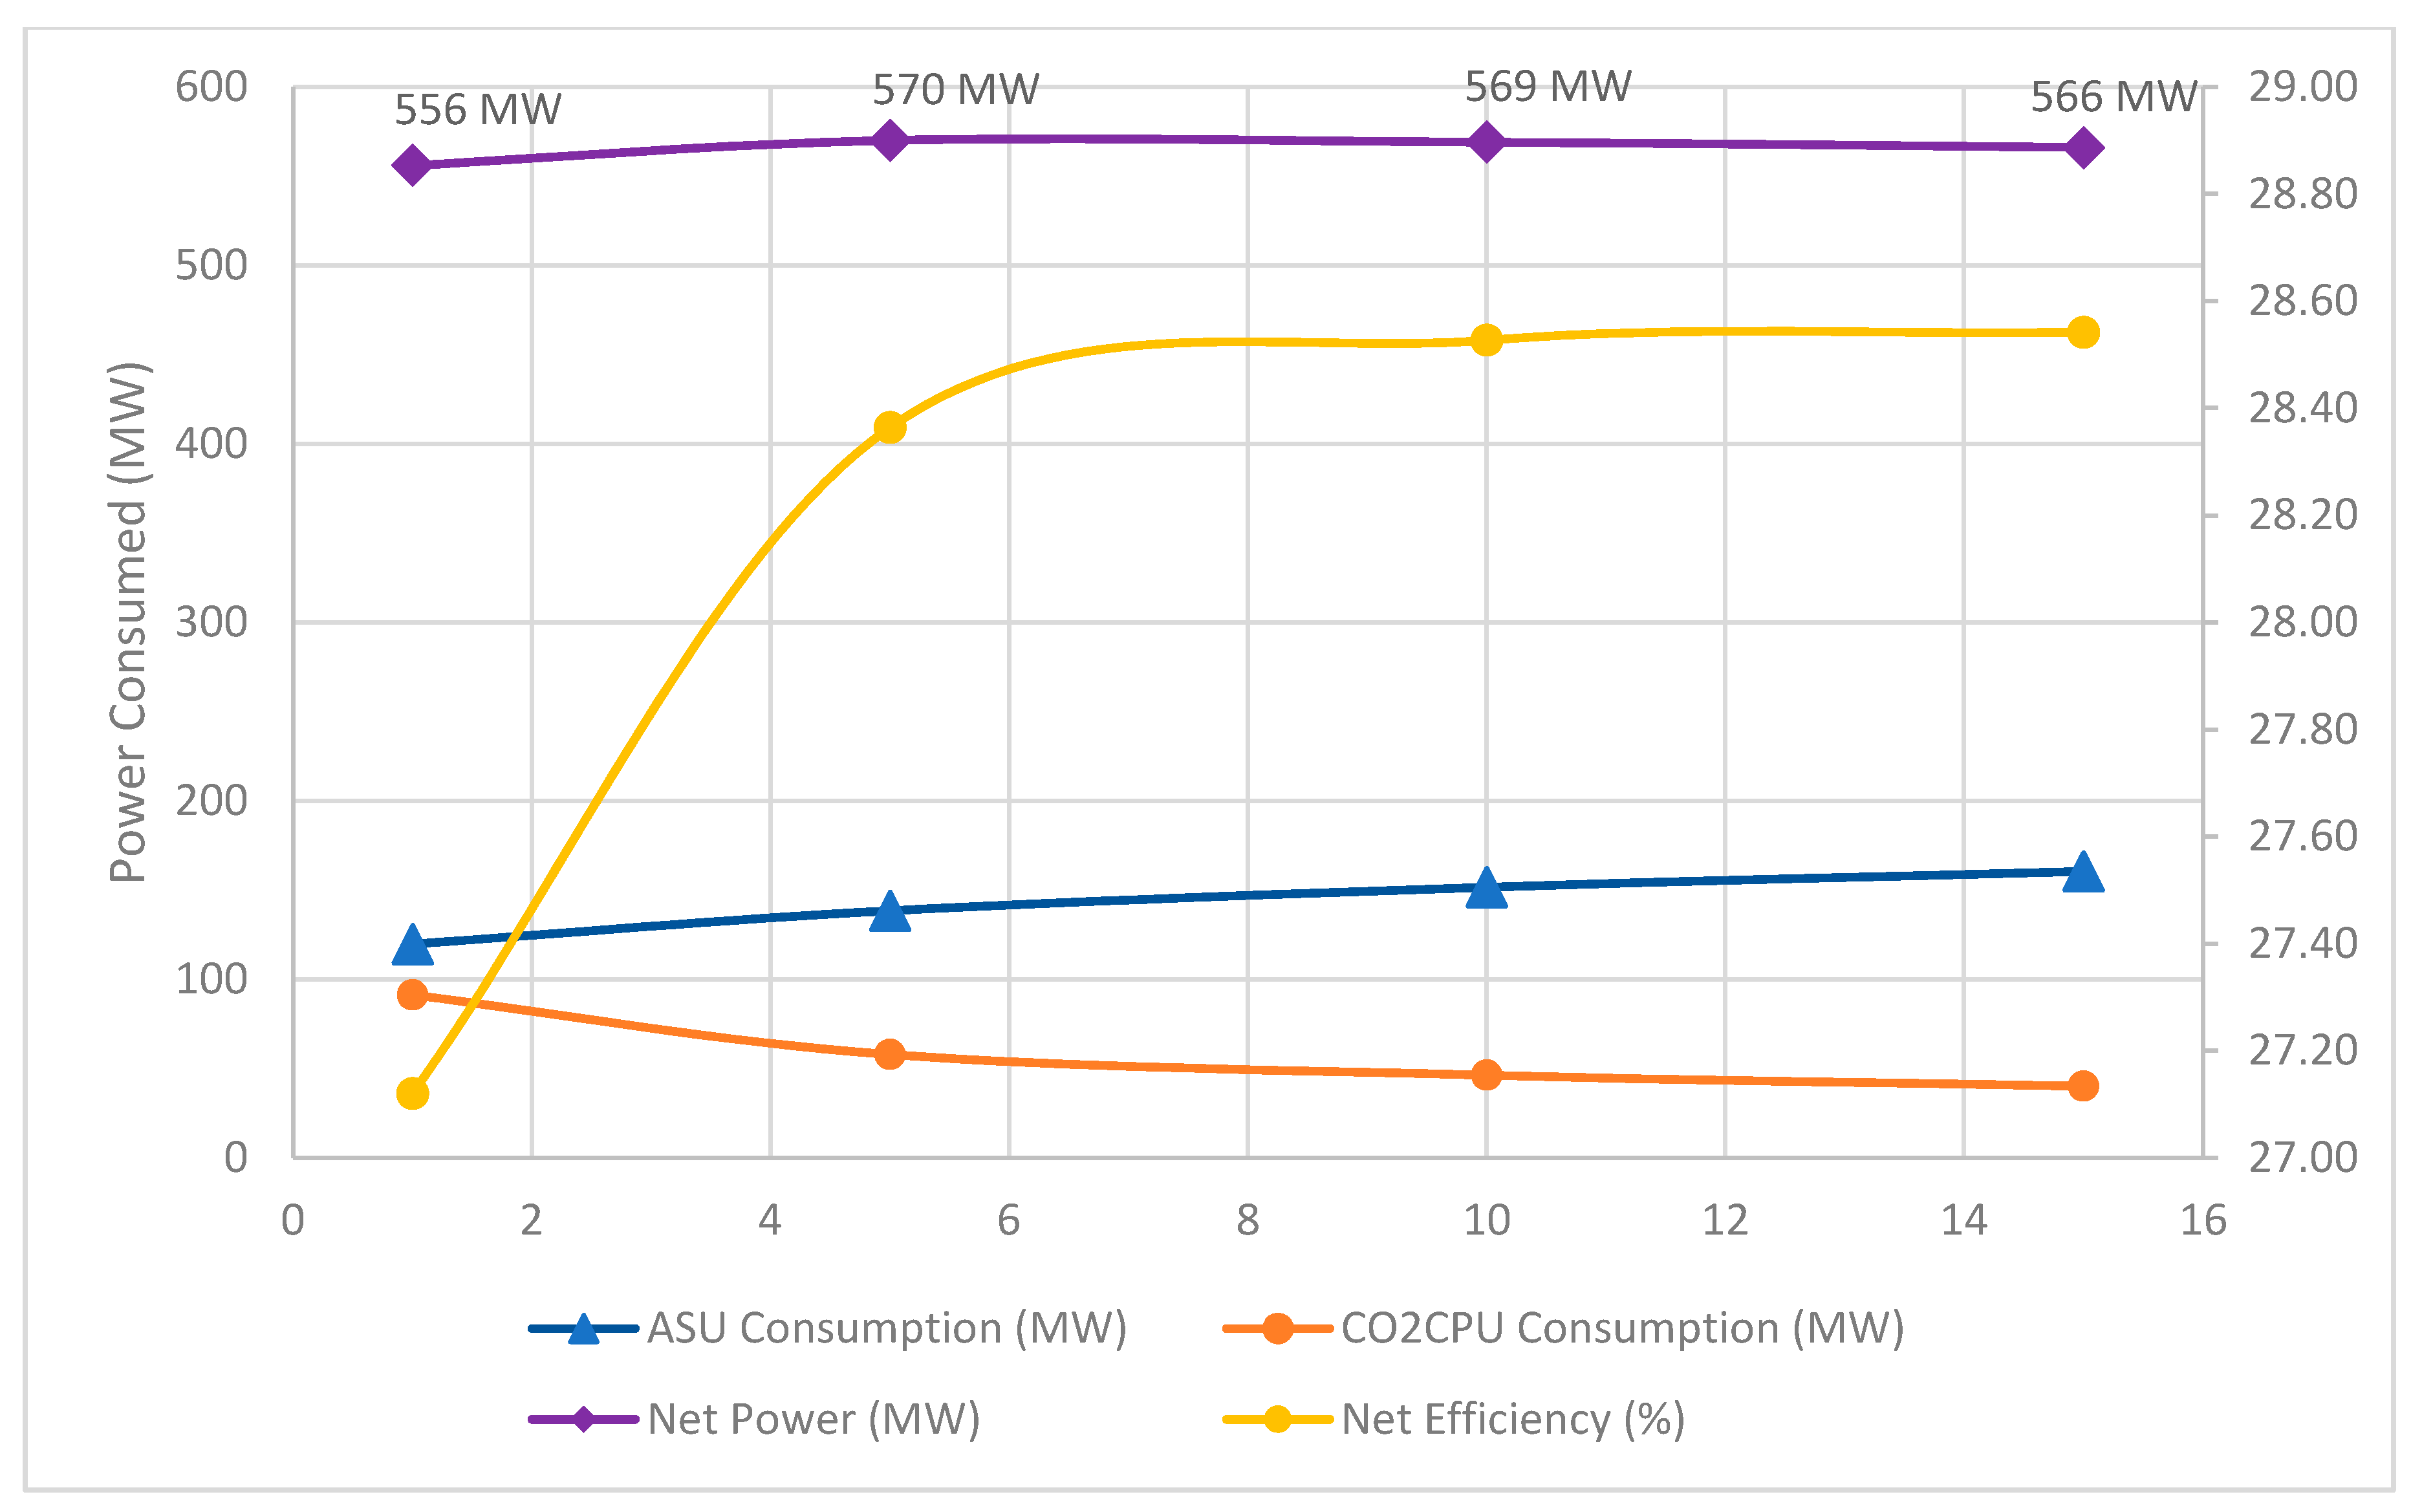
  • There appears to be an optimum pressure (at ~10 bars) which maximizes the plant efficiency, plant net power output, and minimizes the LCOE, cost of CO2 avoided and cost of CO2 captured for both the USA and KSA scenarios. This is due to reduced overall power consumption at high pressure. When the pressure is increased, there is a power balance between ASU and CO2CPU. The reduction in CO2CPU power requirement is higher than the increase in ASU power requirement for operating pressure above 1 bar.
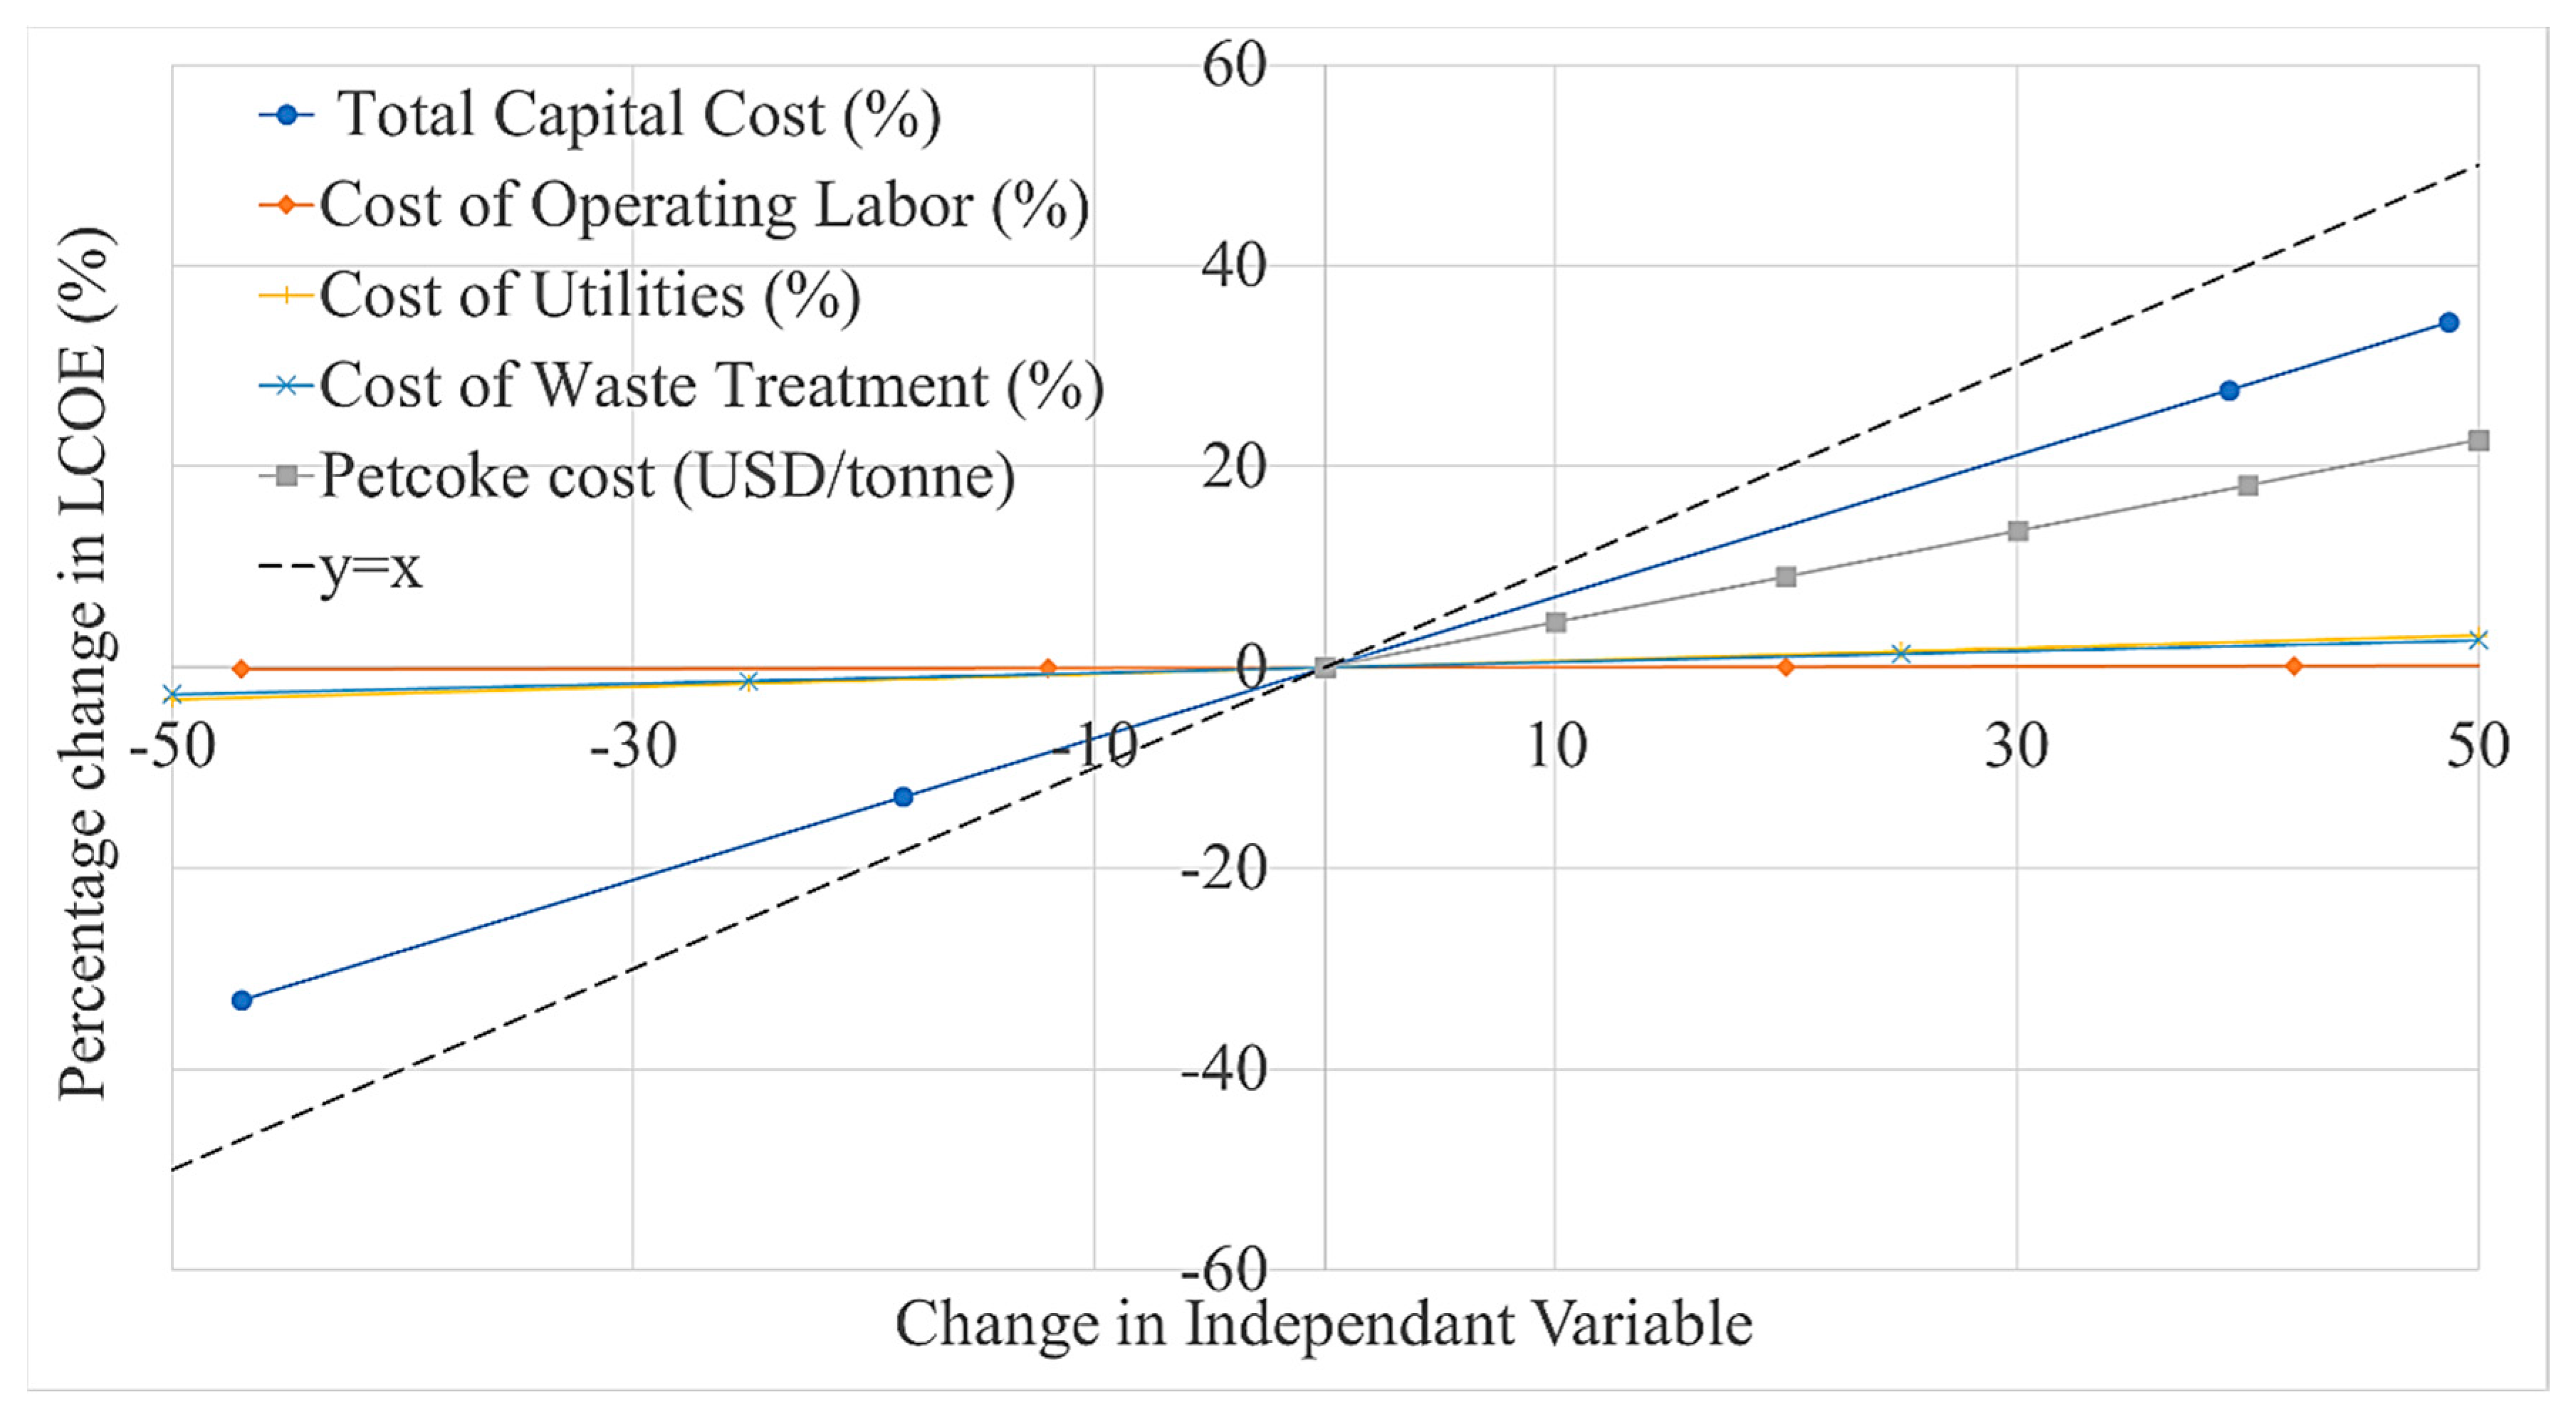
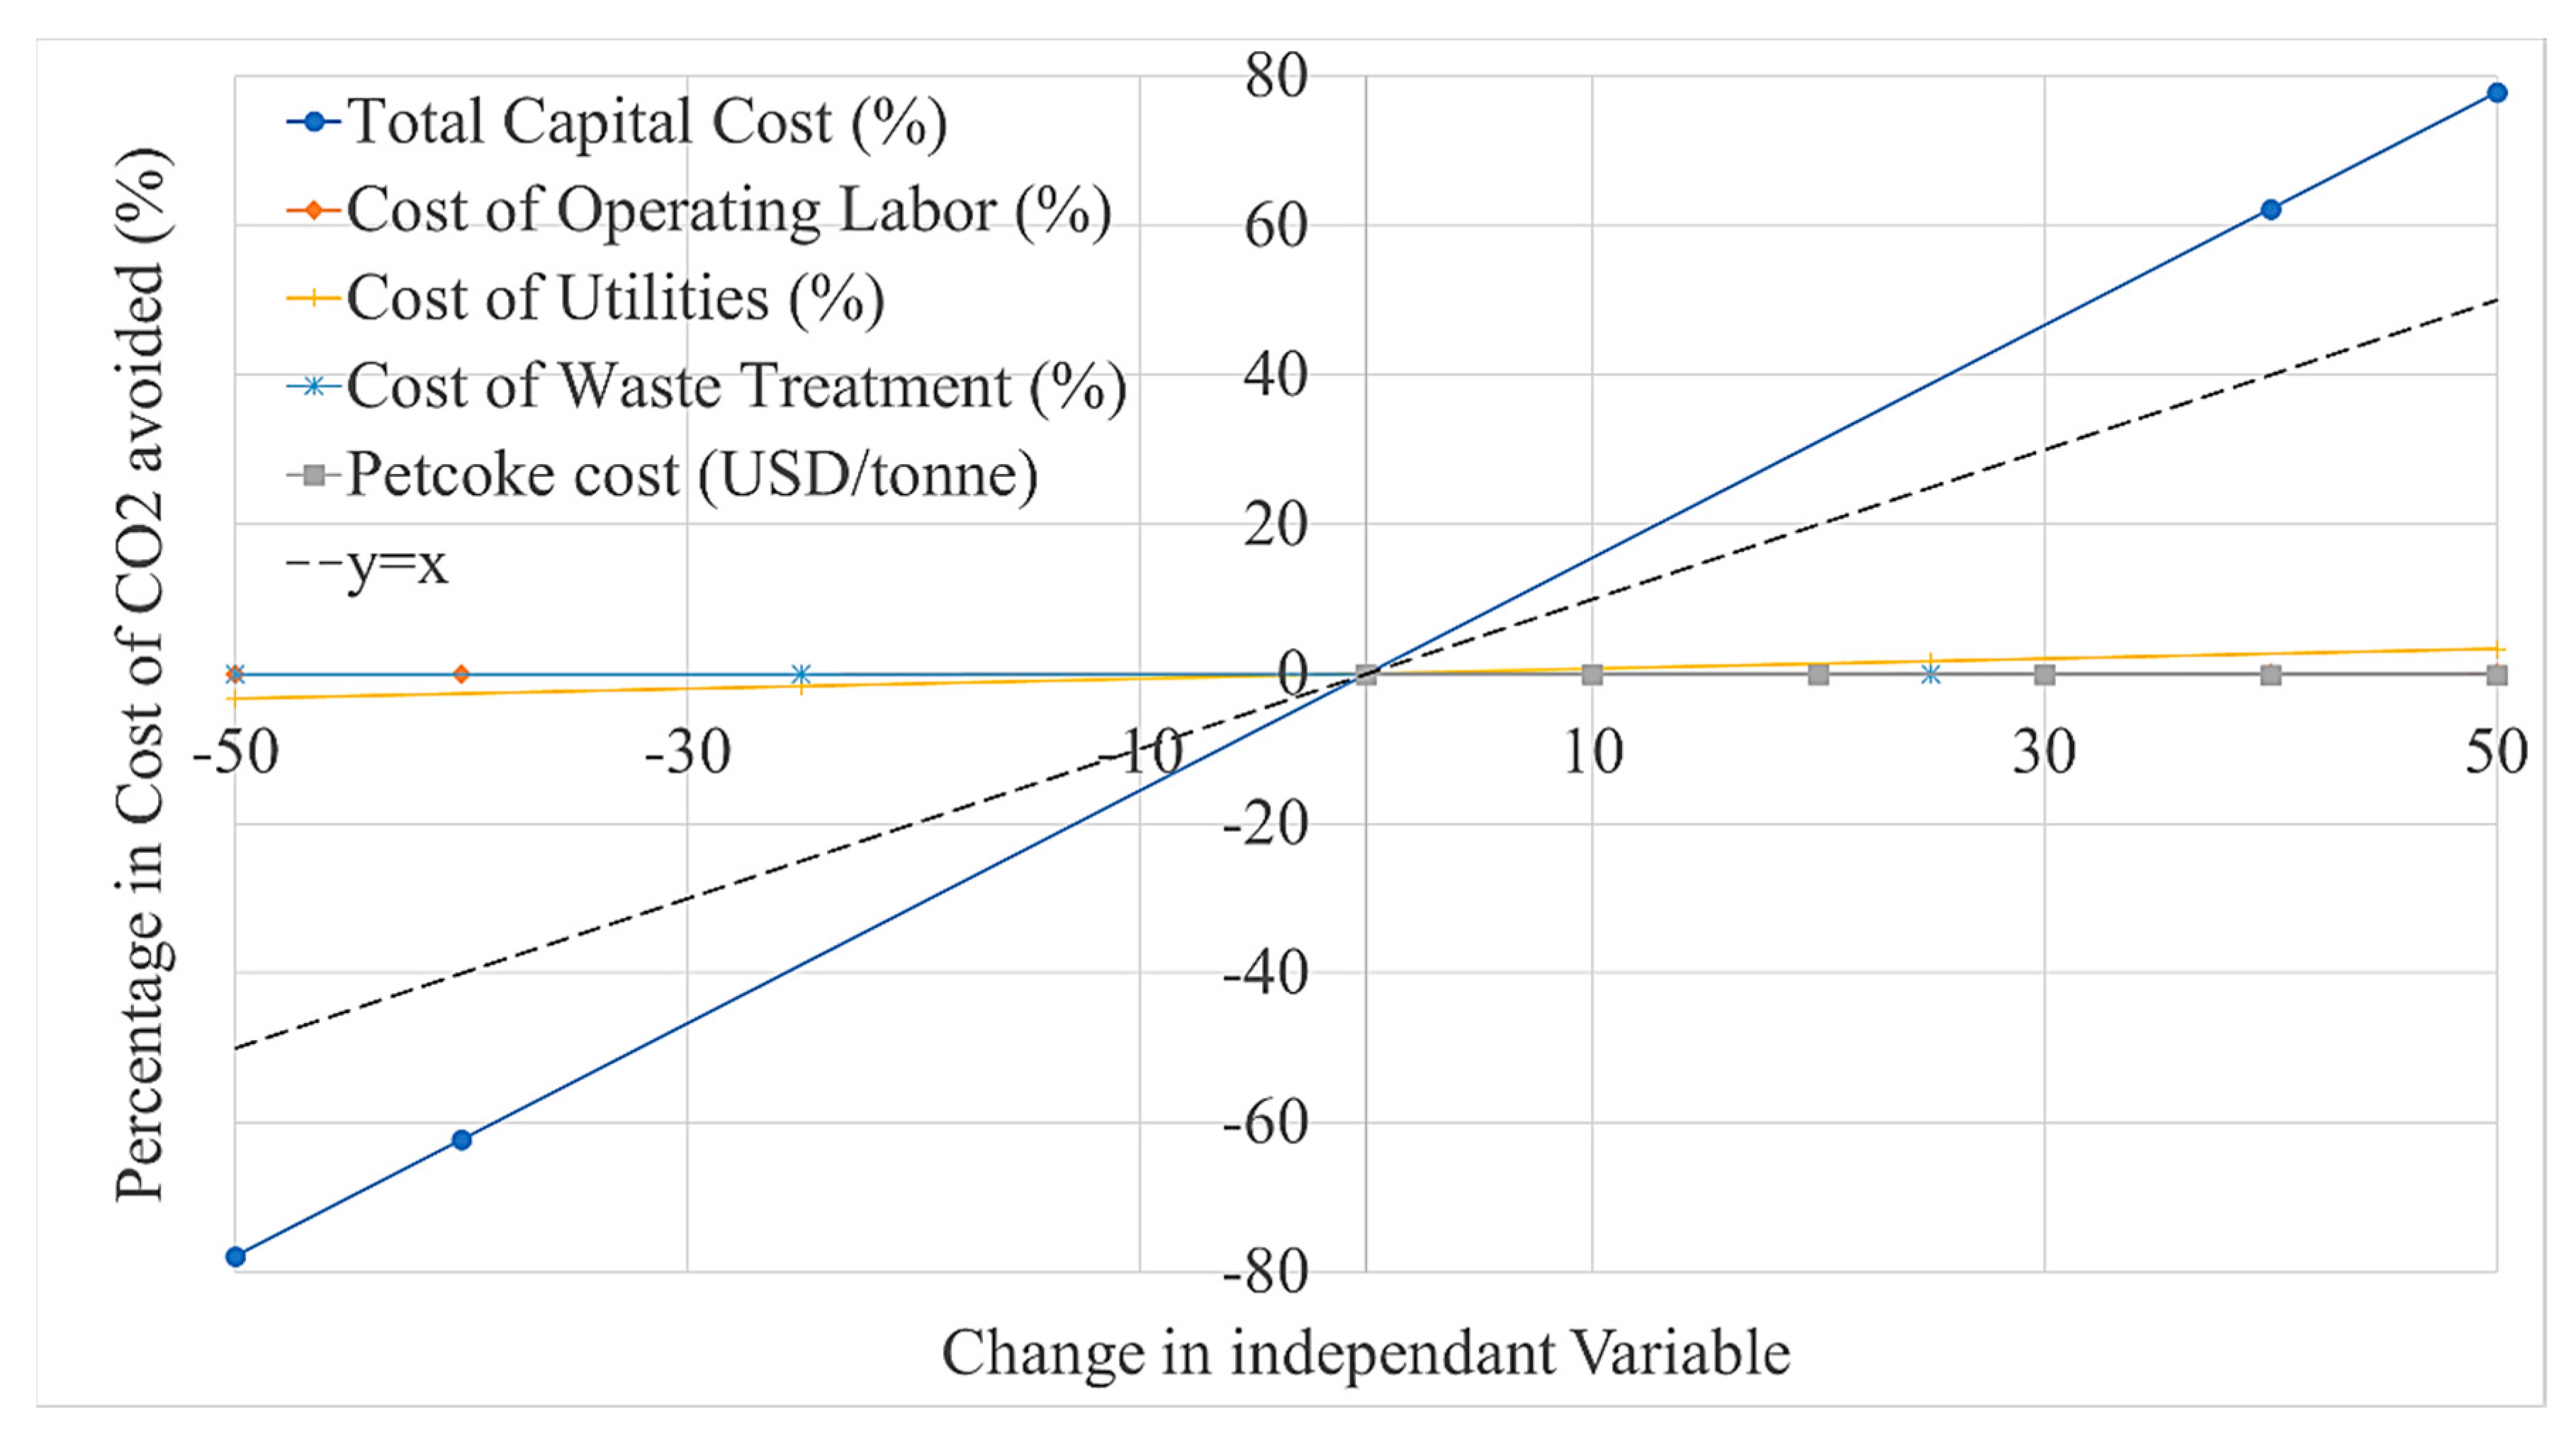
  • A sensitivity analysis shows that the LCOE moderately increases when increasing the capital cost of the plant (~0.7% per %) and the cost of petcoke (~0.5% per USD/tonne), but is insensitive to the costs of labour, utilities and waste treatment.
  • Costs are lower for the KSA scenario because of the lower interest rate and cost of labour.
Oxy-fuel combustion of petcoke is not as efficient as that of coal (27.1% net efficiency for petcoke vs. 28.9% for coal at 1 bar), but leads to higher net power output, the reason being that petcoke oxy-combustion requires lower ASU and CO2CPU duties than in the case of coal.

Supplementary Materials

The following are available online at https://www.mdpi.com/1996-1073/13/13/3463/s1, Figure S-1: Aspen Plus simulation flowsheet of the ASU, Figure S-2: Aspen Plus simulation flowsheet of the BOP, Figure S-3: Aspen Plus simulation flowsheet of the CO2CPU, Table S-1: Equipment description and material of construction for ASU, CBS, BOP and CO2CPU.

Author Contributions

Conceptualization, S.M.S. and R.W.D.; methodology, H.H., E.C. and P.L.D.; software, H.H. and S.Y.T.; formal analysis, H.H. and S.Y.T.; investigation, H.H. and S.Y.T.; resources, E.C. and P.L.D.; writing—original draft preparation, S.Y.T. and E.C.; writing—review and editing, P.L.D. and S.M.S.; visualization, H.H. and S.Y.T.; supervision, E.C. and P.L.D.; project administration, S.M.S., R.W.D., E.C. and P.L.D.; funding acquisition, S.M.S. and R.W.D. All authors have read and agreed to the published version of the manuscript.

Funding

This research was funded by the International Partnership for Carbon Neutral Combustion (IPCNC) program, King Abdullah University of Science and Technology (KAUST).

Conflicts of Interest

The authors declare no conflict of interest. The funders had no role in the design of the study; in the collection, analyses, or interpretation of data; in the writing of the manuscript, or in the decision to publish the results.

References

  1. Stockman, L. Petroleum Coke: The coal hiding in the Tar Sands. Oil Chang. Int. 2013. Available online: http://priceofoil.org/content/uploads/2013/01/OCI.Petcoke.FINALSCREEN.pdf (accessed on 1 July 2020).
  2. The Engineering ToolBox(2003) Fuels—Higher and Lower Calorific Values. Available online: https://www.engineeringtoolbox.com/fuels-higher-calorific-values-d_169.html (accessed on 11 January 2020).
  3. IPCC. IPCC Special Report on Carbon Dioxide Capture and Storage; Metz, B., Davidson, O., de Coninck, H.C., Loos, M., Meyer, L.A., Eds.; Prepared by Working Group III of the Intergovernmental Panel on Climate Change; Cambridge University Press: Cambridge, UK; New York, NY, USA, 2005; p. 442. [Google Scholar]
  4. Chen, L.; Yong, S.Z.; Ghoniem, A.F. Oxy-fuel combustion of pulverized coal: Characterization, fundamentals, stabilization and CFD modeling. Prog. Energy Combust. Sci. 2012, 38, 156–214. [Google Scholar] [CrossRef]
  5. Uchida, T.; Goto, T.; Yamada, T.; Kiga, T.; Spero, C. Oxyfuel combustion as CO2 capture technology advancing for practical use - Callide oxyfuel project. Energy Procedia 2013, 37, 1471–1479. [Google Scholar] [CrossRef]
  6. Guedea, I.; Lupiañez, C.; Romeo, L.M. Exergetic comparison of different oxyfuel technologies. Int. J. Energy Environ. Eng. 2011, 2, 35–47. [Google Scholar]
  7. Fu, C.; Gundersen, T. Exergy analysis and heat integration of a coal-based oxy-combustion power plant. Energy Fuels 2013, 27, 7138–7149. [Google Scholar] [CrossRef]
  8. Hong, J.; Field, R.; Gazzino, M.; Ghoniem, A.F. Operating pressure dependence of the pressurized oxy-fuel combustion power cycle. Energy 2010, 35, 5391–5399. [Google Scholar] [CrossRef] [Green Version]
  9. Zebian, H.; Gazzino, M.; Mitsos, A. Multi-variable optimization of pressurized oxy-coal combustion. Energy 2012, 38, 37–57. [Google Scholar] [CrossRef] [Green Version]
  10. Soundararajan, R.; Gundersen, T. Coal based power plants using oxy-combustion for CO2 capture: Pressurized coal combustion to reduce capture penalty. Appl. Therm. Eng. 2013, 61, 115–122. [Google Scholar] [CrossRef] [Green Version]
  11. Gopan, A.; Kumfer, B.M.; Phillips, J.; Thimsen, D.; Smith, R.; Axelbaum, R.L. Process design and performance analysis of a Staged, Pressurized Oxy-Combustion (SPOC) power plant for carbon capture. Appl. Energy 2014, 125, 179–188. [Google Scholar] [CrossRef]
  12. Chen, S.; Yu, R.; Soomro, A.; Xiang, W. Thermodynamic assessment and optimization of a pressurized fluidized bed oxy-fuel combustion power plant with CO2 capture. Energy 2019, 175, 445–455. [Google Scholar] [CrossRef]
  13. Shi, Y.; Zhong, W.; Shao, Y.; Liu, X. Energy efficiency analysis of pressurized oxy-coal combustion system utilizing circulating fluidized bed. Appl. Therm. Eng. 2019, 150, 1104–1115. [Google Scholar] [CrossRef]
  14. Hagi, H.; Nemer, M.; Le Moullec, Y.; Bouallou, C. Pathway for advanced architectures of oxy-pulverized coal power plants: Minimization of the global system exergy losses. Energy Procedia 2013, 37, 1331–1340. [Google Scholar] [CrossRef]
  15. Shafeen, A. An Exergy-Based Framework for Efficiency Improvement for Integrated Oxy-Fuel Power Generation Systems with CO2 Capture; University of Waterloo: Waterloo, ON, Canada, 2014. [Google Scholar]
  16. Chen, H.T.; Wei, W. Efficiency enhancement of pressurized oxy-coal power plant with heat integration. Int. J. Energy Res. 2015, 39, 256–264. [Google Scholar] [CrossRef]
  17. DOE/NETL-2010/1405. Advancing Oxycombustion Technolgoy For Bituminous Coal Power Plants: An R&D Guide, Final Report, April 2012. Available online: https://www.netl.doe.gov/projects/files/AdvancingOxycombustionTechnologyforBituminousCoalPowerPlantsAnRDGuide_040112.pdf (accessed on 1 July 2020).
  18. Zanganeh, K.; Shafeen, A. Auto-Refrigerated Gas Separation System for Carbon Dioxide Capture and Compression. U.S. Patent Application 13/389, 2011. [Google Scholar]
  19. Towler, G.; Sinnot, R. Chemical Engineering Design Principles, Practice, and Economics of Plant and Process Design, 1st ed.; Butterworth-Heinemann: Oxford, UK, 2008. [Google Scholar]
  20. Turton, R.; Bailie, R.; Whiting, W.; Shaeiwitz, J. Analysis, Synthesis, and Design of Chemical Processes, 3rd ed.; Prentice Hall: Upper Saddle River, NJ, USA, 2009. [Google Scholar]
  21. Raibhole, V.N.; Sapali, S.N. Simulation and Parametric Analysis of Cryogenic Oxygen Plant for Biomass Gasification. Mech. Eng. Res. 2012, 2, 97. [Google Scholar] [CrossRef] [Green Version]
  22. Fu, Q.; Zhu, L.; Chen, X. Complete Equation-Oriented Approach for Process Analysis and Optimization of a Cryogenic Air Separation Unit. Ind. Eng. Chem. Res. 2015, 54, 12096–12107. [Google Scholar] [CrossRef] [Green Version]
  23. Alfred ong’iro, V.; Ismet Ugursal, A.M.; Al Taweel, G.L. Simulation of Combined Cycle Power Plants. Response 1995, 15, 105–113. [Google Scholar]
  24. Nazir, S.M.; Bolland, O.; Amini, S. Analysis of combined cycle power plants with chemical looping reforming of natural gas and pre-combustion CO2 capture. Energies 2018, 11, 147. [Google Scholar] [CrossRef] [Green Version]
  25. Nayak, R.; Mewada, R. Simulation of Coal Gasification Process using ASPEN PLUS. In Proceedings of the International Conference On Current Trends in Technology, Ahmedabad, India, 8–10 December 2011. [Google Scholar]
  26. AspenPlus Aspen Plus 2004.1: Getting Started Modeling Processes with Solids. 2004. Available online: https://www.coursehero.com/file/39509450/AspenPlus2004-Gettingstartedwithsolidspdf/ (accessed on 1 July 2020).
  27. Buhre, B.J.P.; Elliott, L.K.; Sheng, C.D.; Gupta, R.P.; Wall, T.F. Oxy-fuel combustion technology for coal-fired power generation. Prog. Energy Combust. Sci. 2005, 31, 283–307. [Google Scholar] [CrossRef]
  28. Kanniche, M.; Gros-Bonnivard, R.; Jaud, P.; Valle-Marcos, J.; Amann, J.M.; Bouallou, C. Pre-combustion, post-combustion and oxy-combustion in thermal power plant for CO2 capture. Appl. Therm. Eng. 2010, 30, 53–62. [Google Scholar] [CrossRef] [Green Version]
  29. Rubin, E.S.; Davison, J.E.; Herzog, H.J. The cost of CO2 capture and storage. Int. J. Greenh. Gas Control 2015, 40, 378–400. [Google Scholar] [CrossRef]
  30. IEA Greenhouse Gas R&D Programme (IEA GHG), “CO2 Capture in Low Rank Coal Power Plants, January 2006. Available online: https://www.google.com.hk/url?sa=t&rct=j&q=&esrc=s&source=web&cd=&cad=rja&uact=8&ved=2ahUKEwiVqpn7yLLqAhWQFogKHWNlCO4QFjAAegQIBRAB&url=http%3A%2F%2Fieaghg.org%2Fdocs%2FGeneral_Docs%2FReports%2F2006-1%2520Low%2520rank%2520coal%2520report.pdf&usg=AOvVaw2m9E-fZVNI_owdmWx_I82H (accessed on 1 July 2020).
  31. Doing Business in the Kingdom of Saudi Arabia: A Tax and Legal Guide. Available online: https://www.pwc.com/m1/en/tax/documents/doing-business-guides/doing-business-guide-ksa-2020.pdf (accessed on 1 July 2020).
  32. U.S Bureau of Labor Statistcs Occupational Employment Statistics. Available online: https://www.bls.gov/oes/current/oes518013.htm (accessed on 1 July 2020).
  33. EIA. Electric Power Mothly; EIA: Washington, DC, USA, 2018. [Google Scholar]
Figure 1. Typical oxy-fuel power plant [15].
Energies 13 03463 g001
Figure 2. Overall Aspen Plus oxy-combustion flowsheet for coal and petcoke.
Energies 13 03463 g002
Figure 3. Aspen Plus CO2CPU flowsheet.
Energies 13 03463 g003
Figure 4. Power consumption of ASU and CO2CPU, net power and plant efficiency with varying operating pressure, case for AFT of 1866 °C. Constant gross power of 792 MW.
Energies 13 03463 g004
Figure 5. Sensitivity analysis for LCOE in the USA.
Energies 13 03463 g005
Figure 6. Sensitivity analysis for cost of CO2 avoided in the USA.
Energies 13 03463 g006
Table 1. Composition of coal and petcoke.
Proximate Analysis (Dry Basis)CoalPetcoke
Fixed Carbon49.7%85.9%
Volatile Matter39.4%11.9%
Ash10.9%2.2%
Ultimate Analysis (water ash free)
Carbon71.7%80.8%
Hydrogen5.1%3.5%
Sulphur2.8%3.1%
Nitrogen1.4%1.6%
Chlorine0.3%0%
Ash10.9%2.2%
Oxygen (by difference)7.8%8.8%
Heating value (HHV) (MJ/kg)27.234.6
Table 2. Assumptions for the economic model.
ParticularUSAKSA
Plant Net Output (MWe) [17]550550
Capacity Factor (%) [17]8585
Economic Life of Plant (years) [17]2020
Discount Rate (%) [20,31] 17.55
Average Hourly Wage (USD/h) [32]31.718.5
Selling Price of Electricity (cent/kWh) [32]126.7
Selling Price of Captured CO2 (USD/tonne) [32]2020
Cost of Petcoke (USD/tonne)00
Table 3. Comparison of simulation results for the oxy-combustion of coal and petcoke.
ParameterCoalPetcokePetcoke
Adiabatic Flame Temperature, AFT (°C)183018301866
ASU Flow (kg/h)602,713545,523545,304
Fuel Flow (kg/h)247,829212,707213,158
Flue Gas Flow to CO2CPU (kg/h)752,661727,712728,077
Recycle Ratio (%)74.576.275.6
CO2 Purity (%)96.496.496.4
ASU Power Consumption (MW)132119.9119.8
CO2CPU Power Consumption (MW)93.790.891.3
Auxiliaries (MW)25.325.325.3
Gross Power (MW)792.1792.1792.1
Net Power (MW)541556.2557.0
Net Efficiency (%)28.927.227.1
Table 4. Composition of the flue gas stream after combustion (HOT-PROD in Figure 2) for oxy-coal and oxy-petcoke combustion.
ComponentMole Fraction (%)
CoalPetcokePetcoke
(AFT 1830 °C)(AFT 1830 °C)(AFT 1866 °C)
O22.42.52.5
CO1.31.41.8
CO271.774.173.7
H2O19.216.616.6
SO20.30.30.3
N22.12.22.2
Ar2.62.82.8
Table 5. Economic model results for oxy-petcoke plant at different pressures in the USA.
Parameter1 bar5 bars10 bars15 bars
Total Capital Cost (million USD)1545.91433.71417.11428
Bare Module Cost (million USD)
CBS267.3205.7215209.5
ASU451.6463.4470492.5
BOP51.351.351.351.3
CO2CPU93.983.654.644.1
Cost of Manufacturing (COM) (million USD)486.9405.4407.2411.1
Operating Labour (COL)1.121.121.121.12
Utilities (COL)26.324.424.124.3
Waste Treatment (COL)21.621.120.420.2
Raw Materials (CRM)0000
LCOE (cent/kWh)10.459.459.379.43
Cost of CO2 Avoided (USD/tonne)78.3266.165.1365.97
Cost of CO2 Capture (USD/tonne)53.8645.4644.7945.37
Table 6. Economic model results for oxy-petcoke plant at different pressures in the KSA.
Parameter1 bar5 bars10 bars15 bars
LCOE(cent/kWh)6.645.915.875.91
Cost of CO2 Avoided (USD/tonne)31.923.0422.5723.08
Cost of CO2 Capture (USD/tonne)21.9415.8515.5215.87

