Abstract
The spread of near-Zero Energy Buildings (nZEB) involves the employment of high performant air-conditioning plants where renewable sources can be integrated easily. In this context, heat pumps appear as a promising solution given their ability to exploit aerothermal, hydrothermal and geothermal sources and to supply both heating and cooling loads with the same device. In order to evaluate the energy performances in transient conditions, the actual winter (COP) and summer (EER) performance indexes, in the function of the sources’ temperatures and the capacity ratio (CR), have to be available. Nevertheless, heat pump manufactures often provide the trend of the performance indexes in the function of the temperatures of the sources specifically for nominal conditions, whereas the dependence of the performance indexes in the function of CR, that takes into account the part-load operation, is almost always not provided. Alternatively, specific technical standards suggest the use of a correction factor to modify nominal COP and EER for the attainment of the real performance indexes. In this paper, by using data from an experimental set-up equipped with air-water heat pumps, these correlations were tested and tuned. Winter results showed that correction factors suggested by standards have to be modified in the presence of a storage system. In summer, instead, a new correlation was developed to find a function between nominal and actual EERs in the function of CR by exploiting a similar approach employed for the COP calculation.
1. Introduction
Today, the need to use air-conditioning plants with low energy consumptions for heating and cooling applications is an important challenge for the attainment of high-efficient buildings [1]. Indeed, often the design of envelopes with reduced thermal energy requirements by using solutions such as green roof [2], Trombe walls [3] or wooden structures [4] is not a sufficient condition to achieve the near-Zero Energy Buildings (nZEB) label [5]. Conversely, the adoption of innovative technologies in air-conditioning plants allows for the attainment of high-efficient buildings [6], especially when renewable sources are integrated [7]. Heat pumps represent a valid solution to reduce the consumption of fossil primary energy, because these devices are able to exploit renewable sources rationally [8], and also, for the production of domestic hot water [9]. For instance, vapor compression heat pumps cycles require electricity for their operations [10]; therefore, fossil consumptions can be reduced by exploiting photovoltaic generators [11], often mandatory in the design of new buildings [12], and their coordination with other appliances allows for a rationalization of the demand-side management [13]. Moreover, the fossil contribution is further reduced by using the energy transferred with the aerothermal, hydrothermal or geothermal sources that, in many applications, can be considered fully renewable. Finally, heat pumps allow for the provision of cooling loads by exploiting the same device employed for heating applications. Cooling energy demands in buildings have shown the fastest growing trend, with an energy requirement of around 2000 TWh of absorbed electricity, with a correspondent CO2 emission increase of 30% detected in the last years [14]. Innovative technological solutions have been developed to attain a performance indexes improvement, also by means of the employment of “sui generis” working fluids. A suitable control system was developed in [15] to optimize the performance coefficient in heat pumps operating with transcritical CO2. Regarding the production of domestic hot water with heat pump water heaters, the thermal performances achievable by employing propane as a working fluid were investigated in [16]. Heat pumps, in fact, can be used efficiently also for sanitary purposes beyond heating and cooling applications [17]. The employment of CO2 as a working fluid allows for the production of water flow rates at higher temperatures, as indicated in [18], where the effects of outdoor air and water temperatures on the performances of heat pump water heaters were investigated. In [19], instead, the influence of mass flow rates and inlet temperatures of both the evaporator and gas cooler for heat pumps operating with transcritical CO2 were examined. In air-source heat pumps, a possible limitation is represented by the low outdoor temperatures that produce a worsening of the performance; for this purpose, in [20], an ejector employed in a heat pump system coupled with an economized vapor injection scroll compressor was considered. A comparison between the performances of a conventional air-source heat pump and a novel ground-source air heat pump for domestic heating was carried out in a cold climate [21]. Ground-source heat pumps, in fact, allow for the attainment of better performance indexes by exploiting the ground as a thermal sink or heat source [22], due to the favorable temperature levels. Moreover, a possible efficiency improvement can be obtained by combining heat pumps with active solar systems. Solar thermal collectors were used to improve the efficiency of ground-source heat pumps for heating applications [23]. Beyond the vapor compression heat pumps, other devices allow for the air-conditioning of buildings by exploiting absorption/desorption cycles: for instance, in [24], a straightforward thermodynamic model was developed to analyze the efficiency limit of different sorption systems. Recently, innovative technologies such as a hybrid compression-absorption heat pump to use in processes involving convective dryers [25] and magnetic reversible heat pumps to use in the automotive industry [26] were explored. The possibility to improve the coefficient of the performance by means of an expander to decrease the mechanical work absorbed by compressors was investigated in [27]. The influence of the heat exchanger’s efficiency on the coefficient of the performance of the air-source heat pumps was addressed in [28], whereas the effects of various economic factors on the evaluation of a critical coefficient of performance for different heat pump technologies was investigated in [29].
The heat pump performance indexes are difficult to generalize, because they vary noticeably based on the operating conditions [30]. With reference to the plate data supplied by manufactures, heat pumps modify their performance coefficients as a function of the source temperatures, especially when external air is used. However, also, the dynamic variation of the supplied power required to follow the thermal loads represents another factor affecting the real device efficiency. Indeed, heat pumps performance indexes depend on the capacity ratio (CR), defined as the ratio between the real supplied load (required from the users) and the load that could be provided if, at the same source temperatures, the device could operate in nominal conditions. Modern heat pumps, in fact, can modulate the provided power to maintain, for instance, the set-point temperature of a storage tank, but the modalities of how performance indexes vary with the CR are often not available. Consequently, a great uncertainty on the actual heat pumps’ efficiency on the operational field can be observed; the same unit can have very different consumptions depending on the local climate, settings and, also, building characteristics. In [31], these effects were investigated in-depth with reference to residential buildings where the same device provides both space heating and cooling. A relationship is carried out between heat pump performances and the related buildings, thanks to the integrated approach of building heating/cooling systems. The most important efficiency losses in ON/OFF heat pumps are due to the functioning in part-load mode; therefore, this aspect should be investigated deeply and understood fully. In [32], based on the measurement data of the real installation of an air-water heat pump, a significant decrease in the device energy efficiency during periods of low energy demand was observed. The uncertainties concerning the device efficiency were analyzed in [33] by following the procedures suggested by European and international standards in residential heat pumps testing. The performances in the part-load mode of residential heat pumps operating with different low global warming potential (GWP) refrigerants were determined in [34].
In order to overcome these limitations, in recent years, other technologies have been developed to use as an alternative to ON/OFF devices, such as the units with multi-stage compressors and heat pumps equipped with inverters to modulate the compressor velocity. However, since the latter can be reduced until a lower threshold (minimal modulation value), the same problems are also detected for these devices with lower CR. Regarding the ON/OFF regulations, the following studies have been carried out to determine the dependence of performance indexes on CR. In [35], the analyses concerning the transient response of an experimental air-water heat pump system during start-up conditions were carried out. The objective was to evaluate the losses associated with the ON-OFF cycling under different design and control conditions and to develop algorithms that accurately represent the performance of the system during transient operations. In [36], the impact of ON-OFF cycling losses on the seasonal energy performances of three reversible air-water heat pumps, having equivalent thermal performances at nominal conditions but different power modulation capacities, was discussed by means of a series of dynamic simulation models. In [37], the chiller performance estimated through a variation of the calculation method contained in the reference standard EN 14825 [38] was compared by using the monitored data taken during an entire cooling season, both in a small and a large HVAC system. In [39], the accuracy of the seasonal energy performance ratio (SEPR) estimations was compared to traditional hourly based calculations for centralized commercial refrigeration packs. In [40], starting from a standard measured performance map of the test points of a heat pump and by elaborating them in accordance to the EN 14825 procedure [38], some characteristic parameters to formulate a simplified correlation-based model were identified. In [41], the results obtained by a numerical simulation of a heating and cooling system based on a reversible air-water electric heat pump, equipped with an electric resistance as a back-up system, were presented. In accordance with the “bin method” procedure suggested by the EN 14825, the heat pumps’ performance indexes were determined by considering the influence of outdoor conditions and of the heat pump typology [42]. In particular, the evaluation of the dynamic heat pump performance was determined not only at energy level but considering also thermal comfort evaluations. For this purpose, a dynamic simulation model was developed and validated using experimental data obtained at various fan speeds of the external unit and with different compressor frequencies.
Nevertheless, other secondary factors affect the performance indexes, such as refrigerant charge and improper airflow, but these effects have not been taken into account in the present study, because the impact on the seasonal performances analyzed in [43] showed that a refrigerant charge increase at the rated airflow improves the unit’s heating seasonal performance by as much as 5%.
Since, from the analyzed literature, it is not clear how the CR affects the performance indexes in real operating conditions, in this paper, the data of an experimental set-up equipped with two air-water heat pumps were used to calculate a corrector factor depending on the CR to apply to the nominal values by following the same approach indicated by EN 14825 and implemented at the local level also by the national standard UNI/TS 11300-4 [44]. Thus, the nominal performance indexes take into account the effects connected with the source temperatures, whereas the correction factor considers the penalization due to the functioning in part-load mode. Successively, the proposed and the EN 14825 procedures were compared with experimental data in order to quantify the deviances with these simplified models. The same approach is suggested both for winter and summer operations that, despite the procedure proposed by the EN 14825 for cooling, and implemented at the local level by the standard UNI/TS 11300-3 [45], are different. Furthermore, the latter requires also the knowledge of the performance indexes for some discrete CR values, and often, it cannot be applied for the lacking of manufacturer data. Therefore, a procedure similar to the winter model allows for these limitations to be overcome. A similar approach was already investigated and validated in other documents [46], where the penalized summer performance index due to the functioning in part-load mode was related to the correspondent nominal value and a correction factor, the latter depending on the PLR (partial load ratio) [47]. PLR has a similar CR meaning, but it is calculated at a local level by relating the actual supplied load to the design power required by the considered building-plant system.
2. Materials and Methods
2.1. Definition of the Parameters Employed into the Proposed Model
In presence of air-water heat pumps investigated in this document, the performance indexes are the winter COP and summer EER, and both depend on the outdoor air temperature, because its level influences the extraction/rejection of the thermal energy. Moreover, the outdoor air temperature variations on a daily basis determine the performance indexes that vary dynamically. Consequently, manufacturers provide thermal/cooling powers and performance indexes for precise external air temperatures, and by fitting these values with a suitable function, these values can be determined for other temperatures. However, manufacturers provide the temperature dependence for heat pumps that operate specifically in nominal conditions (CR = 1). For instance, for air-water heat pumps in the heating application, in accordance to EN 14825, manufacturers provide nominal power and COP for outdoor air temperatures of −7 °C, 2 °C, 7 °C and 12 °C and water temperatures of 35 °C, 45 °C and 55 °C for the hydronic emitters [38]. Successively, these trends have to be modified opportunely when heat pumps operate in part-load mode (CR < 1) by introducing a penalization coefficient for the performance indexes, especially for ON-OFF functioning. Indeed, a major frequency of the switch-on/switch-off phases reduces the device efficiency due to transient effects, especially the restoration of the pressure fields inside the low-boiling fluid cycle. Moreover, the presence of parasitic electric consumptions can be still observed also when the device is OFF; therefore, this further reduces the performance indexes, as indicated in Equation (1), since the absorbed electric energy (E) is required for the COP and EER calculations:
It is worth noting that the COP is determined with reference to the thermal energy provided by heat pumps to the source with the lower temperature (Qprov), whereas EER refers to the thermal energy extracted from the source with the lower temperature (Qextr), which generally is considered negative in a heat transfer convention.
In order to overcome the drawbacks affecting the heat pumps with ON-OFF functioning, modern devices are able to modulate the provided thermal power to avoid issues due to an intermittent functioning, especially by using compressors equipped with inverters to regulate their speed. In such devices, despite a limitation of the supplied and absorbed powers, the performances are not penalized, because the heat exchangers result as being oversized, reducing the temperature difference between the evaporator and condenser, with a consequent efficiency growth. Nevertheless, the compressor velocity can be modulated up the minimal modulation value under which the performances indexes are newly penalized.
As mentioned, the manufacturers often do not provide the penalized thermal power and performance indexes for heat pumps operating in part-load mode; therefore, the EN 14825 suggests the employment of a correction factor (fC) to modify the nominal condition values. In particular, the actual winter performance index (COPreal) detected at a precise outdoor temperature θ in part-load mode can be calculated as:
where the fC for the air-water heat pumps is determined as [38,44]:
The CC coefficient is a penalization factor to take into account how the heat pump COP is modified when the CR is lower than the minimal modulation value, and it is set to a default value equal to 0.9 when manufacturers do not provide specific information. Equation (3) has to be used for every CR for the ON/OFF devices, whereas it is used only with CR lower than the minimal modulation value for modulating heat pumps. Regarding the capacity ratio CR, again, it varies dynamically depending on the nominal powers (QNOM) available at precise outdoor temperatures, and it is calculated with the relation:
In the summer, the EN 14825 approach is different than the procedure used for the calculation of the actual COP, because a correction factor to determine the EER in part-load mode is not required. The summer performance index, in fact, has to be determined by an interpolating curve built starting from the manufacturers’ data. However, the interpolating curve can be built if the EER values are available for precise CR and outdoor temperature values that, obviously, should be provided by the manufacturers. However, it is very difficult to find information concerning the performance attained in part-load mode in data sheets. In particular, the procedure requires the knowledge of EER for 4 different CR values: 1.00, 0.75, 0.50 and 0.25 and for different outdoor air temperatures (see Table 1 for air-water heat pumps) by setting the chilled water temperatures in the hydronic circuit. As a consequence, despite the functioning in part-load mode, the interpolating curve could show an EER maximum point with CR < 1, because it is determined with a favorable outdoor air temperature (see Figure 1). Moreover, when data are available, this approach leads to a broken line, which is difficult to interpolate, and, for CR lower than 0.25, the EER values were imposed by the standard in an aleatory way, independently from the air-water heat pump model [45].

Table 1.
Reference tests to determine the heat pump EER for different capacity ratio (CR) values [38,45].
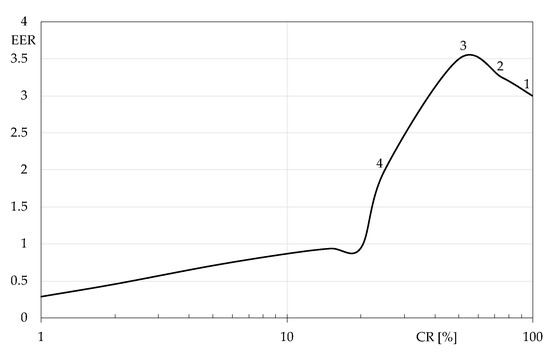
Figure 1.
Example of the EER trend in the function of the values listed in Table 1.
Due to the mentioned difficulties, a procedure homogenization among winter and summer operations to determine the actual performance indexes was proposed. In particular, by exploiting the observed data provided by an experimental set-up, a procedure to calculate the real EER starting from the correspondent nominal value and modified by means of a summer correction factor is introduced. Again, the correction factor has been related to the CR that, assuming the extracted thermal energy to be conventionally negative, is defined in the summer as:
2.2. Experimental Set-Up Description
A demonstrative bivalent air-conditioning plant equipped with heat pumps is installed at the University of Calabria (South Italy, Lat. 39.3° with typical Mediterranean climatic conditions, subtype Csa according to the Köppen climate classification) from 2018, and it is constituted by (see Figure 2):
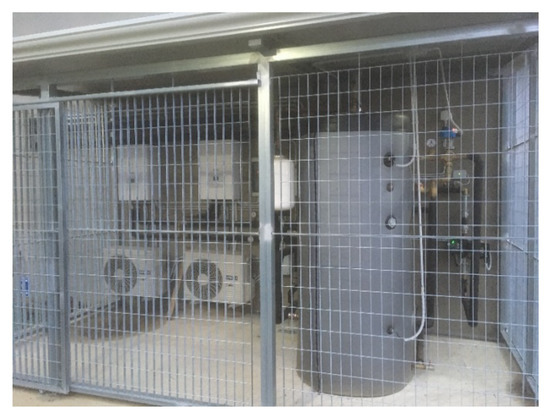
Figure 2.
Heat pumps with external units installed on the vertical wall (on the left) and an insulated vertical storage tank used in the demonstrative air-conditioning plant.
- N° 2 air-water heat pumps equipped with an inverter (Hitachi, Yutaki S series, RWM 2.0 model) and with a PV generator of 4 kWp,
- a cogenerative biomass boiler equipped with a Stirling engine as a back-up system,
- an 800-L thermal storage tank employed both for heating and cooling applications and
- radiant ceilings made by mineral fibers panel as the emission system.
The demonstrative plant is bivalent exclusively for winter functioning. Indeed, the biomass boiler, whose nominal thermal power is 14 kW, is an integrative system that intervenes when heat pumps cannot operate adequately due to lower outdoor air temperatures. However, in the monitored period, the integration system never switched on due to the favorable climatic conditions. Heat pumps and the storage tank were placed outside the building on an external wall (see Figure 2), whereas the integration system was installed inside for obvious operational reasons. During the design phase, two heat pumps were necessary to meet the unbalanced heating (14 kW) and cooling (5 kW) peak loads determined for the conditioned building. In the winter, when the required load is higher than the nominal power of a single heat pump, the second one intervenes to supply the remaining part, operating in a master-slave mode, whereas, in the summer, often, the employment of a single chiller is sufficient.
The thermal storage system is represented by a vertical highly insulated tank equipped with two heat exchangers: the first is connected at the bottom with the heat pumps and the second one at the top with the integration system. The radiant ceilings employed for the provision or the extraction of thermal loads are supplied by a water flow rate directly extracted from the storage tank in order to limit the temperature stratification effect. The storage tank set-point temperatures are 45 °C in the winter and 10 °C in the summer. In order to guarantee the tank thermal level, heat pumps operate with a fixed set-point of 50 °C in the winter and 7 °C in the summer. The control system allows the tank to be maintained at a constant temperature, and its thermal balance carried out at the hourly level showed negligible thermal losses. Thus, the measurement of the hourly thermal energy provided to the tank was considered as that requested by the users (Qprov in the winter and Qextr in the summer) because the steady-state conditions were achieved, allowing for the CR calculation. For this purpose, hourly thermal energies were measured by a heat counter installed on the heat pump hydronic circuit in a manner to involve both the heat pumps and, in the function of the temperature, the difference between the inlet and the outlet. For this reason, the Qextr value appearing in Equation (5) assumes negative values, and the CR is calculated with reference to the absolute value. The correspondent hourly thermal energy provided by heat pumps in nominal conditions (QNOM) are related to the hourly mean outdoor air temperature measured by an appropriate probe located far from the external units. For the nominal performances, an interpolating curve that fits the manufacturer data was built. In a simplified way, a linear trend was assumed and showed in Figure 3 with the manufacturer data and for the considered supplied water temperatures. The equations that relate the thermal powers and the performance indexes with the outdoor air temperature (by considering the real temperature field monitored in the experimental set-up for the latter only) resulted as:
for heating applications, whereas:
in cooling mode. The coefficients appearing in Equations (6)–(9) are those that better fit the manufacturer data by interpolating them with a linear correlation.
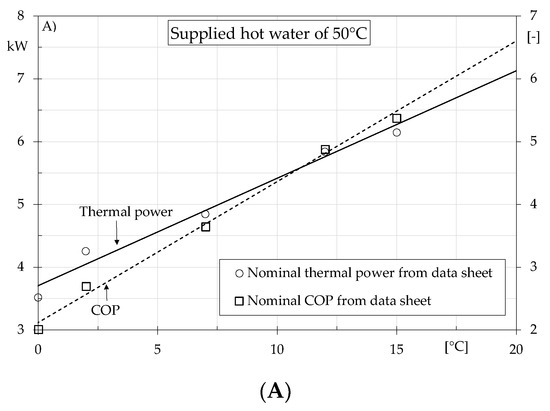

Figure 3.
Manufacturer data and linearized trends for the thermal power and the COP (A) and for the cooling power and EER (B).
A thermostat with a 1 °C dead band combined with a climatic control strategy was employed to regulate the indoor air temperature by adjusting the emitter supply water temperature. Obviously, this control strategy affects the extraction of thermal energy from the tank. In order to regulate the emitter’s inlet temperature, a motorized three-way valve recirculates a fraction of the returning flow rate to attain the desired temperature. In the summer, the same system, by means of an automatic control, is employed to maintain the inlet temperature always greater than the indoor dew point in order to avoid vapor condensation phenomena on the active ceiling surface.
Figure 4 shows the front panel (GUI) concerning the data acquisition system (DAQ) employed to monitor the main parameters of the air-conditioning plant, where the probe position is specified. It is worth noting the presence of heat counters on the hydraulic circuits of the heat pumps of the integration system and of the emission system. Moreover, two temperature sensors were installed at the bottom and the top of the storage tank to monitor the effects due to the temperature stratification. The DAQ was designed to determine the actual heat pumps’ performances, evaluating the monitored parameters both at the local (for control purposes) and at the hourly energy levels (for data storage). For the performance indexes calculation, apposite modules have been provided to measure the electric energy absorbed by the heat pumps (E) for a dynamic evaluation of the COP and EER.
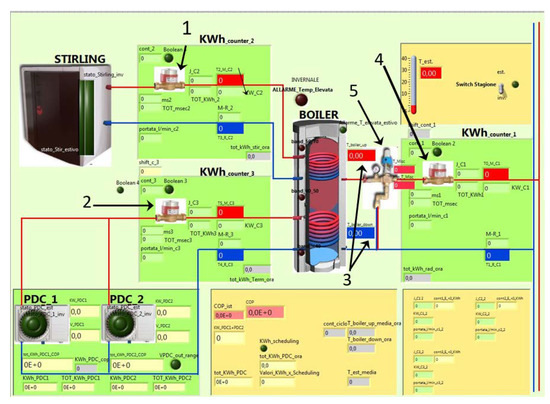
Figure 4.
Front end developed for the air-conditioning control and for data acquisition with the position of the different probes used for the experimental activity: 1 = integration system heat counter, 2 = heat pumps heat counter, 3 = temperature sensors, 4 = emitters heat counter and 5 = mixing valve, PDC = heat pump.
The DAQ was developed by using the dataflow programming language software LABVIEW® (Laboratory Virtual Instrument Engineering Workbench) suitable for data acquisition, data analysis and data presentation and DAQ hardware that includes a chassis communicating via TCP/Ip with LABVIEW and several conditioning modules. The main characteristics of the employed sensors are listed in Table 2. The data were recorded with hourly intervals; therefore, the involved parameters were determined as the hourly energy and mean temperatures detected in the considered intervals.
Table 2.
Main features of the sensors employed in the monitored air-conditioning plant.
2.3. Calculation of the Actual CR and the Correspondent Correction Factor
The inverse solution of Equation (2) allows for the calculation of the correction factor, which values were determined at an hourly level by dividing the actual performance indexes determined from the experimental data with the correspondent nominal values. Obviously, the first were determined with Equation (1), whereas the nominal COP and EER were computed with Equations (7) and (9), respectively. For this purpose, the hourly average outside air temperature was used. The capacity ratio was determined by means of Equations (4) and (5), where the numerator was determined experimentally, whereas the denominator was computed with Equations (6) and (8), again in the function of the mean average outside temperature. The linearized trends of the nominal parameters sometimes produced, by employing Equation (2) in the proximity of CR = 1, results slightly greater than the unity. In these circumstances, the fC was set to 1. Indeed, the calculation of the correction factors was affected by different sources of error:
- ⮚
- The linearization of the nominal COP produced an error in the fC evaluation further amplified when correlated to the correspondent CR, because the latter was also affected by the same error.
- ⮚
- The analyzed data referred to performances detected in the function of the hourly energies; however, in some operational situations, these energies were quantified also when the functioning occurred for some minutes by avoiding the attainment of the regime operative conditions, with a correspondent worsening of the device efficiency denoted by penalized COP and ERR values.
- ⮚
- Since the data were recorded at hourly levels, slight variations of the outdoor air were detected inside the same interval, whereas the nominal value referred to a constant hourly value.
3. Results and Discussion
3.1. Data analysis and Proposed Correlations
In the period 1 January 2018 until 31 December 2019, with the air-conditioning plant that did not operate in a continuous regime, more than 5000 experimental data were elaborated. These data referred to the thermal energy exchanged with the storage tank, its temperatures (at the top and the bottom) and the electric energy absorbed from the heat pumps. Moreover, the control system integrated in the DAQ decides the activation of the heat pumps in relation to the tank set-point temperature with a 1 °C dead band set on the bottom temperature. In this analysis, only the data at the attainment of the tank set-point temperature were elaborated by neglecting the initial periods when the storage system was not charged yet in order to consider the steady-state conditions. Weather data showed favorable winter outdoor air temperatures, often greater than 10 °C in the middle hours of the day also in the coldest months, whereas these never fell under 0 °C. Furthermore, appreciable temperature daily excursions were detected only in the intermediate periods, whereas these are very limited in January and February. Conversely, in the summer, the weather conditions were very hot, with outdoor temperature peaks also over 43 °C. Air temperatures lower than 26 °C were observed prevalently in the first hours of the day, whereas also during sunset, the climate was still very warm. The heat pumps’ performances were affected by the noticeable daily outdoor air temperature excursions, which, on 28 June 2018, reached a value greater than 20 °C.
The calculated values of the correction factor were related to the correspondent CR reported on the x-axis, as showed in Figure 5 for the winter functioning. The fC values were reported on the left y-axis, and the growing trend with CR is clear. Moreover, it is possible to appreciate the modulating feature of the heat pump connected with a frequent unitary correction factor detected especially for CR > 0.2 as a result of the compressor frequency control that allows for avoiding the COP penalization in the part-load mode. As a consequence, the minimal modulation value (not indicated by the manufacturer) was set to CR = 0.2 due to the presence of more scattered points under this threshold. However, it can be also appreciated that, despite the compressor velocity control, for 0.2 ≤ CR < 1, often the correction factor is not unitary. For this purpose, in Figure 5, also, the trends of the correction factor fC determined by Equation (3), supposing both an ON/OFF and a modulating heat pump (the latter with a minimal modulating value of 0.2), were reported. In the same graph, also, the correspondent values of the mean tank temperature (determined as the average value between the bottom and top) are shown on the right y-axis to state the achievement of the steady-state conditions. The fluctuations derive from the control system that acts on the bottom temperature instead of the average mean temperature detected in the tank.
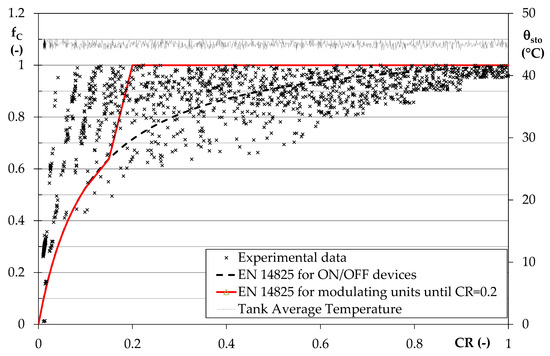
Figure 5.
Average tank temperature and correction factors fC determined in the winter from the experimental data and a comparison with the trends obtained by applying the EN 14825 procedure for an ON-OFF device and a heat pump with a minimal modulation value of 0.2.
It can be appreciated that the tank temperature was controlled satisfactorily around the set-point value; moreover, Equation (3) describes quite fine the growing trend of the experimental fC with the CR increase. When the experimental fC was interpolated in accordance with Equation (3), the penalization coefficient CC that better fits the data resulted as 0.9671—therefore, not far from the suggested default value of 0.9 indicated by EN 14825. Nevertheless, the same graph shows that the employment of Equation (3) for every CR value seems to be more indicated also for the modulating units. From the data analysis, it emerged that the COP was not penalized in the part-load operation only when a continuous functioning regime was reached. Indeed, a unitary correction factor with CR < 1 was prevalently detected in the hours preceded by other periods with functioning heat pumps, whereas, in intermittent operation conditions, correction factors lower than the unity were frequently detected. Indeed, the heat pump operation was affected noticeably by the presence of the charged storage tank, which increased the ON/OFF frequency by hindering the attainment of the optimal functioning conditions. Consequently, the employment of the red line of Figure 5 is more indicated in air-conditioning plants where heat pumps are able to operate with large operative times, whereas, in the presence of a charged storage tank, the evaluation of the absorbed electricity could be underestimated. For this purpose, from the data analysis, it emerged that, for CR = 0.5 detected on 7 January 2019 (midday), the real COP was 3.69 (outdoor air temperature 7.1 °C) when the nominal value determined with Equation (7) was 3.73. Consequently, an experimental correction factor fC of 0.989 was determined, whereas Equation (3) gave as results 0.901 and 0.968 by employing penalization factors of 0.9 and 0.9671, respectively. However, the data referred to an hourly interval where heat pumps operated continuously. Conversely, on 18 November 2018 (5:00 p.m., θoa = 10.1 °C), a CR = 0.25 was determined, and the correspondent real COP was 3.89, whereas the nominal one amounted to 4.38. Therefore, an experimental correction factor of 0.888 was calculated by Equation (2), and, despite the minimal modulation value was not reached, it was far from unity. This was due to the intermittent device functioning that switched off two times in the same hour interval, with a similar behavior in the prior periods, that negatively affected the performances. However, the application of Equation (3) with CC = 0.9 provided fC = 0.769, did not match the value determined experimentally, whereas, with CC = 0.9671, a more appreciable value of 0.910 was detected. This result confirms that a precise evaluation of the penalization factor CC is decisive especially in the presence of limited CR values.
Regarding the uncertainty error propagation [48], by considering the averaged thermal power provided by the heat pumps, a value of 6141 ± 36 Wh was detected among the experimental data, with a relative error of 0.583% obtained by combining the flow meter and temperature sensor errors. The same data have provided a mean absorbed electric energy of 1705 ± 5 Wh, with a measurement error of 0.292% determined in the function of the transformer and meter errors. Consequently, the correspondent real COP was 3.590 ± 0.023 (relative error of 0.65%). For the nominal COP calculated with Equation (7), the maximum distance between the manufactured data and linear interpolating function was in absolute terms of 0.13; therefore, the average correspondent value was determined as 4.33 ± 0.13 (relative error of 3%). Therefore, the latter is the most influencing for error propagation in the correction factor fC calculation, determined as 0.829 ± 0.025.
Regarding the cooling mode, a different trend was observed, as shown in Figure 6, where the fC values and the correspondent CR were reported on the left y-axis and on the x-axis, respectively. It is worth noting the obtainment of a point cloud again scattered but with points that seem to be located according to precise fictitious straight lines passing from the origin and with different slopes. Again, it is clear that the storage tank affects the heat pump functioning noticeably, due to the major point concentration for the CR ranging from 0.5 to 0.6. In the same graph, also, the correspondent tank temperatures were reported on the right y-axis by showing that the implemented control system allows to maintain the set-point in a satisfactory manner and slightly variable around 10 °C.
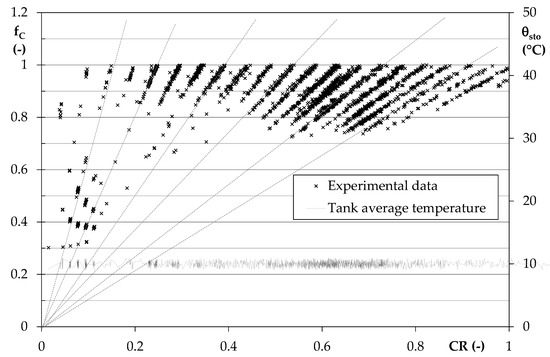
Figure 6.
Average tank temperature and correction factors fC determined in the summer from the experimental data.
It is clear from the graph that the summer corrector factor fC can be related both to the CR and to a specific parameter P that takes into account the inclination of the straight lines, according to the relation:
Among the several parameters investigated by the data analyses, the coefficient P was found depending on the dimensionless ratio between the nominal absorbed electric energy (ENOM) and the actual electricity absorbed by heat pumps (E). After grouping these points in independent lines, and by interpolating the correspondent angular coefficient in the function of the CR, the relation that better fits these points resulted:
Since the parameter P cannot be related to a single CR value because the latter varies on the considered straight line, the interpolation providing Equation (11) was carried out by referring to the CR average value. The constant appearing in Equation (11) represents the value that better fits the experimental data by interpolating them with the proposed relation. With simple passages, it is simple to demonstrate that the electric ratio can also be written as:
Additionally, by combining Equations (10)–(12), the following relation was found:
Assuming a similar form to that described by Equation (3), with a constant value that can be assumed as a penalization factor, the trend of Equation (13) was overlapped to the experimental data by noting that the proposed formula allows to describe quite fine the growing trend of fC with the CR values (see Figure 7). From the experimental campaign, on 25 July 2018 (midday, θoa = 33.4 °C), a capacity ratio of 0.5 was detected, with a real EER of 3.01, whereas the estimated nominal value was 3.06 in accordance with Equation (9). By means of the compressor velocity regulation, the correction factor was close to unity, but this result was achieved also for the continuity in the heat pump operation. Conversely, on 15 July 2018 (Sunday midday, with a no occupied building and outdoor temperature of 31.1 °C), the heat pump worked with an intermittent regime, as well as in the prior hours, producing a CR = 0.3 with a real EER of 2.91 and, therefore, with a worse performance index despite the lower outdoor air temperature than the prior case due to the part-load mode. In nominal conditions, the correspondent EER was 3.17; thus, an experimental corrector factor fC = 0.919 was determined, whereas the employment of Equation (13) gave fC = 0.925, quite matching the experimental value. Again, the constant appearing in Equation (13) produces noticeable fC variations with limited CR, especially when the heat pumps tends to operate in intermittent mode.
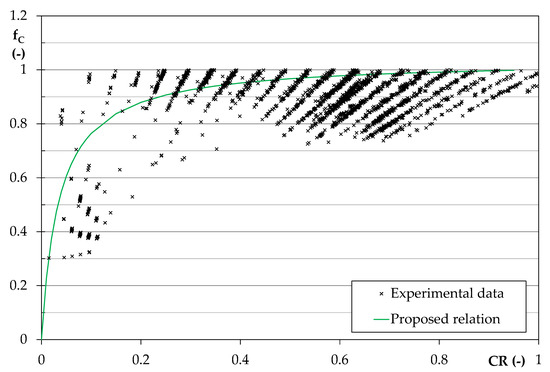
Figure 7.
Summer experimental data and comparison with the trend describing the proposed correlation.
For the error propagation analyses, the average hourly cooling energy amounted to 3004 ± 20 Wh, whereas the correspondent mean absorbed electricity was 1223 ± 4 Wh; therefore, the correspondent real EER amounted to 2.80 ± 0.02. Since the maximum distance between the manufacturer data and the linear interpolating function of Equation (9) was in the absolute terms of 0.16, the correspondent average nominal EER was set to 3.21 ± 0.16, with a relative error of 4.361%. Again, the latter represents the greatest uncertainty source for the evaluation of the correspondent correction factor fC that was determined in 0.874 ± 0.038.
3.2. Results Validation
Some statistical indexes were employed to relate the correction factors provided by the proposed procedures with the real ones calculated by the experimental data. In particular, the following indicators were used:
- ⮚
- The root mean square error (RMSE) that measures the standard deviation of the residual calculated between the modeled (m) and observed (oB) data. On a data sample of N elements, more limited is the RMSE value, and more reliable will be the modeled value:
- ⮚
- The mean bias error (MBE) used to determine if the modeled values are overestimated (positive MBE) or underestimated (negative MBE) compared to the observed data. When the MBE is null, the model is ideal and is not affected by errors:
- ⮚
- The correlation factor R describes how the modeled data follows the variations of the observed values, and it ranges between −1 and 1:
When the absolute value of R tends to one, better are the data that are described by the correlation up to the limit case (R = 1) with the data set perfectly aligned. Conversely, R values close to zero show little-to-no relationship.
In the winter, the data sample was represented by 1677 values across two consecutive years, by considering as the modeled values the correction factor fC obtained by Equation (3) updated with the penalization factor CC = 0.9671 that better fitted the data, whereas the observed data were represented by those calculated as the ratio between the actual and nominal COPs. In the summer, 2264 values were employed in the comparison between modeled data of Equation (13) and observed data calculated as the ratio between the actual and nominal EERs. Again, only data referring to the achievement of the tank set-point temperatures were considered. In Table 3, the mentioned indexes are reported both for the operation of the heat pump in heating and cooling modes.
Table 3.
Some statistical indexes to quantify the deviations detected between modeled correction factor (fC) and observed data for the considered heat pump, both in heating and cooling modes. RMSE: root mean square error. MBE: mean bias error.
Despite the approximation on the linear trends supposed for the nominal performance indexes, the values listed in Table 3 show the attainment of satisfactory results: the RMSE is slightly greater than 0.1 both in heating and cooling modes; therefore, the proposed procedures allow for a quite fine evaluation of the correction factors that, in winter, were calculated without considering the correction connected with the minimal modulation value. The values of the MBE, instead, denote a slight overestimation of the procedures, with the bias error slight greater than 6.6% in the winter and 7% in the summer. Finally, the trend of the fC correlations versus the CR values is satisfactory being the appreciable correlation factors R, especially in the winter, whereas, in the summer, it is affected negatively by a major uncertainty of the nominal EERs.
4. Conclusions
Experimental data concerning an air conditioning plant equipped with air-water heat pumps connected to a storage tank were analyzed and employed for the definition of correlations able to provide dynamic real performance indexes by considering both the outdoor air temperature variations and the functioning in the part-load mode. The elaboration of these data has allowed to define the following aspects:
- ⮚
- In the winter, the penalization of the nominal COP due to the part-load mode can be taken into account by the correction factor fC, indicated by the EN 14825 standard, quite well. However, when the heat pump is connected to a storage tank maintained at a set-point temperature, the procedure suggested for ON/OFF functioning seems to be more appropriate than that indicated for modulating units.
- ⮚
- In the winter, the experimental data were interpolated with the same relation indicated by the EN 14825 in order to find the penalization factor CC that better fits these data. The obtained value is close to the default value of 0.9 to use in the absence of manufacturer indications; however, little variations of this coefficient produce noticeable correction factor deviations, especially in the presence of a limited capacity ratio. For instance, by applying the penalization factor of 0.9671 determined by the fit, deviations in the calculation of the real COP of about 0.12 was detected for CR = 0.5, whereas the difference increased to 0.40 for CR = 0.25.
- ⮚
- In the summer, a similar form of the correlation employed to determine the winter fC was analytically found also for the cooling mode by exploiting the dependence of the experimental data from the dimensionless ratio between the nominal and actual absorbed electricity. The EERs calculated with the proposed procedure for different real CR have shown a good agreement with the results determined experimentally. For instance, with a CR = 0.3 and outdoor air at 31.1 °C, a correction factor of 0.925 was calculated, whereas the correspondent experimental value was 0.919.
- ⮚
- In order to evaluate the distances between the proposed correlations and the experimental data, three statistical indexes were used to relate the modeled fC values to those observed. All the indicators provided satisfactory values, with an RMSE slightly greater than 0.12, an MBE that denotes a slight overestimation produced by the proposed relations and a correlation factor greater than 0.7, both in heating and cooling modes.
The error propagation analysis showed that, beyond the systematic errors due to the probe accuracy, a noticeable source was represented by the linearization of the nominal performance indexes; however, global relative errors lower than 5% were determined.
The proposed procedures cannot be generalized, because they refer to a precise model of air-water heat pumps; however, the experimental data have confirmed the possibility to relate actual performance indexes with the correspondent nominal values and a correction factor that takes into account the functioning in part-load mode also in summer. However, for a correct implementation of the calculation procedures, manufactures have to indicate as much precise data as possible concerning the penalization factor and the influence of eventual storage systems. In particular, the first is decisive to evaluate real performances in the presence of a limited capacity ratio, whereas a charged storage system hinders the achievement of appropriate functioning conditions. In summer, the advantages concerning the proposed procedure allow to overcome the limitations of the calculation procedure currently adopted by EN 14825 that often cannot be implemented due to the lack of data relating to the functioning in part-load mode.
Author Contributions
Conceptualization, R.B.; methodology, R.B., F.N. and S.P.; formal analysis, F.N. and R.B.; investigation, S.P. and G.C.; resources, R.B.; data curation, G.C.; writing—original draft preparation, F.N., D.C. and R.B. and writing—review and editing, R.B., F.N., G.C., D.C. and S.P.. All authors have read and agreed to the published version of the manuscript.
Funding
This research was partially supported by the Italian National Operational Programme (PON) e Research and Competitiveness, Action I: Structural Change support, high technology districts and related networks, for the demonstrator built within the project PON03PE_00050_2 “Energy District DOMUS”.
Conflicts of Interest
The authors declare no conflict of interest.
Nomenclature
| Units | |
| CC | penalization factor (-) |
| COP | coefficient of performances (-) |
| CR | capacity ratio (-) |
| E | electric energy (Wh) |
| fC | correction factor of the nominal value (-) |
| i | i-th data |
| m | modelled data (-) |
| MBE | Mean Bias Error (-) |
| N | number of sample (-) |
| oB | observed data (-) |
| P | specific parameter (-) |
| Q | thermal/cooling energy (Wh) |
| R | correlation index (-) |
| RMSE | Root Mean Square Error (-) |
| θ | temperature (°C) |
| Subscripts/Superscripts | |
| extr | thermal energy extracted from the storage tank |
| NOM | nominal conditions concerning the heat pump functioning |
| oa | outdoor air |
| prov | thermal energy provided to the storage tank |
| real | actual value evaluated starting from experimental data |
| sto | storage tank system |
| Acronyms | |
| DAQ | Data Acquisition |
| GUI | Graphical User Interface |
| GWP | Global Warming Potential |
| HVAC | Heating, Ventilation and Air-Conditioning |
| nZEB | Near-Zero Energy Building |
| PLR | Part-Load Ratio |
| PV | Photovoltaic |
| SEPR | Seasonal Energy Performance Ratio |
References
- Pacheco, R.; Ordóñez, J.; Martínez, G. Energy efficient design of building: A review. Renew. Sustain. Energy Rev. 2012, 16, 3559–3573. [Google Scholar] [CrossRef]
- Bevilacqua, P.; Bruno, R.; Arcuri, N. Green roofs in a Mediterranean climate: Energy performances based on in-situ experimental data. Renew. Energy 2020, 152, 1414–1430. [Google Scholar] [CrossRef]
- Bevilacqua, P.; Benevento, F.; Bruno, R.; Arcuri, N. Are Trombe walls suitable passive systems for the reduction of the yearly building energy requirements? Energy 2019, 185, 554–566. [Google Scholar] [CrossRef]
- Bruno, R.; Bevilacqua, P.; Cuconati, T.; Arcuri, N. Energy evaluations of an innovative multi-storey wooden near Zero Energy Building designed for Mediterranean areas. Appl. Energy 2019, 238, 929–941. [Google Scholar] [CrossRef]
- Bruno, R.; Arcuri, N.; Carpino, C. The Passive House in Mediterranean Area: Parametric Analysis and Dynamic Simulation of the Thermal Behaviour of an Innovative Prototype. Energy Procedia 2015, 82, 533–539. [Google Scholar] [CrossRef]
- Bruno, R.; Bevilacqua, P.; Longo, L.; Arcuri, N. Small size single-axis PV trackers: Control strategies and system layout for energy optimization. Energy Procedia 2015, 82, 737–743. [Google Scholar] [CrossRef]
- Bevilacqua, P.; Bruno, R.; Arcuri, N. Comparing the performances of different cooling strategies to increase photovoltaic electric performance in different meteorological conditions. Energy 2020, 195, 116950. [Google Scholar] [CrossRef]
- Chua, K.J.; Chou, S.K.; Yang, W.M. Advances in heat pump systems: A review. Appl. Energy 2010, 87, 3611–3624. [Google Scholar] [CrossRef]
- Hepbasli, A.; Kalinci, Y. A review of heat pump water heating systems. Renew. Sustain. Energy Rev. 2009, 13, 1211–1229. [Google Scholar] [CrossRef]
- Arcuri, N.; Bruno, R.; Bevilacqua, P.; Carpino, C. Strategies for The Reduction of Electricity Consumptions in Heat Pumps: The Role of the Thermal Inertia in Buildings Equipped with Radiant Systems. In Proceedings of the BS2019, Rome, Italy, 2–3 September 2019; pp. 1724–1731. [Google Scholar]
- Arcuri, N.; Bruno, R.; Carpino, C. PV Driven Heat Pumps for the Electric Demand-Side Management: Experimental Results of a Demonstrative Plant. In Proceedings of the 2018 IEEE International Conference on Environment and Electrical Engineering and 2018 IEEE Industrial and Commercial Power Systems Europe (EEEIC / I&CPS Europe), Palermo, Italy, 12–15 June 2018; pp. 1–6. [Google Scholar] [CrossRef]
- Italian Republic. Implementation of Directive 2009/28/EC on the Promotion of the Use of Energy from Renewable Sources, Amending and Subsequently Repealing the Directives. 2011. Available online: https://www.gazzettaufficiale.it/ (accessed on 18 May 2020).
- Hong, J.; Kelly, N.J.; Richardson, I.; Thomson, M. Assessing heat pumps as flexible load. Proc. Inst. Mech. Eng. Part A J. Power Energy 2013. [Google Scholar] [CrossRef]
- IEA. Tracking Buildings 2019; IEA: Paris, France, 2019; Available online: https://www.iea.org/reports/tracking-buildings-2019 (accessed on 18 May 2020).
- Hu, B.; Li, Y.; Cao, F.; Xing, Z. Extremum seeking control of COP optimization for air-source transcritical CO2 heat pump water heater system. Appl. Energy 2015, 147, 361–372. [Google Scholar] [CrossRef]
- Tammaro, M.; Montagud, C.; Corberán, J.M.; Mauro, A.W.; Mastrullo, R. A propane water-to-water heat pump booster for sanitary hot water production: Seasonal performance analysis of a new solution optimizing COP. Int. J. Refrig. 2015, 51, 59–69. [Google Scholar] [CrossRef]
- Willem, H.; Lin, Y.; Lekov, A. Review of energy efficiency and system performance of residential heat pump water heaters. Energy Build. 2017, 143, 191–201. [Google Scholar] [CrossRef]
- Fernandez, N.; Hwang, Y.; Radermacher, R. Comparison of CO2 heat pump water heater performance with baseline cycle and two high COP cycles. Int. J. Refrig. 2010, 33, 635–644. [Google Scholar] [CrossRef]
- Sarkar, J.; Bhattacharyya, S. Operating characteristics of transcritical CO2 heat pump for simultaneous water cooling and heating. Arch. Thermodyn. 2012, 33, 23–40. [Google Scholar] [CrossRef]
- Shuxue, X.; Guoyuan, M. Research on air-source heat pump coupled with economized vapor injection scroll compressor and ejector. Int. J. Refrig. 2011, 34, 1587–1595. [Google Scholar] [CrossRef]
- Mattinen, M.K.; Nissinen, A.; Hyysalo, S.; Juntunen, J.K. Energy Use and Greenhouse Gas Emissions of Air-Source Heat Pump and Innovative Ground-Source Air Heat Pump in a Cold Climate. J. Ind. Ecol. 2015, 19, 61–70. [Google Scholar] [CrossRef]
- Lucia, U.; Simonetti, M.; Chiesa, G.; Grisolia, G. Ground-source pump system for heating and cooling: Review and thermodynamic approach. Renew. Sustain. Energy Rev. 2017, 70, 867–874. [Google Scholar] [CrossRef]
- Girard, A.; Gago, E.J.; Muneer, T.; Caceres, G. Higher ground source heat pump COP in a residential building through the use of solar thermal collectors. Renew. Energy 2015, 80, 26–39. [Google Scholar] [CrossRef]
- Zhu, C.; Gluesenkamp, K.R.; Yang, Z.; Blackman, C. Unified thermodynamic model to calculate COP of diverse sorption heat pump cycles: Adsorption, absorption, resorption, and multistep crystalline reactions. Int. J. Refrig. 2019, 99, 382–392. [Google Scholar] [CrossRef]
- Walmsley, T.G.; Klemeš, J.J.; Walmsley, M.R.W.; Atkins, M.J.; Varbanov, P.S. Innovative hybrid heat pump for dryer Process Integration. Chem. Eng. Trans. 2017, 57, 1039–1044. [Google Scholar] [CrossRef]
- Torregrosa-Jaime, B.; Corberán, J.M.; Vasile, C.; Muller, C.; Risser, M.; Payá, J. Sizing of a reversible magnetic heat pump for the automotive industry. Int. J. Refrig. 2014, 37, 156–164. [Google Scholar] [CrossRef]
- Ferrara, G.; Ferrari, L.; Fiaschi, D.; Galoppi, G.; Karellas, S.; Secchi, R.; Tempesti, D. A Small Power Recovery Expander for Heat Pump COP Improvement. Energy Procedia 2015, 81, 1151–1159. [Google Scholar] [CrossRef]
- Bi, Y.; Chen, L.; Sun, F. Heating load, heating-load density and COP optimizations of an endoreversible air heat-pump. Appl. Energy 2008, 85, 607–617. [Google Scholar] [CrossRef]
- Feng, X.; Berntsson, T. Critical COP for an economically feasible industrial heat-pump application. Appl. Therm. Eng. 1997, 17, 93–101. [Google Scholar] [CrossRef]
- Di Pretoro, A.; Manenti, F. Heat Pumps. In SpringerBriefs in Applied Sciences and Technology; Springer Nature: Basel, Switzerland, 2020; Available online: https://www.springer.com/series/8884 (accessed on 18 May 2020).
- Madonna, F.; Bazzocchi, F. Annual performances of reversible air-to-water heat pumps in small residential buildings. Energy Build. 2013, 65, 299–309. [Google Scholar] [CrossRef]
- Piechurski, K.; Szulgowska-Zgrzywa, M.; Danielewicz, J. The impact of the work under partial load on the energy efficiency of an air-to-water heat pump. E3S Web Conf. 2017, 17, 00072. [Google Scholar] [CrossRef]
- Ertesvåg, I.S. Uncertainties in heat-pump coefficient of performance (COP) and exergy efficiency based on standardized testing. Energy Build. 2011, 43, 1937–1946. [Google Scholar] [CrossRef]
- In, S.; Cho, K.; Lim, B.; Lee, C. Partial load performance test of residential heat pump system with low-GWP refrigerants. Appl. Therm. Eng. 2015, 85, 179–187. [Google Scholar] [CrossRef]
- Tassou, S.A.; Votsis, P. Transient response and cycling losses of air-to-water heat pump systems. Heat Recover. Syst. CHP 1992, 12, 123–129. [Google Scholar] [CrossRef]
- Dongellini, M.; Morini, G.L. On-off cycling losses of reversible air-to-water heat pump systems as a function of the unit power modulation capacity. Energy Convers. Manag. 2019, 196, 966–978. [Google Scholar] [CrossRef]
- Schibuola, L.; Scarpa, M. On-field validation of a seasonal performance calculation method for chillers in buildings. Energy Convers. Manag. 2014, 85, 62–69. [Google Scholar] [CrossRef]
- European Normalization Standard EN 14825. Air Conditioners, Liquid Chilling Packages and Heat Pumps, with Electrically Driven Compressors, for Space Heating and Cooling-Testing and Rating at Part Load Conditions and Calculation of Seasonal Performance. 2019. Available online: https://standards.globalspec.com/std/13134222/EN%2014825 (accessed on 18 May 2020).
- Minetto, S.; Rossetti, A.; Marinetti, S. Seasonal energy efficiency ratio for remote condensing units in commercial refrigeration systems. Int. J. Refrig. 2018, 85, 85–96. [Google Scholar] [CrossRef]
- Perers, B.; Anderssen, E.; Nordman, R.; Kovacs, P. A Simplified Heat Pump Model for use in Solar Plus Heat Pump System Simulation Studies. Energy Procedia 2012, 30, 664–667. [Google Scholar] [CrossRef][Green Version]
- Dongellini, M.; Naldi, C.; Morini, G.L. Annual Performances of Reversible Air Source Heat Pumps for Space Conditioning. Energy Procedia 2015, 78, 1123–1128. [Google Scholar] [CrossRef]
- Song, K.; Jeon, Y.; Park, K.; Kim, Y. Dynamic performance characteristics of R410A heat pump with consideration of energy efficiency and thermal comfort at various compressor frequencies and outdoor fan speeds. Appl. Therm. Eng. 2020, 165, 114499. [Google Scholar] [CrossRef]
- Palmiter, L.; Kim, J.H.; Larson, B.; Francisco, P.W.; Groll, E.A.; Braun, J.E. Measured effect of airflow and refrigerant charge on the seasonal performance of an air-source heat pump using R-410A. Energy Build. 2011, 43, 1802–1810. [Google Scholar] [CrossRef]
- Italian Unification Institution. UNI TS 11300-4. Energy Performances of Building: Renewable Rnergy and Other Generation Systems for Space Heating and Domestic Hot Water Production. 2016. Available online: https://www.uni.com/ (accessed on 24 June 2020).
- Italian Unification Institution. UN TS 11300-3. Energy performance of buildings: Evaluation of Primary Energy and System Efficiencies for Space Cooling. 2010. Available online: https://www.uni.com/ (accessed on 24 June 2020).
- Fuentes, E.; Waddicor, D.; Fannan, M.O.; Salom, J. Improved methodology for testing the part load performance of water-to-water heat pumps. In Proceedings of the 12th IEA Heat Pump Conference, Rotterdam, The Netherlands, 15–18 May 2017; pp. 1–11. Available online: http://hpc2017.org/wp-content/uploads/2017/05. (accessed on 24 June 2020).
- Asloune, H.; Riviere, P. A Simplified Model For Assessing Improvement Potential Of Air-To-Air Conditioners And Heat Pumps. Int. Refrig. Air Cond. Conf. 2018, 1–10. Available online: https://docs.lib.purdue.edu/iracc/1878. (accessed on 24 June 2020).
- Mooney, T.; Martin, D. Increasing Metering Accuracy by Optimizing the Analog to Digital Converter Characteristics. In Proceedings of the 2006 Power Systems Conference: Advanced Metering, Protection, Control, Communication, and Distributed Resources, Clemson, SC, USA, 14–17 March 2006; pp. 96–98. [Google Scholar] [CrossRef]


© 2020 by the authors. Licensee MDPI, Basel, Switzerland. This article is an open access article distributed under the terms and conditions of the Creative Commons Attribution (CC BY) license (http://creativecommons.org/licenses/by/4.0/).