Next Article in Journal
Climate Change Mitigation Policies Targeting Households and Addressing Energy Poverty in European Union
Next Article in Special Issue
Life Cycle Costing Analysis: Tools and Applications for Determining Hydrogen Production Cost for Fuel Cell Vehicle Technology
Previous Article in Journal
Benchmarking of Modular Multilevel Converter Topologies for ES-STATCOM Realization
Previous Article in Special Issue
Stacked Boosters Network Architecture for Short-Term Load Forecasting in Buildings
 
 
Order Article Reprints
Article

Towards Self-Sustainable Island Grids through Optimal Utilization of Renewable Energy Potential and Community Engagement

1
School of Electrical Engineering, University of Belgrade, 11120 Belgrade, Serbia
2
Institute Mihajlo Pupin, University of Belgrade, 11060 Belgrade, Serbia
3
Department of Earth Sciences, Uppsala University Campus Gotland, S-621 57 Visby, Sweden
4
School of Computing, Engineering and Digital Technologies, Teesside University, Middlesbrough TS1 3BX, UK
*
Author to whom correspondence should be addressed.
Energies 2020, 13(13), 3386; https://doi.org/10.3390/en13133386
Received: 25 May 2020 / Revised: 11 June 2020 / Accepted: 16 June 2020 / Published: 1 July 2020
(This article belongs to the Special Issue Future Smart Grid Systems)

Abstract

:
Solving the issue of energy security for geographical islands presents a one-of-a-kind problem that has to be tackled from multiple sides and requires an interdisciplinary approach that transcends just technical and social aspects. With many islands suffering in terms of limited and costly energy supply due to their remote location, providing a self-sustainable energy system is of utmost importance for these communities. In order to improve upon the status quo, novel solutions and projects aimed at increasing sustainability not only have to consider optimal utilization of renewable energy potentials in accordance with local conditions, but also must include active community participation. This paper analyzes both of these aspects for island communities and brings them together in an optimization scenario that is utilized to determine the relationship between supposed demand flexibility levels and achievable savings in a setting with variable renewable generation. The results, specifically discussed for a use case with real-world data for the La Graciosa island in Spain, show that boosting community participation and thus unlocking crucial demand flexibility, can be used as a powerful tool to augment novel generation technologies with savings from flexibility at around 7.5% of what is achieved purely by renewable sources.

1. Introduction

Geographical islands and island communities in general present a very distinct problem from the perspective of electric energy infrastructure planning due to a number of unique contributing factors. In most cases, these island systems are heavily dependent on the mainland energy markets since there is a limited supply of energy and transporting it to the island itself can be very costly. With many islands relying mostly on either high-capacity underwater power cable connections with the nearest land mass or huge amounts of diesel or similar fuel to be shipped to the island in order to meet demand, providing energy security and stability to the islands presents a key task with significant repercussions on both the environment and the economic sustainability of the island. Furthermore, these island electric energy supply systems generally have a single point of failure which, in the unfortunate case of a malfunction in the supply circuits or temporary delay in fuel shipment due to adverse weather conditions, may leave several hundreds or thousands of users without power or, at the very least, relying on a limited storage capacity. For this redundancy to even be available, the utilization of environmentally unfriendly and expensive lithium-ion batteries is often required. Unlike power grids onshore where, when need be, the energy supply can be obtained from multiple sides and sources such as different neighbouring countries or different energy generation technologies, the generation and import capacities of islands is commonly much less diverse and much more limited. This increases the vulnerability of island communities to power outages and their impacts, which disproportionately affect older residents, resulting in negative health and well-being outcomes [1,2]. Island communities can also be at risk of energy poverty if sufficient attention is not applied to self-sustainability as an energy strategy [3]. Having all these points in mind, many island communities have been looking into and actively implementing different strategies in order to be less reliant on polluting technologies and fuels as well as conditions dictated by events on the mainland.
Key factors in providing self-sustainability and increasing energy efficiency in island electric power grids are the optimal utilization of locally available clean renewable energy in accordance with the appropriate potentials of each island and community involvement through participation in interactive load management and demand response (DR) programmes [4,5]. With these two combined, they would unlock a certain flexibility from the demand side and allow for the demand to be moulded and adjusted to match the intermittent profile of generation typical for contemporary renewable energy sources as a result of their dependency on uncontrollable meteorological (photovoltaic panels, wind turbines, wave generators) and geological conditions (geothermal production sources). With demand-side flexibility provided by end users, an optimization algorithm can be utilized in order to provide the best match between supply and demand in order to minimize the costs of running the (energy) system, and maximize the exploitation of locally available renewable sources. With minor modifications, such algorithms can also be employed in cases where storage systems are present, and used to monitor a wide variety of economic factors as well as indicators of grid stability which could be used as key performance indicators that should be managed in high renewable penetration systems.
This paper aims to explore the two aforementioned aspects, community engagement and renewable energy potential, crucial to self-sustaining island grids, and propose a simulation scenario that includes both of them and is capable of assessing the potential savings that can be achieved with varying levels of energy generation from renewable sources and demand flexibility. The theoretical presentation of the methodology will be accompanied with a use case demonstration for which real-world data for the La Graciosa island in Spain is used.
The remaining part of the paper is structured as follows: First, Section 2 analyzes related work with regards to different aspects that are noteworthy for improving self-sustainability of island grids and methods of testing their joint impact. Here, Section 2.1 goes into detail on various key contributing aspects that influence community participation in programmes essential to sustainable energy systems, Section 2.2 looks into common practices with respect to assessments of renewable energy potential while Section 2.3 provides an overview of relevant papers in terms of planning and optimization implementations with demand flexibility. Afterwards, Section 3 presents an efficient simulation methodology using linear programming capable of assessing long-term behaviour of energy systems with different levels of renewable generation and demand flexibility while Section 4 provides an overview of data for La Graciosa, used to instantiate the optimization scenario and calculate the required parameters. Then, Section 5 provides the results of the conducted simulations and illustrates the effects of demand flexibility on total costs savings. A specific focus in result presentation was placed on decoupling the effects that renewable generation and demand flexibility have on the savings in order to be able to analyze them separately, as well as to allow for their mutual relationship to be inferred. A sensitivity analysis is also included to illustrate the stability of the results. Finally, Section 6 provides concluding remarks regarding the proposed methodology and summarizes the results provided in this paper.
The methodology that follows utilizes a set of different variables. Their labels, units and descriptions are summarized in Table 1.

2. Different Aspects of Self-Sustainable Island Grids

2.1. Factors Influencing Willingness to Participate in Sustainable Energy Systems

The success of any solution that would manage renewable sources and user demand depends on island communities becoming active parts of the energy system changing their consumption patterns through DR and smart grid (SG) technologies [6,7]. To develop effective strategies to encourage active participation and financial investment in sustainable energy systems it is important to understand which factors influence the willingness to participate [8,9].

2.1.1. Community Identity and Trust

Studies have recognized community identity and trust as key to peoples’ active participation in sustainable energy systems [10,11]. Community identity can mobilise action and shift the interests of individuals from being self-oriented to being community oriented. Community identity can be summarised as: “Feelings of attachment to the community, taking pride in the community, and having friends within the community” [12] (p. 797). The shared intention to make the community a ‘’better place’’ can be an important factor for the success of community energy projects [10].
Trust, a fundamental concept of interpersonal relationships and collaboration, is positively related to volunteering which is a basic type of participation and is shown to be crucial for economic decision making, such as financial investments [10,13]. Trust between local people and stakeholders that take projects forward is essential [14], especially if information is handled with transparency and accuracy throughout all stages of the project [15]. Communities that enjoy high levels of collective trust and have trust in their community-based institutions and organisations are thus more likely to succeed, as members would be willing to invest their time or money in projects that they believe are beneficial and of good value to the community.

2.1.2. Social Norms

Citizen participation is also influenced by social norms, which, in the context of sustainable energy projects, can be thought of as peers’ expectations regarding to energy issues. The effect of social norms on environmentally related behaviours has been analysed in [16,17], and the impacts of social norms on engagement with sustainable community energy projects has also been given attention [18]. Social norms have been shown to exert a powerful influence on people’s behaviour and consequently one’s intention to contribute to a sustainable community energy project [18]. Social norms often rely on a person’s perception of social pressure to perform or not perform the behaviour under consideration [10,16]. Furthermore, cooperation is central to many community sustainable energy projects and that itself is influenced by social norms [19].

2.1.3. Environmental Attitudes

Environmental reasons, e.g., climate protection and sustainability, climate awareness, have been found to be among the motivations for collective sustainable energy projects. People involved in community energy projects are generally more receptive to ethical and environmental commitment and question their behaviour with respect to energy consumption and carbon emissions reduction [13,20,21]. With respect to sustainable community energy projects, environmental attitudes are an influential positive factor and an important motivator for collective energy action [22,23,24].

2.1.4. Economic Benefits

Economic benefits which can be generated by sustainable community energy projects are identified as another incentive to get involved with a sustainable energy project. Community-owned means of production can generate income locally, through returns on investment, the sale of generated energy in the form of electricity or heat, tax revenues and the creation of employment during the construction and maintenance of renewable energy (RE) installations [15,20,21]. Distribution of financial benefit for shareholders and/or the community is another leading motivation. Financial benefits made by community institutions or organisations, whether local authorities or non-governmental organisations as a result of implementing DR technologies, can have wider benefits to the community if these are shared through a transparent process. Accordingly, identifying collective economic benefits as well as individual household economic savings [25] are both important considerations.

2.1.5. Island Communities and Sustainable Community Energy Projects

In the case of islands, community-based energy interventions are not uncommon. Research presented in [26] indicated the role that external elements such as the regulatory framework and national guiding visions and plans, as well as internal elements such as the strong sense of community and identity have in ensuring the success of community energy projects. A study conducted on the Reunion island [27] indicates that the security of supply is a major factor that drives island communities to take part in projects based on new innovations.
Paper [28] reports on the success of DR projects on Magnetic Island off Queensland, Australia, suggesting that engaging residents as members of a community was one of the main reasons for the DR project’s success. This, however, indicates that whilst community identity can be strong, it should not be taken for granted when mobilising for DR implementation. The same study examined changes in energy-related behaviour. Equally, the effort and support expended by the utility company helped increase the level of behavioural change [28], achieved through effective marketing and communication efforts. Accordingly, the different actors involved in a reactive solution to increase self-sustainability have an important role to play not only in recruiting the households to take part in the project demonstration but to engage positively with the community to build needed levels of trust and acceptance of DR innovations.

2.1.6. Sociotechnical Implications

As mentioned previously, DR is seen as a key enabling technology for the integration of renewable energy to support island self-sustainability. However, it has been well reported that one of the major drawbacks to successful engagement in DR programs by consumers, for example in some recorded cases in the US, relates to little or diminishing levels of user participation from residential customers enrolled in DR programmes [29,30]. It has also been suggested that, since DR programmes can be broadly classified into two sub-types (price-based and incentive-based), with each requiring a different levels of home automation, consumers with little or diminishing user participation should be identified as early as possible and new ways sought to encourage participation [31]. This can be achieved, for example, by switching from a voluntary Time-of-Use (ToU) incentive-based programme to a Direct Load Control (DLC) price-based programme by increasing the penetration of home automation, to allow automatic remote switching of residential loads [31]. Although techniques designed for online implementation can be employed to identify participation levels of residential customers in incentive-based DR programmes (e.g., [32]), the use of surveys such as that described in this section can reveal preliminary insights into likelihood to participate in different kinds of DR programmes for island communities. It is suggested that such preliminary information could be combined with appropriate assessment tools (e.g., [30,33]), and simulation models (e.g., [31]) to assist with the planning and execution of DR activities, programmes and use cases to support energy transitions for island communities.

2.1.7. Policy Barriers

There are a number of regulatory and policy barriers and enablers that are significant in relation to the development of autonomous and semi-autonomous energy islands. One key issue in this respect is the ability of independent aggregators to operate on energy markets. This is because “through aggregation the value of flexibility (DSR, storage and embedded generation) can be enhanced by bringing together providers who would be too small to participate in the markets individually due to specified load sizes” [34]. The ability of independent aggregators to operate on energy markets varies across the EU and associated countries [34,35,36]. Recent research [34] ranked the eight EU and associated countries that are leading in respect to the ease with which independent aggregators can operate on energy markets. In descending order these are: France, Switzerland, Ireland, Great Britain, Belgium, Finland, Germany and Denmark. Overall, it is fair to say that the regulatory and policy framework in Europe for demand response is progressing, but further regulatory and policy improvements are needed [34].

2.2. Renewable Energy Potential

Another key contributing factor to the diversification of the energy supply of islands, as a prerequisite to achieving self-sufficiency and decreasing the reliance on traditional energy supply sources, are the implementation efforts of clean renewable energy generation solutions. Keeping in mind the meteorological conditions to which islands are exposed to are very specific when compared to use cases on the mainland, and that they vary significantly based on the location and the microclimate of the considered island, each renewable generation deployment effort must be preceded with an appropriate analysis of what the potentials of the island are with respect to different generation technologies.

2.2.1. Methods for Production Estimation

The assessment method of renewable energy potentials varies by the energy type being evaluated. For wind power, the mean annual wind speed (usually expressed in [ m / s ]) at a given height serves as common indicator of potential [37]. For solar power, the global horizontal irradiance (GHI) (usually expressed in [ W / m 2 ]), which is equal to the total solar radiation on a horizontal surface, can serve the same purpose for some solar technologies [38]. Geothermal potential can be assessed, in part, by its surface heat flow (usually expressed in [ mW / m 2 ]). Hydro-electrical potential is based on the head and the long-term flow statistics, where head can be estimated looking at topographical maps while flow is much more complicated to estimate though models do exist such as described in [39]. Less mature renewable resources like wave and tidal can be evaluated from annual mean wave power density within each wave (usually expressed in [ kW / m ]) and tidal range (usually expressed in [ m ]) as well as tidal currents (usually expressed in [ m / s ]), respectively.

2.2.2. Data Availability

In all cases of different generation technologies, it is preferable to have long term, high quality measurement data of the energy type to be exploited. Unfortunately, in many cases, such data does not exist in a readily accessible form for any number of reasons. In those cases where specific locational data does not exist, the values for potential assessment can be sometimes obtained from several local and international official sources. Local sources can include nearby official meteorological towers such as those common near airports or from national resource surveys. International sources include services like the Global Solar Atlas provided by the World Bank Group [40], the New European Wind Atlas partly funded by the European Commission [41], as well as from a number of corporate sources. Some energy modelling software, such as RETScreen developed by Natural Resources Canada, provide climate data from both local official as well as international sources [42]. The values received from governmental and international sources are generally useful for the initial assessment of an area or site’s potential while the corporate services can often gather actual measurement data at a proposed location.
The onsite data gathering for wind power includes the erection of a measurement mast with a variety of different anemometers, normally installed at varying heights, to gather wind speed data. Alternatively, laser and sound detection technologies can be used that do not require the erection of a measurement tower to obtain the wind speeds at different heights [43]. The process for measuring solar irradiation uses pyranometers and pyrheliometers at the site to obtain global horizontal irradiation (GHI) as well as direct irradiance [38]. Testing of geothermal potential onsite is done by drilling a geothermal well or wells to gather required measurements [44]. Hydro electrical potential can be evaluated onsite by review of actual head potentials and flow rates using measurements of a river that are convertible into flow data. Evaluation of wave energy onsite can be done using a floating buoy that moves along the surface of the ocean and records its vertical displacement that allows for the calculation of wave height and period [45]. Tidal range is determined through measurement of the site’s high tide and low tide points while tidal flow can be assessed using acoustic Doppler equipment [46].

2.3. Planning and Optimization

Planning is a crucial aspect when discussing improvements to island grid systems. Among others, [47] discusses the dependency of Mediterranean islands on fossil fuels and the underutilization of renewable energy source (RES) potential and discusses economic feasibility of RES. Long-term cost-benefit analyses are the main focus of [48] which also analyzes the potential effects of RES installations for small islands. A Caribbean use case with high RES penetration is elaborated by [49]. On the other hand, [50] looks at energy poverty and energy planning with local energy policies in mind for the Canary Islands. Long-term analyses are expanded with the introduction of battery storage in [51] where a comparison between small-scale urban systems and island grids is made.
Some authors place a special focus on discussing the effects of optimization, but very few consider geographical island scenarios specifically. Simulations on this topic are explored by [52] where multiple different energy sources such as photovoltaics, wind turbines, diesel generators and many others are integrated in a comprehensive scenario. Flexibility of the power system in general is discussed in [53] where a European use case is analysed in a stepwise methodology. Regarding optimization with demand flexibility, [54] provides a scenario with real-time pricing, but focuses specifically on heating systems. Once again, demand flexibility is explored by [55] where participation in DR programmes as sources of load elasticity is analysed.
This paper aims to extend the state of the art by considering demand flexibility and renewable potential as the two previously mentioned key factors that influence the ability of achieving self-sustainability of island energy grids. By using proactive user participation as a driver to unlock crucial demand flexibility and renewable energy generation as chosen in accordance with respective meteorological conditions and practical constraints, the methodology that follows will bring these two aspects together in a cohesive simulation scenario. The proposed methodology will then be implemented on a specific use case of the La Graciosa island in Spain using real-world data, followed by the results that analyze savings that can be achieved by using demand flexibility on top of renewable energy generation. By doing so, this paper aims to explore the goals that an island community eager to achieve self-sustainability can accomplish.

3. Simulation Methodology

In order for the full potential of an island electric grid that utilizes demand flexibility and renewable sources to be assessed, an optimization procedure has to be conducted in order to couple the intermittent supply with the demand-side flexibility so that optimal performance can be achieved. By doing so, traditional rule-of-thumb methods can be augmented using computer simulations, thus utilizing precise numerical data that depicts variable pricing schemes for both energy import and export, variable weather conditions distinguishable through renewable production profiles and constraints related to user comfort with demand flexibility in mind. This section presents a methodology capable of conducting such simulations which is later applied to a use case in order to investigate the impact of user demand flexibility in island renewable energy systems.

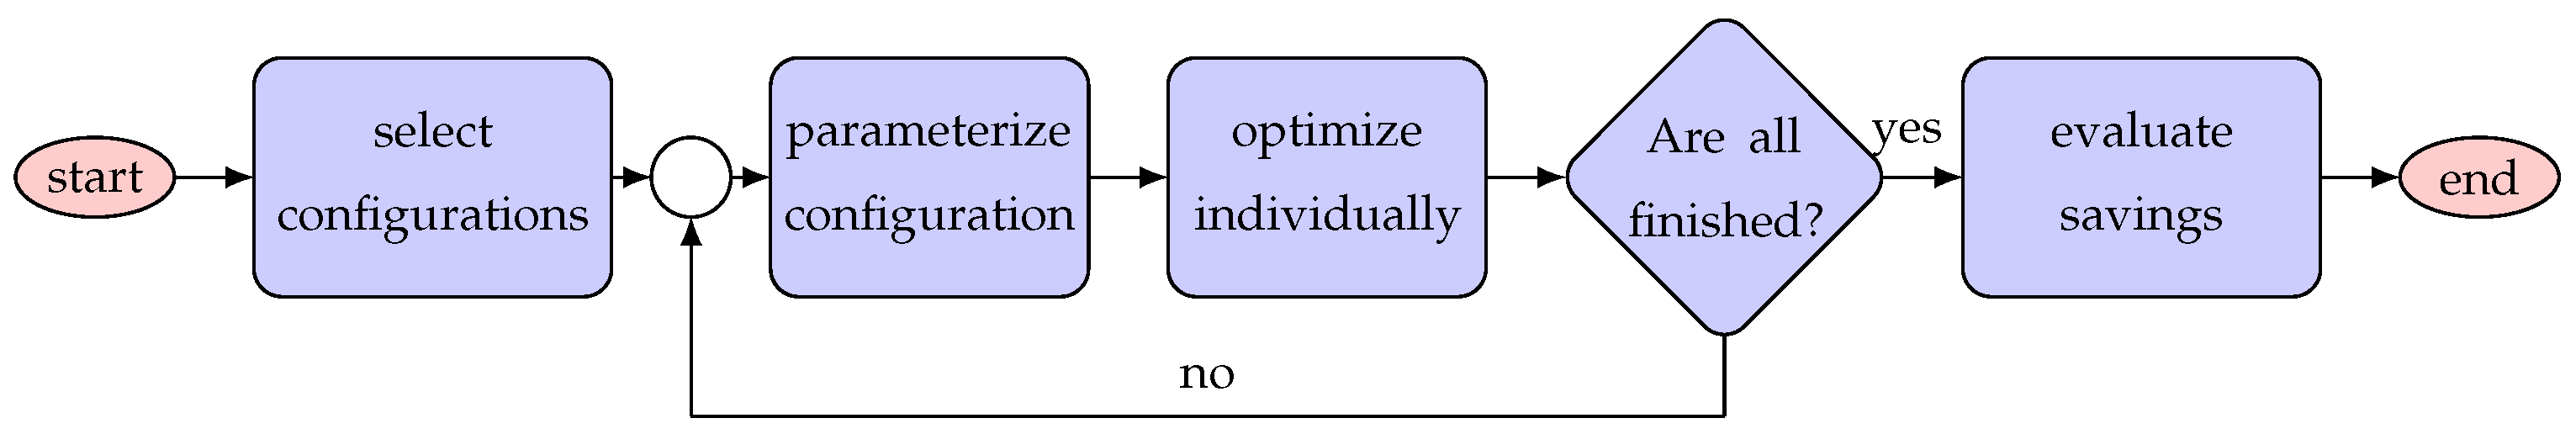
3.1. Optimization Procedure

In order for the optimization procedure to be conducted, a set of scenarios has to be first defined. Each scenario has a variable demand flexibility level and a variable amount of renewable generation. Using the data that will be laid out in the following sections, each scenario is instantiated with an adequate pricing tariff, renewable production curve and demand levels with flexibility.
As depicted in Figure 1, every one of the scenarios are individually optimized using a model for energy management formulated as an appropriate optimization problem and a predefined criterion that will be deliberated on in the following text. Besides this criterion, other key values of each of the optimized scenarios will be monitored and logged for later analysis. Once all the cases are optimized for, the relationship between demand flexibility, renewable energy generation and the monitored output(s) will be analyzed using the output data.

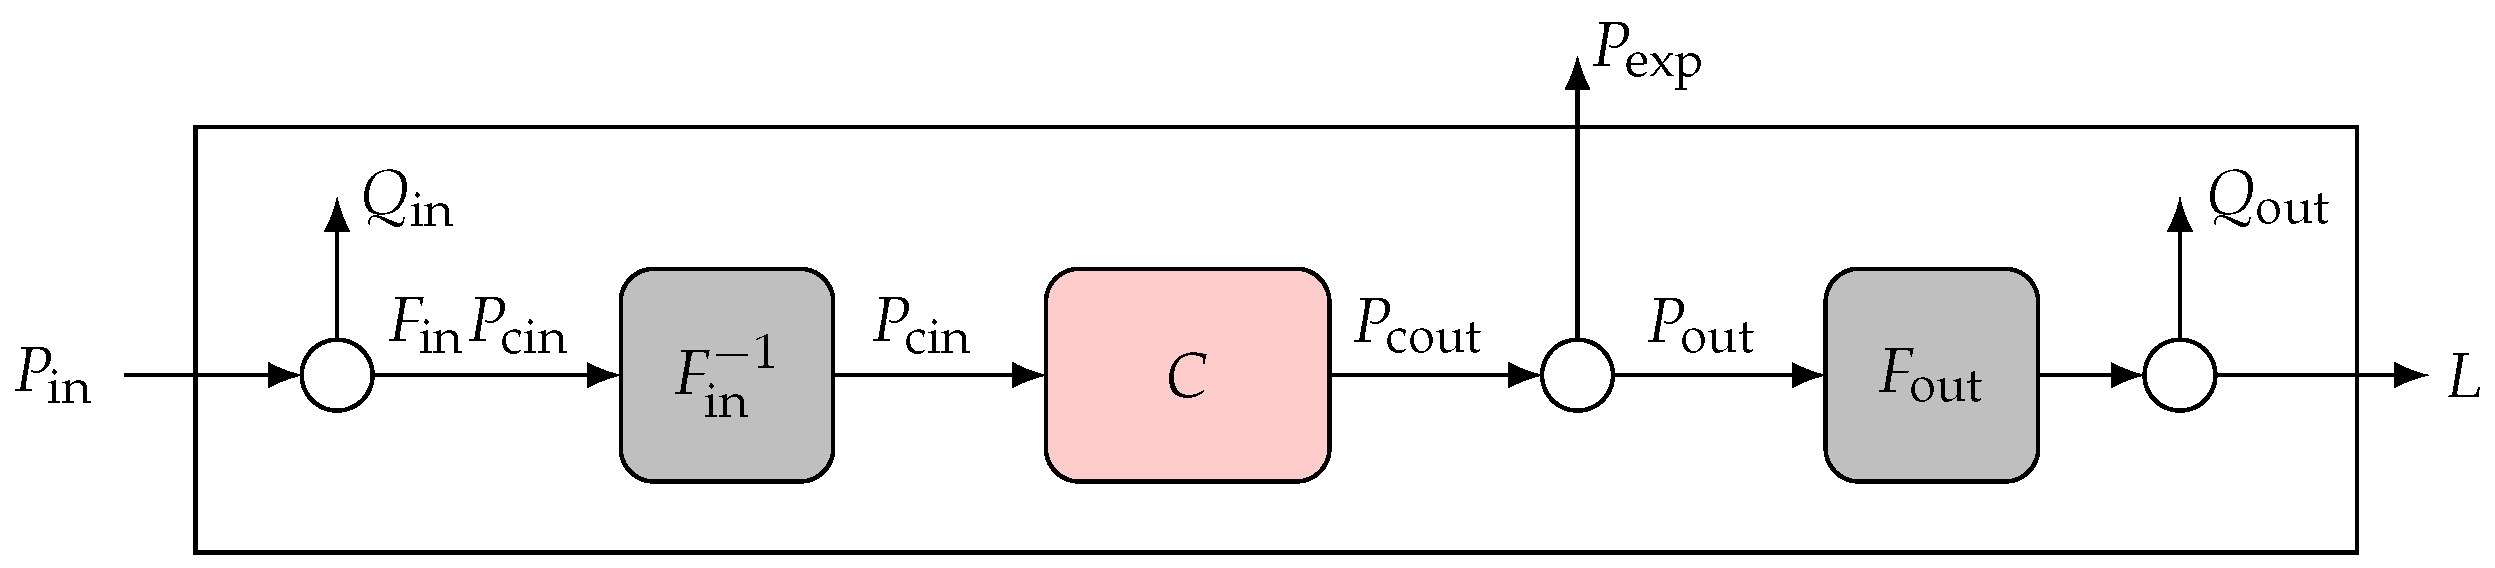
3.2. Operational Optimization Model

The operational optimization is based on a model of energy transmission and transformation called the Energy Hub, conceptualized in [56] and instantiated as a sequential structure presented in Figure 2. This model is used to simplify the grid of the island as follows: The Hub is supplied with input energy P in ( t ) which, as other variables in the model, represents a vector of instantaneous values of a certain physical quantity, in this case power coming either from the submarine cable or local generation. In this model, each type of carrier can be limited in a different way. For example, the import from a cable connection can be considered to be a variable that has a value between zero and the maximum power transmission capacity of the cable. On the other hand, all energy produced by the renewable sources has to be imported and either stored in the input stage storage ( Q in ( t ) ) or the output stage ( Q out ( t ) ) for later use, exported as P exp ( t ) or used to fulfill the load L ( t ) . In the path from the import stage to the load, the energy passes through several stages: input transformation (defined by the F in block), conversion (defined by the C block) and output transformation (defined by the F out block). This allows for the modelling of ways in which different energy carriers can be mixed together or depiction of losses associated with necessary transformations in this process.
Owing to its modular and flexible nature, the Energy Hub can be used to simultaneously model fundamentally different types of carriers such as electric and thermal energy as in [57]. However, since the target of this paper are improvements to the electric energy supply, a focus will be placed solely on the electric aspect. By specifying different layouts of blocks F in , C and F out , different layouts of the grid can be modelled and adapted to the considered scenario with an adequate number of carriers of which each one corresponds to one generation technology (photovoltaic, wind turbine, etc.) or supply type (submarine cable connection, power generated from burning diesel, etc.).

3.3. Load Flexibility Model

In this methodology, the load L ( t ) in the Hub is considered as a variable that can be optimized between a lower L min ( t ) and an upper L max ( t ) limit, constructed around some baseline load value L base ( t ) . Different levels of user willingness to adjust their loads are expressed by varying the width of the band between L min ( t ) and L max ( t ) . If f L is assumed to be the flexibility of the demand, the aforementioned limits can be constructed as
L min = ( 1 f L ) L base ( t ) and L max = ( 1 + f L ) L base ( t ) .
Figure 3 illustrates an example that shows how the lower and upper limits relate to the baseline consumption and what an optimal profile between these two limits might look like for a given time period. This type of load flexibility can sometimes be utilized as a replacement for storage capacities. Namely, by introducing a flexibility margin, a power reserve is introduced in the system whereby it can utilize the region between the minimum and maximum allowed load value in order to dynamically match the supply with the demand in the same way as a storage solution would allow this with adequate charge and discharge rates. As the results will later show, if such flexibility is displayed by the users, observable savings can be achieved even in cases without any storage facilities. However, in reality, the levels of reserve that such flexibility can provide may not always be sufficient in which cases storages are a necessity. Still, having any flexibility whatsoever can go a long way towards reducing the overall costs as will be illustrated later.
Any optimization engine that has to optimize for lowest price (which is a common practise) and has the ability of utilizing load flexibility margins will tend to minimize the load wherever possible. In order to avoid this effect, as it would significantly impact user comfort and not be realistic, an integral energy constraint is added, stating that the total energy consumed within a 24 h period must be the same in the case of the optimal profile and the baseline profile. Such a constraint can be expressed as
( k { 1 , 2 , . . . , 365 } ) t = 24 ( k 1 ) + 1 24 k L ( t ) = t = 24 ( k 1 ) + 1 24 k L base ( t ) .

3.4. Implementation

By laying out all the constraints of the model with regards to energy transmission and transformation as well as load management in matrix form
A eq x = b eq A ineq x b ineq l b x u b
and an objective function defined as J = f T x , the Energy Hub can be optimized as a linear programming (LP) problem using any number of solvers (CPLEX, Gurobi, MatLab’s linprog, lpsolve, etc.) very efficiently and key performance indicators can be extracted in order to summarize the performance of the system over a long time span, allowing for a long-term (multi-year) assessment to be performed. Furthermore, by analysing individual variables of the Hub that are integrated in the vector x where each variable of the model at a given time instance in the simulation is assigned a corresponding position in x, additional parameters regarding the performance of the grid, as given in [58], can be easily extracted from the optimized outputs.

4. Use Case Definition

In order for the joint impact of social engagement and renewable generation potential to be assessed using the previously defined simulation methodology, a specific use case should be assumed. Therefore, the following subsections will present a selection of available data, gathered as part of the EU Horizon 2020 REACT project [59,60,61]. The main goal of the project is to improve the self-sufficiency of island energy supply systems and it considers eight islands in total, of which three (La Graciosa in Spain, San Pietro in Italy and the Aran Islands in Ireland) are used as pilot islands, i.e., islands where the project’s final research solutions will be piloted. The following sections place the main focus on data for La Graciosa as this data is used to generate a simulation scenario, but also utilize results from other islands for reference.

4.1. End User Engagement

Given the priorities of island communities, the factors which influence the willingness of the island residents to engage with the project and become active parts of the energy system changing their consumption patterns through DR and SG technologies are summarised in Table 2. Along with them, some key findings from a survey conducted on the La Graciosa island with a sample size of roughly 13% of the total number of households, were also presented. The survey assessing the communities’ perception of SGs and DR at each of the REACT project’s pilot islands has some very encouraging results related to island community’s motivation to be part of sustainable energy systems.
By analyzing the survey results from the rightmost column of Table 2, it can be observed that utilizing renewable energy, achieving energy savings and being environmentally friendly are all important aspects of participation in the project. Therefore, it is assumed that an overwhelming majority of the residents will be open to the idea of adapting their demand so as to achieve these goals. In order to get detailed insight into achievable savings in different scenarios, the demand elasticity that would be unlocked by active user engagement is modelled in accordance with specifications from Section 3.3 using a varying level of flexibility which is used to reflect different levels of community participation. 25 different demand flexibility levels were chosen, from 0 to 60% (inclusive) with 2.5% increments.

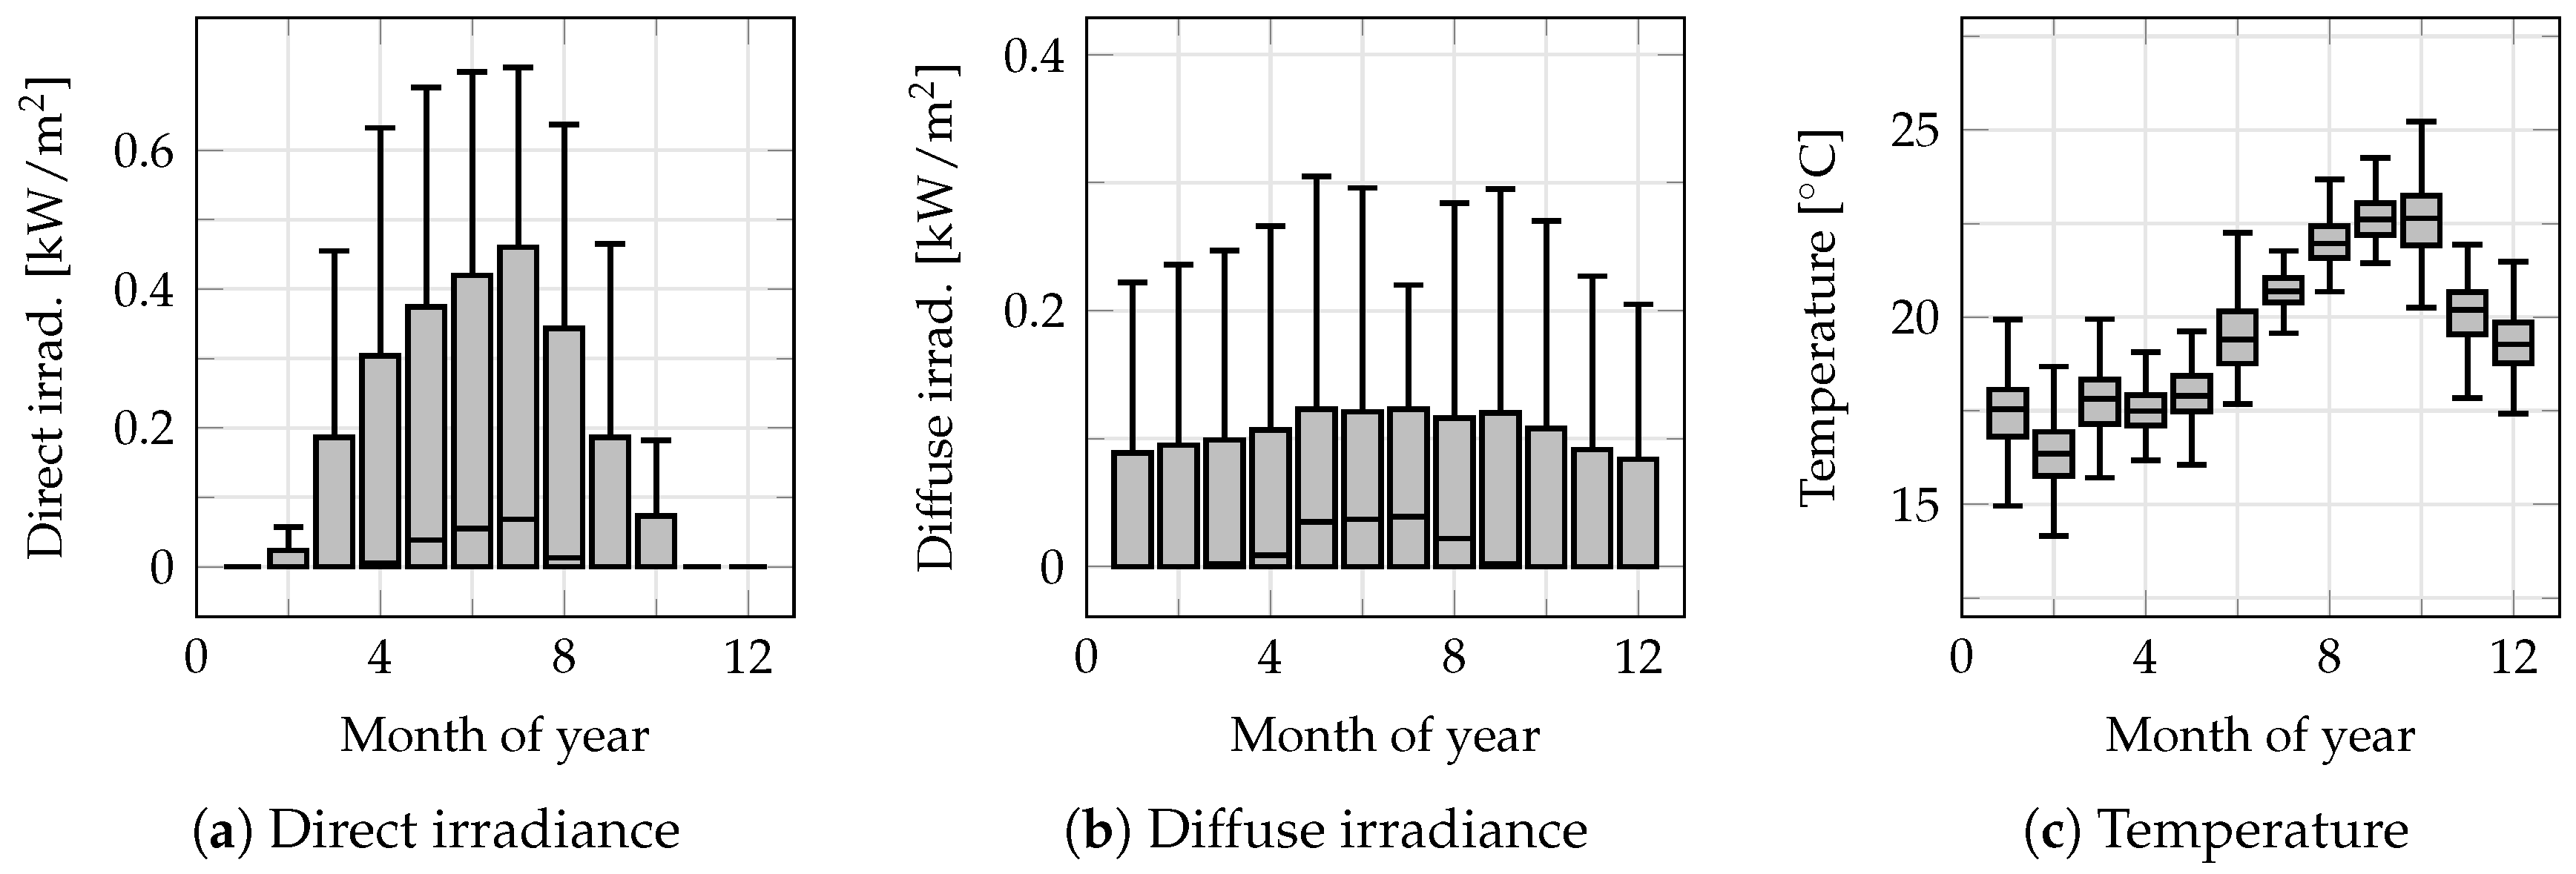
4.2. Renewable Energy Generation
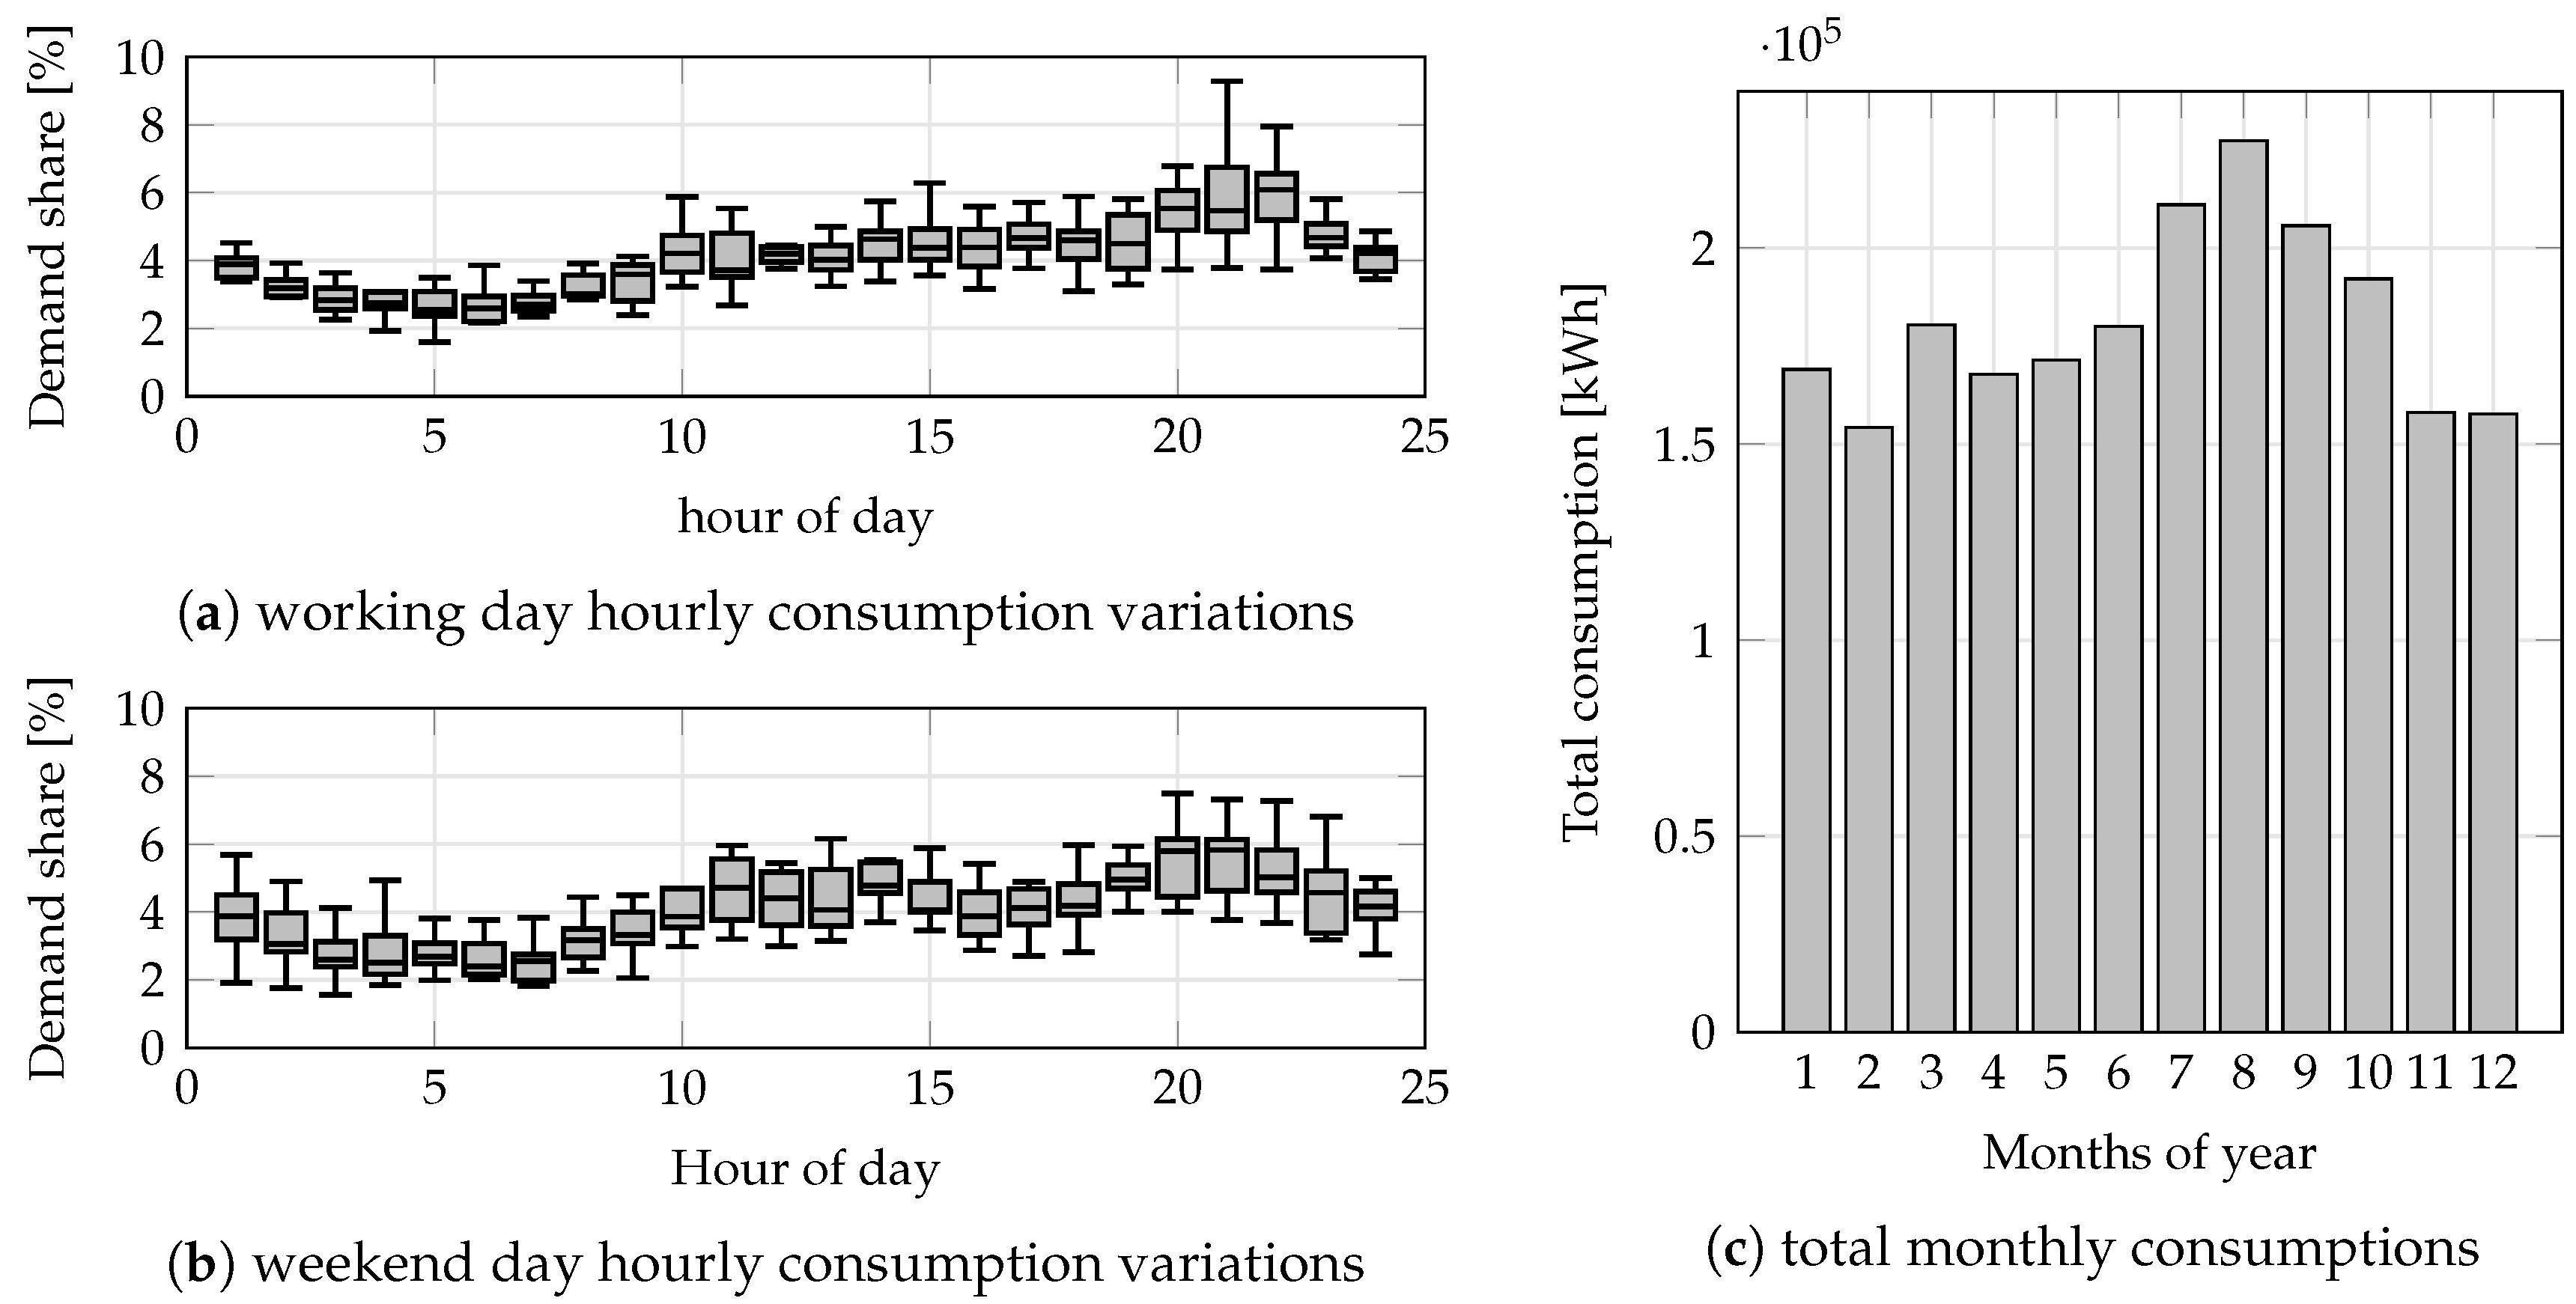
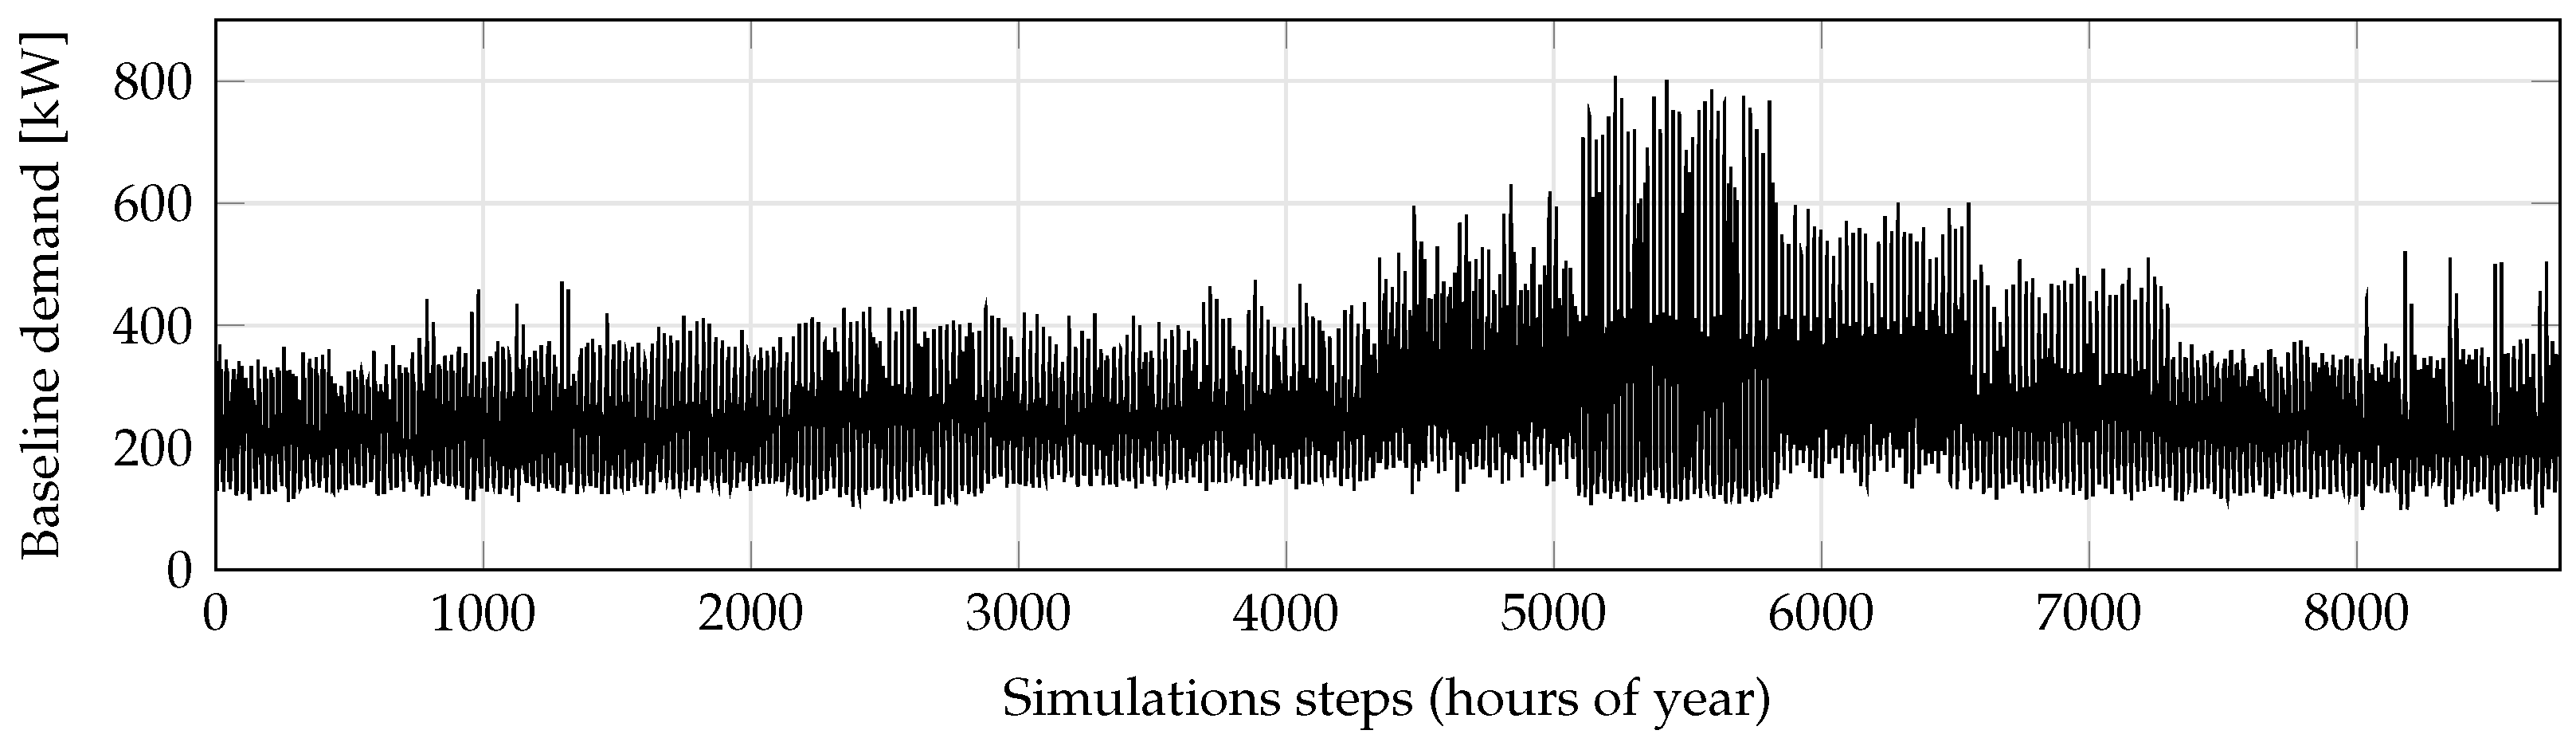
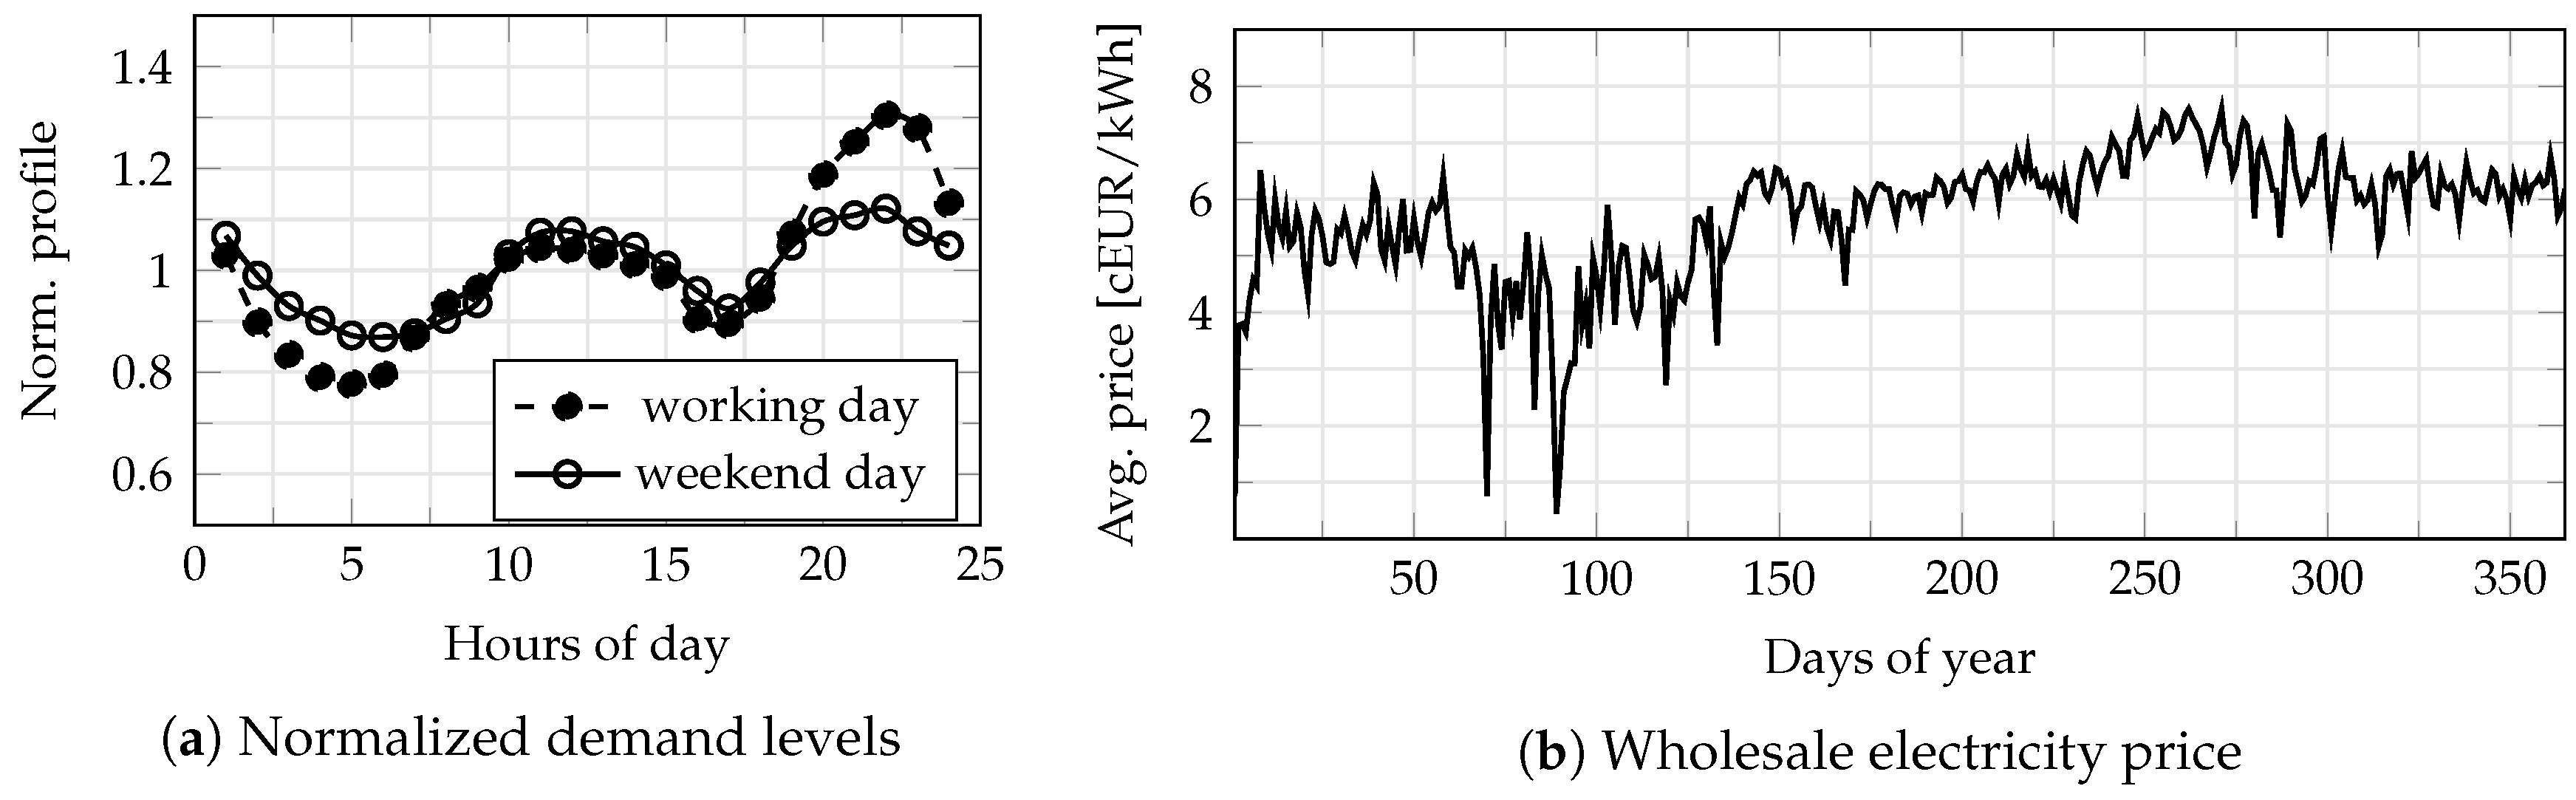
In order to first illustrate how different conditions impact the renewable generation potential of islands in different locations, data that indicates the relative energy potentials for REACT pilot islands in terms of wind power, solar power and wave power is collected and summarized in Table 3. Both La Graciosa and San Pietro have been identified as having a potential for geothermal development [62,63] but specific data for neither island was available. No specific data for hydro electrical or tidal potential was available for the islands.
None of the values presented in the Table 3 are for a specific location on any of the three islands and provide only a general assessment of the resources on each. While La Graciosa may appear to have the lowest average wind speed there may be locations on the island where higher wind speeds can be achieved, such as on the island’s mount Mojón, and conversely lower speeds may also be present within Caleto del Sabo, the island’s capital. Irradiance is also impacted by local conditions, such as shading from buildings, which can reduce the islands’ potentials. That noted, the Aran Islands and San Pietro clearly have significant wind resources at the relatively low height of 10 m, far below the hub height of any commercial wind turbine, while La Graciosa’s resource is more modest. Conversely, La Graciosa has a significant solar resource while the Aran Islands have somewhat more modest values typical for northern Europe. Wave power estimates also indicate significant potential around La Graciosa and moderate potential near the Aran Islands.
Looking specifically at La Graciosa as the focus case for this paper, the island’s land and sea-based energy production capabilities are both quite limited despite the potentials. In 1986, the local government designated most of the island as a regional Natural Park and in 1993 the entire island was declared a UNESCO Biosphere Reserve to protect the island’s environment and biodiversity [62]. In 2003, ownership of the majority of the island’s territory was granted to the Spanish agency for national parks. Additionally, the island is part of the Maritime-Terrestrial Chinijo Archipelago Natural Park and all nearby waters are protected [69]. These designations onshore and off essentially limit the types and sizes of RES production to those onshore technologies acceptable within the island’s two small, populated areas. Similar limitations on RES production exist for other islands, like San Pietro and the Aran Islands.
An additional limitation to keep in mind is that not all countries have a regulatory framework that allows for the full application of demand response. For the specific case of La Graciosa, the Spanish electricity market is not entirely open to explicit demand response activities and doesn’t allow for aggregation of demand-side resources [36]. These regulatory limitations create an environment where demand response on La Graciosa would be difficult to implement, though recent legislation indicates this situation may be changing [70].
Due to mentioned regulatory limitations and the illustrated potentials, this paper will focus on a theoretical photovoltaic generation deployment scenario in the capital of La Graciosa, Caleta de Sebo (at the specific location of LAT = 29.232 and LON = 13.502 ). In order to illustrate the potential of solar energy for this site, interfaces for an international official database [71] were used and hourly meteorological data depicting irradiance components and temperature was obtained. A summary of the data is illustrated in Figure 4. As can be observed, the direct irradiance has a noticeable seasonality, peaking during the summertime while, on the other hand, diffuse irradiance is relatively constant. The temperature on the island appears to be moderate with monthly mean values between 17   C and 22.5   C which can be beneficial as the photovoltaic production is sensitive to overheating issues.
Following the mentioned remarks regarding renewable production, a two-carrier supply is given to the Energy Hub with one of them corresponding to the imported power from the submarine cable (with a maximum capacity of 1030   k W equal to the existing cable between La Graciosa and Lanzarote) and the other corresponding to the energy provided by the photovoltaic (PV) array. Using the previously presented data sources as well as the methodology associated with [72], the expected output of a non-tracking PV generation system with a reference capacity of 1   k W , 10 % losses, tilted 35 around the horizontal axis from the horizontal plane, facing south and located in the capital of La Graciosa, was generated. In order to simulate the output of differently sized PV generation plants, the unit production is scaled up linearly. For this purpose, a set of 21 different rated powers of PV generation was selected, from 0 to 1000   kWp (inclusive) with 50   kWp increments, as this range is thought to roughly correspond to what would theoretically be possible if the available roof space of buildings in the capital of La Graciosa was used.

4.3. Demand Profile

Since the total electricity demand of the entire island of La Graciosa cannot be obtained from publicly available sources, this baseline curve must be somehow constructed. Using hourly demand measurements from ten houses that are supplied by Fenie Energia (Spanish retailer for electric and thermal energy), averaged normalized working day and weekend day profiles are derived for each month and their variations between different months are illustrated using box-plots in Figure 5.
However, since total monthly consumption data is available, and is depicted in Figure 5 also, the hourly data can be scaled up with the appropriate monthly consumption divided by the total number of days in each month so that an estimated consumption curve can be obtained. In order to make this process more realistic, random unit white noise samples ( μ = 0 , σ = 1 ) are scaled into the range ( 10 , 10 ) % to model hourly noise n h ( t ) and into ( 4 , 4 ) % to model monthly noise n m ( k ) and are superimposed to the 100% of the demand that would have been calculated without the given noise levels. The resulting demand profile is illustrated in Figure 6 and this profile is used as the baseline load L base ( t ) , mentioned previously, around which a flexibility band will be formed.

4.4. Pricing Profile

Survey data [60] indicates that 558 out of 613 (approximately 91%) grid-connected users in La Graciosa are contracted to a single rate tariff (with maximum power draw of 10   k W ) with a fixed price of 0.162   EUR / kWh , so this value is assumed as the cost at which power can be imported from the submarine cable. In a scenario where renewable generation would be community owned, besides the cost of acquiring the system and its maintenance, the energy it generates comes without direct costs, and the excess energy can be sold on the wholesale market. Using the interfaces provided by OMIE [73] (Due to the crises related to COVID-19 ongoing at the time of writing this paper and the changes in the API provided by OMIE which now only provides the last year of hourly wholesale prices, historical (previously acquired) data was used for 2018 in order for the price profile not to include the months of February, March and April of 2020 which saw significant price fluctuations attributed to the effects of the pandemic that do not depict general trends), the hourly price profile for the year 2018 can be constructed. Namely, for each month and each first working and weekend day of that month, hourly prices have been obtained. These values are then normalized for each month into hourly profiles for a typical working and weekend day so that the average of both profiles equals one and are illustrated in the left side of Figure 7. Then, for each day of the year, the average wholesale price was obtained and is depicted in the right side of Figure 7. Afterwards, day by day, these daily values are used as a scale factors that are applied to the corresponding working or weekend day price profile. By concatenating these profiles together, the estimated hourly wholesale price profile is derived which is assumed to be the export price of electric energy.

4.5. Optimization Setup

With the Energy Hub having two carriers (cable imports and PV generated electricity) and only one load type (electric demand), the transformation stages can be defined by the matrices
F in 1 = 1 0 0 1 , C = η t 0 0 η i and F out = 1 1
where η t = 98% represents the typical grid transformer efficiency and η i = 95% represents the typical invertor efficiency. All other losses are neglected. The combination of selected PV generation and demand flexibility increments provides a total of 525 configurations for simulation. These ranges are assumed as theoretical and the results at the end of the paper focus on a selection that is considered most realistic. The baseline load is instantiated using the estimated year-long hourly curve derived previously, while the criterion of the optimization model is set to equal the yearly operating cost of the model J opex = f T x with regards to the assumed energy import and export prices, as is achieved by setting the appropriate values of f to the corresponding prices.
However, the optimization scenario should also be able to considered the costs associated with the assumed renewable installation. The upfront investment regarding the acquisition of solar panels is based on [74] with a cost of 1115   EUR / kWp . However, due to the fact that the PV panels come with a typical warranty and a matching expected lifetime of around 25 years, the cost associated with using them is split into yearly installments. The expected operational lifetime of PV panels may be longer that the mentioned duration. However, after the guaranteed amount of time had passed, the efficiency of the panels is expected to have dropped off significantly which, in turn, means that a replacement is in order. For a piece of equipment labeled i with the initial acquisition cost B i , an estimated lifetime of γ i years, one month’s equated installment (equivalent to rent) would be calculated as
X i EMI = B i δ · 1 + δ 12 γ i 1 + δ 12 γ i 1
where δ = 0.42% is the monthly discount rate which is assumed to be constant. With the monthly maintenance costs of each device given as X i maint (assumed to equal, in total, 2% of acquisition cost over lifetime), the total yearly cost of running the system would equate to
C total = J opex + 12 i E X i EMI + X i maint
where J opex is the aforementioned cost determined by the optimization output through its criterion function. With the considered use case limited to only photovoltaic panels, the set of all considered equipment is given purely as E = { P V } . However this same methodology can also be implemented in other cases where either different energy sources are used or storage systems are utilized.

5. Results and Discussion

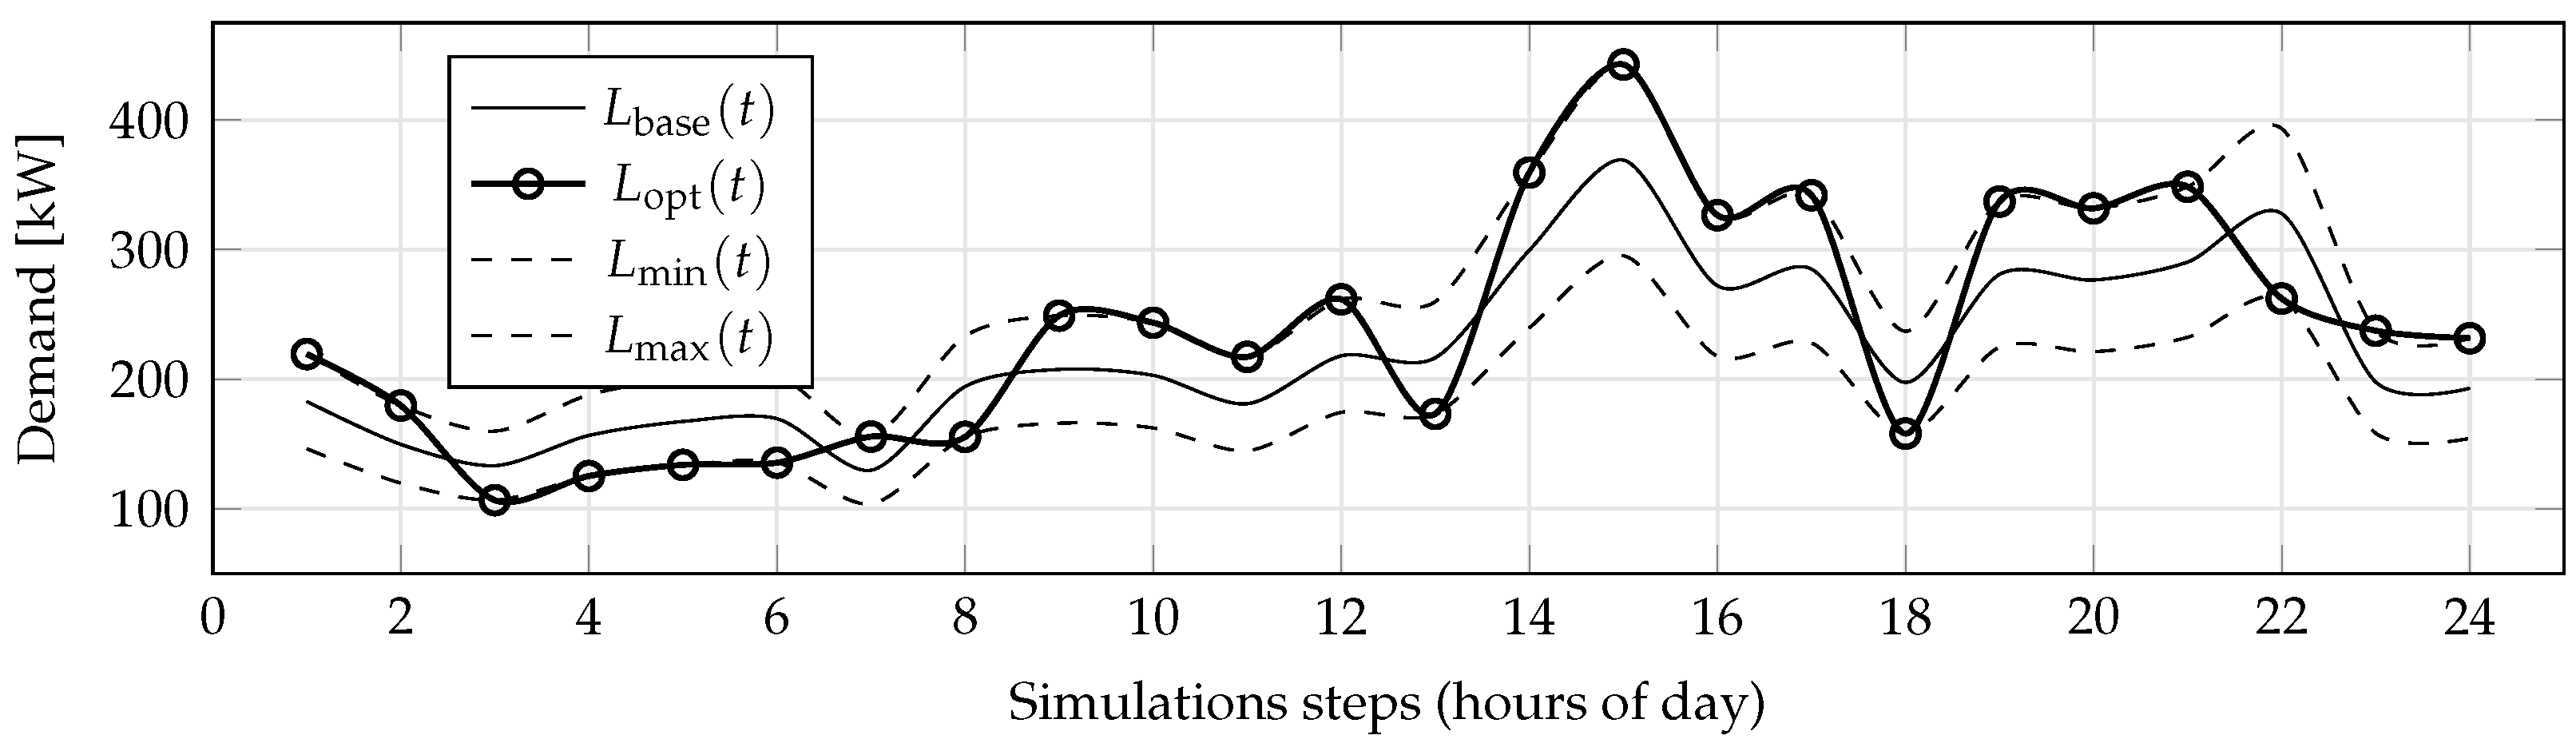
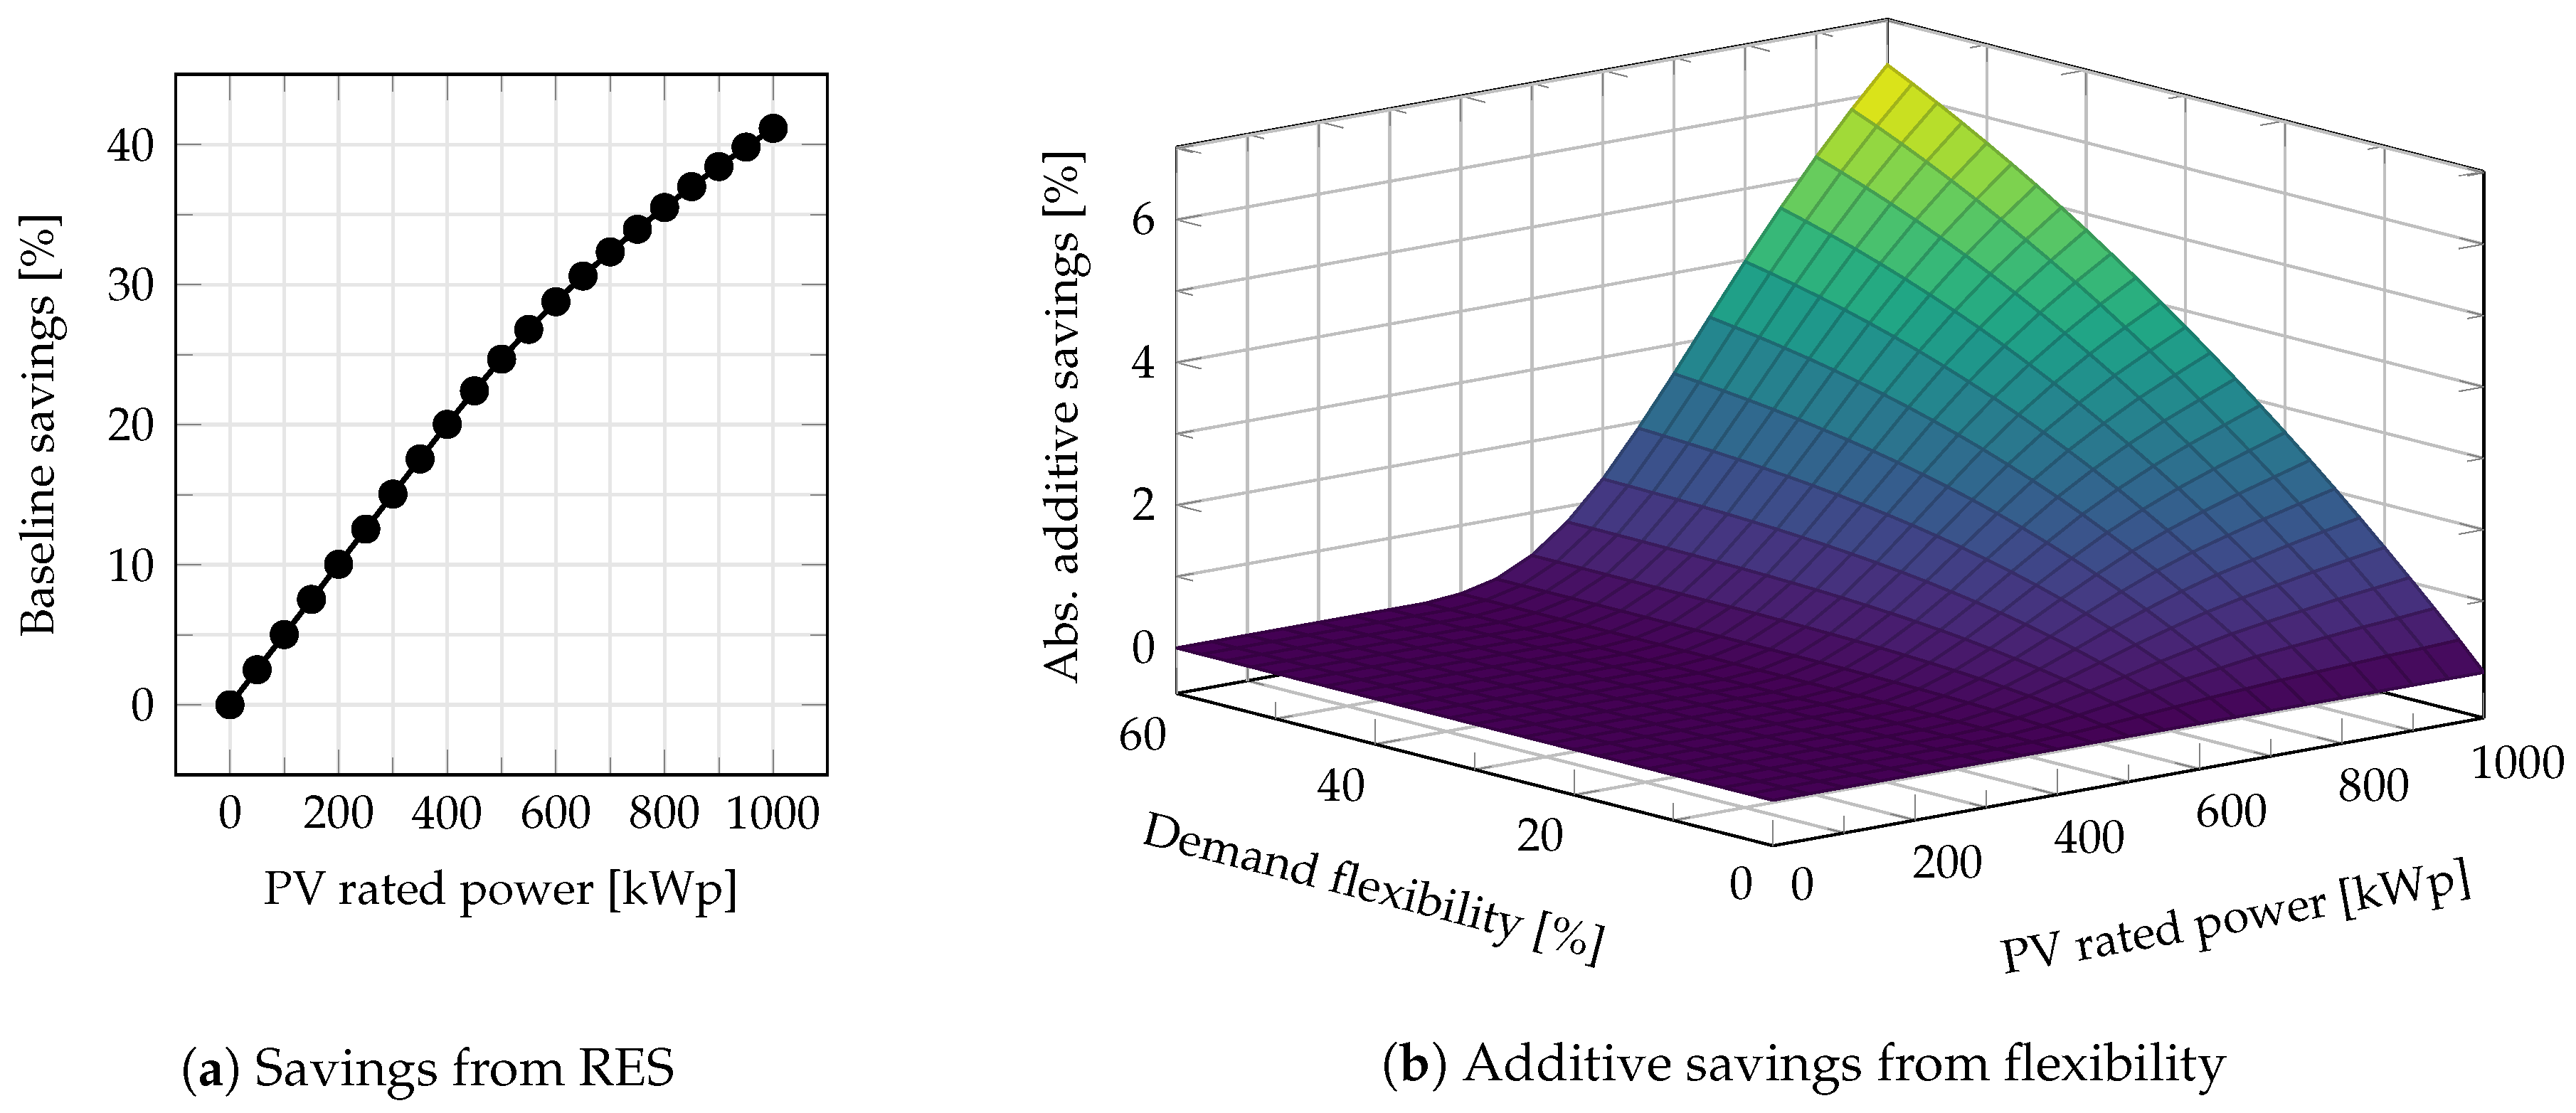
5.1. Simulation Outputs

With each simulation scenario being defined by a given PV rated power and demand flexibility level, by running individual optimization procedures, a set of results is obtained whereby a selection of monitored values is derived for each of the considered parameter combinations. Of these monitored values, the main focus of further analysis will be placed on total operating costs. Keeping in mind that, through previously completed projects, the island of La Graciosa has already installed around 50   kWp of solar generation capacity, this scenario could be considered as a baseline for further expansions of renewable production. However, for the sake of simplicity in this theoretical analysis, a baseline is actually assumed to be the case with no on-site renewable generation and no demand flexibility (i.e., all demand is met using energy imported from the submarine cable), as would be the case on an island with no existing renewable generation. For reference, the simulations show that the aforementioned existing implementation of PV generation saves a little over 2.5% in operating costs on a yearly basis (with monthly installments and maintenance accounted for) against the theoretical baseline with no renewable generation.
The first evaluated effect relates only to the potential savings that can be achieved from the implementation of renewable generation (i.e., without any demand flexibility). In order to derive this, only scenarios with zero flexibility are extracted and their operational costs are compared to the baseline scenario with no renewable generation. The resulting savings are shown on the left side of Figure 8.
Afterwards, each of the scenarios with renewable configurations is considered with different levels of demand flexibility in the range defined previously. When the initial savings achieved only due to the installation of renewable generation are subtracted, the additional (additive) saving levels can be calculated, and the appropriate values obtained in this way are presented in a three-dimensional space in Figure 8 where one dimension represents the considered rated power levels of PV generation, the second are the considered demand flexibility levels and the third are additional savings that can be achieved over the sole contribution of the renewable generation by utilizing demand flexibility. In other words, the total savings over baseline operational costs that can be achieved using both renewable generation and demand flexibility can be calculated by first determining the isolated impact of renewable generation given in the two-dimensional graph in Figure 8 and then adding an additional impact of demand flexibility as presented in the surface plot in Figure 8. By utilizing such a presentation, the impacts of renewable generation and demand flexibility are decoupled and can be analyzed separately while, at the same time, allowing for the total savings to be easily determined. Furthermore, more insight into the relation between additional savings, renewable generation capacity and the supposed flexibility is given by visualizing projections of the surface plot from Figure 8, as is presented in Figure 9.
By analyzing all three graphs, it can be clearly deduced that there is a notable increase in the performance that can be achieved by utilizing demand flexibility when there is ample renewable generation as the load can be more drastically shifted and aligned with renewable generation. An interesting point to note is that the impact from the demand flexibility only becomes apparent when the rated power capacity of RES becomes large enough (compared to the baseline demand levels) which, according to the results of the conducted simulations, is between 400   kWp and 450   kWp , at the point where the lines from the projections in the left of Figure 9 begin to diverge. Having in mind the fact that the efficiency of PV generation is calculated very conservatively with noticeable losses, it should be mentioned that this point of divergence may occur with less renewable generation if a more efficient system were to be considered. Also, the second projection graph from Figure 9 shows that for each renewable generation capacity, the returns tend to level off after a certain amount of flexibility with the value of that point increasing as the capacity of the generation increases.
In order to illustrate the relationship between renewable generation capacity and demand flexibility, this theoretical analysis considers very large supposed amounts of demand flexibility which are difficult to achieve in real-world practice [75] while, on the other hand, results from Section 4.1 show promising potential in terms of demand flexibility for a motivated island community. Therefore, a selection of results that are more likely to be achieved is extracted from the experiments and presented in Table 4. This selection is coupled with several PV installations of different capacities, with the two medium sized capacities being considered potentially realistic, considering land restrictions limiting RES expansion to inhabited areas and the RES potential described and specifically analyzed for La Graciosa in Section 4.2. As can be observed from these results, for example, even with realistically achievable levels of supposed flexibility (i.e., 30%), the addition of demand flexibility can result in a notable decrease of operational costs. In the case with a PV installation capacity of 800   kWp , the decrease is 2.66%, which equates to 7.5% of the impact achieved solely by the utilization of that same renewable source with no flexibility. Also, Table 4 shows that some scenarios with lower renewable generation and higher demand flexibility can perform better than those with higher generation and lower flexibility. This indicates that considerable savings can be achieved by boosting social engagement rather than investing in equipment.
In the end, it is worth mentioning that the considered model supposes a constant level of demand flexibility. However, by utilizing variable pricing schemes, DR programmes and others means of boosting community engagement, the users can be influenced to be more adaptive, especially in periods of peak demand, which could further increase the potential savings.

5.2. Sensitivity Analysis

In order to ascertain the stability of the obtained result and get a deeper understanding of how variability of different input parameters affects the savings, a limited sensitivity analysis was conducted. Namely, for the previously considered realistic scenario with 800   kWp of PV and 30% demand flexibility, each sample of the year-long hourly demand and predicted PV production was varied in the range between 95% and 105% of the corresponding nominal value, as dictated by a pseudo-random uniform distribution. These modified inputs were independently generated 200 times which correspond to 200 instances of optimizations that were conducted in this sensitivity analysis. By analyzing the achieved savings from demand flexibility in the same manner as was done in the previous part of this section, a distribution of the achievable additional savings due to demand flexibility can be observed in the form of a histogram, as given in Figure 10. Furthermore, using this data, an approximation of the cumulative distribution function (CDF) can be obtained which can also be used to reach the same conclusion.
As clearly shown by the data, almost all of the instances have resulted in the additive savings between 2.55% and 2.7%, with the nominal value previously calculated to be 2.66%. More precisely, around 78% of the outputs of 200 instances belong to a range between 2.6% and 2.7%. By comparing the mentioned four range limits with the nominal savings percentages from Table 4 for the same 800   kWp installation, but with adjacent flexibility levels (i.e., 2.31% savings for 25% flexibility and 2.96% savings for 35% flexibility), it can be concluded that even with a moderate amount of variability in the inputs, the results appear to be relatively stable since the limits do not overlap with the other savings.

6. Conclusions

This paper presents a view into ways in which the unique problem of increasing self-sustainability levels of geographical islands in terms of electric energy supply can be achieved when crucial flexibility in user demand is unlocked, allowing for it to be adjusted to an intermittent energy supply provided by clean on-site renewable generation. Renewable energy supply and demand flexibility are integrated in a comprehensive simulation procedure that determines the optimal energy management strategy, and in doing so, the relationship between the installed capacity of renewable generation, supposed demand flexibility and the expected savings is derived and discussed.
The results simulating 525 different combinations of PV generation capacity and demand flexibility levels show that, although significant savings in yearly operational costs can be achieved using only renewable generation and no demand flexibility, notable additional savings can be obtained with community participation through users’ willingness to adjust their load. In some cases, even with realistic flexibility levels, the impact of load elasticity on the total savings was large enough for a given scenario to be more cost-effective than the next few larger renewable installations with less flexibility. In summary, as the survey results in Section 4.1 suggest high interest in sustainability issues, strong community identity and willingness to use renewable technologies among residents, different motivation factors (such as incentive-based (ToU), DR programmes) should be effective for island users. Moreover, the simulation results presented in Section 5 show that significant economic benefits will be leveraged if residents display flexibility. Concretely, with the increase in installed renewable capacity, the achievable savings attributed purely to demand flexibility go from negligible (between 0.02% and 0.04%) at 400 kWp to noticeable (between around 1% and 4.3%) at 1000 kWp. Furthermore, depending on the level of this flexibility, the increase for 10% and 35% boosts these savings 2.9 fold for 600   kWp of PV capacity and 3.7 fold for 800   kWp .
Overall, this indicates that an incentive-based programme will be both accepted by residents and effective at leveraging wider benefits, in turn giving some preliminary support to the combined approach of residential surveys and calibrated simulations. Given these results, it can be concluded that demand flexibility without significant disruptions to user comfort can be utilized as a powerful mechanism to augment some and replace other technologies while returning noticeable savings in operational costs, but also increasing the supply security and paving the way for a more resilient island energy supply network. In cases where the production and demand can technically be balanced using existing solutions, demand flexibility can be utilized as a means to ease this process but also lower costs and reduce the need for expensive and environmentally unfriendly storage solutions. Community user participation, however, remains key to achieving the benefits of this mechanism.
The limiting factors of this study have been isolated to be policy barriers for novel incentive-based programmes that would drive community participation and motivate the users to display flexibility as well as local regulatory constraints preventing the expansion of RES installments. The latter is especially crucial with regards to geographical islands as they are often the objects of strict laws designed to protect their unique environments. Further efforts in this field should be aimed at looking into novel and ecologically friendly generation technologies that would comply with local regulation, but a focus should also be placed on expanding DR and other similar programmes into the residential sector as contemporary efforts in this regard are often aimed solely at the industry.

Author Contributions

Conceptualization, N.T., M.B., H.P., T.C.; methodology, M.J., H.P., T.C. and D.A.G.; software, M.J.; validation, M.J.; formal analysis, M.J., A.B., C.T. and D.A.G.; investigation, H.P., A.B. and T.C.; data curation, M.J.; writing—original draft preparation, M.J., H.P., A.B., T.C. and D.A.G.; writing—review and editing, N.T., M.B, H.P., A.B., T.C., M.S. and G.P.; visualization, M.J.; project administration, M.J., N.T. and M.B. All authors have read and agreed to the published version of the manuscript.

Funding

The research presented in this paper is partly financed by the European Union (H2020 REACT project, Grant Agreement No.: 824395) and partly by the Ministry of Education, Science and Technological Development of the Republic of Serbia.

Acknowledgments

The authors would like to especially express their gratitude towards the team from Feníe Energía for the energy consumption data that was kindly provided regarding the La Graciosa use case.

Conflicts of Interest

The authors declare no conflict of interest. The funders had no role in the design of the study; in the collection, analyses, or interpretation of data; in the writing of the manuscript, or in the decision to publish the results.

References

  1. Ghanem, D.A.; Mander, S.; Gough, C. “I think we need to get a better generator”: Household resilience to disruption to power supply during storm events. Energy Policy 2016, 92, 171–180. [Google Scholar] [CrossRef]
  2. Christine, D.; Kathryn, L.; Sarah, J.; Kazuhiko, I.; Thomas, M. Health Impacts of Citywide and Localized Power Outages in New York City. Environ. Health Perspect. 2018, 126. [Google Scholar] [CrossRef]
  3. Uche-Soria, M.; Rodríguez-Monroy, C. Energy planning and its relationship to energy poverty in decision making. A first approach for the Canary Islands. Energy Policy 2020, 140, 111423. [Google Scholar] [CrossRef]
  4. International Renewable Energy Agency (IRENA). A Path to Prosperity: Renewable Energy for Islands; International Renewable Energy Agency: Bonn, Germany, 2016. [Google Scholar]
  5. Smart Islands Initiative. Smart Islands Declaration: New Pathways for European Islands; Smart Islands Initiative 2017. Available online: www.smartislandsinitiative.eu (accessed on 22 May 2020).
  6. Gangale, F.; Mengolini, A.; Onyeji, I. Consumer engagement: An insight from smart grid projects in Europe. Energy Policy 2013, 60, 621–628. [Google Scholar] [CrossRef]
  7. Verbong, G.P.J.; Beemsterboer, S.; Sengers, F. Smart grids or smart users? Involving users in developing a low carbon electricity economy. Energy Policy 2013, 52, 117–125. [Google Scholar] [CrossRef]
  8. Claudy, M.C.; Michelsen, C.; O’Driscoll, A.; Mullen, M.R. Consumer awareness in the adoption of microgeneration technologies: An empirical investigation in the Republic of Ireland. Renew. Sustain. Energy Rev. 2010, 14, 2154–2160. [Google Scholar] [CrossRef]
  9. Palm, J.; Tengvard, M. Motives for and barriers to household adoption of small-scale production of electricity: Examples from Sweden. Sustain. Sci. Pract. Policy 2011, 7, 6–15. [Google Scholar] [CrossRef][Green Version]
  10. Kalkbrenner, B.J.; Roosen, J. Citizens’ willingness to participate in local renewable energy projects: The role of community and trust in Germany. Energy Res. Soc. Sci. 2016, 13, 60–70. [Google Scholar] [CrossRef]
  11. Bauwens, T. Explaining the diversity of motivations behind community renewable energy. Energy Policy 2016, 93, 278–290. [Google Scholar] [CrossRef]
  12. Vugt, M.V. Central, Individual, or Collective Control?: Social Dilemma Strategies for Natural Resource Management. Am. Behav. Sci. 2002. [Google Scholar] [CrossRef][Green Version]
  13. Hammami, S.M.; chtourou, S.; Triki, A. Identifying the determinants of community acceptance of renewable energy technologies: The case study of a wind energy project from Tunisia. Renew. Sustain. Energy Rev. 2016, 54, 151–160. [Google Scholar] [CrossRef]
  14. Walker, G.; Devine-Wright, P.; Hunter, S.; High, H.; Evans, B. Trust and community: Exploring the meanings, contexts and dynamics of community renewable energy. Energy Policy 2010, 38, 2655–2663. [Google Scholar] [CrossRef]
  15. González, A.M.; Sandoval, H.; Acosta, P.; Henao, F. On the Acceptance and Sustainability of Renewable Energy Projects—A Systems Thinking Perspective. Sustainability 2016, 8, 1171. [Google Scholar] [CrossRef][Green Version]
  16. Dwyer, P.C.; Maki, A.; Rothman, A.J. Promoting energy conservation behavior in public settings: The influence of social norms and personal responsibility. J. Environ. Psychol. 2015, 41, 30–34. [Google Scholar] [CrossRef]
  17. Gadenne, D.; Sharma, B.; Kerr, D.; Smith, T. The influence of consumers’ environmental beliefs and attitudes on energy saving behaviours. Energy Policy 2011, 39, 7684–7694. [Google Scholar] [CrossRef]
  18. Mulugetta, Y.; Jackson, T.; van der Horst, D. Carbon reduction at community scale. Energy Policy 2010, 38, 7541–7545. [Google Scholar] [CrossRef]
  19. García-Valiñas, M.A.; Macintyre, A.; Torgler, B. Volunteering, pro-environmental attitudes and norms. J. Socio-Econ. 2012, 41, 455–467. [Google Scholar] [CrossRef]
  20. Walker, G.; Cass, N. Carbon reduction, ‘the public’ and renewable energy: Engaging with socio-technical configurations. Area 2007, 39, 458–469. [Google Scholar] [CrossRef]
  21. Brummer, V. Community energy—Benefits and barriers: A comparative literature review of Community Energy in the UK, Germany and the USA, the benefits it provides for society and the barriers it faces. Renew. Sustain. Energy Rev. 2018, 94, 187–196. [Google Scholar] [CrossRef]
  22. Bomberg, E.; McEwen, N. Mobilizing community energy. Energy Policy 2012, 51, 435–444. [Google Scholar] [CrossRef]
  23. Dóci, G.; Vasileiadou, E. “Let’s do it ourselves” Individual motivations for investing in renewables at community level. Renew. Sustain. Energy Rev. 2015, 49, 41–50. [Google Scholar] [CrossRef][Green Version]
  24. Van der Schoor, T.; Scholtens, B. Power to the people: Local community initiatives and the transition to sustainable energy. Renew. Sustain. Energy Rev. 2015, 43, 666–675. [Google Scholar] [CrossRef][Green Version]
  25. Christensen, T.H.; Friis, F.; Bettin, S.; Throndsen, W.; Ornetzeder, M.; Skjølsvold, T.M.; Ryghaug, M. The role of competences, engagement, and devices in configuring the impact of prices in energy demand response: Findings from three smart energy pilots with households. Energy Policy 2020, 137, 111142. [Google Scholar] [CrossRef]
  26. Sperling, K. How does a pioneer community energy project succeed in practice? The case of the Samsø Renewable Energy Island. Renew. Sustain. Energy Rev. 2017, 71, 884–897. [Google Scholar] [CrossRef]
  27. Bouly de Lesdain, S. The photovoltaic installation process and the behaviour of photovoltaic producers in insular contexts: The French island example (Corsica, Reunion Island, Guadeloupe). Energy Effic. 2019, 12, 711–722. [Google Scholar] [CrossRef]
  28. Morris, P.; Vine, D.; Buys, L. Critical Success Factors for Peak Electricity Demand Reduction: Insights from a Successful Intervention in a Small Island Community. J. Consum. Policy 2018, 41, 33–54. [Google Scholar] [CrossRef]
  29. Berger, L.T.; Iniewski, K. Smart Grid Applications, Communications, and Security; Wiley: Hoboken, NJ, USA, 2012. [Google Scholar]
  30. Anuebunwa, U.R.; Rajamani, H.S.; Pillai, P.; Okpako, O. Evaluation of user participation capabilities in demand response programs for smart home applications. In Proceedings of the 2017 IEEE PES PowerAfrica, Accra, Ghana, 27–30 June 2017; pp. 483–488. [Google Scholar] [CrossRef]
  31. Wang, Z.; Paranjape, R.; Sadanand, A.; Chen, Z. Residential demand response: An overview of recent simulation and modeling applications. In Proceedings of the 2013 26th IEEE Canadian Conference on Electrical and Computer Engineering (CCECE), Regina, SK, Canada, 5–8 May 2013; pp. 1–6. [Google Scholar] [CrossRef]
  32. Zhao, S.; Ming, Z. Modeling demand response under time-of-use pricing. In Proceedings of the 2014 International Conference on Power System Technology, Chengdu, China, 20–22 October 2014; pp. 1948–1955. [Google Scholar] [CrossRef]
  33. Crosbie, T.; Broderick, J.; Short, M.; Charlesworth, R.; Dawood, M. Demand Response Technology Readiness Levels for Energy Management in Blocks of Buildings. Buildings 2018, 8, 13. [Google Scholar] [CrossRef][Green Version]
  34. Bray, R.; Woodman, B. Barriers to Independent Aggregators in Europe (EPG Working Paper: EPG1901); University of Exeter: Exeter, UK, 2019. [Google Scholar]
  35. Crosbie, T.; Vukovic, V.; Short, M.; Dawood, N.; Charlesworth, R.; Brodrick, P. Future Demand Response Services for Blocks of Buildings. In Smart Grid Inspired Future Technologies; Lecture Notes of the Institute for Computer Sciences, Social Informatics and Telecommunications Engineering; Hu, J., Leung, V.C.M., Yang, K., Zhang, Y., Gao, J., Yang, S., Eds.; Springer International Publishing: Cham, Switzerland, 2017; pp. 118–135. [Google Scholar] [CrossRef][Green Version]
  36. Smart Energy Demand Coalition (SEDC). Smart Energy Demand Coalition: A Demand Response Action Plan for Europe; Smart Energy Demand Coalition (SEDC): Brussels, Belgium, 2017. [Google Scholar]
  37. Elliott, D.L.; Holladay, C.G.; Barchet, W.R.; Foote, H.P.; Sandusky, W.F. Wind Energy Resource Atlas of the United States. 1987. Available online: rredc.nrel.gov (accessed on 29 April 2020).
  38. Reno, M.; Hansen, C.; Stein, J. Global Horizontal Irradiance Clear Sky Models: Implementation and Analysis; Sandia National Laboratories: Albuquerque, NM, USA, 2012. [Google Scholar] [CrossRef][Green Version]
  39. US Departmant of Energy. New Stream-Reach Hydropower Development; US Departmant of Energy: Washinton, DC, USA, 2014.
  40. World Bank Group. Global Solar Atlas; World Bank Group: Washington, DC, USA, 2019. [Google Scholar]
  41. NEWA. About the New European Wind Atlas. 2019. Available online: map.neweuropeanwindatlas.eu (accessed on 4 April 2020).
  42. Natural Resources Canada. RETScreen; Natural Resources Canada: Ottawa, Canada, 2010. [Google Scholar]
  43. Barthelmie, R.J.; Wang, H.; Doubrawa, P.; Pryor, S.C. Best Practice For Measuring Wind Speeds and Turbulence Offshore Through In-Situ And Remote Sensing Technologies; report; eCommons: Boston, MA, USA, 2016. [Google Scholar] [CrossRef]
  44. van Wees, J.-D.; Boxem, T.; Calcagno, P.; Dezayes, C.; Lacasse, C.; Manzella, A. GEOELEC Project Deliverable 2.1: A Methodology for Resource Assessment and Application to Core Countries. 2013. Available online: www.geoelec.eu (accessed on 29 April 2020).
  45. Sierra, J.P.; González-Marco, D.; Sospedra, J.; Gironella, X.; Mösso, C.; Sánchez-Arcilla, A. Wave energy resource assessment in Lanzarote (Spain). Renew. Energy 2013, 55, 480–489. [Google Scholar] [CrossRef]
  46. Salvatore, F.; Lidderdale, A.; Dick, C.; Richon, J.; Porter, K.; Maisondieu, C.; Johnston, C. MARINET Project Deliverable 4.11: Report New Instrumentation and Field Measuring Technology for Tidal Currents. 2015. Available online: www.marinet2.eu (accessed on 29 April 2020).
  47. Cassar, D.; Erika, M.; Evangelos, R.; Christoforos, P.; Pfeifer, A.; Groppi, D.; Krajacic, G.; Garcia, D.A. A Methodology for Energy Planning in Small Mediterranean Islands, the Case of the Gozo Region. In Proceedings of the 2019 1st International Conference on Energy Transition in the Mediterranean Area (SyNERGY MED), Cagliari, Italy, 28–30 May 2019; pp. 1–6. [Google Scholar] [CrossRef]
  48. Szabó, S.; Kougias, I.; Moner-Girona, M.; Bódis, K. Sustainable Energy Portfolios for Small Island States. Sustainability 2015, 7, 12340–12358. [Google Scholar] [CrossRef][Green Version]
  49. Dominković, D.F.; Stark, G.; Hodge, B.M.; Pedersen, A.S. Integrated Energy Planning with a High Share of Variable Renewable Energy Sources for a Caribbean Island. Energies 2018, 11, 2193. [Google Scholar] [CrossRef][Green Version]
  50. Uche-Soria, M.; Rodríguez-Monroy, C. Special Regulation of Isolated Power Systems: The Canary Islands, Spain. Sustainability 2018, 10, 2572. [Google Scholar] [CrossRef][Green Version]
  51. Li, X.; Chalvatzis, K.J.; Stephanides, P. Innovative Energy Islands: Life-Cycle Cost-Benefit Analysis for Battery Energy Storage. Sustainability 2018, 10, 3371. [Google Scholar] [CrossRef][Green Version]
  52. Wu, F.; Yang, L. Simulation of the integrated energy system for isolated island. In Proceedings of the 2017 China International Electrical and Energy Conference (CIEEC), Beijing, China, 25–27 October 2017; pp. 527–531. [Google Scholar] [CrossRef]
  53. Poncela, M.; Purvins, A.; Chondrogiannis, S. Pan-European Analysis on Power System Flexibility. Energies 2018, 11, 1765. [Google Scholar] [CrossRef][Green Version]
  54. Finck, C.; Li, R.; Zeiler, W. Optimal control of demand flexibility under real-time pricing for heating systems in buildings: A real-life demonstration. Appl. Energy 2020, 263, 114671. [Google Scholar] [CrossRef]
  55. El Geneidy, R.; Howard, B. Contracted energy flexibility characteristics of communities: Analysis of a control strategy for demand response. Appl. Energy 2020, 263, 114600. [Google Scholar] [CrossRef]
  56. Favre-Perrod, P. A vision of future energy networks. In Proceedings of the 2005 IEEE Power Engineering Society Inaugural Conference and Exposition in Africa, Durban, South Africa, 11–15 July 2005; pp. 13–17. [Google Scholar] [CrossRef]
  57. Batić, M.; Tomašević, N.; Beccuti, G.; Demiray, T.; Vraneš, S. Combined energy hub optimisation and demand side management for buildings. Energy Build. 2016, 127, 229–241. [Google Scholar] [CrossRef]
  58. Salom, J.; Marszal, A.J.; Widén, J.; Candanedo, J.; Lindberg, K.B. Analysis of load match and grid interaction indicators in net zero energy buildings with simulated and monitored data. Appl. Energy 2014, 136, 119–131. [Google Scholar] [CrossRef]
  59. Barney, A.; Polatidis, H. REACT Project Deliverable 2.1: Assessment of RES Potential at Pilot Sites. REACT: Catalonia, Spain, 2019; submitted. [Google Scholar]
  60. Jelić, M.; Tomašević, N.; Pujić, D.; Biosca, L.M.; Fabres, J.; Totschnig, G. REACT Project Deliverable 2.2: RES/storage enabled infrastructure planning. REACT: Catalonia, Spain, 2019; submitted. [Google Scholar]
  61. Ghanem, D.A.; Crosbie, T. REACT Project Deliverable 4.1: Criteria and framework for participant recruitment. REACT: Catalonia, Spain, 2020; submitted. [Google Scholar]
  62. Canary Islands Technological Institute (ITC). Plan de Acción Insular para la Sostenibilidad Energética para La Graciosa (2012-20); Canary Islands Technological Institute (ITC): Las Palmas de Gran Canaria, Spain, 2013; Available online: www.datosdelanzarote.com (accessed on 29 April 2020).
  63. Consiglio Nazionale dei Geologi. Geotermia; Consiglio Nazionale dei Geologi: Rome, Italy, 2019; Available online: www.cngeologi.it (accessed on 29 April 2020).
  64. Luis Manuel Santana Perez. El clima de La Graciosa, 2016. Available online: www.agrolanzarote.com (accessed on 28 April 2020).
  65. SISIFO. DataInput—Simulación Fotovoltaica; SISIFO: Madrid, Spain, 2019; Available online: www.sisifo.info (accessed on 28 April 2020).
  66. Comune di Carloforte—Isola Ecologica del Mediterraneo. Piano d’azione per l’energia Sostenibile; Comune di Carloforte—Isola Ecologica del Mediterraneo, 2012. Available online: https://mycovenant.eumayors.eu/docs/seap/3594_1339169680.pdf (accessed on 28 April 2020).
  67. Global Modeling and Assimilation Office (GMAO). Energía Geotérmica—CanariWiki; GMAO: Greenbelt, MD, USA, 2015. [Google Scholar]
  68. Ecar Energy Ltd.; ESB International and Mullany Engineering Consultancy Ltd. All Electric Aran Islands Concept: A Design for a Wind and Ocean Powered System Prepared for the He Sustainable Energy Authority of Ireland & Department of Arts, Heritage and the Gaeltacht; Ecar Energy Ltd., ESB International and Mullany Engineering Consultancy Ltd.: Dublin, Ireland, 2015. [Google Scholar]
  69. Ministerio para la Transición Ecológica y el Reto Demográfico. La Graciosa. 2019. Available online: www.miteco.gob.es (accessed on 28 April 2020).
  70. Comisión Nacional de los Mercados y la Competencia. Resolución de 11 de diciembre de 2019. BOE-A-2019-18423, 307, 139647-139668, 2019. Available online: www.boe.es (accessed on 10 June 2020).
  71. Gelaro, R.; McCarty, W.; Suárez, M.J.; Todling, R.; Molod, A.; Takacs, L.; Randles, C.A.; Darmenov, A.; Bosilovich, M.G.; Reichle, R.; et al. The Modern-Era Retrospective Analysis for Research and Applications, Version 2 (MERRA-2). J. Clim. 2017, 30, 5419–5454. [Google Scholar] [CrossRef] [PubMed]
  72. Pfenninger, S.; Staffell, I. Long-term patterns of European PV output using 30 years of validated hourly reanalysis and satellite data. Energy 2016, 114, 1251–1265. [Google Scholar] [CrossRef][Green Version]
  73. OMIE. Electricity Market | OMIE; OMIE: Madrid, Spain, 2020. [Google Scholar]
  74. International Renewable Energy Agency (IRENA). Renewable Power Generation Costs in 2018; International Renewable Energy Agency: Bonn, Germany, 2019. [Google Scholar]
  75. European Environmental Agency. Achieving Energy Efficiency through Behaviour Change: What Does It Take; European Environmental Agency: Copenhagen, Demark, 2013. [Google Scholar]
Figure 1. Simplified flowchart illustration of the proposed optimization procedure.
Energies 13 03386 g001
Figure 2. Illustration of the structure of the Energy Hub instance.
Energies 13 03386 g002
Figure 3. Illustration of the demand flexibility band and the optimized profile.
Energies 13 03386 g003
Figure 4. Seasonal variability in hourly irradiance components (a,b) and temperature (c) measurements for La Graciosa illustrated using box plots in monthly steps.
Energies 13 03386 g004
Figure 5. Monthly seasonal variations in hourly electric energy consumption share for working days (a), weekend days (b) and total monthly electric energy consumptions (c) based on data provided by Fenie Energia.
Energies 13 03386 g005
Figure 6. Estimated electric demand data for La Graciosa.
Energies 13 03386 g006
Figure 7. Estimated averaged and normalized price profiles for working and weekend days (a) and reported average daily prices (b) for the Spain wholesale electric energy market in 2018.
Energies 13 03386 g007
Figure 8. Results of the simulations showing the (baseline) total operating costs savings attributed only to the deployment of renewable energy (i.e., without demand flexibility) (a) and the additional savings that can be achieved with different levels of demand flexibility (b). All savings are calculated against the baseline with no demand flexibility and no renewable generation.
Energies 13 03386 g008
Figure 9. Two-dimensional projections of the additional achievable savings to the PV rated power-savings plane (a) and flexibility-savings plane (b). The color shift from blue to green corresponds to the increase of flexibility on the left graph and the increase in PV rated power on the right graph.
Energies 13 03386 g009
Figure 10. Histogram illustrating the distribution of the absolute additive savings in 25 bins for the considered realistic use case (a) and the corresponding estimate of the cumulative distribution function (b).
Energies 13 03386 g010
Table 1. Variable nomenclature overview.
LabelUnitDescriptionLabelUnitDescription
P in ( t ) [ kW ] Imported power variable vector to the Energy Hub f L [ % ] Load flexibility level
Q in ( t ) [ kW ] Charge/discharge variable vector from input storage of the Energy HubJ, J opex any, [ EUR ] Criterion function and operational costs as a criterion function
P cin ( t ) [ kW ] Power inflow variable vector to the conversion stage of the Energy Hub n h ( t ) , n m ( t ) [ % ] Hourly and monthly noise levels
P cout ( t ) [ kW ] Power outflow variable vector from the conversion stage of the Energy Hub η t , η i [ % ] Grid transformer and invertor efficiency
P exp ( t ) [ kW ] Exported power variable vector from the Energy hub B i [ EUR ] Initial (equipment) acquisition cost
Q out ( t ) [ kW ] Charge/discharge variable vector from output storage of the Energy Hub γ i [ a ] Expected (equipment) lifetime
L ( t ) [ kW ] Load variable vector of the Energy Hub δ [ % ] Monthly discount rate
L min ( t ) , L max ( t ) [ kW ] Lower and upper load flexibility margins X i [ EUR ] Monthly expenditure
L base ( t ) [ kW ] Predicted load level C total [ EUR ] Total costs of running the system
Table 2. Motivations for participation in island sustainable energy projects in island communities and findings from a survey conducted in La Graciosa.
MotivationDescriptionRelevance to Island CommunitiesFocus Case Island La Graciosa
Community identityAn intention and desire to make the community better for everyone; benefits oriented to the community and away from the self.Securing supply for the island and becoming more energy autonomous. Financial savings from the community energy project being re-directed to other community projects/investments; integrating with the community and having shared experiences.The majority of respondents are ‘motivated’ or ‘strongly motivated’ by environmental and altruistic values suggesting a strong community identity. For example, 75% of respondents from La Graciosa, report that they are motivated to use smart grid technologies by a desire to reduce CO2 emissions.
FinancialSave on energy bills; receive financial rewards from energy supplier.Lower energy costs due to better security of supply.74% of respondents in La Graciosa indicate that energy saving is very important to them.
EnvironmentalReducing CO2 emissions; increasing the sustainability of the island communityTaking action on CO2 reductions empowers island communities in the face of climate change.80% of the respondents from La Graciosa report that the use of renewable energy technologies is very important to them.
Social normsFollowing the example of others in the community; being sensitive to the opinion of others.The size and closeness of communities driving a sense of togetherness and responsibility, generating positive social norms.Social norms pertaining to sustainability and high-end technologies are reported as ‘strongly motivating’ with 71% of respondents in La Graciosa being interested in attaining a sustainable character for their homes.
Table 3. Wind, solar and wave power potentials on the islands of La Graciosa, San Pietro and Aran.
IslandAnnual Average Wind Speed at 10 m Height [ m / s ]Annual Average Hourly Global Horizontal Rrradiance [ W / m 2 ]Average Annual Wave Power Density [ W / m ]Sources
La Graciosa4.1205.731.0[45,64,65]
San Pietro6.1171.5N/A[66]
Aran Islands7.0128.620.8[67,68]
Table 4. A summary of achievable additive savings (expressed in percent of baseline operational costs) over the baseline savings achieved using only renewable generation and ratio of these additional savings when compared with baseline savings with the same PV power (in percentage, given in in parentheses) with realistic demand flexibility levels and supposed high renewable penetration.
dem. flex. [%]PV Rated Power [kWp]
4006008001000
100.02 (0.1)0.39 (1.4)0.80 (2.2)1.06 (2.6)
150.03 (0.2)0.69 (2.4)1.51 (4.3)2.04 (5.0)
200.04 (0.2)0.84 (2.9)1.93 (5.4)2.65 (6.4)
250.04 (0.2)0.96 (3.3)2.31 (6.5)3.23 (7.8)
300.04 (0.2)1.06 (3.7)2.66 (7.5)3.77 (9.2)
350.04 (0.2)1.13 (3.9)2.96 (8.3)4.29 (10.4)

