Article

Renewable Energy Auction Prices: Near Subsidy-Free?

Electrical Engineering Department, Escola d′Enginyeria de Barcelona Est, Polytechnic University of Catalonia, 08930 Sant Adrià de Besòs, Barcelona, Spain
*
Author to whom correspondence should be addressed.
Energies 2020, 13(13), 3383; https://doi.org/10.3390/en13133383
Submission received: 17 May 2020 / Revised: 22 June 2020 / Accepted: 28 June 2020 / Published: 1 July 2020
(This article belongs to the Section C: Energy Economics and Policy)

Abstract

:
The latest trend of low record bid prices in renewable energy auctions has raised concerns on the effective deployment of the winning projects. A survey of recent auction data from several countries, technologies and remuneration designs is analysed and compared with the corresponding levelised costs of energy (LCOEs) to draw first insights on their viability. A critical assessment of the ability of the LCOE for determining the adequate bid level is then performed and the preliminary unviable results of selected mature technologies are further investigated using improved profitability metrics as the project and equity net present value (NPV) and internal rate of return (IRR). As representative examples, the analysed Danish 2019 onshore wind and photovoltaics (PV) auctions require very specific scenarios to become viable, which cast doubts on their effective implementation. Under the assumptions of a realistic base case, the sensitivity analysis revealed that either 59% of decrease in the weighted average cost of capital (WACC), or 37% of discount on the investment cost or a 3.6% annual increment in the mean market price is needed for achieving the NPV break-even in the onshore wind case. Likewise, the PV case is unprofitable whatever the WACC may be, and either a 60% discount on the investment cost or a 6.8% annual increment in the mean market price is needed for the NPV to break-even. Although some projects could be relying on indirect revenues or additional sources of incomes beyond the auction support, it remains to see if they are finally materialised.

1. Introduction

1.1. Setting the Context

Auctions are progressively adopted as a support mechanism for utility-scale electricity from renewable energy sources (RES) by a growing number of countries. In the two-year period 2017–2018, 55 different countries auctioned around 111 GW of electrical capacity from RES. The more mature RES technologies accounted for the major share (97%) of the auctioned volume, namely, 52% for solar photovoltaics (PV), and 36% for onshore wind, along with a significant 9% for offshore wind [1].
The competitive nature of auctions has played a role in the consistent downward trend followed by the bid prices in the last years. In this sense, reductions near 76% and 17% from 2010 levels have been reported for 2018 global weighted average auction prices of solar PV and onshore wind, respectively (prices from feed-in-premium auctions are not considered in these numbers) [1]. Although results on a country-level may vary, these figures expose well the global shift towards reduced support levels. Even developing countries, with higher risks associated to RES investments, have joined this overall trend of low-price level auctions [2,3].
Moving beyond the mere progressive reduction in bid prices, recent years have seen the emergence of winning projects bidding at 0 €/MWh. Significantly, a number of these projects even correspond to offshore wind, which is not among the cheapest most mature RES technologies. Although it is not certainly the rule, this phenomenon has captured the attention of specialised media and begins to be addressed by the academic community. Frequently, these projects relying on the wholesale electricity price have been termed as “zero-subsidy” or “subsidy-free” [1,2].
This recent trend of low record bid prices or even unsubsidised winning bids has been enthusiastically commended and regarded as a sign that additional support for some technologies could be no longer necessary. However, at the same time it has also raised concerns about the final successful implementation of the projects, all the more so bearing in mind past failure experiences. Actually, cost-efficiency is not the only objective pursued by energy policies, but also effectiveness in capacity deployment for achieving RES and climate goals [4].

1.2. State-of-the-Art

Although there is a significant body of literature analysing the outcomes of the first auctions of electricity from RES, the most recent period witnessing record low bid prices and even “subsidy-free” winning projects has still received scarce attention from academia. Reasons for this could include the reluctance of developers to disclose details of the bidding projects and the fact that government institutions in charge of auctions do not always publish timely and complete information of all the relevant details. Frequently, the possibility of a thorough analysis relies on the periodic issuance of data by specific sectoral or energy agencies either at national or international levels [1,2].
In order to portray the current price trends, the state-of-the-art has been limited to those references including most recent data partly or totally related to the period of analysis starting at 2017. This lower time boundary is selected in line with the most updated reports by RES energy agencies currently publicly available [1]. In this sense, some references can be found dealing with auctions at particular countries [5,6,7,8,9,10,11,12,13,14,15,16] or for various country groupings [17,18,19].
The effect of the design of the Danish auctions is investigated in [5] and an overview of the RES auctions in Colombia is presented in [6]. The auction design and outcomes in the UK are discussed for offshore wind in [7] and for PV and onshore wind in [8]. The results for India of PV and onshore wind auctions are evaluated in [9] and for PV in [10]. The auction programs and outcomes in Germany are analysed for PV in [11], for onshore wind in [12,13] and for offshore wind in [14,15]. A technological comparison of different energy sources is made for the centralised expansion auctions in Brazil [16].
As regards analyses of several groups of countries, auctions are identified as the second most employed mechanism for the promotion of RES in Latin America, and relevant data is presented for 13 Latin American countries in [17]. The design of the auction frameworks in Germany, France and Italy is reviewed in [18] in order to determine how policy-induced uncertainty affects the cost of capital. Additionally, the risk arising from the different site selection methods in the PV auctions in Zambia and South Africa is analysed in [19].

1.3. Contribution

As shown above, the number of studies analysing the design and results of the last auctions held from 2017 onwards is still limited, even more taking into account the number of participant countries and the auctioned volumes. In addition, the existing literature frequently continues with the common practice of employing the levelised cost of energy (LCOE) for evaluating the revenue requirements of the bidding projects. Although providing some insight, the LCOE limitations are not usually acknowledged and this metric prevails to the detriment of other improved profitability indexes that take into account the stream of revenues of the projects. Furthermore, the possible underbidding behaviour of winning projects raising concerns on their effective deployment is sometimes speculated, but not quantitatively assessed by a thorough analysis.
This paper is aimed at filling this gap. It analyses the recent tendency of low record bid prices exhibited in the last years by the most mature RES technologies, providing a three-fold contribution.
First, it updates the body of literature by covering the most recent period starting at 2017, doing it from a more global perspective in considering several countries and technologies and inquiring into the causes of the near subsidy-free auction results.
Second, a critical assessment of the usual practice of taking the LCOE as a yardstick against which to judge the bid prices is substantiated, identifying the shortcomings of this metric.
Third, the project and equity net present value (NPV) and internal rate of return (IRR) improved metrics are determined for representative cases and a sensitivity analysis of the impact of relevant input parameters is performed, in order to gain insights on the viability of the projects and evaluating possible underbidding behaviours.
The paper is structured as follows. In Section 2, a multi-technology survey of representative auction data relying on different remuneration schemes is gathered. Likewise, the specific methodology followed for evaluating the LCOE is identified and the needed input parameters are collected. In addition, the economic and financial data corresponding to the benchmark base case for profitability appraisal is set. Section 3 presents the results of the comparison between the bid prices of the considered auctions and their corresponding LCOE. Additionally, the opposed bid behaviour between more mature RES technologies and others with less deployment that is made apparent in the former comparison is further assessed by calculating the NPV and IRR of selected cases. A sensitivity analysis of NPV and IRR profitability indicators is then performed so as to ascertain under which scenarios the assessed cases could prove viable. All the results presented in Section 3 are duly discussed in Section 4. Finally, in Section 5 conclusions are raised and additional information is supplemented in Appendix A.

2. Materials and Methods

A survey of data relative to 10 different countries that held auctions in the 2017–2019 period analysed has been compiled and presented in Table 1 [20,21,22,23,24,25,26,27,28,29].
The collected data belong to auctions with different remuneration types. On the one hand, there are examples of power purchase agreements (PPA), namely, Argentina [20], Chile [21] and Portugal [22]. For the cases of Argentina and Chile, both PPAs are denominated in United States dollars (USD) and have different periodical updates, while no adjustment for inflation is foreseen for the Portuguese support. Also, as an alternative to the guaranteed remuneration in the Portuguese auction, it was possible to opt for receiving a market price, but at the cost of bidding for a fixed contribution to the National Electrical System [22],
There is a case of fixed feed-in premium (FIP) corresponding to Denmark [23], to be received on top of the electricity market price.
The auctioned support is of sliding FIP type for Germany [24] and the Netherlands [25], whereby the positive difference between the bid strike price and a market-based reference price is obtained. In the end, the perceived remuneration is the highest of either the strike price or the market-based reference price. As a specialty, there is a floor to the sliding FIP in the Dutch case.
The auctioned support for Canada [26], Greece [27], Poland [28] and the United Kingdom (UK) [29] takes the form of two-sided contracts for differences (CfD) (also known as two-sided sliding FIPs). The difference with respect to the mechanism described for the sliding FIP is that market revenues exceeding the bid strike price must be returned to the government-owned auctioneer. The CfDs have been praised for shielding producers from wholesale electricity price volatility, in complementing the market revenue up to the strike price. At the same time, CfDs also avoid augmented costs to consumers when the electricity prices are high.
The date of the auction, the duration of the support, and the involved RES technologies are also depicted in Table 1. Moreover, the mean awarded bid prices expressed in USD/kWh are included, using for the conversion the mean equivalence of each currency with USD in the year of the auction.
Following a common practice, the mean awarded bid prices of the auctioned RES technologies in Table 1 have been here compared to their corresponding LCOEs. The necessary input data for the LCOE calculation has been collected in Table 2. All the data has been obtained from [30], except the fixed and variable operation and maintenance (O&M) costs, which have been collected from [31].
Based on the LCOE formula deduction process, it can be regarded as the constant remuneration per unit of energy that breaks-even the NPV of a project. LCOE is frequently employed by both investors and policymakers as a proxy of the economic feasibility of the RES projects and for evaluating revenue requirements [3,32]. Several references of its use in connection with auctions can be found in the literature. In this sense, the LCOE is cited as a way of determining the projects with lower generation costs that should be awarded support in well-designed auctions [33]. It is also mentioned as a tool for setting auction ceiling prices [34]. In the agent-based modelling of the Danish auction scheme in [5], the fixed FIP for break-even is calculated as the difference between the expected market price and the bidder LCOE.
At the other end, there is a current set of literature identifying the LCOE shortcomings. Among others, it can be cited its different definitions [35] and the usual lack of transparency in the needed assumptions heavily impacting the LCOE outcomes [36]. Consequently, the use of more sophisticated metrics is advocated [36,37]. Mid way between these points, a comparison of auction prices with LCOEs can be found in [30], although a warning is issued on the implicit limitations.
The employed definition for the calculation of the LCOE following the methodology of [30] is provided in Appendix A, along with other assumptions.
The limited ability of the LCOE for assessing the viability of winning bids requires the use of discounted cash-flow metrics such as NPV and IRR for reliable project appraisal. For adding further value to the performed LCOE-based preliminary assessment, the project NPV and IRR, and the equity NPV and IRR of representative auctions with opposite valuation results are determined. Additionally, a sensitivity study is conducted on the impact of relevant parameters on the NPV and IRR indexes of the auctions obtaining negative profitability outcomes for its base case. The adopted base case assumptions are listed in Table 3.

3. Results

In this section the comparison between the LCOE of each of the auctioned RES technologies listed in Table 1 and an approximation to the mean remuneration that they could receive in the first year of operation is presented. Next, the project and equity NPV and IRR are presented for auctions of technologies with different maturities exhibiting completely opposed viability outcomes.
Finally, the unprofitable appraisal of some auctions under the base case assumptions is then further assessed by a sensitivity analysis, in order to explore the range of values of the input parameters that could make the investments profitable.

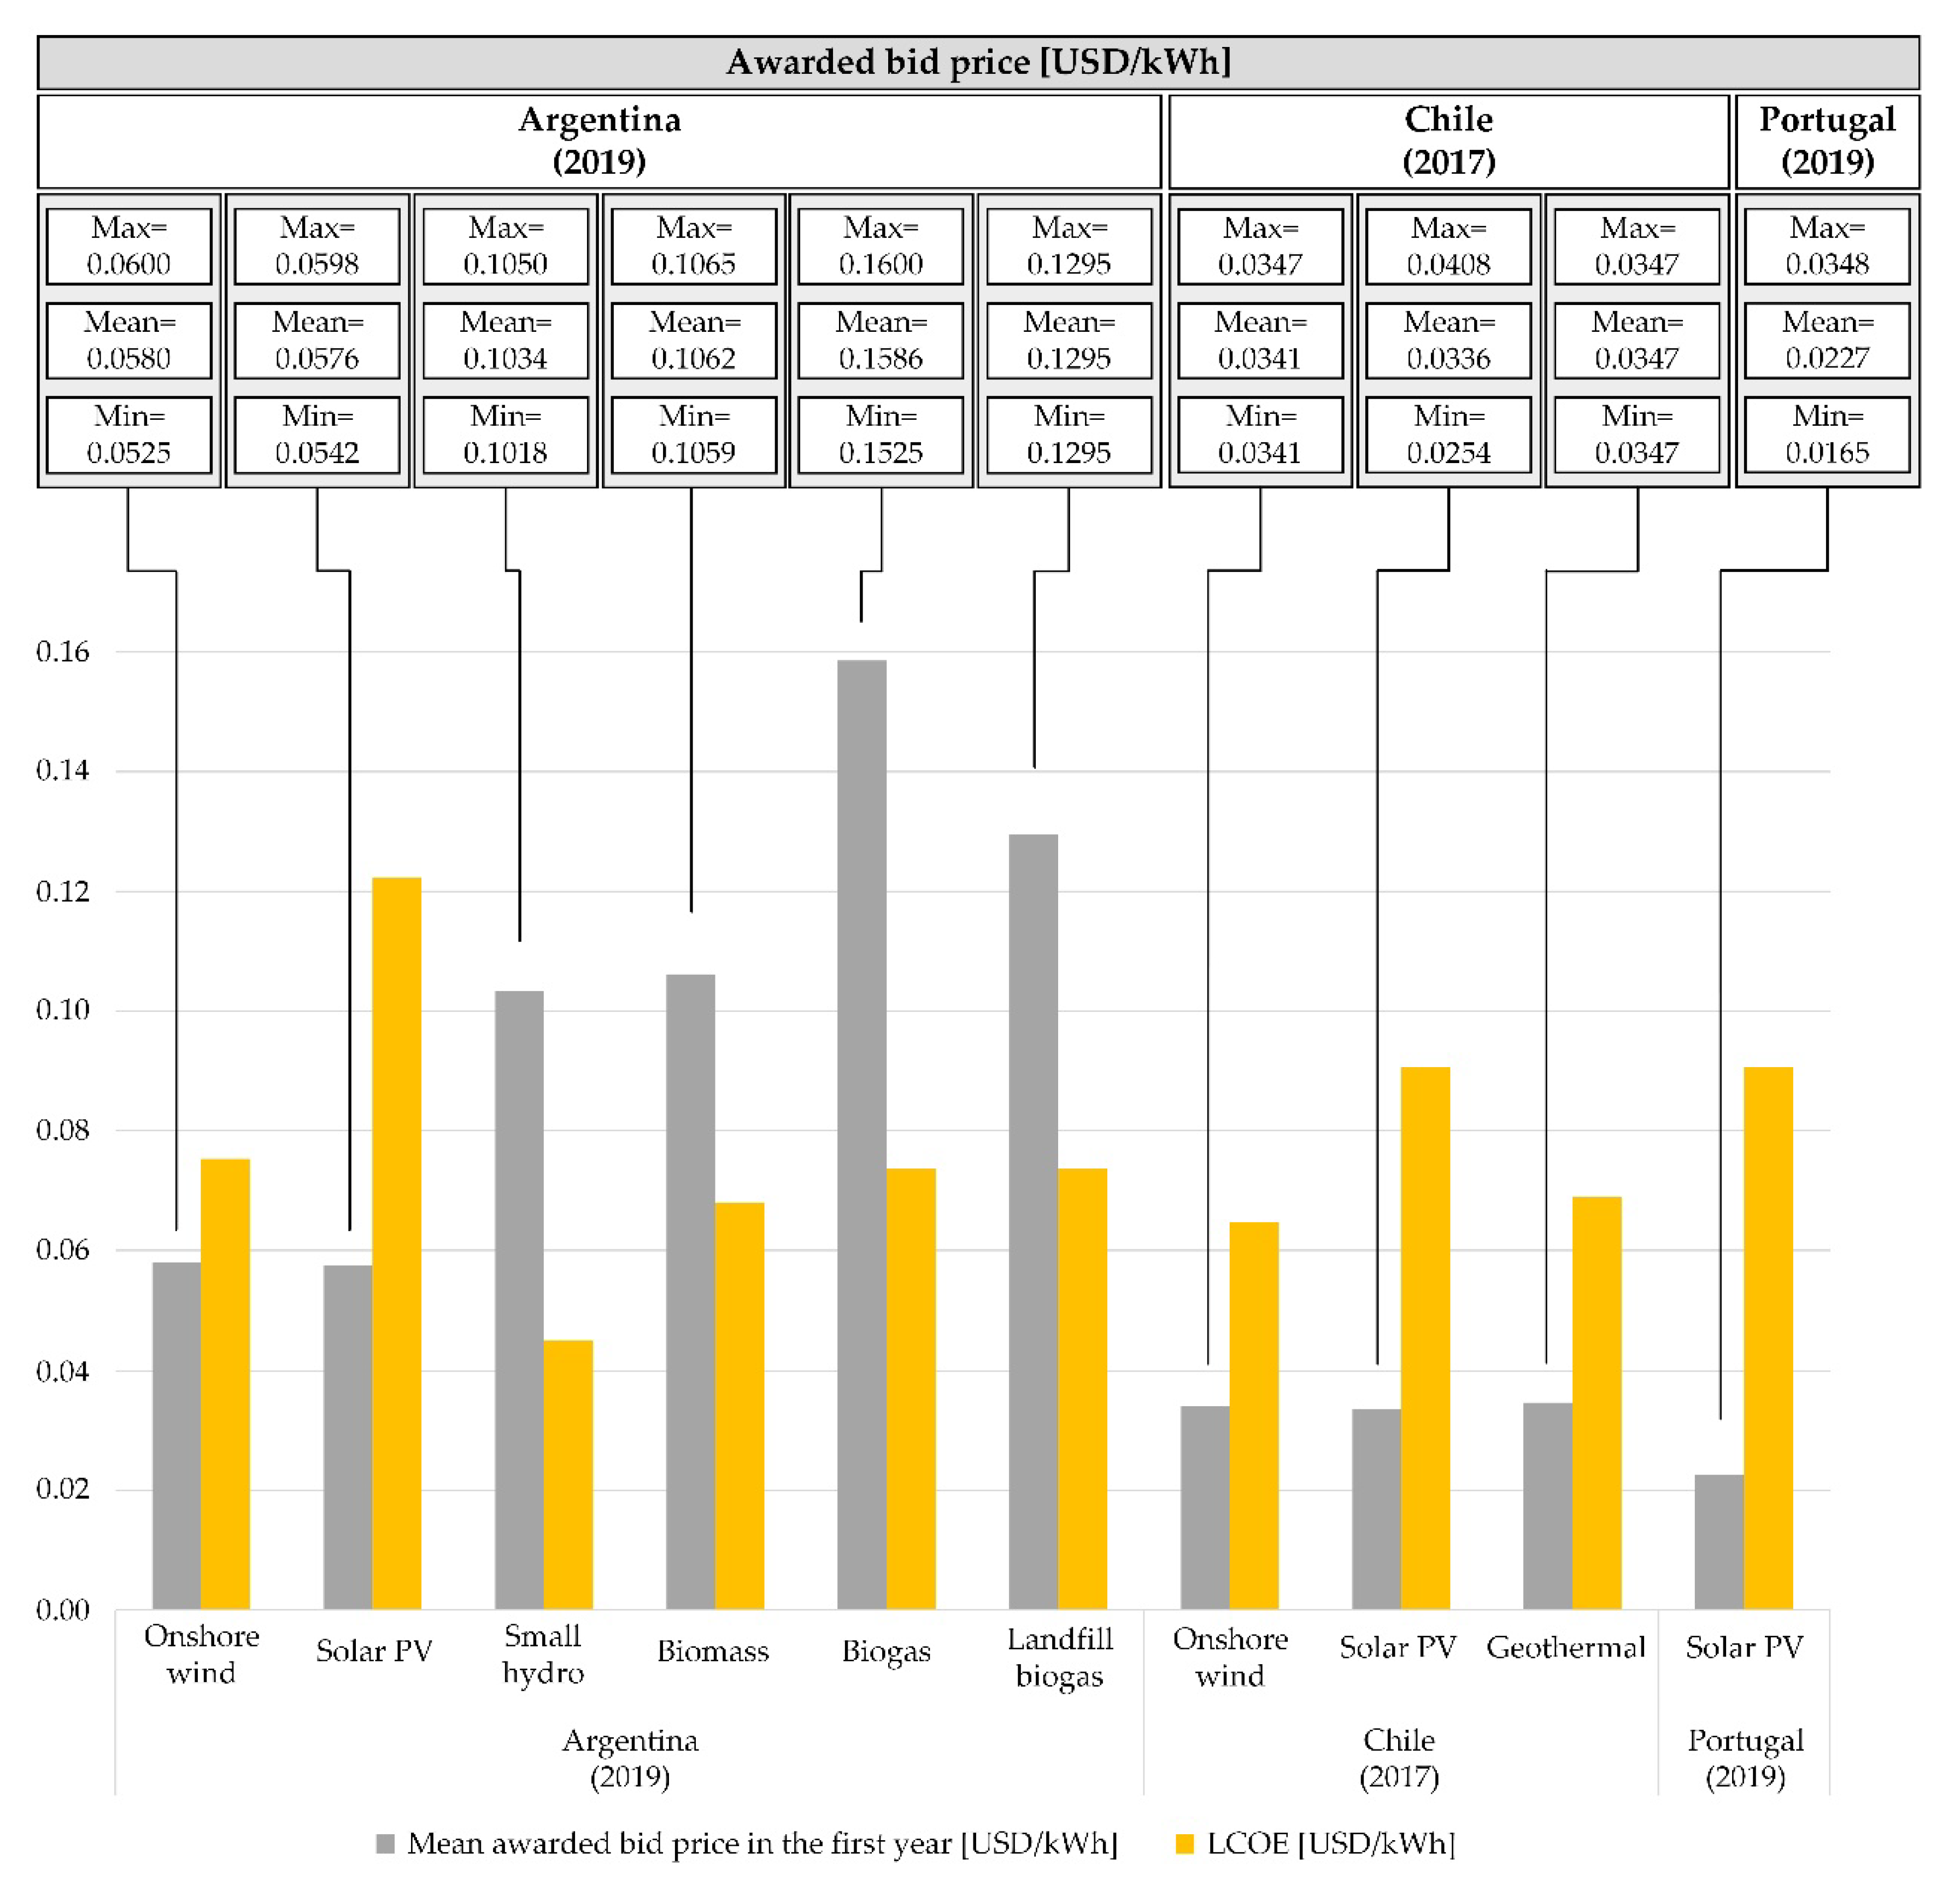
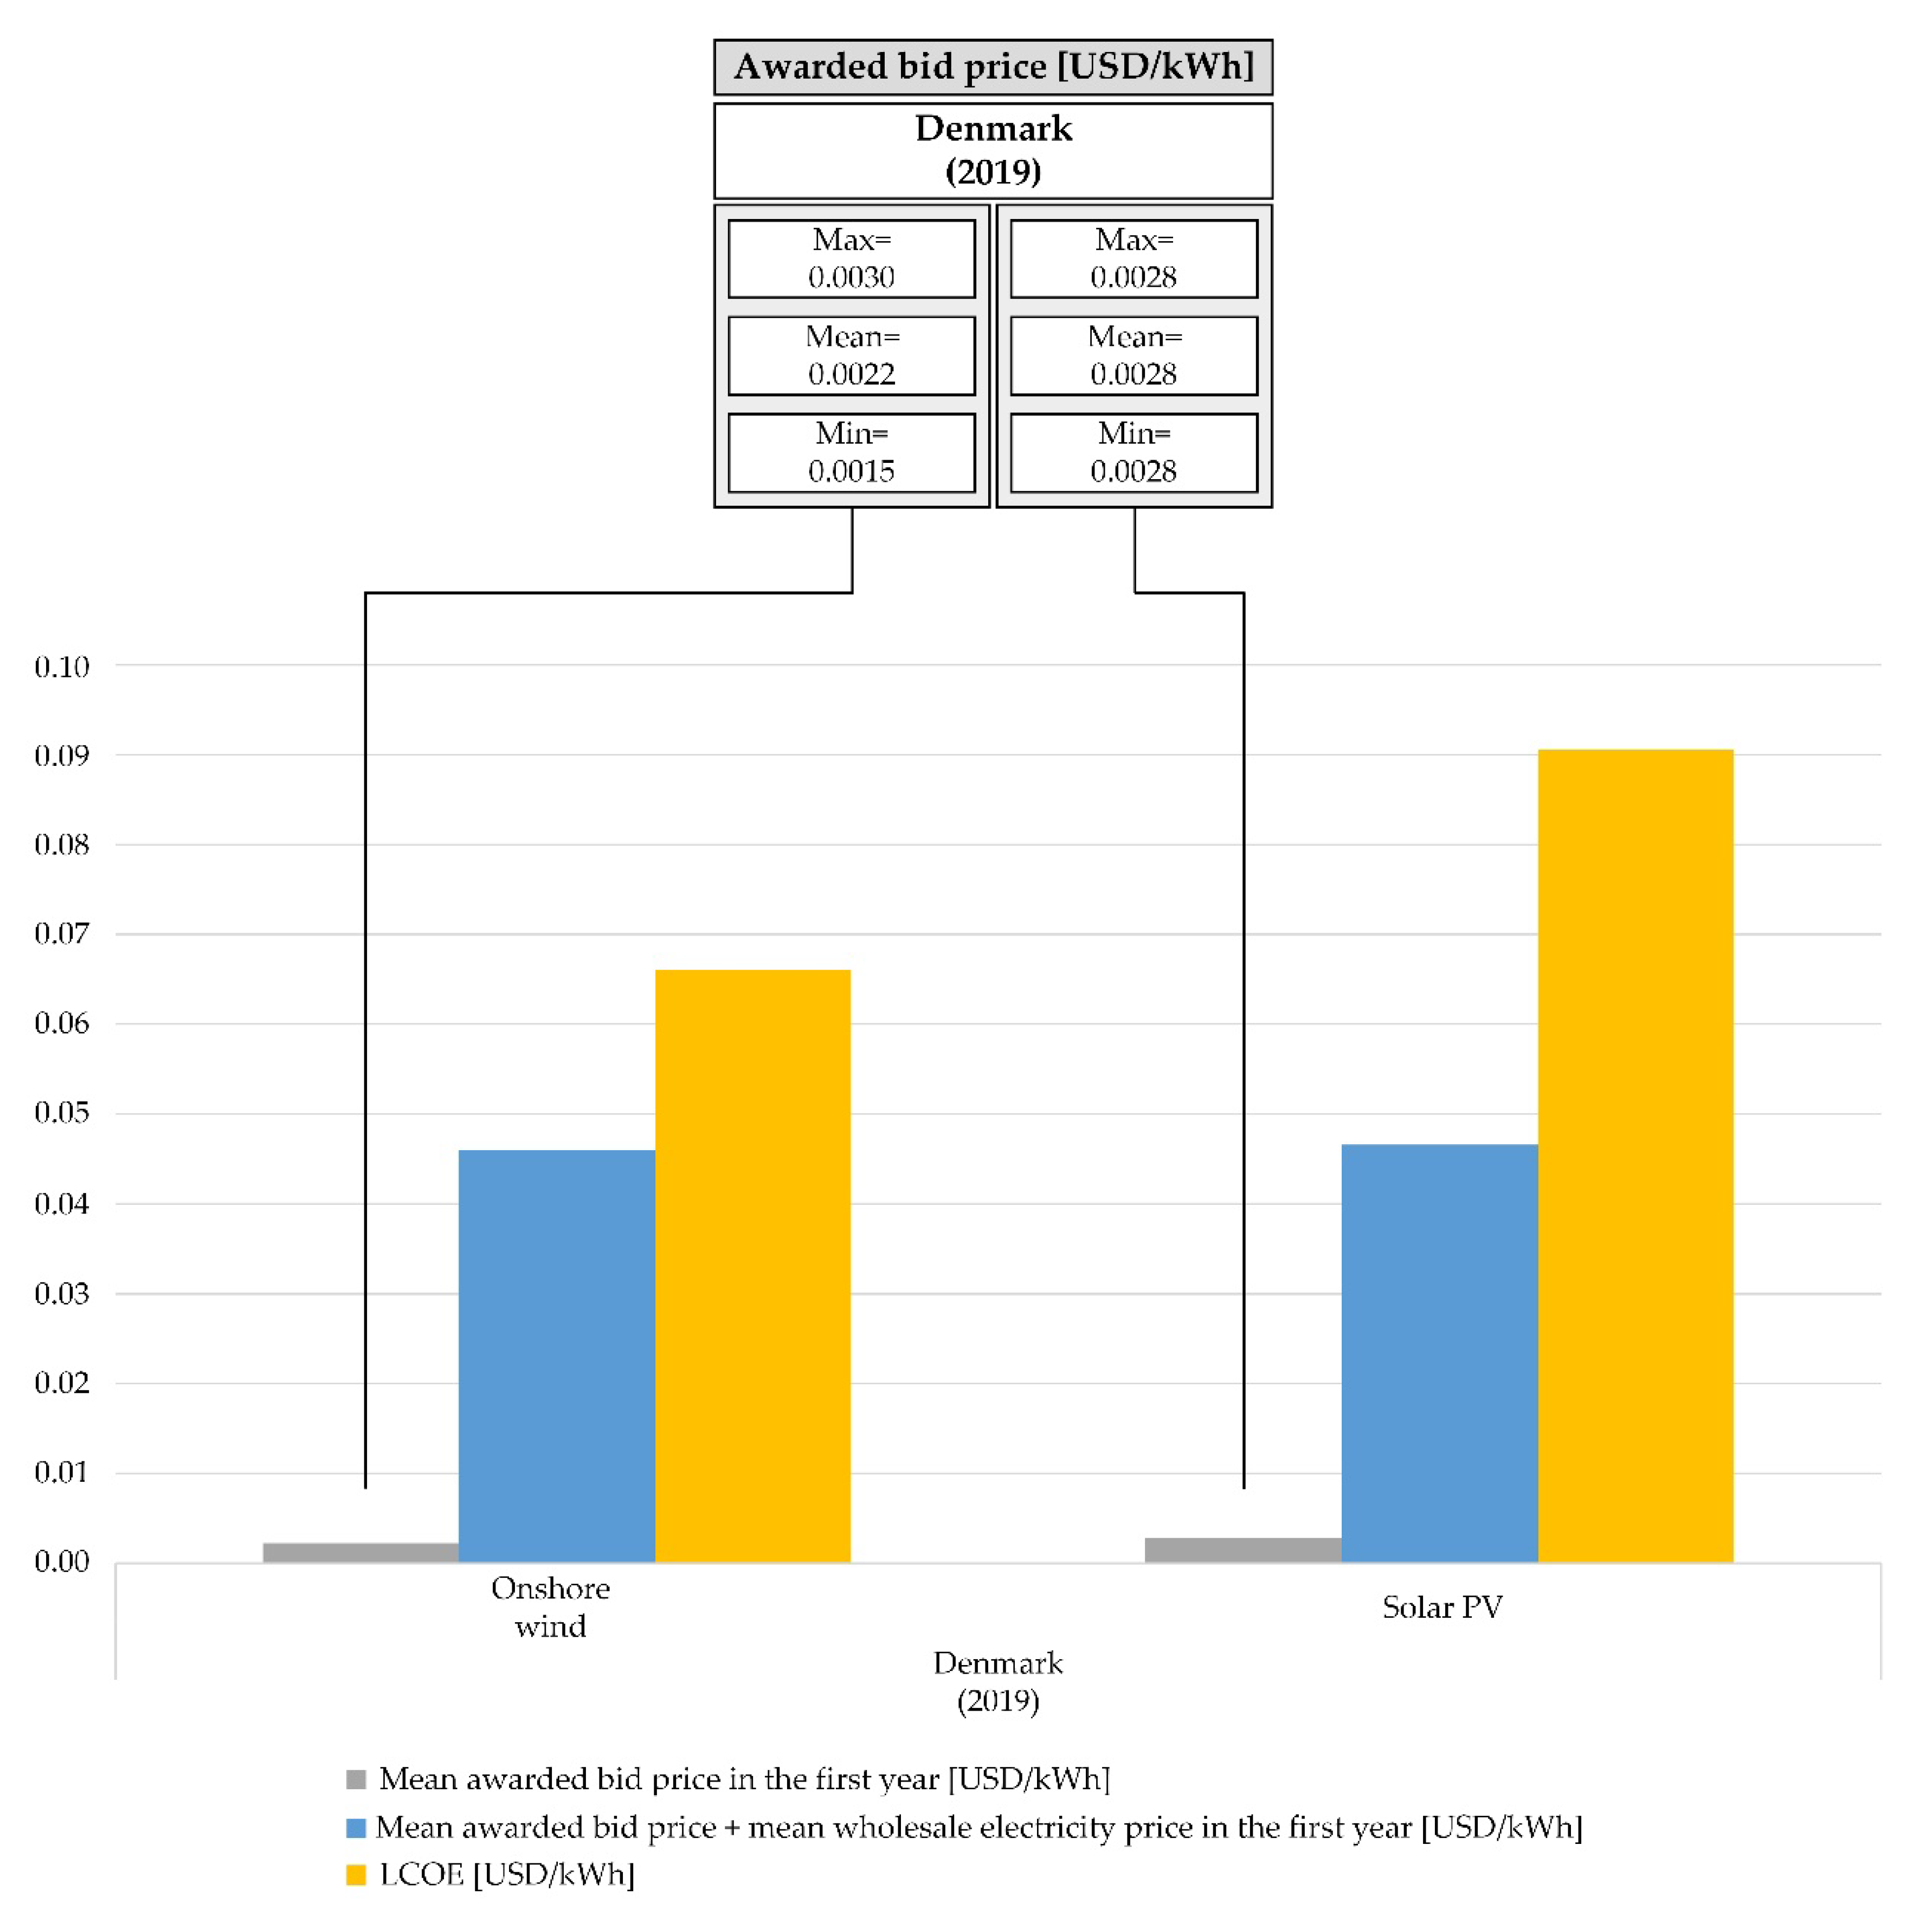
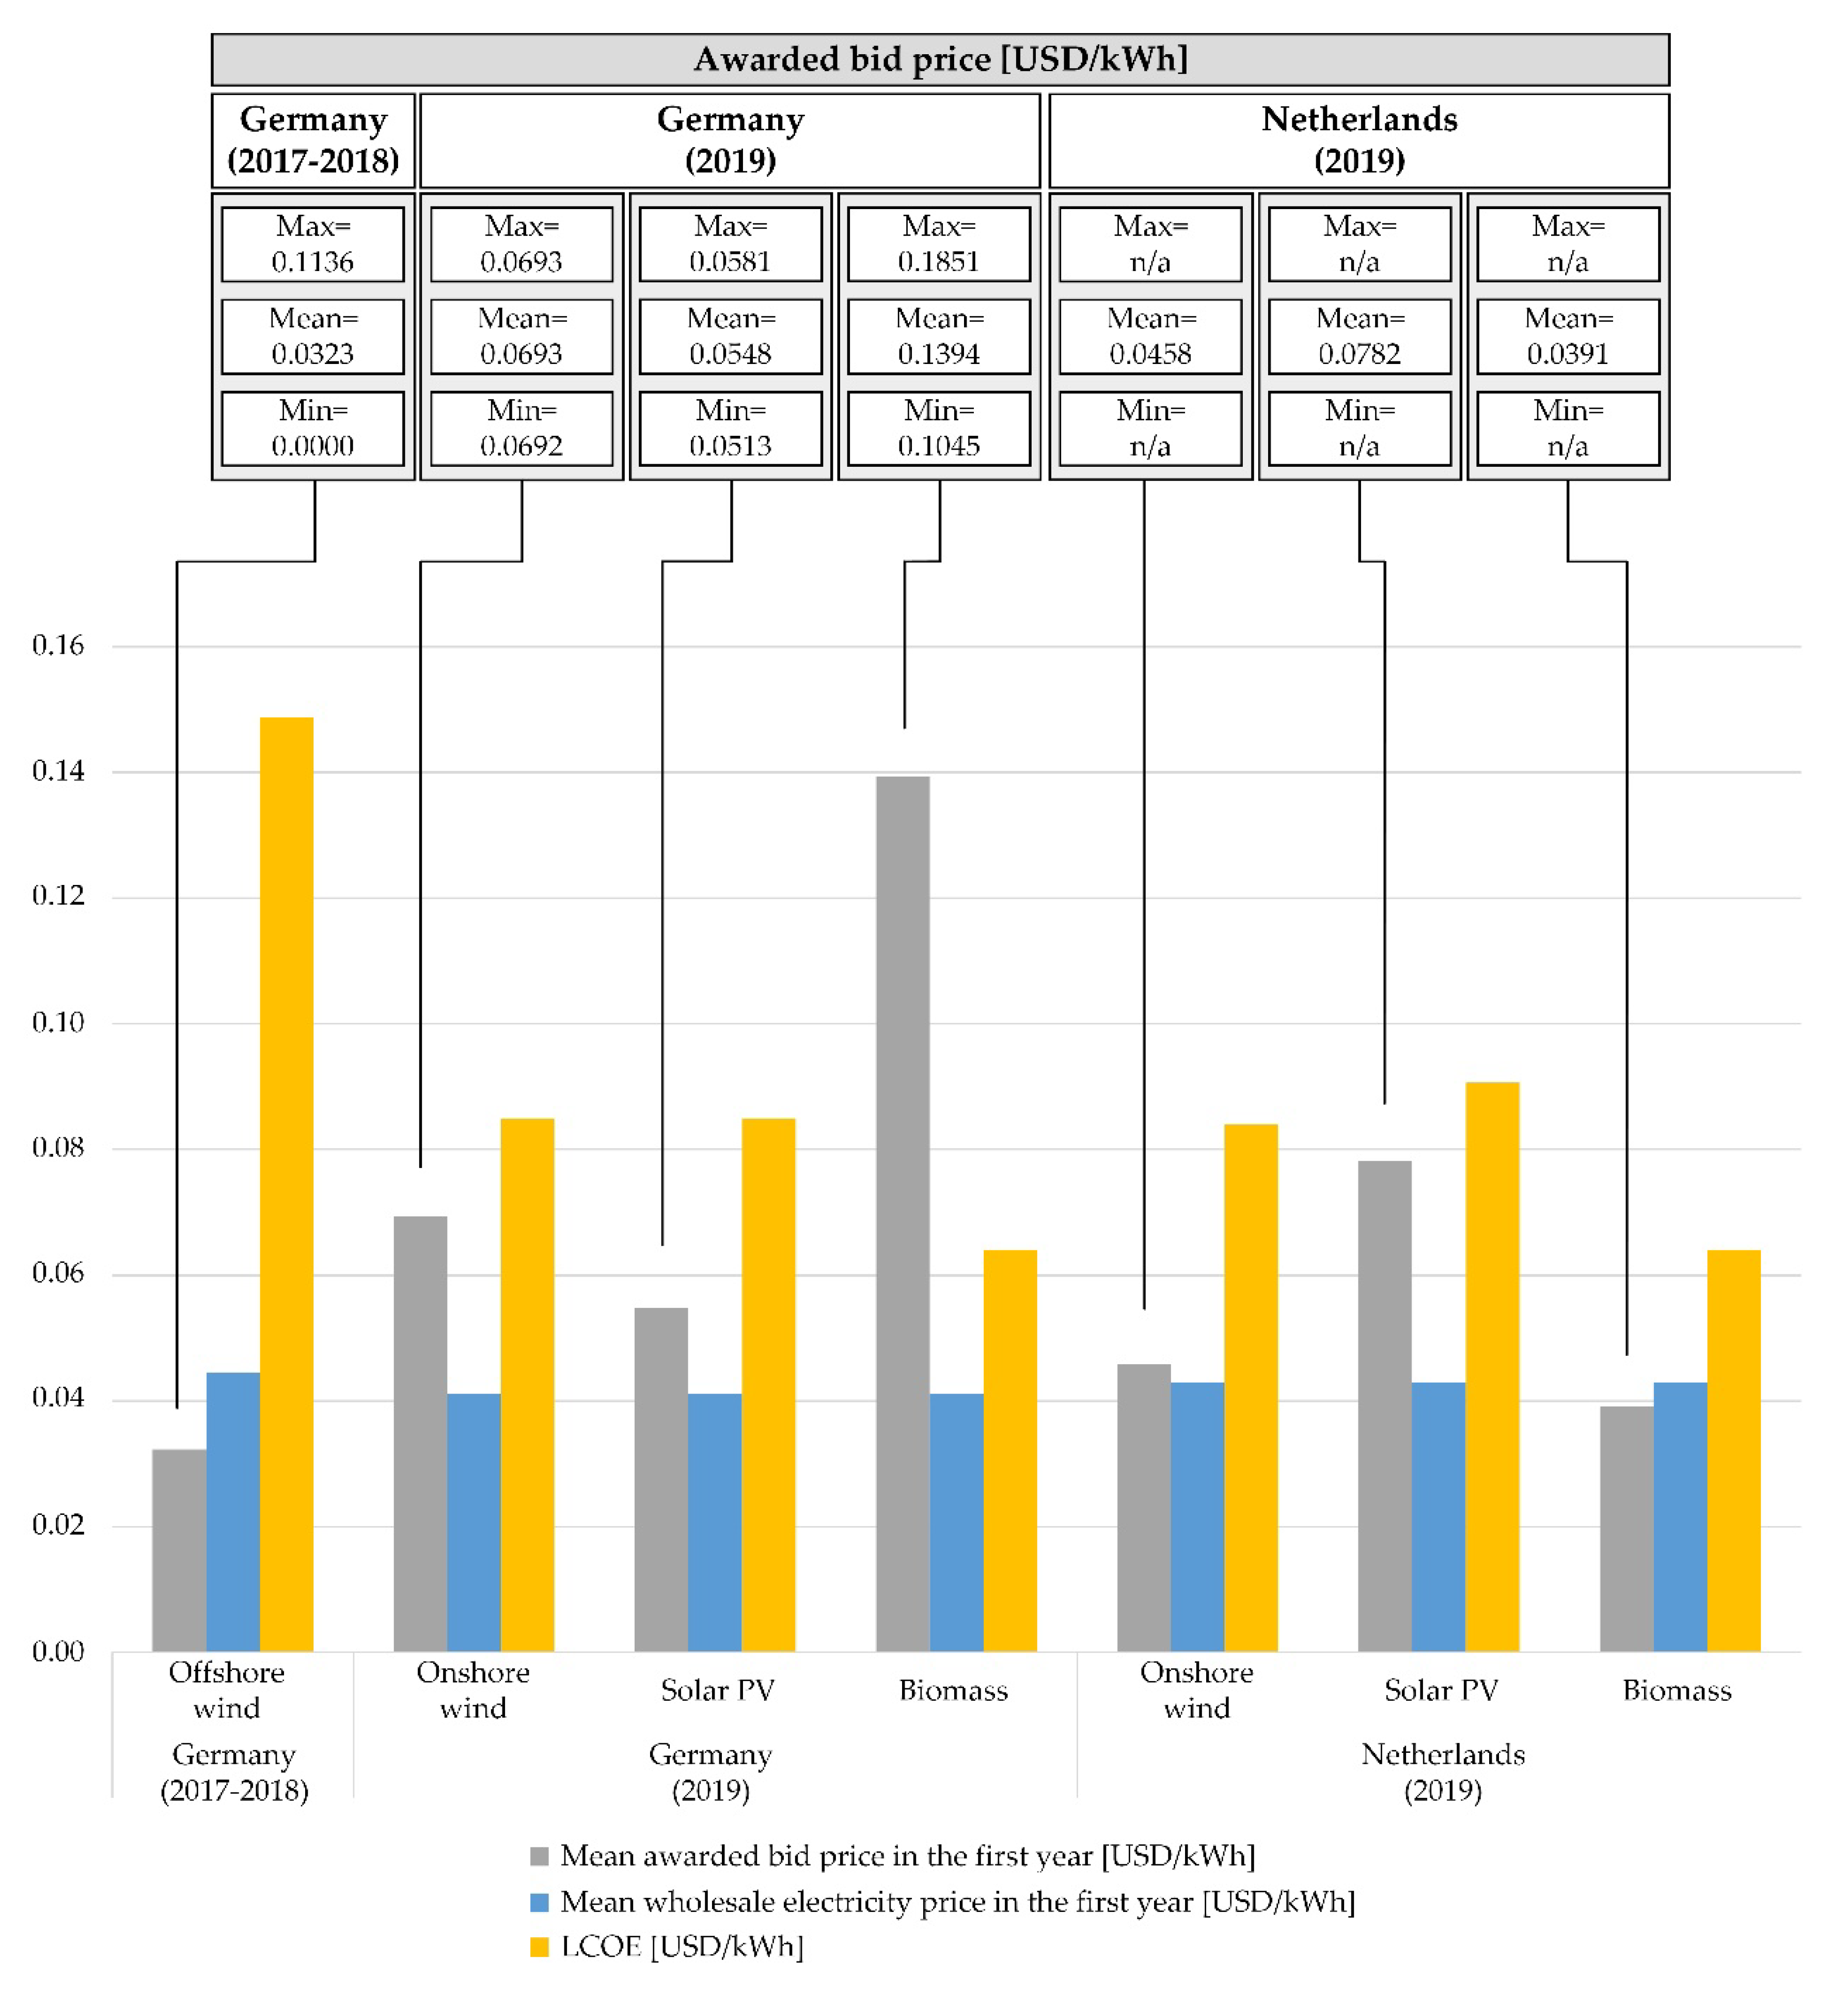
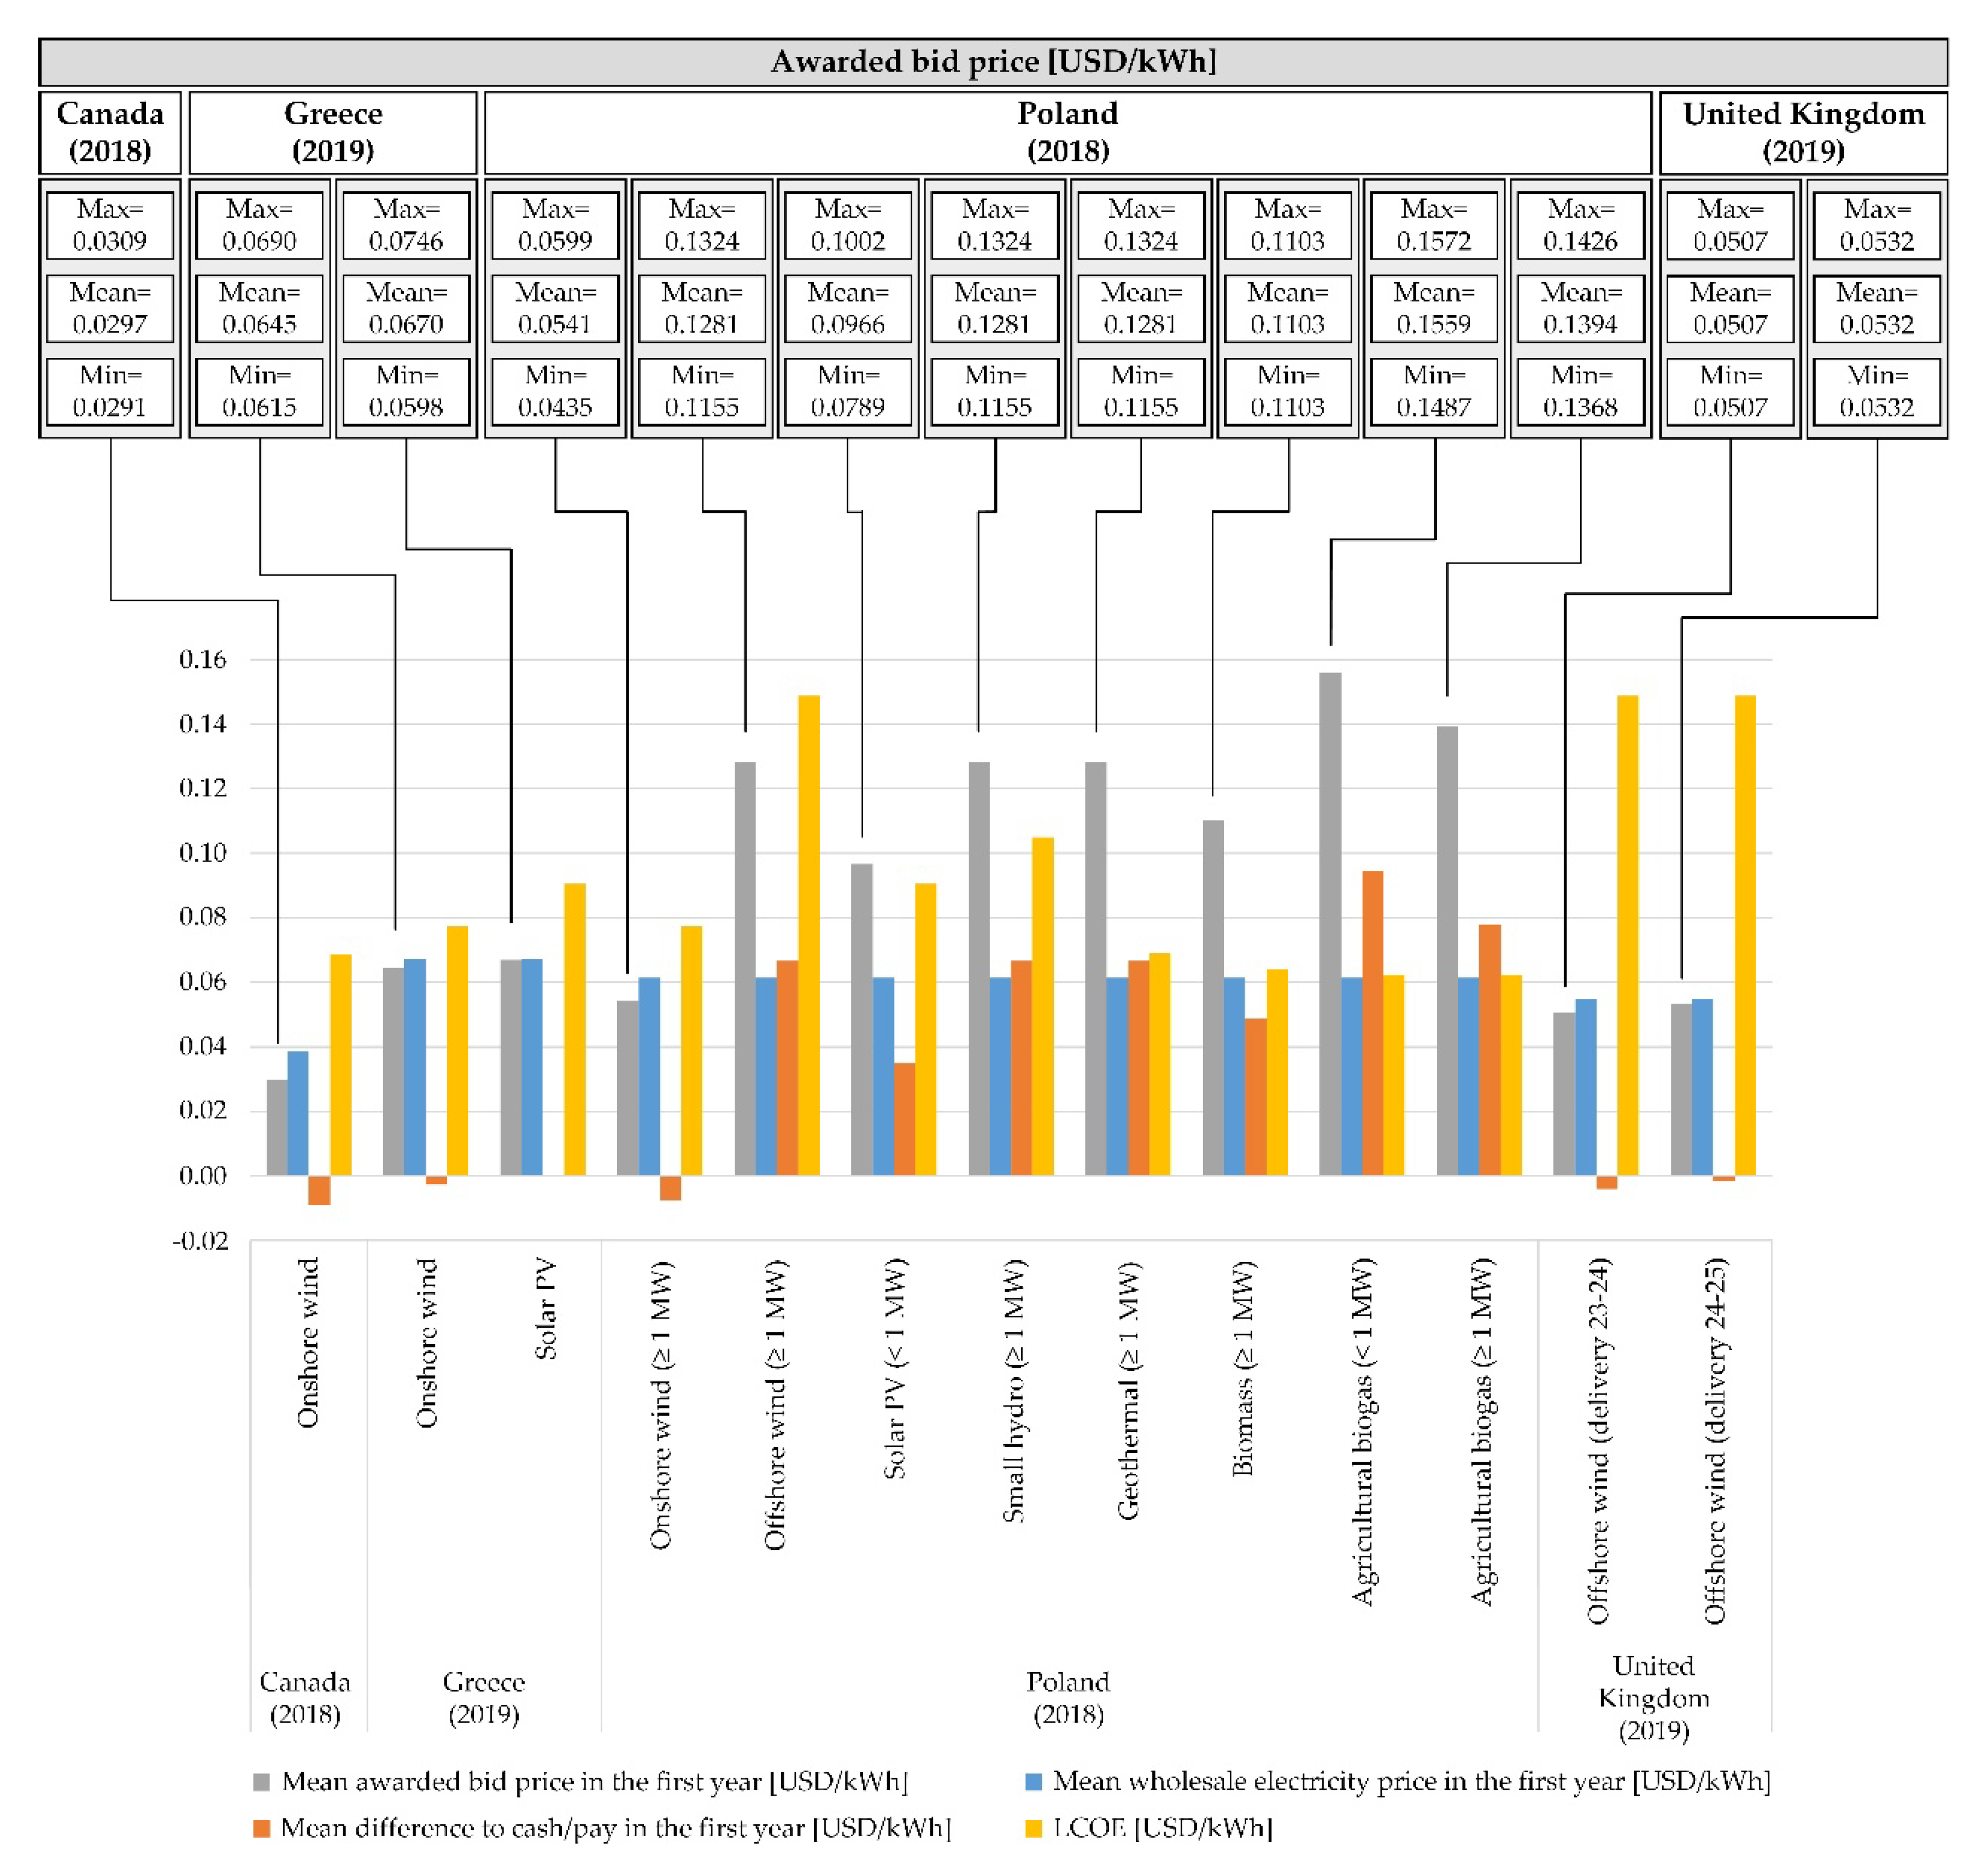
3.1. Auction Prices and LCOE Comparison Results

The comparison of the mean awarded PPA prices and the computed LCOEs for the countries under this remuneration scheme in Table 1 is portrayed in Figure 1, using bars in grey and yellow colour, respectively. Each of the bars representing the mean awarded prices is labelled at the top of the figure with the indication of the minimum, the mean and the maximum values of the winning bids. Figure 2, Figure 3 and Figure 4 also incorporate this information.
In Figure 2, the mean awarded bid prices for the fixed FIP Danish auctions listed in Table 1 are represented by grey bars. It is also displayed by blue bars the sum of the mean awarded bid prices and the mean wholesale electricity price, taken as a proxy of the mean remuneration to be received in the first year. Likewise, the corresponding LCOEs are depicted by yellow bars.
Figure 3 displays the mean awarded bid or strike price under the sliding FIP scheme (grey bars), along with the mean wholesale electricity price in the first year (blue bars) and the LCOEs (yellow bars), for the auctions from Germany and the Netherlands listed in Table 1. In line with what was commented on the “subsidy-free” winning projects at the introductory section, the minimum 0 €/MWh awarded bid price for the German 2017–2018 offshore wind auction stands out.
Additionally, Figure 4 shows the mean awarded bid or strike price under the CfD scheme (grey bars), jointly with the mean wholesale electricity price (blue bars), the resulting mean difference to receive from or pay to the auctioneer (orange bars), and the LCOE (yellow bars), in the first year for the auctions from Canada, Greece, Poland and UK listed in Table 1. As mentioned in Section 2, the generator cannot retain the surplus of the market remuneration over the strike price, which must be returned to the auctioneer. This event can be appreciated in some of the auction outcomes represented in Figure 4, in the form of orange negative bars.

3.2. NPV and IRR Results for Opposed Cases

The determination of the project and equity NPV and IRR for selected technologies that exhibited opposed results in the comparison made in Section 3.1 is now performed. Specifically, the cases of the German auction for biomass and the Danish auction for onshore wind and solar PV render the results collected in Table 4, under the assumptions in Table 3.

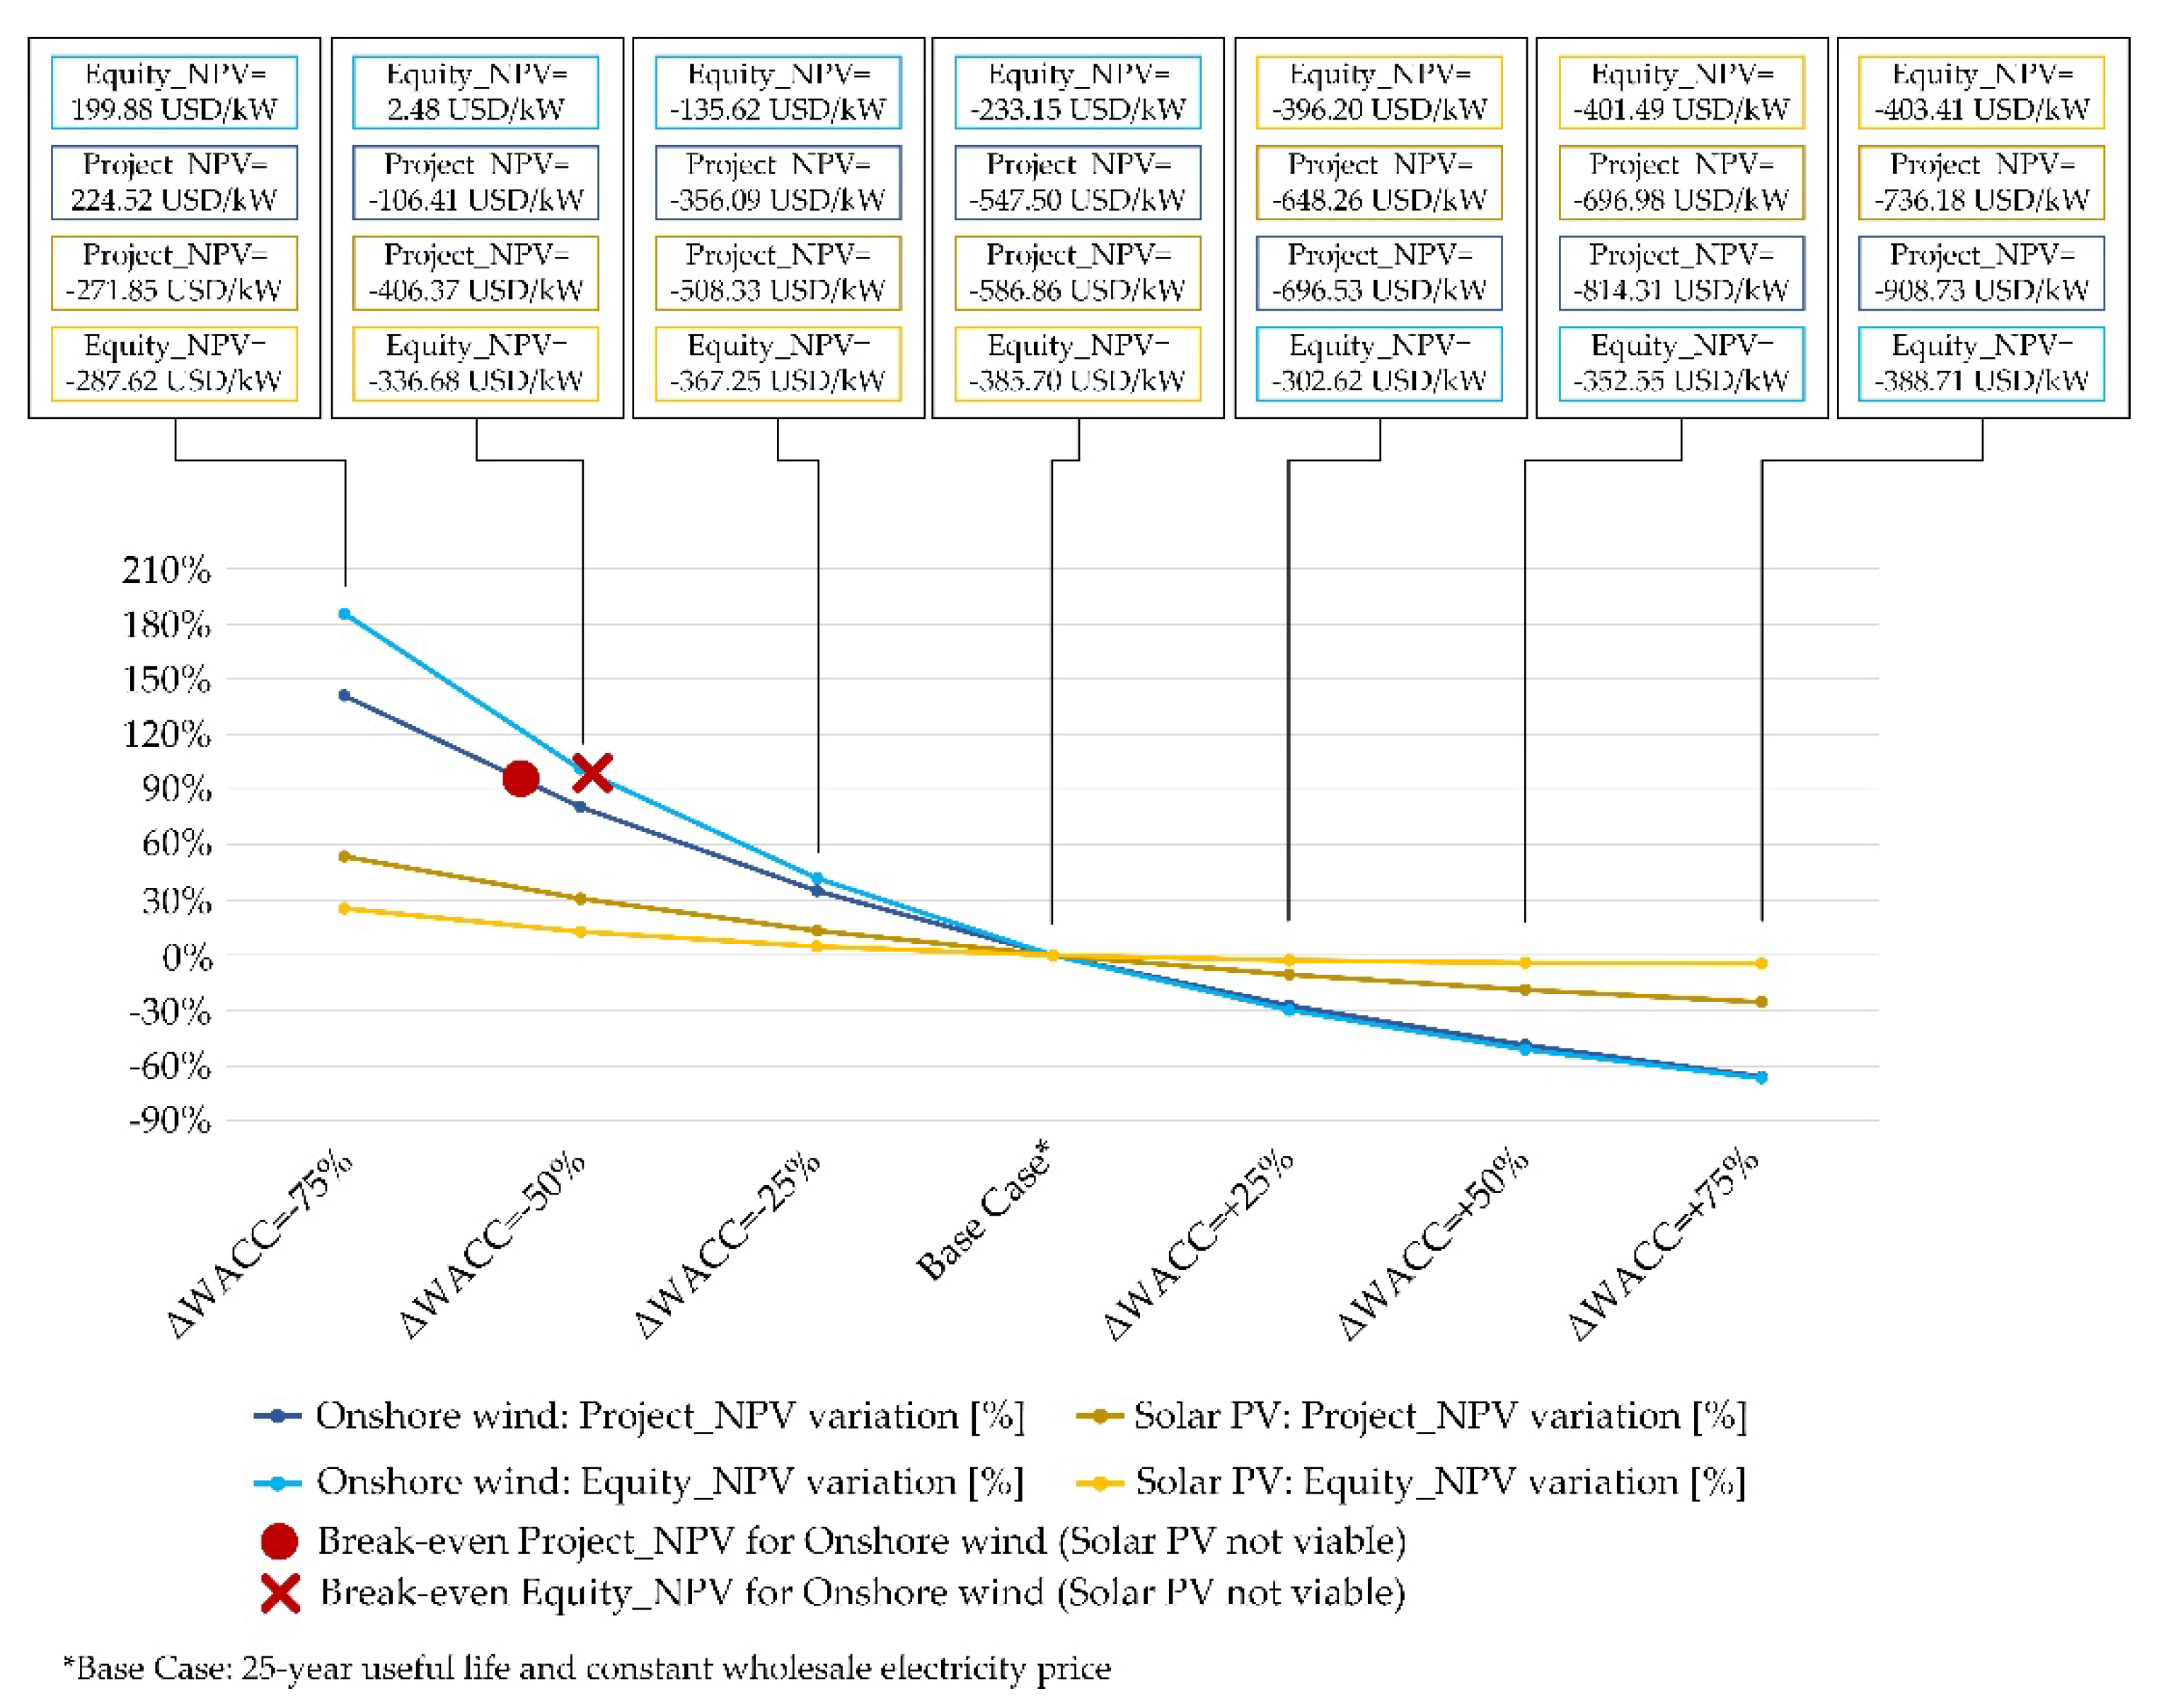
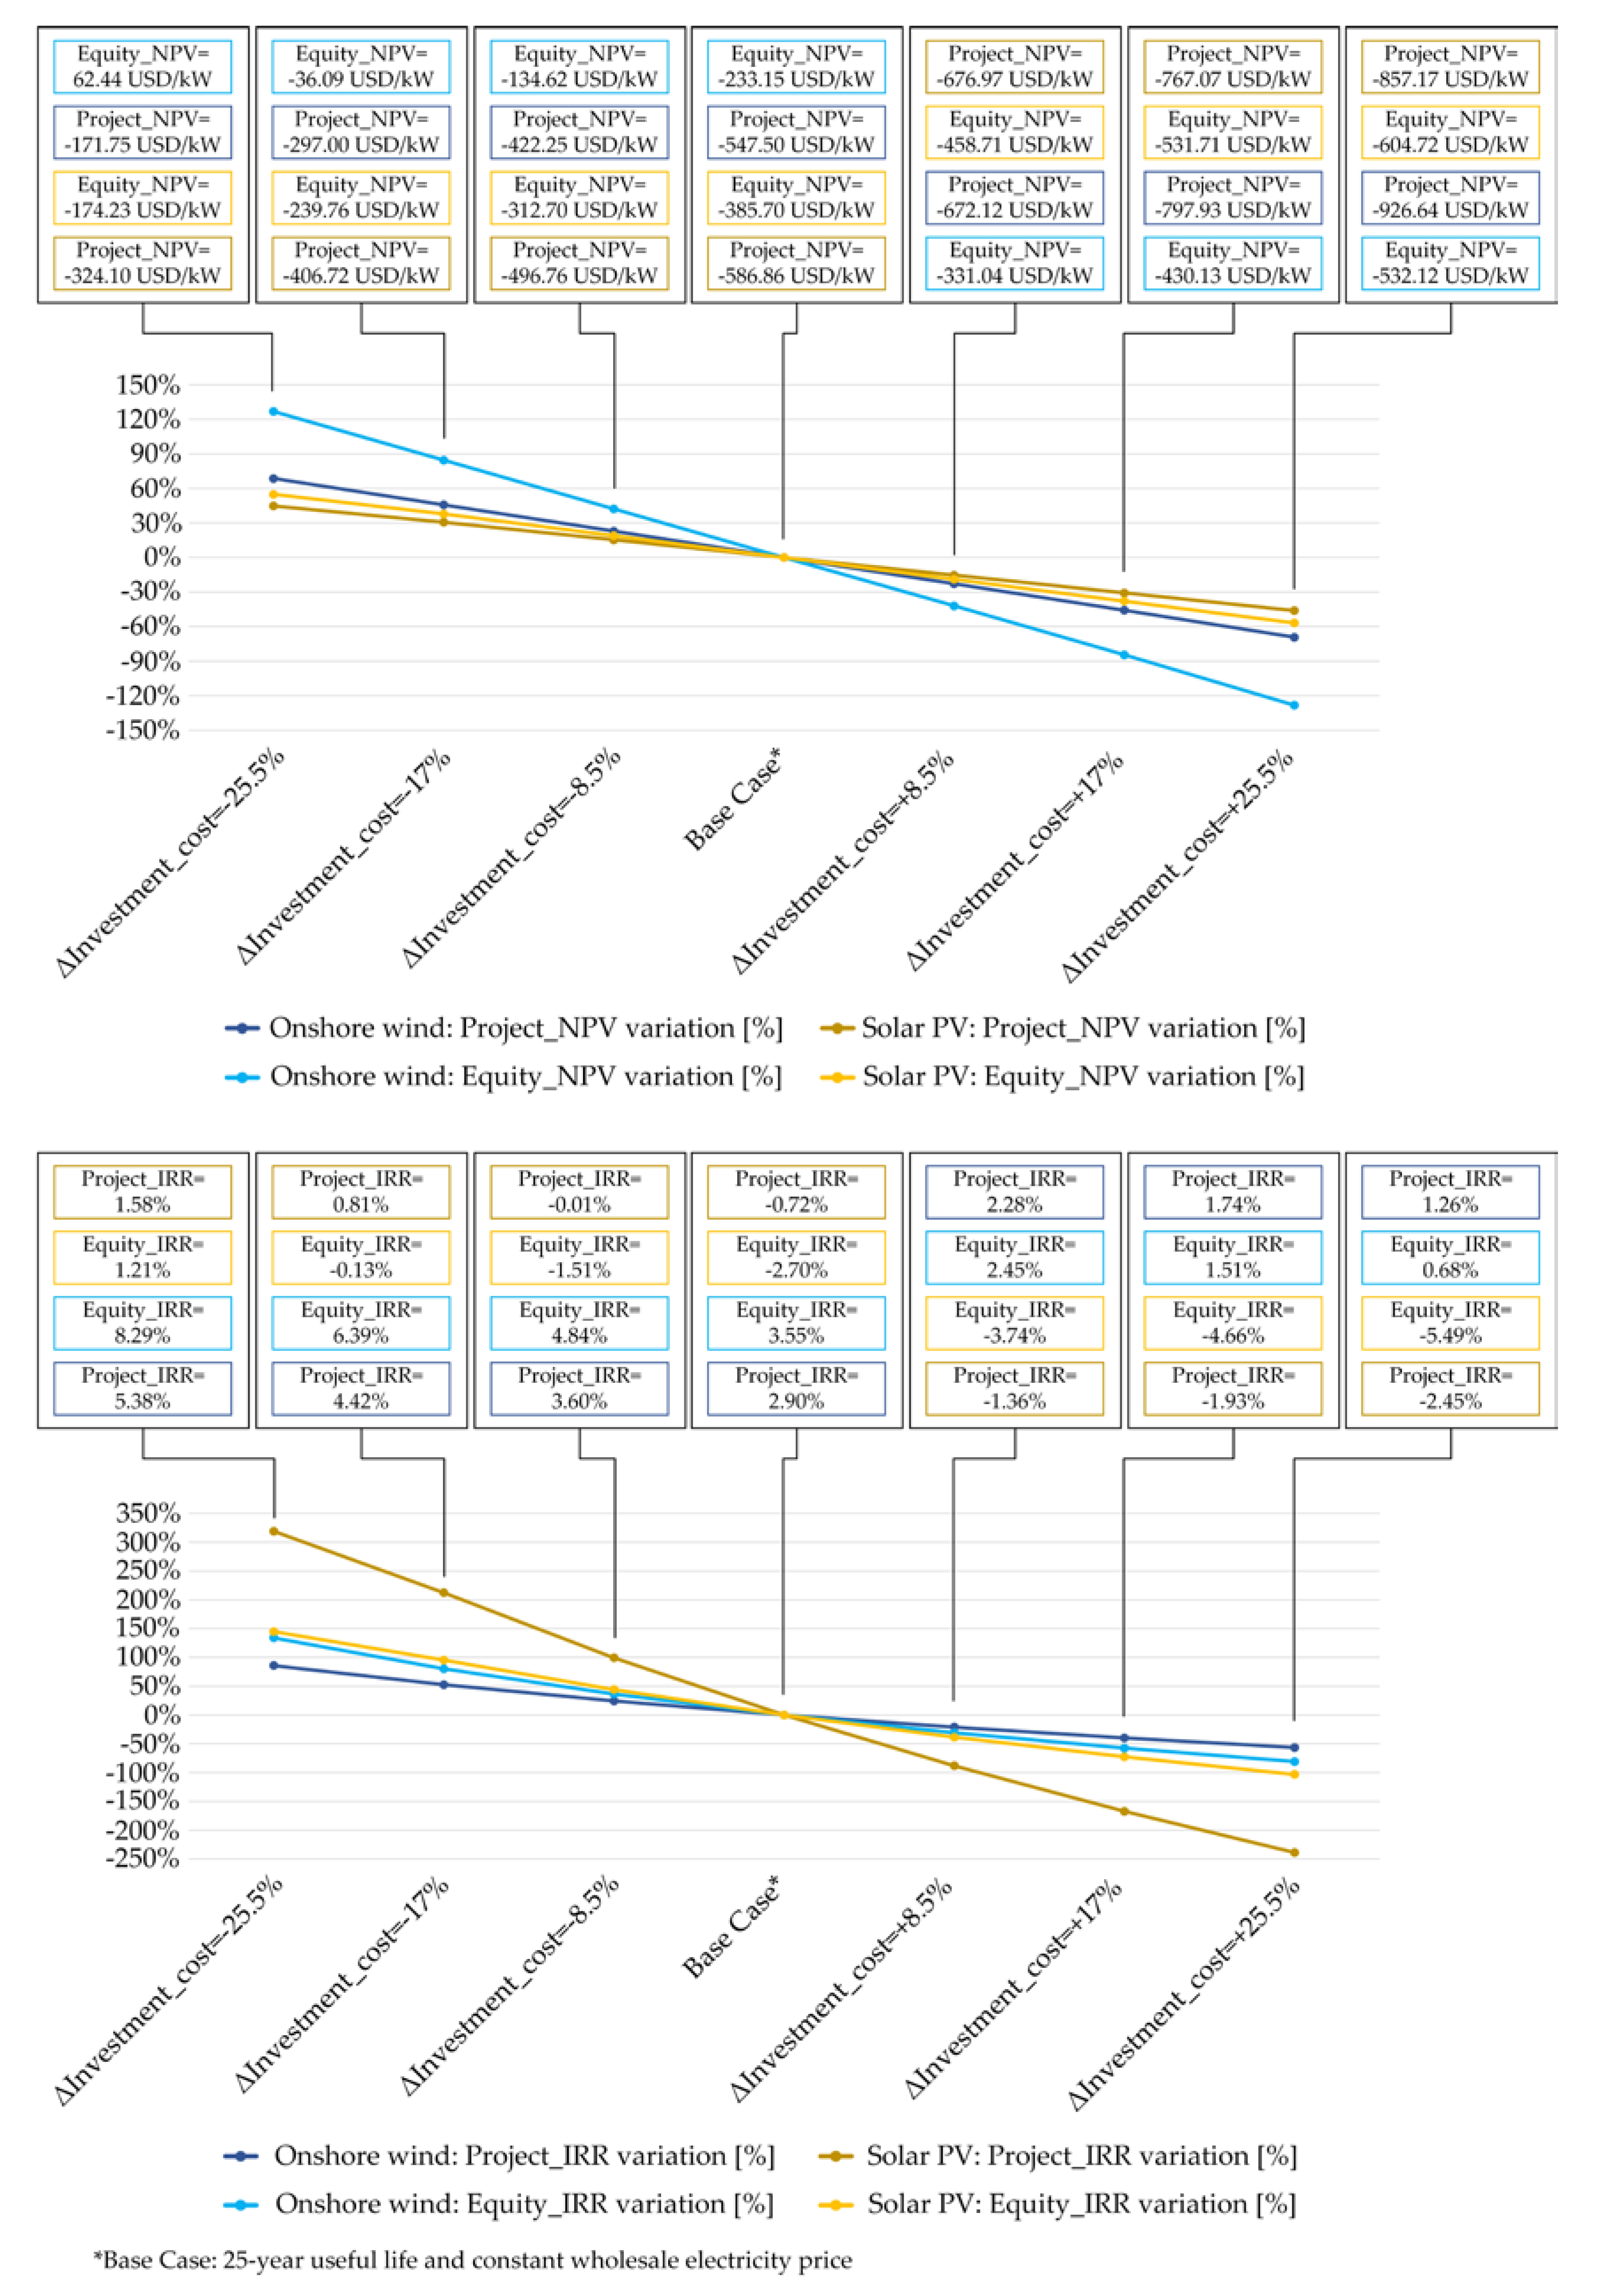
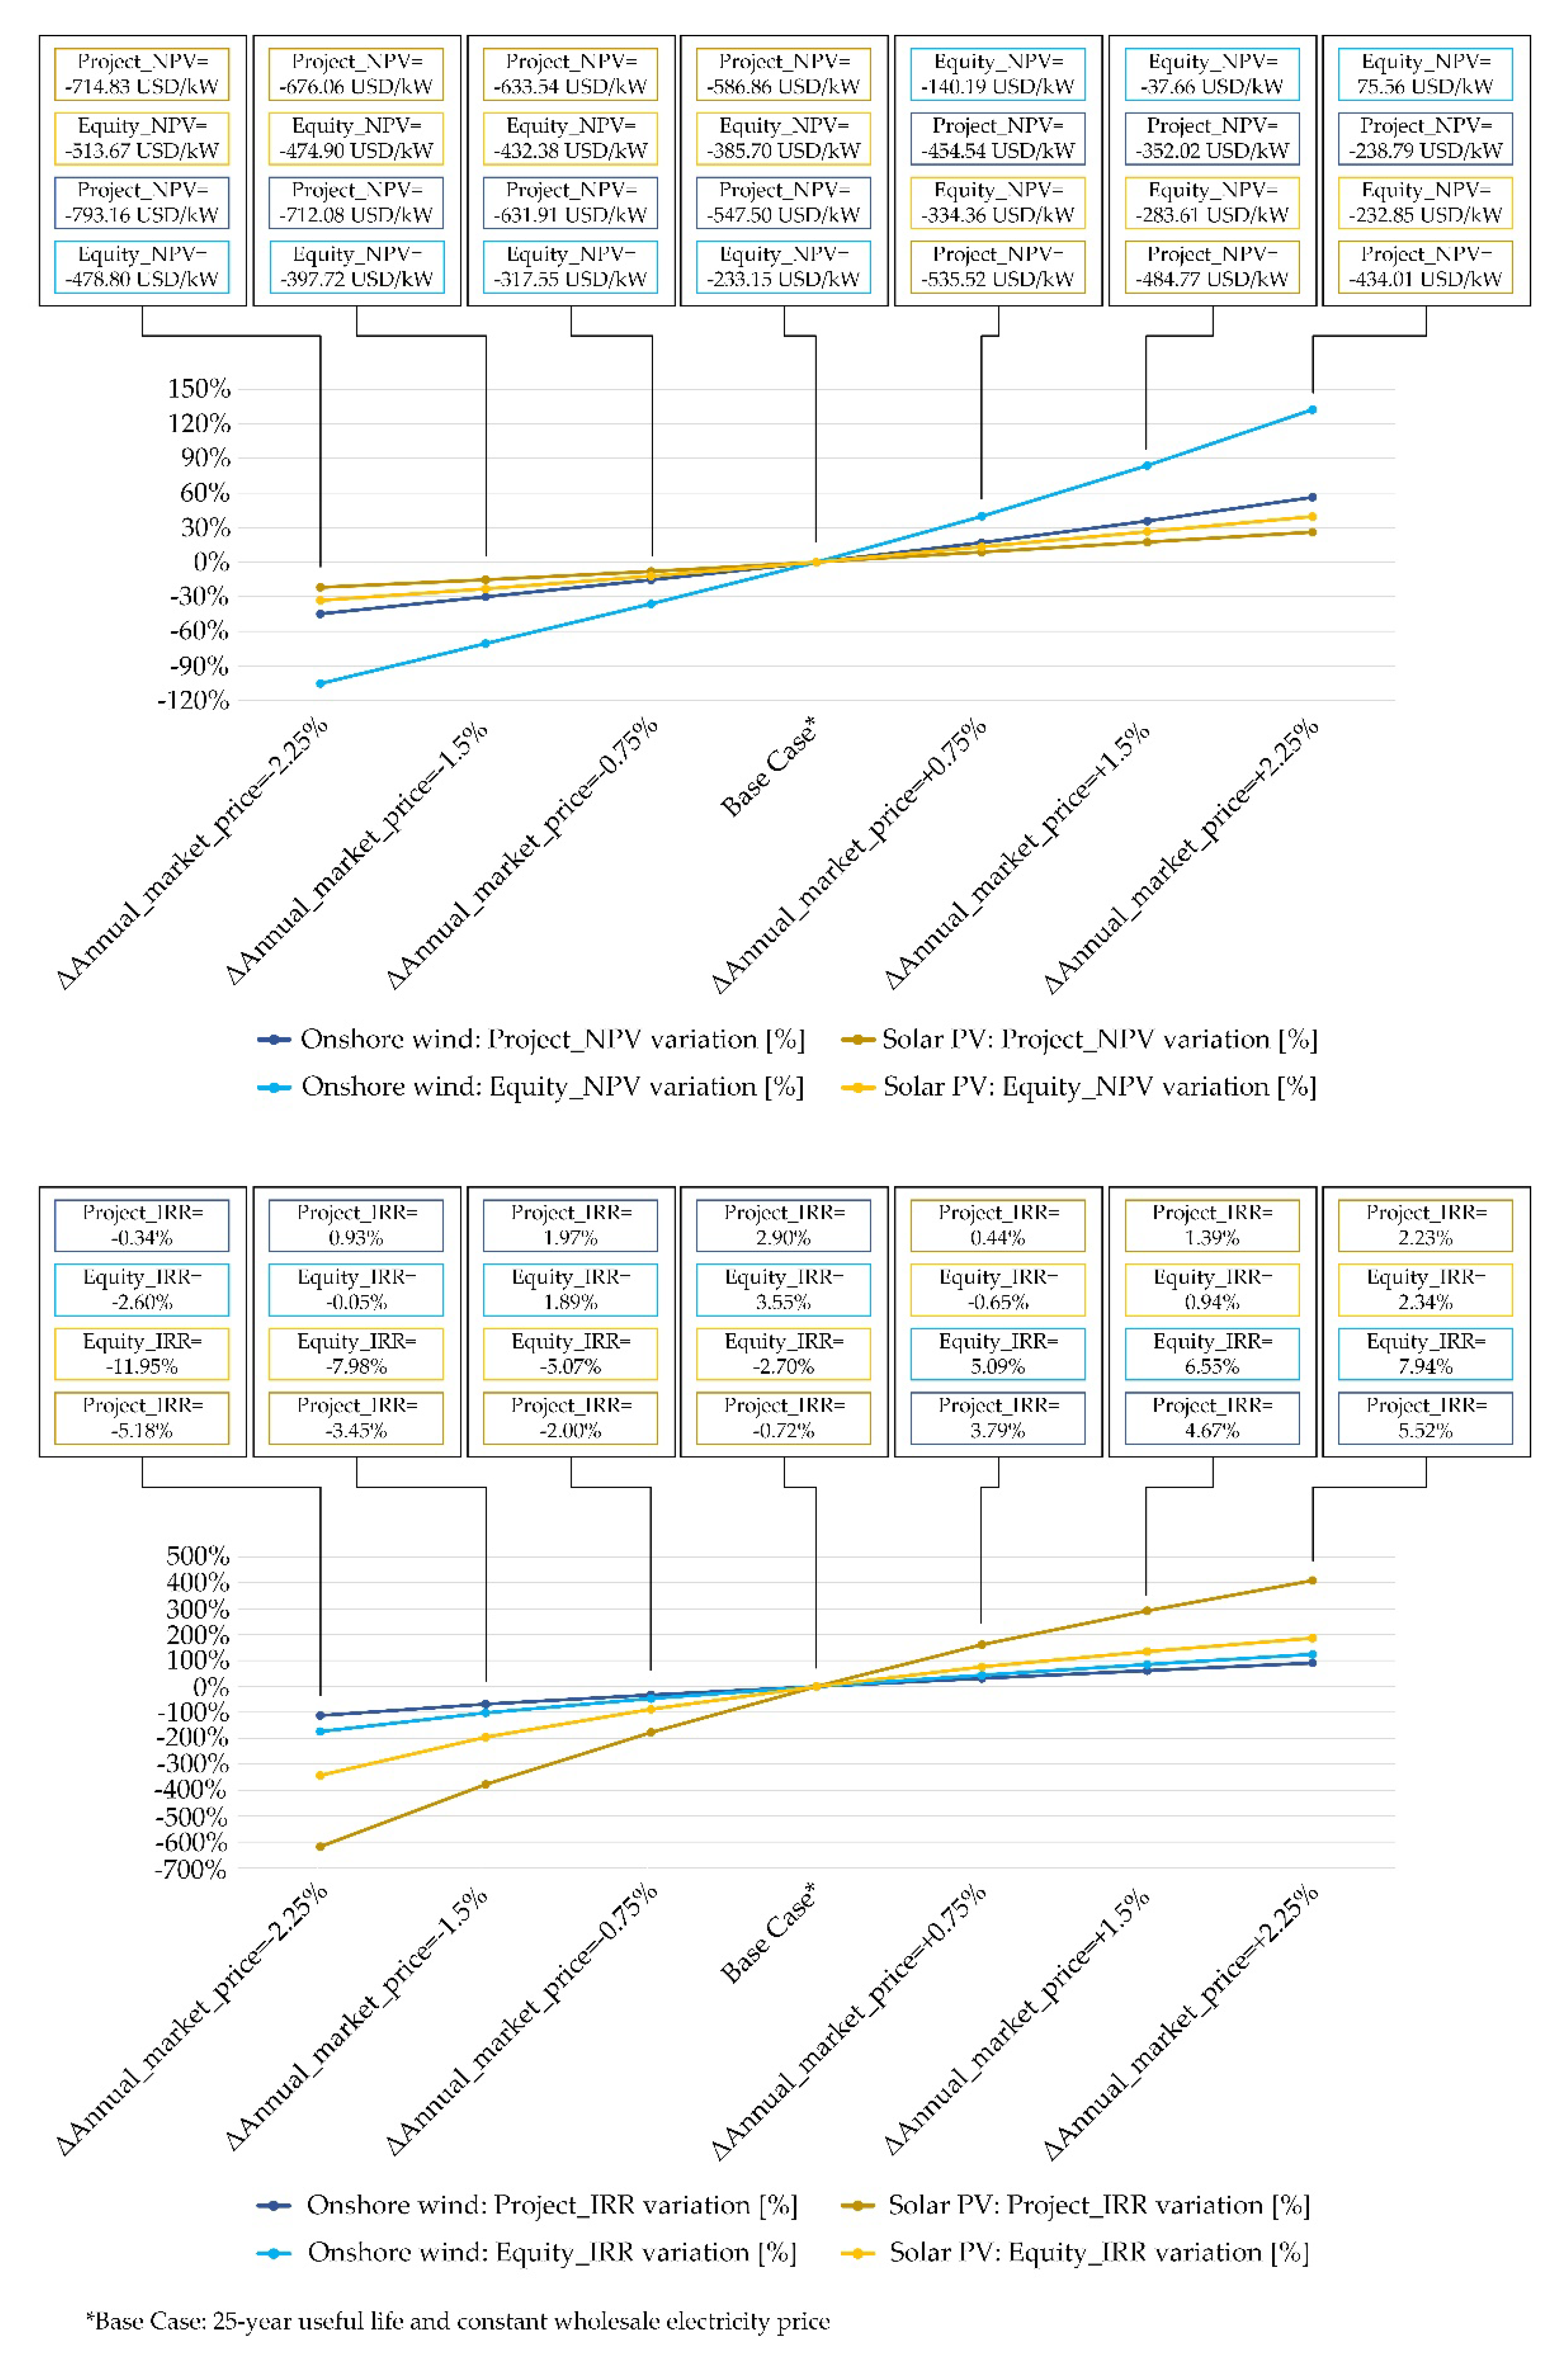
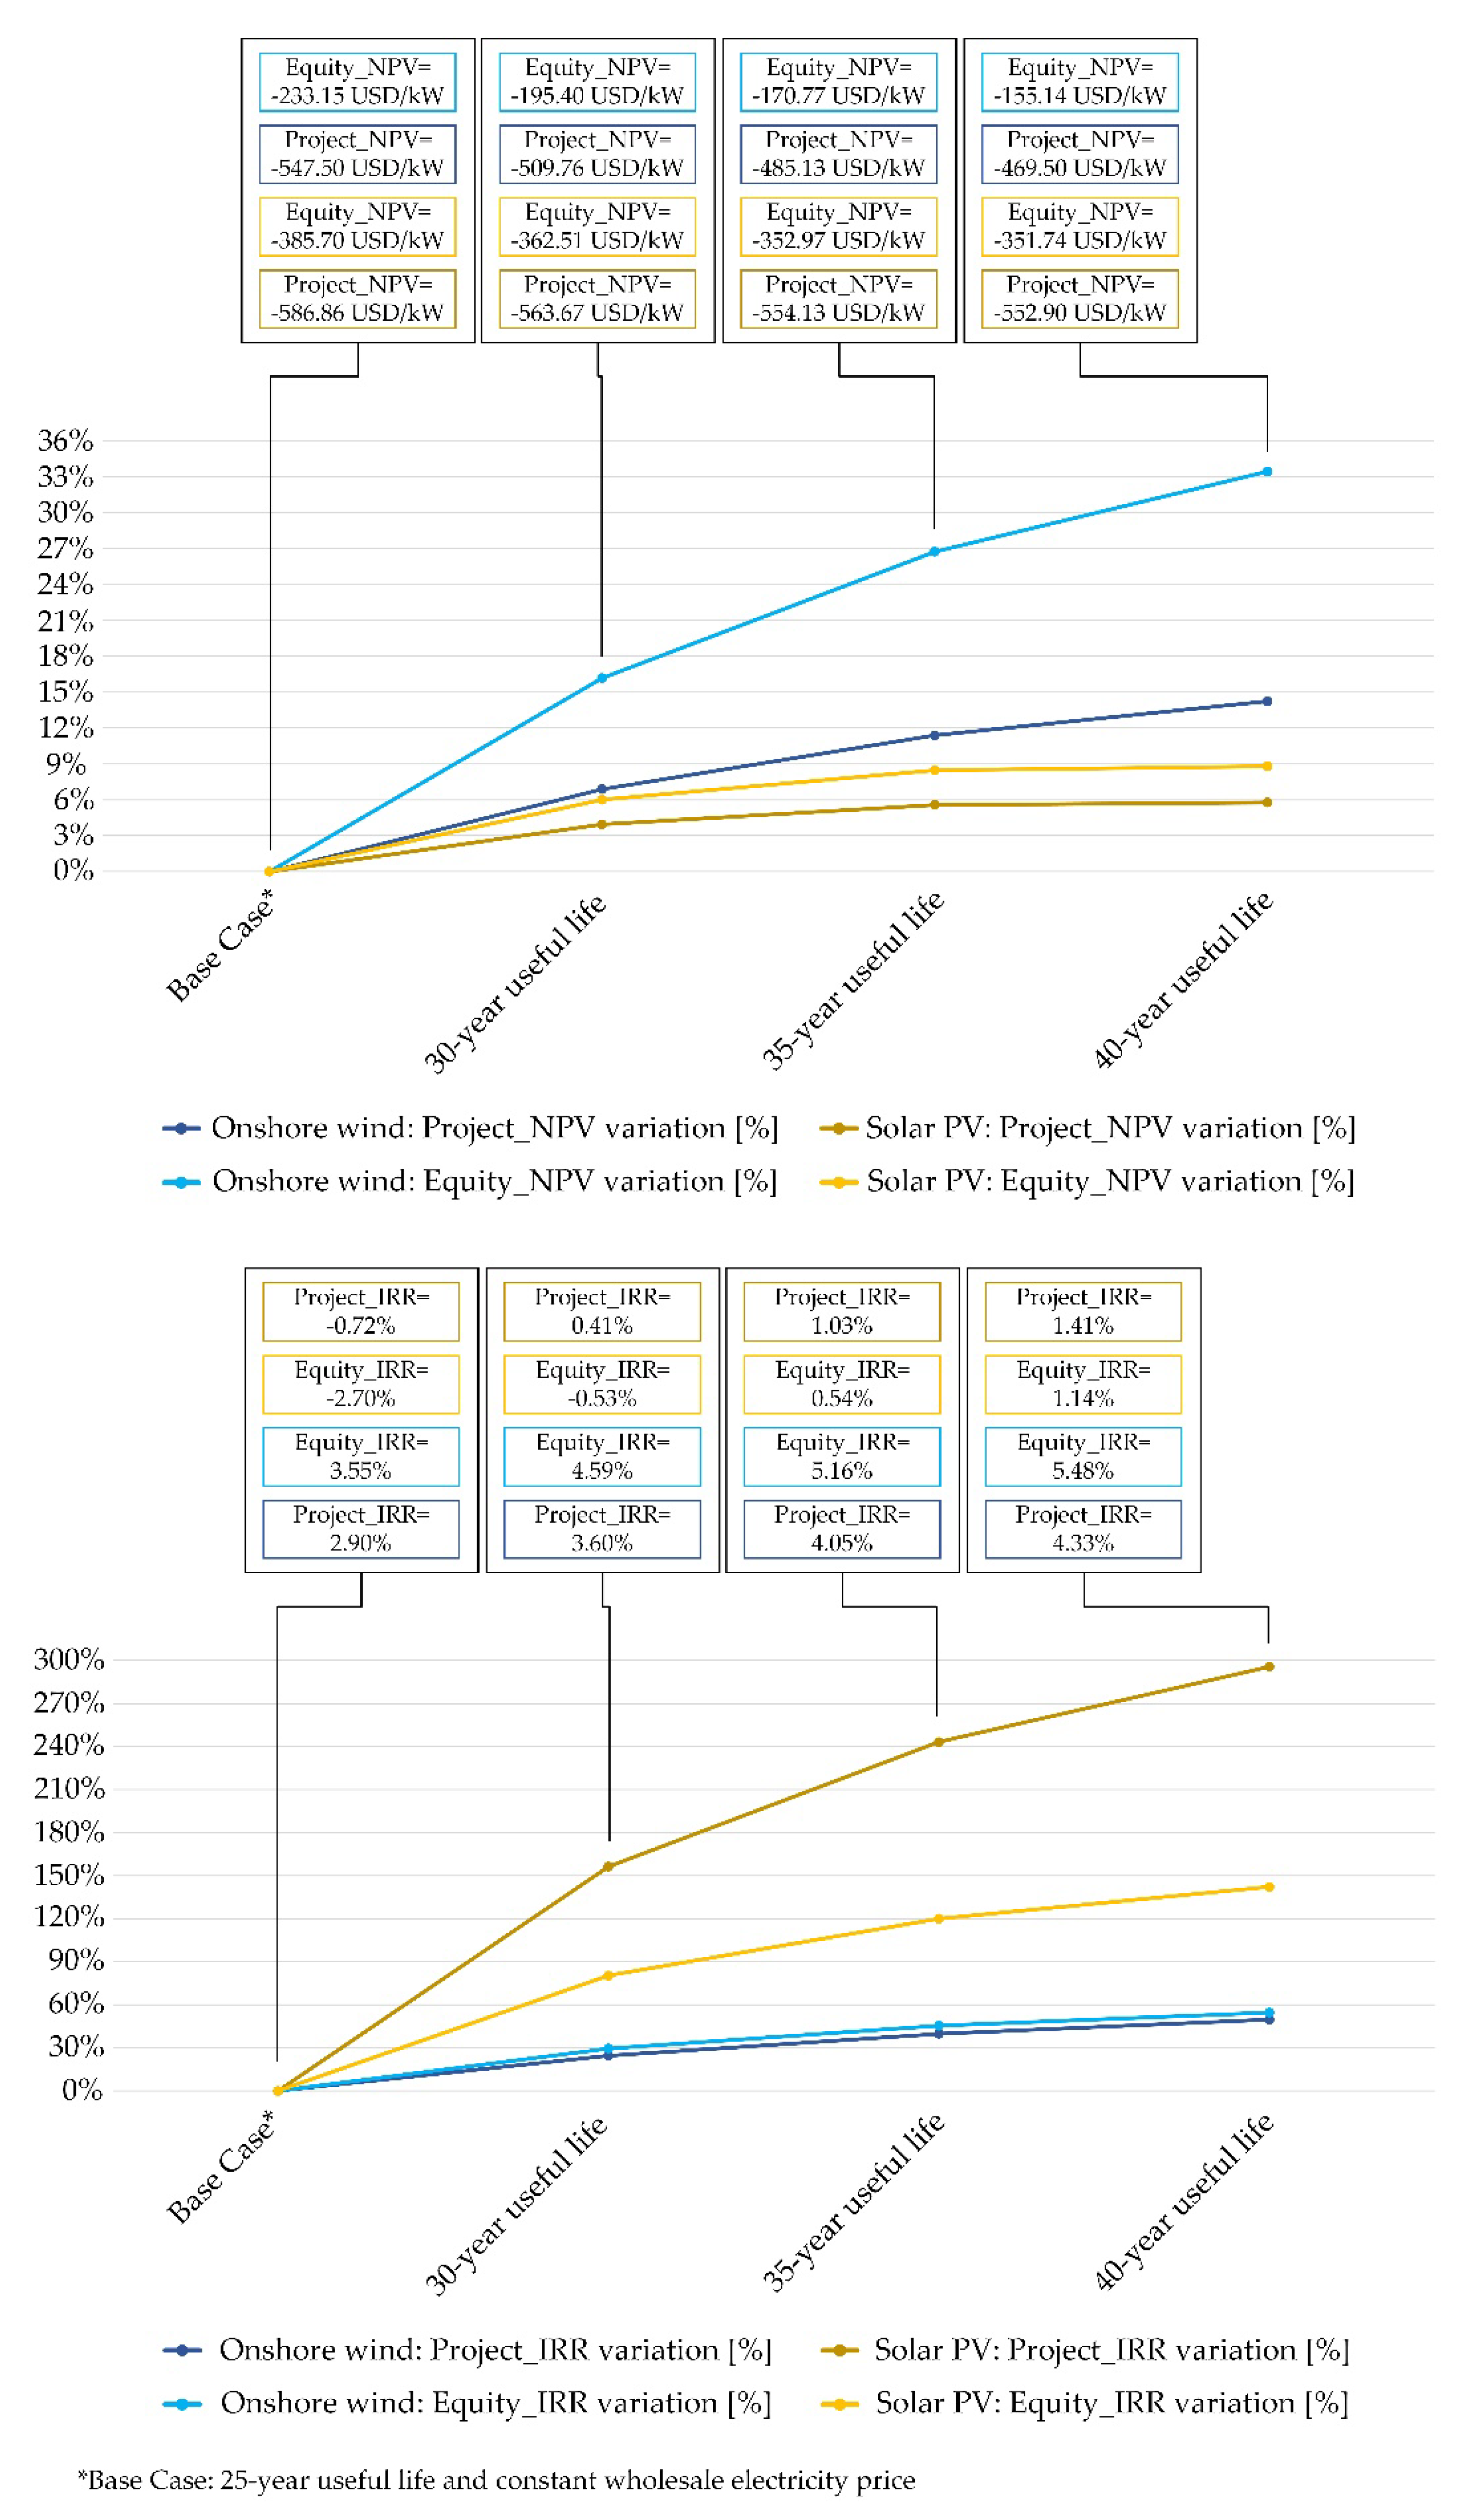
3.3. NPV and IRR Sensitivity Results for the Danish Case

In order to gain insight about the effect on the NPV and IRR results of the variation of relevant parameters of the base case assumptions, a sensitivity analysis is conducted and presented in Figure 5, Figure 6, Figure 7 and Figure 8.
Figure 5 shows the evolution of the project and equity NPV percentage variations with the WACC percentage variations, where after tax WACC has been taken as a proxy of the discount rate. The employed colour coding is dark blue for the onshore wind project NPV, light blue for the onshore wind equity NPV, brown for the PV project NPV and yellow for the PV equity NPV. The same colour coding has been used for framing the NPV values per unit of power corresponding to the different calculated points of each trend, placed at the top of the figure. The same organizational scheme and colour coding applies to Figure 6, Figure 7 and Figure 8.
In the upper subplot of Figure 6, the evolution of the project and equity NPV percentage variations with the investment cost percentage variations is represented, while the lower subplot is devoted to the project and equity IRR percentage variations with the investment cost percentage variations.
Figure 7 depicts in the upper subplot the evolution of the project and equity NPV percentage variations with the annual market price percentage variations, while the lower subplot represents the project and equity IRR percentage variations with the same annual market price percentage variations.
Additionally, Figure 8 represents the evolution of the project and equity NPV percentage variations with the lifetime in the upper subplot, and the project and equity IRR percentage variations with the same lifetime in the lower subplot. It is assumed that at the end of the 20-year fixed FIP support, only the wholesale market price is received.

4. Discussion

4.1. Analysis of Auction Prices and LCOE Comparison Results

The examination of Figure 1, Figure 2, Figure 3 and Figure 4 allows to distinguish two different outcomes of the comparison between the auction prices and the LCOEs. On the one hand, most mature RES technologies as PV and onshore wind as well as the case of offshore wind, almost systematically present lower proxies of the mean remuneration level than their corresponding LCOEs. On the other hand, for other technologies the situation is reversed (see small hydro in Figure 1 and Figure 4, biomass in Figure 1, Figure 3 and Figure 4, and biogas in Figure 1 and Figure 4). The reasons for such uneven performance should be sought both in the LCOE input data as well as in the technology-dependent bidding approach.
As regards the LCOE and following [30], a 7.5% discount rate has been applied to all the countries belonging to the Organization for Economic Co-operation and Development (OECD) and China, whereas a 10% has been employed for the rest of the world (see Table 2). These different discount rates find their justification in the lower borrowing costs and more stable energy policies that usually correspond to the OECD countries. Likewise, the same discount rates have been applied to all RES technologies in a country, making no distinction between their respective maturity levels.
The high impact of discount rates on the LCOE has been widely assessed in the literature. It has been qualified as major LCOE-determining factor, even above other parameters related to the system performance [36,38]. It is common to find studies applying discount rates varying in the range 5–10% [35], where the higher values acknowledge an increased risk perception [32]. While the use of a same discount rate for a broad group of countries can be justified for ease of comparison, other works argue for country-specific values [38]. This choice could channel to the LCOE different exposures to risk stemming from varied governmental policies and other macro-economic parameters. Consequently, the use of discount rates less than the uniform values applied to most cases in Table 1, could level down the LCOE outcomes to be more aligned with the consistently decreasing bid prices observed for certain countries and technologies.
Furthermore, the comparison between auction prices and LCOEs, although being a common practice, must be taken with caution. As mentioned in Section 2, LCOE can be regarded as the constant remuneration per unit of energy that breaks-even the NPV of a project. Consequently, a fair comparison would require the same constant over time behaviour of the contrasted quantity. Nevertheless, most bid and market prices presented in Figure 1, Figure 2, Figure 3 and Figure 4 as a proxy of project remuneration do not meet this specification. The PPA prices shown in Figure 1 for Argentina and Chile correspond to the first year of operation and are subject to uncertain periodical adjustments. Likewise, the average market price shown in Figure 2, Figure 3 and Figure 4 for the year of the auction will fluctuate over time and at least the CfD for the Canadian, Polish and British cases will experience periodical updates. So, the comparison performed in Figure 1, Figure 2, Figure 3 and Figure 4 is a fixed picture that will evolve in time in an uncertain manner. Although valuable insights can be drawn, not taking into account the time varying nature of revenue streams can be misleading.
Even allowing room for future increases of remuneration, the width of the gaps between the LCOEs and the income proxies for some of the presented cases (see i.e., the offshore wind auctions of Germany and the UK in Figure 3 and Figure 4) demands further substantiation.
For projects with planned entry into operation for several years ahead, developers may be relying on new reductions in investment and O&M costs and increases in energy production [7,12]. In this case, what is being evaluated is not the current LCOE but its possible future reduced value [3].
Low bid prices could well not be the only source for support under certain auction designs. Indirect ways of support could take the form of avoidance of determined costly and time-consuming administrative processing steps or the provision of grid connection capacity, as has been the case for certain offshore wind auctions in Denmark, Germany and the Netherlands [2,7]. Regarding the last investment cost estimates in [30] for German offshore wind, the contemplated exemption of grid connection costs could stand in a range around 20% of the investment cost [14]. Other envisaged forms of indirect support could be fiscal incentives and several tax benefits, as reported for Argentina [20].
The projects may also rely on additional sources of revenue outside the auction scheme, such as the provision of ancillary services [3], carbon market mechanisms [32] or energy sold either in private PPAs or in the wholesale market after the end of support.
There is also the possibility of additional streams of revenue from the extension of the conventional lifetime of the projects. As for PV, 40-year lifetimes have been reported and even 50 years have been speculated for certain PV technologies [36].
After reviewing other sources of additional incomes not reflected in the bid price, there remains the possibility of strategic or speculative underbidding for obtaining market power undermining other players [18,39] or securing grid connection [7], even renouncing normal financial returns [36]. Underbidding may also be due to not reliable estimations of the financial and technical capabilities to undertake the project development [33].

4.2. Analysis of NPV and IRR Results for Opposed Cases

The opposed profitability results shown in Table 4 for the most mature solar PV and onshore wind technologies regarding the biomass case confirm the preliminary appraisal already apparent in Figure 2 and Figure 3, respectively.
Support awarded to Danish onshore wind and solar PV would need discount rates of 2.90% and −0.72% (see Table 4), respectively, to break-even the project NPV under the base case assumptions of Table 3. The onshore wind project IRR is less than half the base case WACC, and the negative solar PV project IRR means that even without discounting the cash-flows, the investment cannot be recovered.

4.3. Analysis of the NPV and IRR Sensitivity Results for the Danish Case

Figure 5 shows the expected downward evolution of the percentage variations of NPV with those of WACC. Several points of interest can be identified in the figure.
On the one hand, the NPV results presented in Table 4 can be seen in Figure 5 in the labels corresponding to the base case point. In addition, the WACC percentage variations needed for NPV break-even, i.e., those corresponding to the IRR values in Table 4, have been highlighted in Figure 5. Thus, a red point on the onshore wind project NPV characteristic indicates that a decrease in the base case WACC of around 59% is needed to break-even. The corresponding point for the equity NPV break-even has been marked with a red cross.
The impact of the WACC variations on the NPV variations appears more pronounced for onshore wind, as both positive and negative WACC variations produce greater changes in NPV than in the solar PV case, which is simply unprofitable under the base case assumptions, whatever the WACC may be.
As regards Figure 6, the almost linear downward evolution of the percentage variations of NPV with those of investment cost can be observed in its upper subplot. The NPV results presented in Table 4 can be seen in this subplot in the labels corresponding to the base case point. Compared to Figure 5, the lower impact of the investment cost variations on NPV compared to the WACC variations can be observed. The onshore wind project NPV characteristic is more sensible than that of solar PV, but neither one of them achieves a positive project NPV even with a 25% discount on investment cost. Outside the displayed range, the project NPV break-even investment costs stand around 1016 USD/kW for onshore wind and around 414 USD/kW for solar PV. This values almost represent 37% and 60% of discount for onshore wind and solar PV, respectively, over the base case investment cost in Table 3, when the base case WACC is employed.
The lower subplot of Figure 6 shows the approximately linear downward evolution of the percentage variations of IRR with those of investment cost. The IRR results presented in Table 4 can be seen in this subplot in the labels corresponding to the base case point. The project IRR solar PV characteristic appears more sensible than that of onshore wind. It can also be noted that while the percentage investment cost variations tend towards the abovementioned 37% and 60% discounts compared to the base case, the project IRR tends to match the base case WACC.
The upper subplot of Figure 7 shows the expected upward evolution of the percentage variations of NPV with those of the mean annual wholesale market price. Again, the NPV results presented in Table 4 can be seen in this subplot in the labels corresponding to the base case point. When compared to Figure 5, it can also be noticed the lower impact of the mean annual wholesale market price variations on NPV than WACC variations. The onshore wind project NPV characteristic is more sensible than that of solar PV, but neither one of them achieves a positive project NPV even with sustained annual increments of 2.25% in the mean market price. Beyond the plotted range, the project NPV break-even cost for sustained annual increments in the mean market price is around 3.6% for onshore wind and around 6.8% for solar PV, when the base case WACC is employed.
As demonstrated by the lower subplot of Figure 7, there is a quite linear upward evolution of the percentage variations of the IRR compared with those of the mean annual wholesale market price. The IRR results presented in Table 4 can also be seen in this subplot in the labels corresponding to the base case point. The project IRR solar PV characteristic is more sensible than that of onshore wind. It can be seen that as the percentage variations in the annual mean market price tend to the aforementioned 3.6% for onshore wind and 6.8% for solar PV, the project IRR tends to reach the base case WACC.
Regarding Figure 8, its upper subplot shows a saturating upward evolution of the percentage variations of NPV with the lifetime or useful life. As in the former figures, the NPV results presented in Table 4 can be seen in this subplot in the labels corresponding to the base case point. Compared to Figure 5, the lower impact on NPV in terms of extending lifetime relative to WACC variations can be seen. The onshore wind project NPV characteristic is more sensible than that of solar PV, but neither one of them achieves a positive project NPV even receiving the mean market price during 20 additional years after the end of the fixed FIP support, under the base case assumptions in Table 3. In fact, the negative project NPVs of onshore wind and solar PV in the base case only improve a tiny 15% and 9% after the lifetime extension to 40 years, respectively.
The lower subplot of Figure 8 also illustrates a saturating upward evolution of the percentage variations of IRR with the lifetime. The IRR results presented in Table 4 can be seen in this subplot in the labels corresponding to the base case point. The project IRR solar PV characteristic is again more sensible than that of onshore wind.

4.4. Final Remarks

The extensive sensitivity analysis performed in Section 4.3 has confirmed the great impact of the discount rate on the profitability results. For the onshore wind case, a reduction in the discount rate by more than half of the base case value led to the achievement of break-even conditions in the project NPV. Nevertheless, the solar PV case was revealed to be unprofitable under the base case assumptions for whatever positive discount rate.
Relying exclusively on investment cost reductions for project NPV break-even required of unrealistic investment costs around 1016 USD/kWh for onshore wind and 414 USD/kWh for solar PV, under the rest of the base case assumptions. Likewise, depending solely on increases in the mean market price for achieving positive NPV values, sustained annual increases of around 3.6% for onshore wind and 6.8% for solar PV are needed. On the other hand, the extension of the useful life by up to 20 additional years after the end of the fixed FIP support only caused a minor 15% and 9% improvement over the negative base case project NPVs.
Between these bounding scenarios, there could be found combinations of input parameters yielding positive project NPVs, but their feasibility is subject to significant uncertainty.
Envisaged reductions in the investment costs could not materialise due to increased demand putting pressure on prices, imposition of safeguards to imports [9] or changes of exchange rates [3].
If forecasting how the market price will evolve in the short term is not without risk, it is even more challenging making predictions 20 to 40 years ahead from the end of support. In this sense, concerns have been expressed on several factors potentially affecting the evolution of market prices in diverse ways, as the decreasing effect on clearing prices of increasing volumes of RES integration [40], or the phasing-out of conventional and nuclear capacity, among others [14].
The abovementioned sources of uncertainty along with the perception of increased risk due to reduced support may increase the cost of capital, thus tightening the access to the cheap financing needed to improve profitability [32].
Taking into account the uncertainty affecting the market revenue as well as other input parameters, a probabilistic approach is advisory for determining the viability of the projects bidding at low record prices. In this sense, the next envisaged research step is the probabilistic valuation of representative “subsidy-free” RES projects, in order to better capture the impact of randomness in their economic performance and obtaining a measure of the associated risk.

5. Conclusions

This paper contributes to the analysis of the continued descending trend observed in RES bid prices in the last years. To this end, a survey of recent multi-country and multi-technology auction data representative of the various existing types of support has been gathered, as well as the necessary input parameters for calculating their corresponding LCOEs.
Following a usual practice, the LCOEs have been compared to a proxy of the remuneration of the projects, in order to gain some insights on their profitability. At the same time, a critical assessment has been provided on the ability of the LCOE for serving as the reference for determining the adequacy of the support awarded in auctions.
Having identified consistent opposed outcomes in the comparison between LCOEs and bid prices for RES technologies with different maturity and deployment levels, the subject is further investigated by determining more suitable profitability metrics as the project and equity NPV and IRR in a sound base case.
In view of the unviable obtained results, a sensitivity analysis is performed in order to determine which variations in the input parameters could lead to NPV break-even.
The higher impact of the discount rate on the profitability of the projects is confirmed, while the contribution of the other parameters more limited. In any case, for the analysed solar PV case it is found that NPV break-even cannot be reached in realistic scenarios. This illustrates that the low record bid prices achieved in recent years could rely on specific assumptions concerning the input parameters that could well be unrealistic.
Although some projects may also be counting on receiving indirect support for achieving profitability, the concerns raised about their effective deployment seem justified, although only time will tell.

Author Contributions

Conceptualisation, H.M., S.C.; methodology, H.M., J.d.l.H.; software, S.C.; validation, H.M., S.C., À.A., J.d.l.H.; formal analysis, H.M., S.C.; investigation, H.M.; data curation, H.M., S.C., À.A., J.d.l.H.; writing—original draft preparation, H.M.; writing—review and editing, H.M., S.C., À.A., J.d.l.H., J.M.; visualisation, S.C.; supervision, J.M.; All authors have read and agreed to the published version of the manuscript.

Funding

This research was funded by MINECO/FEDER grant number ENE2015-64087-C2-1-R and by PO FEDER DE CATALUNYA 2014-2020 grant number PECT LITORAL BESÒS TERRITORI SOSTENIBLE GO03-003364-Talent energètic.

Conflicts of Interest

The authors declare no conflict of interest.

Acronyms

CfDcontract for differences
PIconsumer price index
FIPFeed-in premium
IRRinternal rate of return
LCOElevelised cost of energy
NPVnet present value
OECDOrganization for Economic Co-operation and Development
O&Moperation and maintenance
PPApower purchase agreement
PVsolar photovoltaics
RESrenewable energy sources
UKUnited Kingdom
USUnited States
USD United States dollar
WACCweighted average cost of capital

Appendix A

The LCOE is calculated following the methodology of [30]:
LCOE = IE 0 + t = 1 T IE t + O & M t + F t ( 1 + r ) t t = 1 T E t ( 1 + r ) t
where:
IE0, IEt are the investment expenditures in the year 0 (previous to the entry in operation) and in the year t, respectively, O&Mt is the sum of fixed and variable O&M in the year t, Ft is the fuel expenditure, Et is the generated energy in the year t and r is the discount rate.
The IE0 values taken from [30] include financing costs, and the fixed and variable O&Mt costs have been considered constant for all the lifetime T of the projects. It has been applied a 0.5% annual degradation for the calculation of Et in the PV case.

References

  1. IRENA. Renewable Energy Auctions: Status and Trends beyond Price; International Renewable Energy Agency: Abu Dhabi, UAE, 2019. [Google Scholar]
  2. REN21. Renewables 2019 Global Status Report; REN21: Paris, France, 2019. [Google Scholar]
  3. Dobrotkova, Z.; Surana, K.; Audinet, P. The price of solar energy: Comparing competitive auctions for utility-scale solar PV in developing countries. Energy Policy 2018, 118, 133–148. [Google Scholar] [CrossRef]
  4. Matthäus, D. Designing effective auctions for renewable energy support. Energy Policy 2020, 142, 111462. [Google Scholar] [CrossRef]
  5. Welisch, M. Multi-unit renewables auctions for small markets—Designing the Danish multi-technology auction scheme. Renew. Energy 2019, 131, 372–380. [Google Scholar] [CrossRef]
  6. Gutiérrez, J.; Zuluaga, L.J.; Giraldo, J.C.; Grosso, K. Renewable Energy Auctions in Colombia: Lessons Learned in Energy Policy Design. In Proceedings of the 2019 FISE-IEEE/CIGRE Conference—Living the energy Transition (FISE/CIGRE), Medellin, Colombia, 4–6 December 2019; pp. 1–5. [Google Scholar]
  7. Welisch, M.; Poudineh, R. Auctions for allocation of offshore wind contracts for difference in the UK. Renew. Energy 2020, 147, 1266–1274. [Google Scholar] [CrossRef]
  8. Welisch, M. The Importance of Penalties and Pre-qualifications: A Model-based Assessment of the UK Renewables Auction Scheme. Econ. Energy Environ. Policy 2018, 7, 15–31. [Google Scholar] [CrossRef]
  9. Bose, A.S.; Sarkar, S. India’s e-reverse auctions (2017–2018) for allocating renewable energy capacity: An evaluation. Renew. Sustain. Energy Rev. 2019, 112, 762–774. [Google Scholar] [CrossRef]
  10. Thapar, S.; Sharma, S.; Verma, A. Analyzing solar auctions in India: Identifying key determinants. Energy Sustain. Dev. 2018, 45, 66–78. [Google Scholar] [CrossRef]
  11. Batz, T.; Müsgens, F. A first analysis of the photovoltaic auction program in Germany. In Proceedings of the 2019 16th International Conference on the European Energy Market (EEM), Ljubljana, Slovenia, 18–20 September 2019; pp. 1–5. [Google Scholar] [CrossRef]
  12. Lundberg, L. Auctions for all? Reviewing the German wind power auctions in 2017. Energy Policy 2019, 128, 449–458. [Google Scholar] [CrossRef]
  13. Grashof, K.; Berkhout, V.; Cernusko, R.; Pfennig, M. Long on promises, short on delivery? Insights from the first two years of onshore wind auctions in Germany. Energy Policy 2020, 140, 111240. [Google Scholar] [CrossRef]
  14. Müsgens, F.; Riepin, I. Is Offshore Already Competitive? Analyzing German Offshore Wind Auctions. In Proceedings of the 2018 15th International Conference on the European Energy Market (EEM), Lodz, Poland, 27–29 June 2018; pp. 1–6. [Google Scholar] [CrossRef]
  15. Kreiss, J.; Ehrhart, K.-M.; Hanke, A.-K. Auction-theoretic analyses of the first offshore wind energy auction in Germany. J. Phys. Conf. Ser. 2017, 926, 012015. [Google Scholar] [CrossRef] [Green Version]
  16. Romeiro, D.L.; de Almeida, E.L.F.; Losekann, L. Systemic value of electricity sources—What we can learn from the Brazilian experience? Energy Policy 2020, 138, 111247. [Google Scholar] [CrossRef]
  17. Washburn, C.; Pablo-Romero, M. Measures to promote renewable energies for electricity generation in Latin American countries. Energy Policy 2019, 128, 212–222. [Google Scholar] [CrossRef]
  18. Botta, E. An experimental approach to climate finance: The impact of auction design and policy uncertainty on renewable energy equity costs in Europe. Energy Policy 2019, 133, 110839. [Google Scholar] [CrossRef]
  19. Kruger, W.; Stritzke, S.; Trotter, P.A. De-risking solar auctions in sub-Saharan Africa—A comparison of site selection strategies in South Africa and Zambia. Renew. Sustain. Energy Rev. 2019, 104, 429–438. [Google Scholar] [CrossRef]
  20. Menzies, C.; Marquardt, M.; Spieler, N. Auctions for the Support of Renewable Energy in Argentina. D2.1-AR.; December 2019. Available online: http://aures2project.eu/wp-content/uploads/2020/02/AURES_II_case_study_Argentina.pdf (accessed on 2 May 2020).
  21. Del Río, P.; Kiefer, C. Auctions for the Support of Renewable Energy in Chile. D2.1-CL.; November 2019. Available online: http://aures2project.eu/wp-content/uploads/2019/12/AURES_II_case_study_Chile.pdf (accessed on 2 May 2020).
  22. Del Río, P.; Lucas, H.; Dézsi, B.; Diallo, A. Auctions for the Support of Renewable Energy in Portugal. D2.1-PT.; December 2019. Available online: http://aures2project.eu/wp-content/uploads/2020/02/AURES_II_case_study_Portugal.pdf (accessed on 2 May 2020).
  23. Garzón González, M.; Kitzing, L. Auctions for the Support of Renewable Energy in Denmark. D2.1-DK.; December 2019. Available online: http://aures2project.eu/wp-content/uploads/2019/12/AURES_II_case_study_Denmark.pdf (accessed on 2 May 2020).
  24. Sach, T.; Lotz, B.; von Blücher, F. Auctions for the Support of Renewable Energy in Germany. D2.1-DE.; December 2019. Available online: http://aures2project.eu/wp-content/uploads/2020/04/AURES_II_case_study_Germany_v3.pdf (accessed on 2 May 2020).
  25. Jakob, M.; Noothout, P.; von Bluecher, F.; Klessmann, C. Auctions for the Support of Renewable Energy in the Netherlands. D2.1-NL.; December 2019. Available online: http://aures2project.eu/wp-content/uploads/2019/12/AURES_II_case_study_Netherlands.pdf (accessed on 2 May 2020).
  26. Menzies, C.; Marquardt, M. Auctions for the Support of Renewable Energy in Alberta, Canada. D2.1-CA.; December 2019. Available online: http://aures2project.eu/wp-content/uploads/2020/02/AURES_II_case_study_Canada.pdf (accessed on 2 May 2020).
  27. Anatolitis, V. Auctions for the Support of Renewable Energy in Greece. D2.1-EL.; February 2020. Available online: http://aures2project.eu/wp-content/uploads/2020/03/AURES_II_case_study_Greece.pdf (accessed on 2 May 2020).
  28. Diallo, A.; Dézsi, B.; Bartek-Lesi, M.; Mezősi, A.; Szajkó, G.; Kácsor, E.; Szabó, L. Auctions for the Support of Renewable Energy in Poland. D2.1.; August 2019. Available online: http://aures2project.eu/wp-content/uploads/2019/08/Polish-Auctions_final.pdf (accessed on 2 May 2020).
  29. Woodman, B.; Fitch-Roy, O. Auctions for the Support of Renewable Energy in the UK. D2.1.; September 2019. Available online: http://aures2project.eu/wp-content/uploads/2019/10/AURES_II_UK_case_study.pdf (accessed on 2 May 2020).
  30. IRENA. Renewable Power Generation Costs in 2018; International Renewable Energy Agency: Abu Dhabi, UAE, 2019; ISBN 978-92-9260-126-3. Available online: https://www.irena.org/-/media/Files/IRENA/Agency/Publication/2019/May/IRENA_Renewable-Power-Generations-Costs-in-2018.pdf (accessed on 2 May 2020).
  31. OpenEI. Transparent Cost Database. National Renewable Energy Laboratory. Available online: https://openei.org/apps/TCDB/#blank (accessed on 2 May 2020).
  32. Tao, J.Y.; Finenko, A. Moving beyond LCOE: Impact of various financing methods on PV profitability for SIDS. Energy Policy 2016, 98, 749–758. [Google Scholar] [CrossRef]
  33. Cassetta, E.; Monarca, U.; Nava, C.R.; Meleo, L. Is the answer blowin’ in the wind (auctions)? An assessment of the Italian support scheme. Energy Policy 2017, 110, 662–674. [Google Scholar] [CrossRef]
  34. Held, A.; Ragwitz, M.; Gephart, M.; de Visser, E.; Klessmann, C. Design Features of Support Schemes for Renewable Electricity. Cooperation between EU MS under the Renewable Energy Directive and Interaction with Support Schemes, Project Number DESNL13116, Task 2 Report. European Commission, Brussels. 2014. Available online: https://ec.europa.eu/energy/sites/ener/files/documents/2014_design_features_of_support_schemes.pdf (accessed on 2 May 2020).
  35. Foster, J.; Wagner, L.; Bratanova, A. LCOE Models: A Comparison of the Theoretical Frameworks and Key Assumptions; Energy Economics and Management Group Working Papers from School of Economics, University of Queensland: Brisbane, Australia, 2014. [Google Scholar]
  36. Bazilian, M.; Onyeji, I.; Liebreich, M.; MacGill, I.; Chase, J.; Shah, J.; Gielen, D.; Arent, D.; Landfear, D.; Zhengrong, S. Re-considering the economics of photovoltaic power. Renew. Energy 2013, 53, 329–338. [Google Scholar] [CrossRef]
  37. Simpson, J.; Loth, E.; Dykes, K. Cost of Valued Energy for design of renewable energy systems. Renew. Energy 2020, 153, 290–300. [Google Scholar] [CrossRef]
  38. Ondraczek, J.; Komendantova, N.; Patt, A. WACC the dog: The effect of financing costs on the levelized cost of solar PV power. Renew. Energy 2015, 75, 888–898. [Google Scholar] [CrossRef]
  39. Mora, D.; Islam, M.; Soysal, E.R.; Kitzing, L.; Blanco, A.L.A.; Förster, S.; Tiedemann, S.; Wigand, F. Experiences with auctions for renewable energy support. In Proceedings of the 2017 14th International Conference on the European Energy Market (EEM), Dresden, Germany, 6–9 June 2017; pp. 1–6. [Google Scholar]
  40. Nasirov, S.; Cruz, E.; Agostini, C.A.; Silva, C. Policy Makers’ Perspectives on the Expansion of Renewable Energy Sources in Chile’s Electricity Auctions. Energies 2019, 12, 4149. [Google Scholar] [CrossRef]
Figure 1. LCOE (yellow bars) versus power purchase agreements (PPA) price (grey bars) for the auctions from Argentina, Chile and Portugal listed in Table 1. Source: self-elaboration.
Energies 13 03383 g001
Figure 2. LCOE (yellow bars) versus mean awarded bid price under the fixed feed-in premium (FIP) scheme (grey bars) and mean awarded bid price added to the mean wholesale electricity price in the first year (blue bars) for the auctions from Denmark listed in Table 1. Source: self-elaboration.
Energies 13 03383 g002
Figure 3. LCOE (yellow bars) versus mean awarded bid price under the sliding FIP scheme (grey bars) and mean wholesale electricity price in the first year (blue bars) for the auctions from Germany and the Netherlands listed in Table 1. Source: self-elaboration.
Energies 13 03383 g003
Figure 4. LCOE (yellow bars) versus mean awarded bid price under the CfD scheme (grey bars), mean wholesale electricity price (blue bars) and the resulting mean difference to receive or pay in the first year (orange bars) for the auctions of Canada, Greece, Poland and UK listed in Table 1. Source: self-elaboration.
Energies 13 03383 g004
Figure 5. Project and equity NPV percentage variation with WACC percentage variation for the Danish case. Source: self-elaboration.
Energies 13 03383 g005
Figure 6. Project and equity NPV percentage variation (upper subplot) and project and equity IRR percentage variation (lower subplot) with investment cost percentage variation for the Danish case. Source: self-elaboration.
Energies 13 03383 g006
Figure 7. Project and equity NPV percentage variation (upper subplot) and project and equity IRR percentage variation (lower subplot) with annual market price percentage variation for the Danish case. Source: self-elaboration.
Energies 13 03383 g007
Figure 8. Project and equity NPV percentage variation (upper subplot) and project and equity IRR percentage variation (lower subplot) with the useful life for the Danish case. Source: self-elaboration.
Energies 13 03383 g008
Table 1. Data of renewable energy sources (RES) auctions held in the 2017–2019 period in selected countries. Source: Self-elaboration based on [20,21,22,23,24,25,26,27,28,29].
CountrySupportDateDuration
[Years]
TechnologyMean Awarded
Bid Price [USD/kWh]
ArgentinaPPA
(in USD)
annually adjusted
July 201920Onshore wind0.0580
Solar PV0.0576
Small hydro0.1034
Biomass0.1062
Biogas0.1586
Landfill biogas0.1295
ChilePPA (in USD)
US CPI updated
November 201720Onshore wind0.0341
Solar PV0.0336
Geothermal0.0347
PortugalPPAJuly 201915Solar PV0.0227
DenmarkFixed FIPSeptember–November 201920Onshore wind0.0022
Solar PV0.0028
GermanySliding FIPApril 2017–April 201820Offshore wind0.0323
October–November 2019Onshore wind0.0693
Solar PV0.0548
Biomass0.1394
NetherlandsSliding FIPSpring 201915Onshore wind0.0458
Solar PV0.0782
12Biomass0.0391
Canada2-sided CfD
periodically adjusted
December 201820Onshore wind0.0297
Greece2-sided CfDDecember 201920Onshore wind0.0645
Solar PV0.0670 (≤20 MW)
Poland2-sided CfD
CPI updated
201815
Or
until
31–12–35
Onshore wind0.0541 (≥1 MW)
Offshore wind0.1281 (≥1 MW)
Solar PV0.0966 (<1 MW)
Small hydro0.1281 (≥1 MW)
Geothermal0.1281 (≥1 MW)
Biomass0.1103 (≥1 MW)
Agricultural biogas0.1559 (<1 MW)
0.1394 (≥1 MW)
UK2-sided CfD
periodically adjusted
May 201915Offshore wind0.0507 (delivery 2023–24)
0.0532 (delivery 2024–25)
Acronyms in Table 1: CfD: contract for differences, CPI: consumer price index, FIP: feed-in premium, PPA: power purchase agreement, UK: United Kingdom, US: United States, USD: US dollars.
Table 2. Levelised cost of energy (LCOE) input data for the RES technologies of the analysed auctions. Source: self-elaboration based on [30,31].
CountryTechnologyInvestment Cost [USD/kW] O&M Costs Capacity Factor [pu]Lifetime [Years]Discount Rate [pu]
Fixed
[USD/kW]
Variable
[USD/kWh]
ArgentinaOnshore w.1529.3431.720.007660.3380250.100
Solar PV1433.0030.000.000000.182025
Small hydro2215.3923.200.000950.668030
Biomass1501.2199.400.004200.493020
Biogas2074.5699.400.004200.564020
ChileOnshore w.1529.3431.720.007660.3380250.075
Solar PV1210.2030.000.000000.182025
Geothermal3976.34112.160.005060.839025
PortugalSolar PV1210.2030.000.000000.1820250.075
DenmarkOnshore w.1891.2131.720.007660.3940250.075
Solar PV1210.2030.000.000000.182025
GermanyOnshore w.1833.1731.720.007660.2900250.075
Offshore w.4353.4290.000.019700.425025
Solar PV1113.0230.000.000000.182025
Biomass3373.4599.400.004200.820020
NetherlandsOnshore w.1949.5831.720.007660.3090250.075
Solar PV1210.2030.000.000000.182025
Biomass3373.4599.400.004200.820020
CanadaOnshore w.1711.7831.720.007660.3460250.075
GreeceOnshore w.1949.5831.720.007660.3380250.075
Solar PV1210.2030.000.000000.182025
PolandOnshore w.1949.5831.720.007660.3380250.075
Offshore w.4353.4290.000.019700.425025
Solar PV1210.2030.000.000000.182025
Small hydro4802.3723.200.000950.472030
Geothermal3976.34112.160.005060.839025
Biomass3373.4599.400.004200.820020
Agr. Biogas3341.4699.400.004200.839020
UKOffshore w.4353.4290.000.019700.4250250.075
Investment costs taken from [30] include financing costs. Acronyms in Table 2: O&M: operation and maintenance, pu: per unit.
Table 3. Base case assumptions for the determination of the project and equity net present value (NPV) and internal rate of return (IRR) of the German biomass and the Danish onshore wind and solar photovoltaics (PV) auctions listed in Table 1. Source: self-elaboration.
Base Case AssumptionsGermanyDenmark
Investment cost [USD/kW]2888.23 biomass1619.18 onshore wind, 1036.130 solar PV
Loan duration [years]1515
Loan amortisationlinearlinear
Equity [pu]0.30.3
Equity Cost [pu]0.180.18
Loan fraction [pu]0.70.7
Loan interest [pu]0.030.03
Corporate tax [pu]0.29870.2200
WACC before tax [pu]0.0750.075
2019 mean market price [USD/kWh]0.04110.0438
Annual market price variation [pu]00
Financing costs determined according to the base case data in Table 3 have been subtracted from the investment costs values shown in Table 2, so as to not take them into account twice in the cash-flows for the NPV and IRR calculation. The discount rate shown in Table 2 has been equated to the weighted average cost of capital (WACC) before taxes in Table 3. Cash-flows have been discounted using the after tax WACC calculated with the assumptions in Table 3.
Table 4. Project and equity NPV and IRR for the German biomass and the Danish solar PV and onshore wind auctions under the base case assumptions in Table 3. Source: self-elaboration.
CountryTechnologyProject NPV [USD/kW]Equity NPV [USD/kW]Project IRR [%]Equity IRR [%]
GermanyBiomass4301.544871.7423.66%65.01%
DenmarkOnshore wind−547.50−233.152.90%3.55%
Solar PV−586.86−385.70−0.72%−2.70%

