Abstract
There is an increasing demand in integrating energy storage with photovoltaic (PV) systems to provide more smoothed power and enhance the grid-friendliness of solar PV systems. To integrate battery energy storage systems (BESS) to an utility-scale 1500 V PV system, one of the key design considerations is the basic architecture selection between DC- and AC-coupling. Hence, it is necessary to assess the reliability of the power conversion units, which are not only the key system components, but also represent the most reliability-critical parts, in order to ensure an efficient and reliable 1500 V PV-battery system. Thus, this paper investigates the BESS solutions of DC- and AC-coupled configurations for 1500 V PV systems with a comparative reliability analysis. The reliability analysis is carried out through a case study on a 160 kW/1500 V PV-system integrated DC- or AC-coupled BESS for PV power smoothing and ramp-rate regulation. In the analysis, all of the DC-DC and DC-AC power interfacing converters are taken into consideration along with component-, converter-, and system-level reliability evaluation. The results reveal that the reliability of the 1500 V PV inverter can be enhanced with the DC-coupled BESS, while seen from the system-level reliability (i.e., a PV-battery system), both of the DC- and AC-coupled BESSs will affect the overall system reliability, especially for the DC-coupled case. The findings can be added into the design phase of 1500 V PV systems in a way to further lower the cost of energy.
1. Introduction
Solar energy installations have experienced rapid growth in the last decade [1], which brings both environmental and economic benefits. One of the driving forces behind this growth is that the solar industry keeps seeing innovation for both reducing the system cost and increasing the grid-integration performance [2]. The mainstream DC voltage has been increasing from 600 V or 1000 V (low voltage in relevant standards [3,4]) to 1500 V, which is the maximum voltage of the low voltage directive according to the IEC standards in order to reduce the cost of large-scale photovoltaic (PV) systems. By doing so, for a given capacity, the installation cost can be reduced to a large extent (fewer strings, connections, and less cabling) [5]. On the other hand, the high variability of the solar PV energy (due to the weather conditions) raises challenges for integrating these PV systems to the grid. In such a case, energy storage could be integrated to the PV systems for smoothing the output power of PV plants. Recently, this has also become a promising solution toward smart PV systems [6].
For 1500 V PV applications, several studies have shown that single-stage conversion PV systems (without DC-DC stage) outperform two-stage based PV systems with respect to size, efficiency, and cost-effectiveness [7,8,9]. For the same reason, the battery energy storage systems (BESS) for large-scale PV Plants are also based on single-stage conversion [10,11], i.e., one bi-directional DC-DC or DC-AC stage depending on the type of connection: DC-coupling or AC coupling. As illustrated in Figure 1a, in DC-coupling, the output of the BESS is connected to the DC side of the PV inverter, while, in AC-coupling, as shown in Figure 1b, the BESS is added to the PV system at its AC side. Both of the configurations have the potential to improve the grid-integration performance of 1500 V PV systems. Flexible power management is significantly enhanced in such systems.
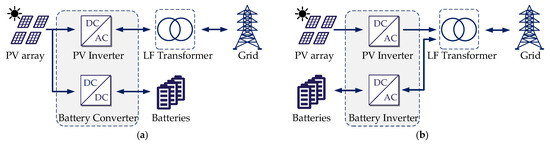
Figure 1.
System diagram of the single-stage 1500 V PV system with integrated battery energy storage systems (LF: low-frequency transformer): (a) DC-coupled configuration and (b) AC-coupled configuration.
Many research efforts have been devoted to address the design and control of PV-battery systems. In [12,13], the common methods for power smoothing and ramp-rate reduction with BESS were compared in terms of power tracking performance and BESS capacity requirement, respectively. In [14], the coordinated control of a single-stage based PV system with a DC-coupled BESS was analyzed along with energy management. The methods to determine the optimal sizing of BESSs were developed in [15], where second-life Li-ion batteries were considered for a cost-effectiveness analysis. The benefits of the DC-coupled BESS for a large-scale PV plant were investigated in [16], which shows a higher efficiency and less energy losses (with oversized PV arrays) when compared to an AC-coupled configuration can be achieved. Moreover, the benefits of the AC coupling over DC coupling were investigated in [17], in terms of reduced integration challenges and increased design flexibility.
However, the prior-art studies did not fully cover the discussions with respect to the lifetime and reliability of the PV-battery systems. As the loading on the converters in the two configurations is different, the reliability performance will also vary, which, in turn, may affect the final design. When considering that, recently, the reliability analysis of the power converters in PV-battery systems has attracted increasing interest, such as those presented in [18,19]. More specifically, a single-phase DC-coupled PV-battery system was considered in [18], where the impact of different self-consumption control strategies on the PV inverter reliability was analyzed. This work was further strengthened in [19] by considering the reliability analysis of the remaining power converters (i.e., PV boost converter and battery converter), in which the system-level reliability was also investigated when considering both DC-coupled and AC-coupled BESS configurations. However, the above investigation was performed for residential PV systems. When it comes to large-scale PV applications, e.g., 1500 V PV-battery systems, different insights in reliability analysis may be offered, which, in turn, can provide further design considerations to enhance the system performance. Nevertheless, such an analysis has not been thoroughly and systematically discussed in the literature. Thus, it is necessary to explore the power converter reliability for large-scale PV-battery systems, following which, a proper design of these power converters can possibly be achieved.
With the above concerns, this paper investigates the BESS of DC- and AC-coupling for 1500 V PV systems with emphasis on the reliability comparison. The analysis is carried out through a case study instead of a new methodology preposition on a 160 kW/1500 V PV system, in which proper BESSs are designed for the DC- and AC-coupled configurations to smooth the PV power and limit the power ramp rate. The rest of this paper is organized, as follows. In Section 2, the system modeling is presented, which includes the mission profiles and basic components for the system under study. In addition, the general control to enable the power smoothing and limit the power ramp rate is briefed. Subsequently, in Section 3, the reliability analysis is presented. First, a component-level reliability performance of all the power devices (i.e., IGBTs and diodes) within the two configurations is evaluated by estimating their lifetime under a real mission profile. Afterwards, the converter- and system-level reliability assessments based on the reliability block diagrams along with the Monte-Carlo simulations are carried out. Through this comparative reliability analysis, the most fragile part within the two systems can be identified; additionally, the overall system reliability can be improved by selecting an adequate BESS connection type, which is shown in Section 4. Following, the reliability benchmarking results are discussed further in Section 5. Finally, concluding remarks are given in Section 6.
2. System Modeling
In this paper, a single-stage 1500 V PV system is considered, as shown in Figure 1, where a BESS is deployed under the DC- or AC-coupled configuration for power smoothing. The reliability analysis that is given in this paper focuses on the power semiconductor devices. The power flow of the system can then be modeled, as shown in Figure 2, where and are mission profile parameters, i.e., the ambient temperature and the solar irradiance, respectively; and respectively denote the power and voltage of the PV arrays; and represent the input and output power of the PV inverters; and are the input power of the battery converter and the battery inverter; , , and represent the grid voltage, the battery voltage for the DC coupling, and the battery voltage for the AC coupling, correspondingly; and, is the junction temperature of the power devices. The overall inputs are the mission profiles of the installation site that represent the system operating conditions [20] and the outputs are the thermal stress profiles of the power semiconductors in PV/battery converters for the next reliability analysis, as it can be observed in Figure 2. A description of each model for this mission profile translation is given in the following sections.
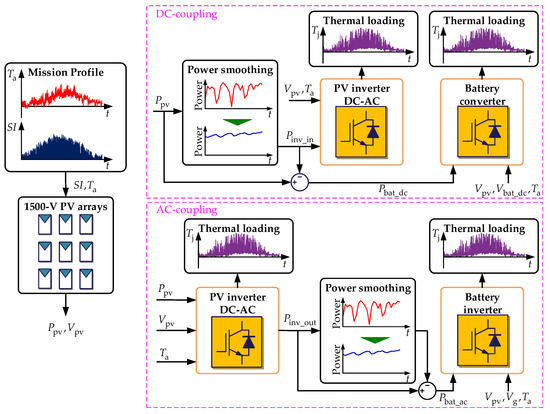
Figure 2.
Schematic of the system modeling for the DC- and AC- coupling 1500 V PV systems.
2.1. Mission Profile
A one-year mission profile that is provided in [21] is used in this paper, which was recorded in the year of 2019 in Denmark with a sampling rate of 1 min./sample. It should be mentioned that the mission profile sampling rate could affect the reliability prediction, as discussed in [22], where a high sampling rate (e.g., 1 s to 1 min. per sample) is recommended to obtain as much information as possible in the mission profile translation process. In contrast, a lower sampling rate (e.g., 5 min. per sample) may give rise to a certain degree of uncertainty in the lifetime results. The mission profile is shown in Figure 3. As it can be observed in Figure 3, the solar irradiance and ambient temperature both vary in a wide range. Moreover, the frequent presence of clouds will inevitably affect the PV output power, where a BESS is highly expected to smooth the power fluctuations and limit the power ramp rate. This is to guarantee the system security and stability.
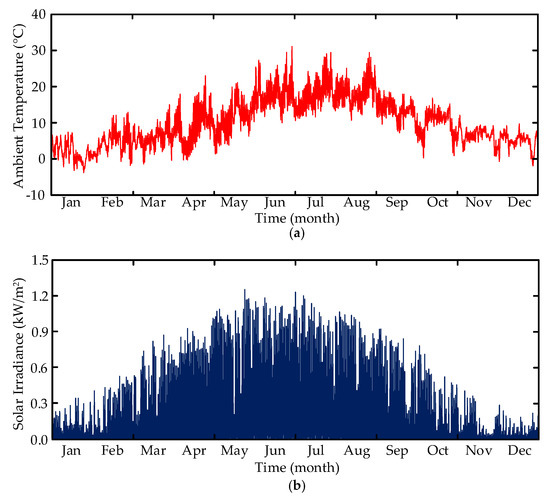
Figure 3.
One-year mission profile: (a) ambient temperature and (b) solar irradiance.
2.2. PV Array and PV Inverter
In this study, it is assumed that the PV-battery system is rated at 160 kW. The JKM380M-72-V solar panel is selected to assemble the 1500 V PV arrays [23]. In this case, 432 solar panels (27 panels per string, 16 strings) are used to achieve the rated power around 160 kW and the maximum open-circuit voltage up to 1500 V. Subsequently, a three-level I-type inverter is employed for interfacing the PV arrays to the AC grid, as shown in Figure 4, where the overall control algorithms are also illustrated. It should be pointed out that when integrating a DC-coupled BESS to this PV system, an appropriate coordinated control of the PV system and the BESS should be considered [14]. The system specifications are given in Table 1. Regarding the power semiconductor devices, three 1200 V/300 A IGBT modules from Semikron are adopted [24] and, correspondingly, their heatsink sizing is designed to guarantee the maximum junction temperature below 125 C during the rated operation with the ambient temperature being 50 C.
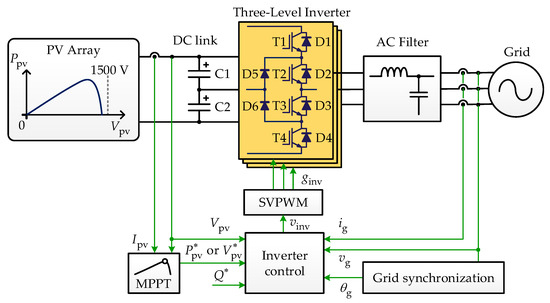
Figure 4.
General configuration and control structure of the 1500 V PV system based on the three-level I-type topology: —PV power, —PV voltage, —PV current, —active power reference, —DC-link voltage reference, —reactive power reference, —grid current, —grid voltage, — phase angle of the grid voltage, —output voltage of the inverter, —gate signals, MPPT—maximum power point tracking, and SVPWM—space vector pulse width modulation.

Table 1.
PV System Specifications.
2.3. Power Smoothing Operation
The target of integrating battery energy storage systems for a PV system is to comply with certain requirements (decided by the transmission system operator) when injecting power into the grid. This paper focuses on the power smoothing and ramp-rate control with the consideration of their impact on the reliability of power semiconductor devices within the PV-battery system. Similar to the previous studies [13,15], in this work, it is assumed that the ramp-rate limit is 10% of the rated power per minute, which is defined by the Puerto Rico Electric Power Authority (PREPA) [25]. Subsequently, the ramp-rate compliant algorithm in [15] is applied to smooth the system output power, size the battery converter/inverter, and obtain the mission profile of the integrated battery system. The power smoothing results for the DC-coupled PV-battery system are shown in Figure 5. The smoothed power is less fluctuating when compared with the PV power before smoothing, as seen in Figure 5a. The difference, as shown in Figure 5b, is the power reference for the BESS. As seen in Figure 5b, in most days, the absorbed/injected power is within 100 kW. Following, Figure 6 presents the ramp rate results of the PV system with and without a 100 kW BESS. As observed in Figure 6, without the BESS, the output power of the PV system can experience even 80% rises or drops in a very short period (e.g., 1 min.), which may affect the overall supply and demand power balance, causing grid stability issues. In contrast, with the 100 kW BESS, the corresponding ramp rate is mainly distributed within the limit (i.e., 10% of the rated power per minute).
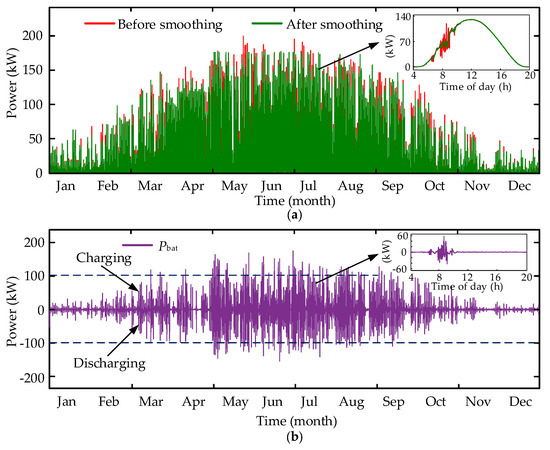
Figure 5.
Power smoothing analysis: (a) input power of the PV inverter with and without power smoothing and (b) power reference for the DC-coupled BESS.
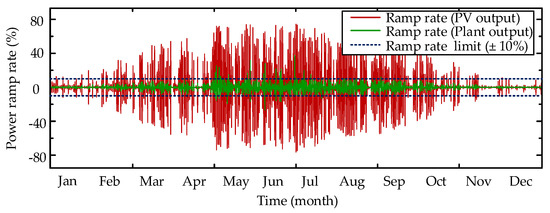
Figure 6.
One-year power ramp-rate analysis: the ramp rate of PV output and the ramp rate of PV-BESS (plant) output when energy storage system is deployed for power smoothing.
2.4. Battery Energy Storage System
The reliability analysis that is given in this paper considers two typical energy storage systems shown in Figure 7. For the DC-coupled configuration, as shown in Figure 7a, a simple half bridge-based DC/DC topology is chosen to build an interleaved converter with three stages, interfacing the batteries to the DC side of the 1500 V PV system. While for the AC-coupled configuration, the same topology as for the PV inverter is employed as the interfacing unit between batteries and the point of common coupling (PCC), as shown in Figure 7b. Table 2 presents the designed ratings of the battery systems. Regarding the power modules, three 1200 V/200 A IGBT modules and three 1700 V/150 A IGBT modules from Semikorn are respectively used for the battery inverter and converter shown in Figure 7 [24]. Moreover, the corresponding heatsink parameter, heatsink-to-ambient thermal impedance per module , is designed to ensure the junction temperature of the most stressed power devices is below 125 C during the rated operation with the ambient temperature being 50 C.
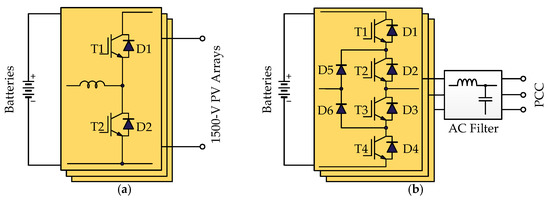
Figure 7.
Battery energy storage system: (a) for the DC-coupled configuration and (b) for the AC-coupled configuration (PCC: the point of common coupling).
Table 2.
BESS Specifications.
For the battery model, the two BESSs that are shown in Figure 7 are equipped with the same type of batteries as a commercial BESS for 1500 V PV applications [26], while the operating voltage of the two BESSs are different. In the case of the DC-coupled configuration, the voltage of the PV system at the maximum power point (MPP) varies between 1000 V and 1300 V under the Denmark mission profile (see Figure 3). The battery voltage range is 670 V to 870 V, which is lower than the minimum MPP voltage to ensure the converter charges the batteries in the buck mode, and in the boost mode, the batteries are discharged. On the other hand, for the AC-coupled configuration, the battery operating voltage is 860 V to 1120 V, ensuring the battery can be discharged when considering a 10% variation of the grid voltage. For the sake of simplicity, it is assumed that the battery voltage is at the upper and lower limit during the charging and discharging mode, respectively. Detailed sizing of the battery storage is out of the scope of this paper and, thus, the capacity of the battery systems is assumed to be sufficient during operation. Table 2 summarizes the battery specifications.
2.5. Mission Profile Translation
With the above operation conditions, the thermal loading of all the power semiconductor devices (i.e., the IGBTs and diodes in the PV-battery systems) during one-year operation is investigated. Based on the input power of the PV and battery converters, the thermal loading of the power devices is determined from the loss and thermal models of the components, and this translation is normally achieved through two-dimensional (2-D) look-up tables to process the long-term simulations. More detailed analysis and steps regarding the mission profile translation have been discussed in [27].
Figure 8 presents the resultant junction temperature of the IGBT T1 (see Figure 4) in the PV inverter integrated with the AC- or DC-coupled BESS. It can be seen in Figure 8 that the DC-coupled BESS can considerably reduce the thermal stress of the IGBT T1 during the power smoothing process. This is also true for the remaining devices (e.g., IGBT T2, diode D1, D2, and D5), which is not presented here, as their temperature profiles are similar to the presented one, and they will be considered in the lifetime and reliability analysis in the following sections. Figure 9 shows the temperature profiles of the power devices within the AC- and DC-coupled BESS converters. The power devices in the battery inverter have a similar temperature profile, as shown in Figure 9a, while they present a significant difference, as shown in Figure 9b, for the battery converter. The variety of these temperature profiles will cause cyclic thermo-mechanical stresses among the different materials inside the power devices, which finally lead to cumulative bond-wire and solder-joint fatigue after a certain number of cycles. The evaluation of the damage will be discussed in the next section. Nevertheless, as seen from the translated thermal loading profiles on the power converters, the coupling configurations will affect the reliability performance of the power converters and, thus, the entire PV-battery system.
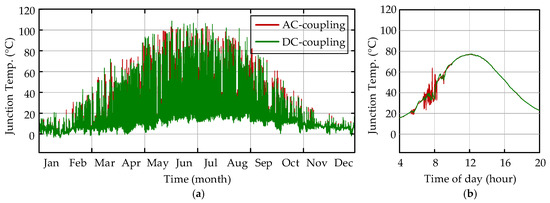
Figure 8.
Junction temperature of the IGBT T1 (see Figure 4) in the PV inverter integrated with the AC- or DC-coupled BESS: (a) one-year operation and (b) one-day operation.
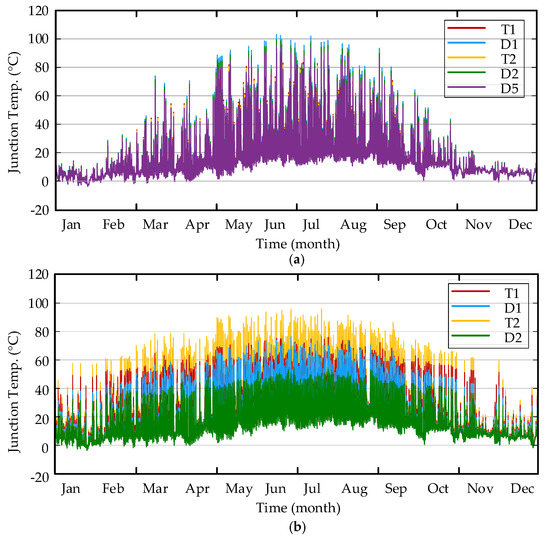
Figure 9.
Junction temperature of the power devices within the battery converters (referring to Figure 7): (a) in the battery inverter and (b) in the battery converter.
3. Component Reliability Analysis
Normally, the power device reliability is expressed in terms of lifetime consumption (), which indicates how much lifetime has been consumed since the beginning of th operation. In this paper, the is obtained according to the Miner’s rule [28], which is expressed as
where is the number of cycles under certain stress conditions and is the corresponding number of cycles to failure with the same stress conditions that is dependent on the lifetime model. Notably, the calculation according to (1) assumes that various stress cycle events are independent, and the caused damage can be linearly accumulated. The device is considered to reach its end of life when the exceeds one (or 100%).
In this paper, the number of cycles to failure is evaluated based on the Bayerer model [29]. This model is an empirical model describing in relation to certain stress conditions (i.e., the minimum junction temperature and cycle amplitude ), which is expressed as
in which the impact of the heating time , current per wire bond I, blocking voltage V, and bond wire diameter D are also considered according to individual power laws. The model parameters and coefficients are summarized in Table 3. More discussions on this lifetime model are provided in [29].
Table 3.
Parameters and coefficient of the Bayerer Model [29].
Additionally, the number of cycles in (1) is not directly available, since the temperature profiles obtained in the previous section, as shown in Figure 8; Figure 9, are irregular. In order to obtain the number of cycles at a certain stress condition (i.e., the cycle amplitude, mean junction temperature, and cycle period ), a rainflow counting analysis [30] is performed, categorizing the irregular thermal cycles into several regular cycles. Subsequently, the number of cycles can be obtained.
Applying the above calculation, the one-year of all the IGBTs and diodes in the PV-battery systems can be obtained. Figure 10 summarizes the results. For the PV inverters, as expected, the DC-coupled configuration alleviates the loading on the PV inverter. It can be seen in Figure 10a,b that the IGBTs and diodes in the PV inverter with the DC-coupled BESS have much lower than the corresponding ones in the PV inverter with the AC-coupled BESS. Additionally, in both cases, the clamping diodes (e.g., D5 referring to Figure 4) are the most stressed devices (i.e., with the highest ). This can be considered when designing the power converters, e.g., to select a high reliability diode. Regarding the power converters for the batteries, as can be seen in Figure 10c,d, several power devices in both converters have higher when compared with the devices in the PV inverters. For both the DC- and AC-coupled configurations, it can be expected that the converter-level reliability of the battery converters will be lower than that of the PV inverters. Although the battery inverter consumes less life under the mission profile, it has more power components, when compared to the battery converter. The overall lifetime may be different.
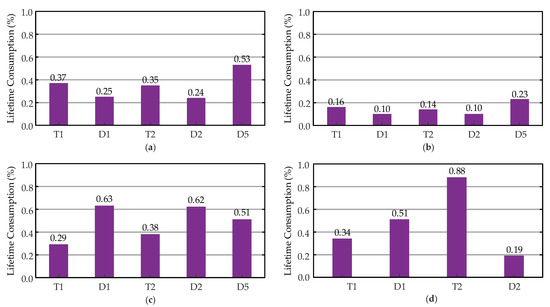
Figure 10.
One-year results of the power devices in different power converters: (a) PV inverter in the AC-coupled configuration, (b) PV inverter in the DC-coupled configuration, (c) battery inverter in the AC-coupled configuration, and (d) battery converter in the DC-coupled configuration.
So far, the component reliability of all the power interfacing converters within the DC- and AC-coupled PV-battery systems has been analyzed, with which the most fragile component can be identified. Furthermore, the corresponding results provide the basis for the next converter- and system-level reliability analysis.
4. System-Level Reliability Benchmarking
With the static damage obtained in the previous section, the lifetime of the power devices can be obtained as certain fixed values. This is far from reality, since the power device lifetime could present variations due to the uncertainties in device parameters and experienced stresses. Therefore, the lifetime prediction should consider these uncertainties and, thus, provide statistical lifetime values. In this section, a statistical approach that is based on the Monte-Carlo analysis is applied [31], in which the variations of the model parameters in (2) and the thermal stresses are introduced with 5% variations to represent the uncertainties. Notably, to assist the analysis, the dynamic stress parameters (i.e., , , and ) are normally converted into equivalent static ones (i.e., , , and ), which can produce the same one-year when applying them to the calculation process [32]. By doing so, the system-level reliability can be predicted.
The Monte-Carlo simulations are conducted when considering a population of 10,000 samples, following which the obtained lifetime data for a certain device are fitted with the Weibull distribution as [33]
where and , respectively, represent the probability density function (PDF) of the Weibull distribution and the cumulative density function (CDF, also referred to as the unreliability function) with x, , and being the operation time, the scale parameter, and the shape parameter, respectively.
Subsequently, the reliability assessment of the PV-battery system follows the steps from the component level, the converter level, to the system level, and the corresponding lifetime values are obtained in terms of lifetime, which represents the total operation time when 10% of the populations will fail. For the component-level reliability analysis, the lifetime of each power device can be obtained from the corresponding curve. While investigating the converter-level and system-level reliability, it can be performed by using the Reliability Block Diagram (RBD), which describes the reliability interaction between each device and subsystem in the entire system. Figure 11a shows the RBD of the considered PV-battery systems. For the converter-level RBD, if any of the IGBTs or diodes fails, it is considered that the converter cannot function. Thus, the series-connected RBD is considered for these power converters, as shown in Figure 11a. Subsequently, the unreliability function for the converters can be calculated as
in which represents the unreliability function of the device in the converters. Regarding the system-level RBD, as shown in Figure 11b, the series connection of the converter-level RBDs is considered for both the DC- and AC-coupled system configuration. Thus, the system unreliability is calculated as
where and represent the unreliability functions of the PV converter and the battery converter, respectively.
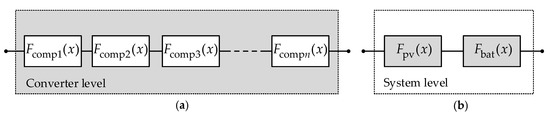
Figure 11.
Series connection of the reliability block diagram: (a) converter level and (b) system level, where represents the unreliability function of the device in the converter, and and represent the unreliability functions of the PV and battery converters, respectively.
The converter-level unreliability functions of the power converters within the two considered PV-battery systems are shown in Figure 12, along with the corresponding component-level functions of their power devices. The lifetime results are in accordance with the comparison in the previous section. For the PV inverters, as shown in Figure 12a,b, the reliability of the two inverters is dominated by the reliability of the clamping diodes (e.g., D5 referring to Figure 4) and, consequently, the lifetime of the PV inverter with the DC-coupled BESS is 101.6 years, which is even higher than the twice of the lifetime of the PV inverter with the AC-coupled BESS. Notably, the results also imply that the two inverters have excessive design margins for the considered Denmark mission profile. Regarding the BESS converters, for the battery inverter, as shown in Figure 12c, instead of the clamping diodes, the outer diodes (e.g., D1 referring to Figure 7b) will have the lowest lifetime due to its bidirectional operation, and the inverter lifetime is 77.1 years. As observed in Figure 12d, the reliability of the battery converter for the DC-coupled BESS is mainly affected by the lower IGBTs (e.g., T2 referring to Figure 7a) and its lifetime is 68.8 years. Notably, both the battery inverter and the battery converter are less reliable than the corresponding PV inverters, which will seriously affect the overall reliability of the PV-battery systems.
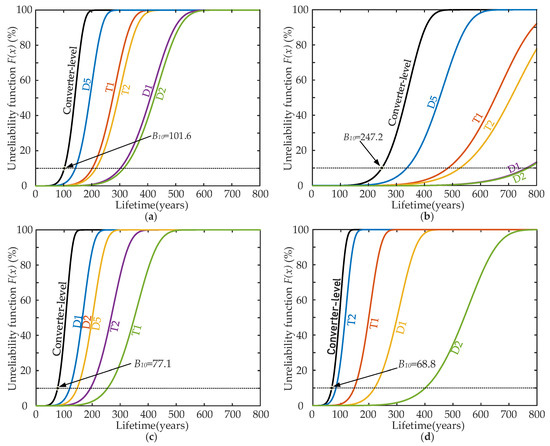
Figure 12.
Unreliability functions of the different power converters: (a) PV inverter with the AC-coupled BESS, (b) PV inverter with the DC-coupled BESS, (c) battery inverter for the AC-coupled BESS, and (d) battery converter for the DC-coupled BESS.
Figure 13 (the solid lines) shows the system-level unreliability functions of the considered PV-battery systems, where the corresponding converter-level unreliability functions are also given (the dashed lines). The lifetime of the DC-coupled configuration is 68.8 years, which is six years shorter than that of the AC-coupled configuration. As expected, both the reliability of the DC-and AC-coupled configuration are dominated by the reliability of their battery converters, especially for the DC-coupled case. This is expected, as the battery is used to balance and smooth the fluctuating power from the PV array. Although the integrated DC-coupled BESS can enhance the reliability of the PV inverter to a large extent, the much less reliable battery converter will limit the overall reliability performance. Hence, for the case study in this paper, the AC-coupled configuration is a better option, featuring a more balanced and higher reliability performance. It should be mentioned that the redundancy of the interleaved battery converter is not considered in the above comparison for comparing the two configurations under the full power smoothing capability. Obviously, it is expected that the reliability of the DC-coupled configuration can be improved with a proper redundancy design of the battery converter. For instance, adding one more paralleled bidirectional converter stage to the battery converter (see Figure 7a), which can achieve a three-out-of-four redundancy [34]. By doing so, the reliability of the battery converter will be improved considerably, as shown in Figure 13b, achieving higher system-level reliability than the AC-coupled configuration in Figure 13a, while its hardware cost might probably still less than the three-level battery inverter for the AC-coupled configuration.
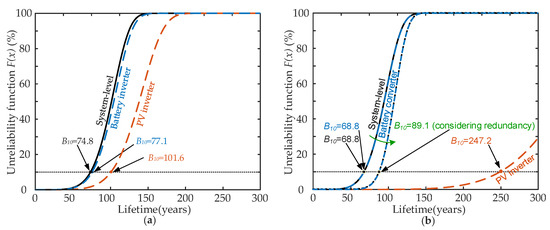
Figure 13.
Unreliability function of the DC- and AC-coupled PV-battery system: (a) AC-coupled configuration and (b) DC-coupled configuration.
5. Discussion
The presented comparative reliability analysis has provided information on the differences of the two configurations for 1500 V PV systems in terms of reliability. This section discusses the possible reliability-affecting factors, as well as some opportunities that could be further explored for improving their reliability performance in practice.
From the case study, it is concluded that, as compared with the AC-coupled configuration, the DC-coupled configuration has a shorter lifetime period and lower reliability. This is in agreement with the hypothesis in Section 1, but this comparison result is different from the conclusion in [19]. A comparative reliability evaluation has been performed for residential PV-battery systems in [19], where it was shown that the DC-coupled configuration was more reliable. The main reason behind this difference is the increased DC voltage of the 1500 V PV system, which has a considerable impact on the lifetime and reliability of the battery converter for DC-coupling, as observed in the above analysis. In such a case, instead of using the bidirectional converter that is based on 1700-V half-bridge power modules, a three-level bidirectional converter might be a better option [35], which can be applied to this case with the series connection of two 1200-V half-bridge power modules. In all, it is indicated that the reliability performance is dependent on applications.
On the other hand, the reliability improvements could also be achieved through power devices advancements. For instance, the Silicon Carbide (SiC) devices offer superior features, like low switching losses, fast switching speed, high voltage blocking capability, and high allowable operating temperatures [36]. These features are very suitable for the power converters in both configurations. At the same time, when compared with the IGBT modules, the SiC modules with improved packaging technologies follow different failure mechanisms or modes. New lifetime models are needed to properly analyze their reliability [37].
It should be noted that the passive components (e.g., the DC-link capacitors) and gate drivers can also affect the lifetime and reliability of these power converters, which will be the future work.
6. Conclusions
In this paper, the battery energy storage for 1500 V PV systems was investigated with a comparative reliability analysis of two configurations, i.e., DC-coupling and AC-coupling. The presented analysis can be used to assess how different configurations affect the reliability of the power interfacing units and, thus, justify the selection of configurations for the 1500 V PV-battery systems. With the component-, converter-, and system-level reliability analysis, the most fragile part in each level can be identified, which will contribute to the design-for-reliability of the PV-battery systems with a predictable reliability performance. The presented case study has shown that the AC-coupled configuration has slightly better reliability performance, whereas the DC-coupled configuration can become more reliable with a proper redundancy design. In all, the exploration in this paper has demonstrated that it is of importance to design for reliability at the system level. Moreover, this can be further extended to examine the overall system cost of 1500 V PV systems during the life-cycle and, then, it will be beneficial to the reduction of the cost of PV energy through design.
Author Contributions
Conceptualization, J.H. and Y.Y.; methodology, software, validation, formal analysis, investigation, resources, data curation, writing—original draft preparation, visualization, J.H.; writing—review and editing, supervision, project administration, funding acquisition, Y.Y. and D.V. All authors have read and agreed to the published version of the manuscript.
Funding
This research was funded by the Novo Nordisk Fonden through the Interdisciplinary Synergy Programme (Award Ref. No.: NNF18OC0034952).
Conflicts of Interest
The authors declare no conflict of interest.
References
- Rechargenews. ‘Exponential’ Global Solar Growth to Continue with 142GW Added in 2020. Available online: https://www.rechargenews.com/solar/exponential-global-solar-growth-to-continue-with-142gw-added-in-2020/2-1-733672 (accessed on 20 May 2020).
- Kouro, S.; Leon, J.I.; Vinnikov, D.; Franquelo, L.G. Grid-Connected Photovoltaic Systems: An Overview of Recent Research and Emerging PV Converter Technology. IEEE Ind. Electron. Mag. 2014, 9, 47–61. [Google Scholar] [CrossRef]
- International Electrical Testing Association (NETA). ANSI/NETA ECS-2020: Standard for Electrical Commissioning Specifications for Electrical Power Equipment and Systems. Available online: https://www.netaworld.org/standards/ansi-neta-ecs (accessed on 10 June 2020).
- Electrical Installation Wiki. Electrical Regulations and Standards. Available online: https://www.electrical-installation.org/enwiki/Electrical_regulations_and_standards (accessed on 10 June 2020).
- Inzunza, R.; Okuyama, R.; Tanaka, T.; Kinoshita, M. Development of a 1500VDC photovoltaic inverter for utility-scale PV power plants. In Proceedings of the IEEE 2nd International Future Energy Electronics Conference (IFEEC), Taipei, Taiwan, 1–4 November 2015; pp. 1–4. [Google Scholar]
- Mansiri, K.; Sukchai, S.; Sirisamphanwong, C. Fuzzy Control for Smart PV-Battery System Management to Stabilize Grid Voltage of 22 kV Distribution System in Thailand. Energies 2019, 11, 1730. [Google Scholar] [CrossRef]
- Serban, E.; Ordonez, M.; Pondiche, C. DC-bus voltage range extension in 1500 V photovoltaic inverters. IEEE J. Emerg. Sel. Top. Power Electron. 2015, 3, 901–917. [Google Scholar] [CrossRef]
- Stevanovi’c, B.; Serrano, D.; Vasi’c, M.; Alou, P.; Oliver, J.A.; Cobos, J.A. Highly efficient, full ZVS, hybrid, multilevel DC/DC topology for two-stage grid-connected 1500-V PV system with employed 900-V SiC devices. IEEE J. Emerg. Sel. Top. Power Electron. 2019, 7, 811–832. [Google Scholar] [CrossRef]
- Yang, Y.; Kim, A.K.; Blaabjerg, F.; Sangwongwanich, A. Advances in Grid-Connected Photovoltaic Power Conversion Systems; Woodhead Publishing: Cambridge, UK, 2019; pp. 37–38. [Google Scholar]
- Ingeteam. Battery Inverter up to 1.64 MVA with 1500 V Technology. Available online: https://www.ingeteam.com/en-us/sectors/photovoltaic-energy/p15_24_288_45/storage-b-series-1500v-1640kva.aspx (accessed on 20 May 2020).
- SMA. SMA Energy Systems for Large-Scale Operations. Available online: https://files.sma.de/dl/2485/ENERGYSYSTEMLARGE-KDE1917.pdf (accessed on 20 May 2020).
- Atif, A.; Khalid, M. Saviztky—Golay Filtering for Solar Power Smoothing and Ramp Rate Reduction Based on Controlled Battery Energy Storage. IEEE Access 2020, 8, 33806–33817. [Google Scholar] [CrossRef]
- Martins, J.; Spataru, S.; Sera, D.; Stroe, D.-I.; Lashab, A. Comparative Study of Ramp-Rate Control Algorithms for PV with Energy Storage Systems. Energies 2019, 12, 1342. [Google Scholar] [CrossRef]
- Myneni, H.; Kumar, G.S. Energy Management and Control of Single-Stage Grid Connected Solar PV and BES System. IEEE Trans. Sustain. Energy 2019. [Google Scholar] [CrossRef]
- Saez-de-Ibarra, A.; Martinez-Laserna, E.; Stroe, D.; Swierczynski, M.; Rodriguez, P. Sizing Study of Second Life Li-ion Batteries for Enhancing Renewable Energy Grid Integration. IEEE Trans. Ind. Appl. 2016, 52, 4999–5008. [Google Scholar] [CrossRef]
- Akeyo, O.M.; Rallabandi, V.; Jewell, N.; Ionel, D.M. The Design and Analysis of Large Solar PV Farm Configurations With DC-Connected Battery Systems. IEEE Trans. Ind. Appl. 2020, 56, 2903–2912. [Google Scholar] [CrossRef]
- Eaton. White Paper WP083023EN: AC vs. DC Coupling in Utility-Scale Solar Plus Storage Projects. April 2016. Available online: https://www.eaton.com/ecm/idcplg?IdcService=GET_FILE&allowInterrupt=1&RevisionSelectionMethod=LatestReleased&Rendition=Primary&dDocName=WP083023EN (accessed on 20 May 2020).
- Sangwongwanich, A.; Angenendt, G.; Zurmuhlen, S.; Yang, Y.; Sera, D.; Sauer, D.U.; Blaabjerg, F. Enhancing PV inverter reliability with battery system control strategy. CPSS Trans. Power Electron. Appl. 2018, 3, 93–101. [Google Scholar] [CrossRef]
- Sandelic, M.; Sangwongwanich, A.; Blaabjerg, F. Reliability Evaluation of PV Systems with Integrated Battery Energy Storage Systems: DC-Coupled and AC-Coupled Configurations. Electronics 2019, 8, 1059. [Google Scholar] [CrossRef]
- Sangwongwanich, A.; Yang, Y.; Sera, D.; Blaabjerg, F. Mission Profile-Oriented Control for Reliability and Lifetime of Photovoltaic Inverters. IEEE Trans. Ind. Appl. 2020, 56, 601–610. [Google Scholar] [CrossRef]
- Technical University of Denmark. DTU Climate Station Data. Available online: http://climatestationdata.byg.dtu.dk/ (accessed on 20 May 2020).
- Vernica, I.; Wang, H.; Blaabjerg, F. Impact of Long-Term Mission Profile Sampling Rate on the Reliability Evaluation of Power Electronics in Photovoltaic Applications. In Proceedings of the 2018 IEEE Energy Conversion Congress and Exposition (ECCE), Portland, OR, USA, 23–27 September 2018; pp. 4078–4085. [Google Scholar]
- Jinko. JKM380M-72-V. 2020. Available online: https://www.http://www.jinkosolar.com/ (accessed on 20 May 2020).
- Semikron, Nuremberg, Germany. IGBT Modules. Available online: https://www.semikron.com/products/product-classes/igbt-modules.html (accessed on 20 May 2020).
- Gevorgian, V.; Booth, S. Review of PREPA Technical Requirements for Interconnecting Wind and Solar Generation; National Renewable Energy Lab. (NREL): Golden, CO, USA, 2013.
- Sungrow. Energy Storage: ST1370KWH-1000. Available online: https://www.sungrowpower.com/en/products/storage-system/turnkey-solution/st1370kwh-1000 (accessed on 20 May 2020).
- Yang, Y.; Wang, H.; Blaabjerg, F.; Ma, K. Mission profile based multi-disciplinary analysis of power modules in single-phase transformerless photovoltaic inverters. In Proceedings of the 15th European Conference on Power Electronics and Applications (EPE), Lille, France, 2–6 September 2013; pp. 1–10. [Google Scholar]
- Miner, M. Cumulative Damage in Fatigue. J. Appl. Mech. 1945, 12, 159–164. [Google Scholar]
- Bayerer, R.; Herrmann, T.; Licht, T.; Lutz, J.; Feller, M. Model for Power Cycling lifetime of IGBT Modules—Various Factors Influencing Lifetime. In Proceedings of the 5th International Conference on Integrated Power Electronics Systems, Nuremberg, Germany, 11–13 March 2008; pp. 1–6. [Google Scholar]
- Huang, H.; Mawby, P.A. A lifetime estimation technique for voltage source inverters. IEEE Trans. Power Electron. 2013, 28, 4113–4119. [Google Scholar] [CrossRef]
- Yang, Y.; Sangwongwanich, A.; Blaabjerg, F. Design for reliability of power electronics for grid-connected photovoltaic systems. CPSS Trans. Power Electron. Appl. 2016, 1, 92–103. [Google Scholar] [CrossRef]
- Reigosa, P.D.; Wang, H.; Yang, Y.; Blaabjerg, F. Prediction of Bond Wire Fatigue of IGBTs in a PV Inverter Under a Long-Term Operation. IEEE Trans. Power Electron. 2016, 31, 7171–7182. [Google Scholar]
- ZVEI. How to Measure Lifetime for Robustnesss Validation—Step by Step. Berlin, Germany rev. 1.9. , 2012. Available online: https://www.zvei.org/en/press-media/publications/how-to-measure-lifetime-for-robustness-validation-step-by-step/ (accessed on 20 May 2020).
- Zhang, Y.; Wang, H.; Wang, Z.; Blaabjerg, F.; Saeedifard, M. Mission Profile-Based System-Level Reliability Prediction Method for Modular Multilevel Converters. IEEE Trans. Power Electron. 2020, 35, 6916–6930. [Google Scholar] [CrossRef]
- Jin, K.; Yang, M.; Ruan, X.; Xu, M. Three-Level Bidirectional Converter for Fuel-Cell/Battery Hybrid Power System. IEEE Trans. Ind. Electron. 2010, 57, 1976–1986. [Google Scholar] [CrossRef]
- Zhang, L.; Yuan, X.; Wu, X.; Shi, C.; Zhang, J.; Zhang, Y. Performance Evaluation of High-Power SiC MOSFET Modules in Comparison to Si IGBT Modules. IEEE Trans. Power Electron. 2019, 34, 1181–1196. [Google Scholar] [CrossRef]
- Ni, Z.; Lyu, X.; Yadav, O.P.; Singh, B.N.; Zheng, S.; Cao, D. Overview of Real-Time Lifetime Prediction and Extension for SiC Power Converters. IEEE Trans. Power Electron. 2020, 35, 7765–7794. [Google Scholar] [CrossRef]


© 2020 by the authors. Licensee MDPI, Basel, Switzerland. This article is an open access article distributed under the terms and conditions of the Creative Commons Attribution (CC BY) license (http://creativecommons.org/licenses/by/4.0/).