An Evaluation of Energy Storage Cost and Performance Characteristics

 ,
, 
Abstract
:1. Introduction
- To define and compare cost and performance parameters of six battery energy storage systems (BESS), four non-BESS storage technologies, and combustion turbines (CTs) from sources including current literature, vendor and stakeholder information, and installed project costs.
- To forecast those cost and performance parameters out to the year 2025.
- To annualize the values derived so that the cost of each technology may be fairly compared given their varying life cycles.
- Lithium-ion batteries,
- Lead-acid batteries,
- Redox flow batteries,
- Sodium-sulfur batteries,
- Sodium-metal halide batteries,
- Zinc-hybrid cathode batteries,
- Pumped storage hydropower (PSH),
- Flywheels,
- Compressed air energy storage (CAES), and
- Ultracapacitors.
2. Technology Cost and Performance Metrics
2.1. Capital Cost
2.2. Power Conversion System
2.3. Balance of Plant
2.4. Construction and Commissioning
2.5. Fixed Operations and Maintenance
2.6. Variable Operations and Maintenance
2.7. Round-Trip Efficiency
- Loss of Ah capacity. While Ah loss can be high over the course of the battery life, it is negligible for each cycle. In flow batteries, cross-over-related losses accumulate over several cycles but are negligible for each cycle.
- Internal resistance-related losses reduce discharge voltage while increasing charge voltage.
- Auxiliary loads such as heating, ventilation, and air-conditioning (HVAC), BMS, PCS controls, and pumps (for flow batteries).
2.8. Response Time
2.9. Cycle Life
2.10. Calendar Life
2.11. Manufacturing Readiness Level
2.12. Technology Readiness Level
3. Assumptions
- For each technology, unit energy and power costs were obtained from literature and/or vendors. Battery costs were available from vendors, supplemented by literature, in terms of $/kWh, while ultracapacitor costs provided by vendors were in both $/kW and $/kWh. Flywheel, PSH, and CAES costs were provided by vendors, supplemented by literature. Appropriate sources are noted within each technology subsection for values collected.
- The power and energy capacities for each technology used in this report are given in Table 4 along with the energy-to-power (E/P) ratios we used for each when comparing costs between technologies.
- Outliers were removed from cost ranges provided by the literature and the remaining reported values were adjusted for inflation. From the adjusted range, a single value estimate was established. When establishing a single point estimate for each technology, additional weight was given to values reported for systems with E/P ratios closer to the baseline values used in this report.
- Adjustments to 2018 US dollars (USD) were made using consumer price index data from the US Bureau of Labor Statistics for the Producer Price Index-Industry Data for Electric Power Generation, Transmission, and Distribution Sector [33].
3.1. Forecast Methodology
3.2. Degradation-Related RTE Reduction Methodology
- = average discharge voltage,
- = Ah capacity during discharge,
- = average charge voltage, and
- = charge capacity
4. Results Summary
5. Technology-Specific Findings
5.1. Combustion Turbines
5.1.1. Capital Cost
5.1.2. Fixed and Variable O&M Costs and Performance Metrics
5.1.3. Technology and Manufacturing Readiness Levels
5.2. Lithium-Ion Batteries
5.2.1. Capital Cost
5.2.2. Fixed and Variable O&M Costs and Performance Metrics
5.2.3. Cycles, Lifespan, and Efficiency
5.2.4. Technology and Manufacturing Readiness Levels
5.3. Lead-Acid Batteries
5.3.1. Capital Cost
5.3.2. Fixed and Variable O&M Costs and Performance Metrics
5.3.3. Cycles, Lifespan, and Efficiency
5.3.4. Technology and Manufacturing Readiness Levels
5.4. Redox Flow Batteries
5.4.1. Capital Cost
5.4.2. Fixed and Variable O&M Costs and Performance Metrics
5.4.3. Cycles, Lifespan, and Efficiency
5.4.4. Technology and Manufacturing Readiness Levels
5.5. Sodium-Sulfur Batteries
5.5.1. Capital Cost
5.5.2. Fixed and Variable O&M Costs and Performance Metrics
5.5.3. Cycles, Lifespan, and Efficiency
5.5.4. Technology and Manufacturing Readiness Levels
5.6. Sodium-Metal Halide Batteries
5.6.1. Capital Cost
5.6.2. Fixed and Variable O&M Costs
5.6.3. Cycles, Lifespan, and Efficiency
5.6.4. Technology and Manufacturing Readiness Levels
5.7. Zinc-Hybrid Cathode Batteries
5.7.1. Capital Cost
5.7.2. Fixed and Variable O&M Costs and Performance Metrics
5.7.3. Cycles, Lifespan, and Efficiency
5.7.4. Technology and Manufacturing Readiness Levels
5.8. Pumped Storage Hydropower
5.8.1. Capital Cost
5.8.2. Fixed and Variable O&M Costs and Performance Metrics
5.8.3. Cycles, Lifespan, Response Time, and Efficiency
5.8.4. Technology and Manufacturing Readiness Levels
5.9. Flywheels
5.9.1. Capital Cost
5.9.2. Fixed and Variable O&M Costs and Performance Metrics
5.9.3. Cycles, Lifespan, and Efficiency
5.9.4. Technology and Manufacturing Readiness Levels
5.10. Compressed Air Energy Storage
5.10.1. Capital Cost
- A 110 MW CAES train,
- Two W501F gas turbines,
- Two V84.2 gas turbines,
- A T300 plant-wide control system,
- Fuel gas booster compressors,
- An RG3 brushless excitation system,
- A D3000 vibration monitoring package for all units, and
- A D4 static excitation systems and start-up frequency converters for V84.2s
5.10.2. Fixed and Variable O&M Costs
5.10.3. Cycles, Lifespan, and Efficiency
- 10 min from cold start to full generation
- 5 min from online to full power
- 3.33 min from full speed no load to full load
- 4 min from offline to full load.
5.10.4. Technology and Manufacturing Readiness Levels
5.11. Ultracapacitors
5.11.1. Capital Cost
5.11.2. Fixed and Variable O&M Costs and Performance Metrics
5.11.3. Cycles, Lifespan, and Efficiency
5.11.4. Technology and Manufacturing Readiness Levels
6. Annualized Costs of Technologies
6.1. Approach
6.2. Findings and Comparative Analysis
7. Conclusions
- For a 4-h BESS, lithium-ion batteries offer the best option today in terms of cost, performance, calendar and cycle life, and technology maturity.
- Redox flow batteries, which have several installations, appear to be well positioned, coming in second in terms of overall cost, performance, life, TRL, and MRL. While their RTE is low, there is room for improvement with stack optimization and better flow battery management algorithms.
- For longer-term storage, PSH and CAES give the lowest cost in $/kWh if an E/P ratio of 16 is used at $165/kWh and $104/kWh, respectively, inclusive of BOP and C&C costs.
- In the year 2025, next to the zinc-hybrid cathode system, lithium-ion is still the most cost-effective battery technology.
- On a 16-h basis, PSH and CAES are more cost-effective compared to battery storage technologies in year 2025, while on a 4-h basis batteries are competitive.
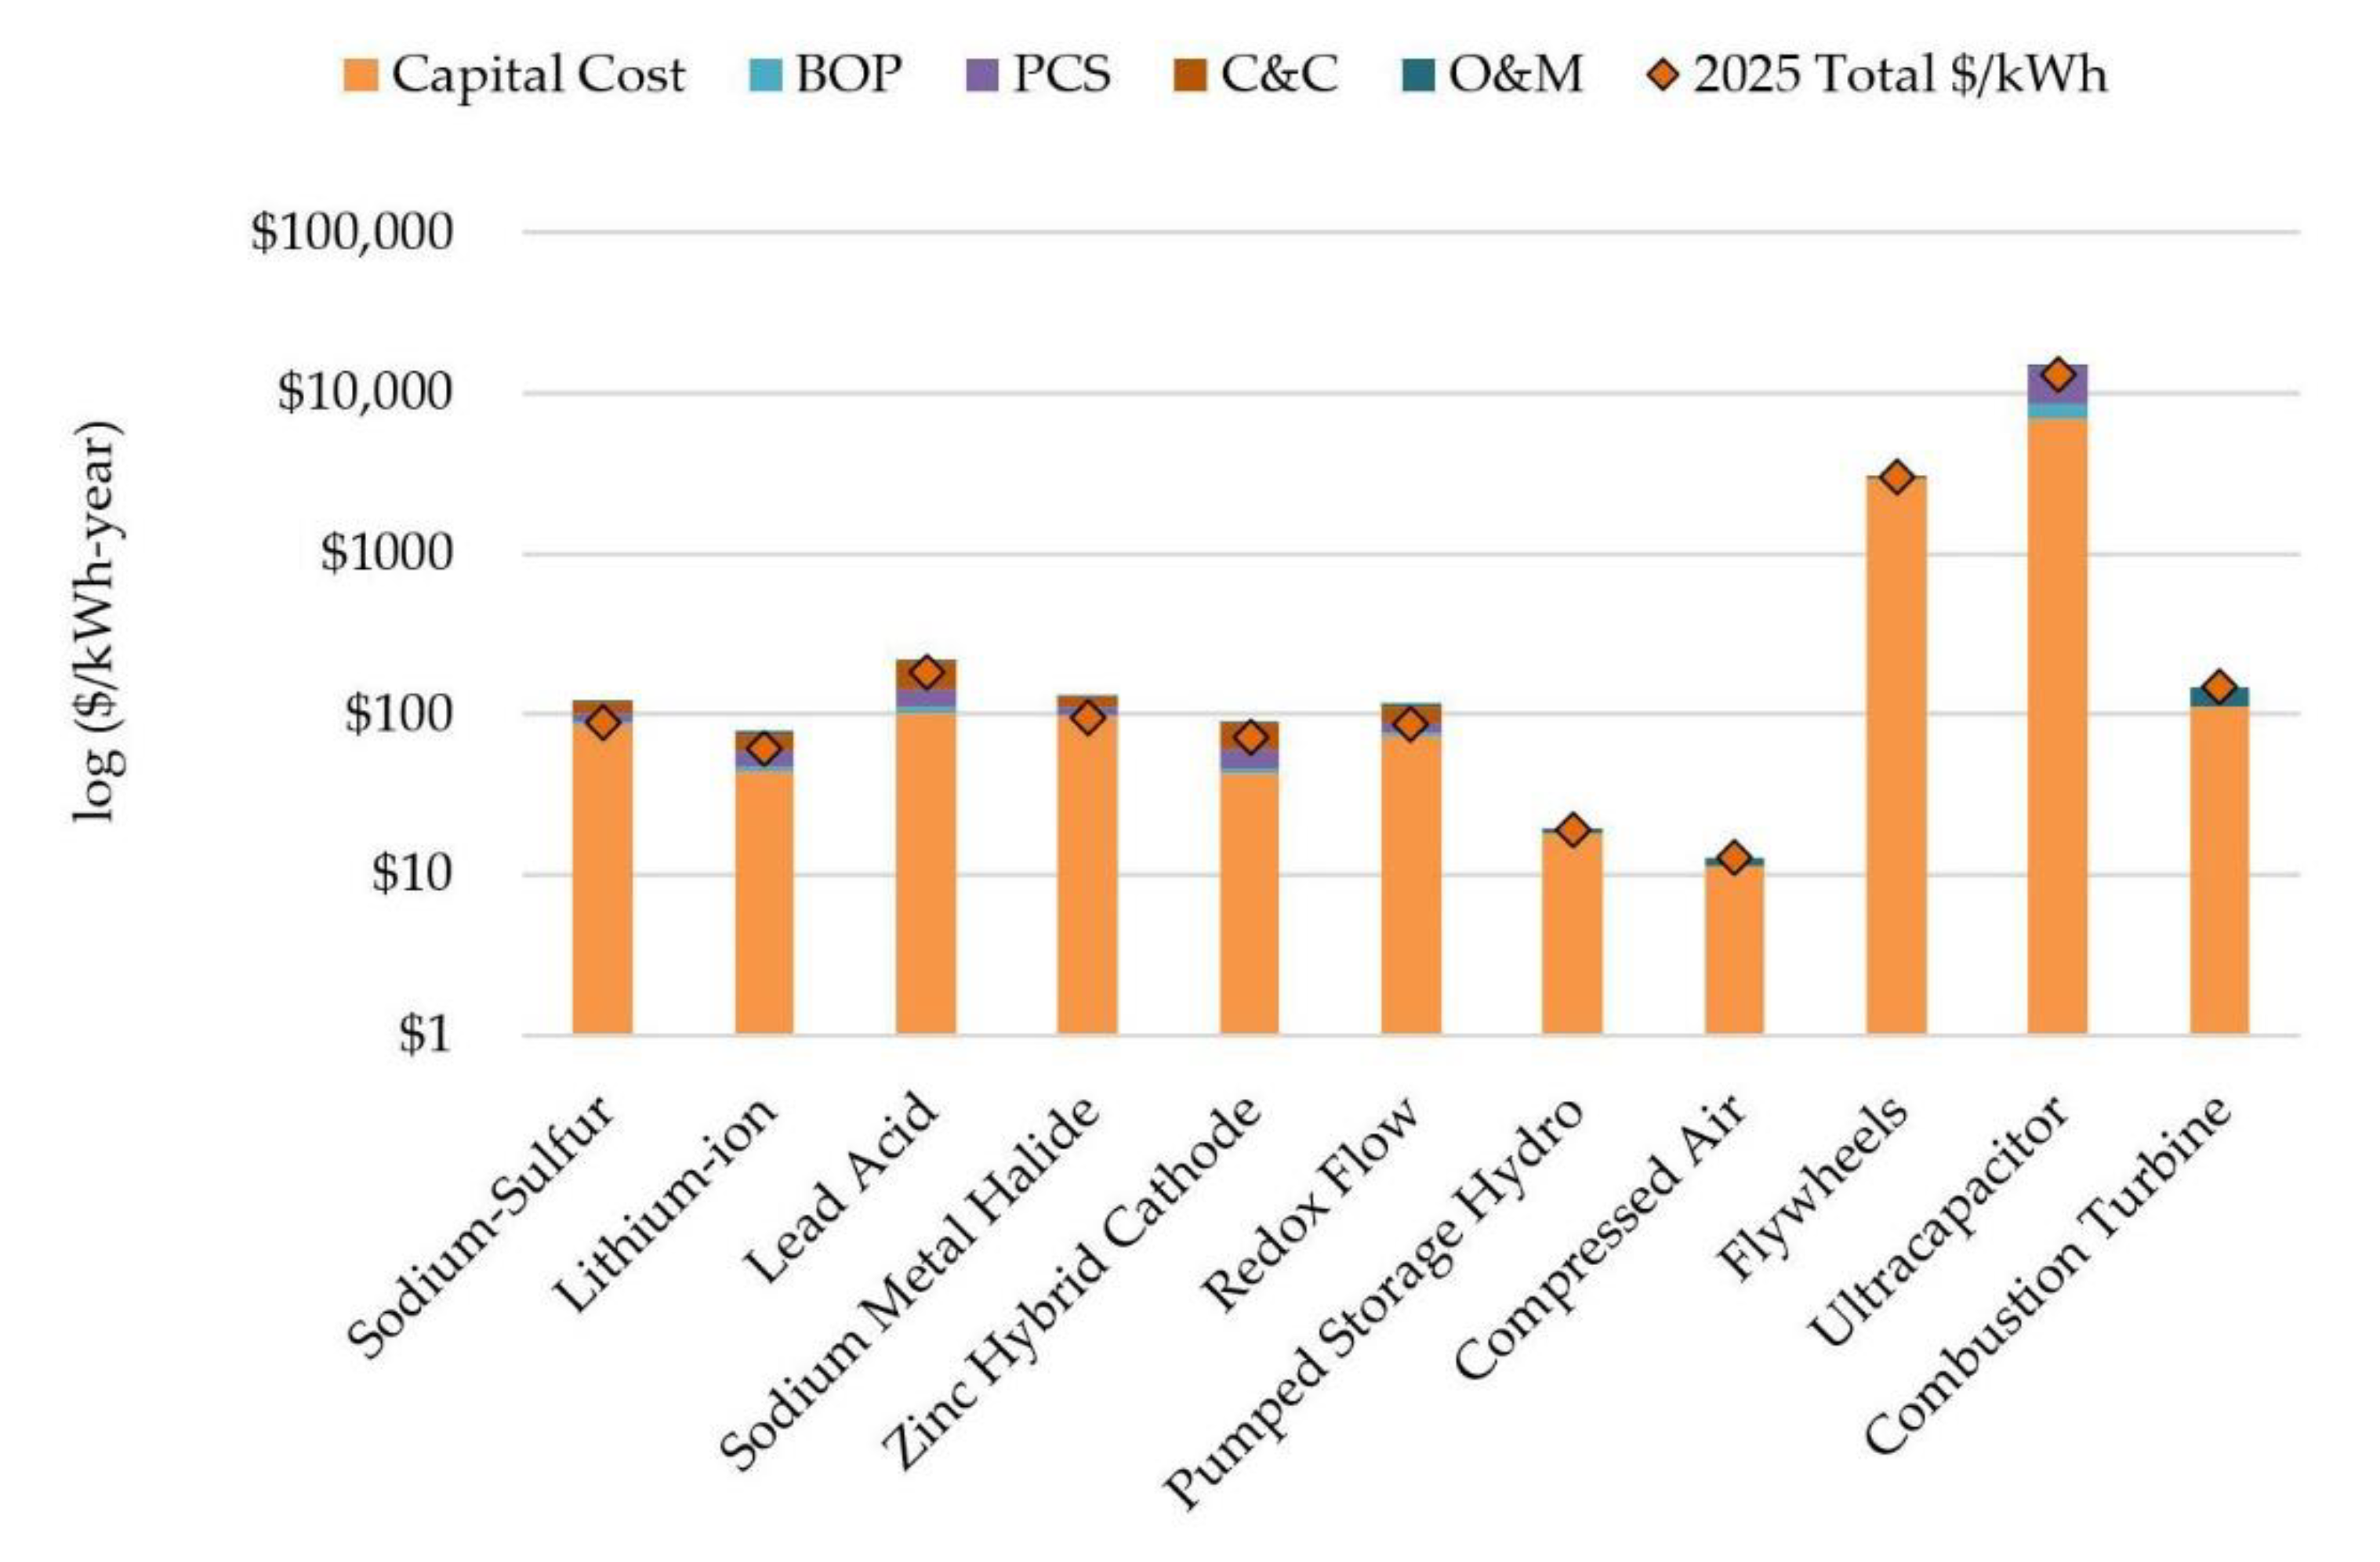
- On an annualized basis, lithium-ion has the lowest total annualized $/kWh value of any of the BESS technologies at $74/kWh, and ultracapacitors offer the lowest annualized $/kW value of the technologies included.
- An attempt was made to determine the cost breakdown among the various categories for PSH and CAES. While the cost for these technologies is typically reported in $/kW, the breakdown among EPC, BOP, power trains, and caverns from literature for CAES was compared with the numbers provided by a vendor and was found to align nicely. Based on vendor input, a relationship was found for cavern cost in $/kWh, such that cost for a CAES system of any power and energy combination could be estimated.
- Comparing various storage technologies with different E/P ratios can lead to misleading results. A framework has been developed to compare costs across a range of E/P ratios for PSH, CAES, and redox flow batteries.
Author Contributions
Funding
Acknowledgments
Conflicts of Interest
Acronyms and Abbreviations
| Acronym | Definition |
| AC | alternating current |
| Ah | ampere-hour |
| BESS | battery energy storage system |
| BMS | battery management system |
| BOP | balance of plant |
| Btu | British thermal unit |
| C&C | construction & commissioning |
| CAES | compressed air energy storage |
| CHP | combined heat and power |
| CONE | cost of new entry |
| CPUC | California Public Utility Commission |
| CT | combustion turbine |
| DC | direct current |
| DoD | depth of discharge and U.S. Department of Defense |
| DOE | U.S. Department of Energy |
| E/P | energy-to-power (ratio) |
| EIA | Energy Information Association |
| EPC | engineering, procurement, and construction |
| EPRI | Electric Power Research Institute |
| ESS | energy storage system |
| EV | electric vehicle |
| FG | full generation |
| FL | full load generation |
| FLA | full load generation |
| FS | fixed speed |
| G&A | general & administrative |
| GLIDES | Ground Level Integrated Distributed Energy Storage |
| GW | gigawatt(s) |
| h | hour(s) |
| HVAC | heating, ventilation, and air-conditioning |
| ICC | installed capacity cost |
| IRP | integrated resource planning |
| kW | kilowatt |
| kWh | kilowatt-hour |
| LFP | lithium iron phosphate |
| Li | lithium |
| LTO | lithium titanate oxide |
| MRL | manufacturing readiness level |
| MW | megawatt |
| MWh | megawatt-hour |
| NA | not applicable |
| NHA | National Hydropowper Association |
| NMC | nickel manganese cobalt oxide |
| NREL | National Renewable Energy Laboratory |
| O&M | operations & maintenance |
| OCV | open circuit voltage |
| OEM | original equipment manufacturer |
| ORNL | Oak Ridge National Laboratory |
| PCS | power conversion system |
| PG&E | Pacific Gas & Electric |
| PNNL | Pacific Northwest National Laboratory |
| PSH | pumped storage hydropower |
| PV | photovoltaics and present value |
| RTE | round-trip efficiency |
| s | second(s) |
| SENA | Shell Energy North America |
| SIA | spinning-in-air |
| SOC | State of Charge |
| TRL | technology readiness level |
| UET | UniEnergy Technology |
| V | volt(s) |
| VLA | vented lead-acid |
| VRLA | valve-regulated lead-acid |
| yr | year(s) |
References
- Balducci, P.; Alam, M.J.E.; Hardy, T.; Wu, D. Assigning value to energy storage systems at multiple points in an electrical grid Energy Environ. Energy Environ. Sci. 2018, 11, 1926–1944. [Google Scholar] [CrossRef] [Green Version]
- Vartanian, C.; Hellested, R. FACTS for Very Large Scale DC (BESS, PV) Grid Interconnect, Design Concepts and Cost Effective Applications; US Department of Energy Office of Electricity Electric Storage Power Electronics Workshop: Albuquerque, NM, USA, 2018.
- Minear, E.; Electric Power Research Institute (EPRI), Palo Alto, CA, USA. Personal Communication, 1 October 2018.
- Kelly-Detwiler, P. Getting the U.S. to 35 GW of Energy Storage by 2025. Forbes 2017. Available online: https://www.forbes.com/sites/peterdetwiler/2017/11/06/getting-the-u-s-to-35-gw-of-energy-storage-by-2025/#412bcafe1e44 (accessed on 16 January 2019).
- Alberth, S. Forecast technology costs via the experience curve—Myth or magic? Technol. Forecast. Soc. Chang. 2008, 75, 952–983. [Google Scholar] [CrossRef]
- Slovick, M. Automotive Is Driving the SiC Power Market. Electron. Des. 2018. Available online: https://www.electronicdesign.com/automotive/automotive-driving-sic-power-market (accessed on 5 October 2018).
- Samsung. ESS Batteries—Top Safety & Reliability Solutions. Samsung SDI 2018. Available online: http://www.samsungsdi.com/upload/ess_brochure/201804_SamsungSDI%20ESS_EN.PDF (accessed on 4 October 2018).
- Kishinevsky, Y. Long Island Bus Sodium Sulfur (NaS) Battery Storage Project. In Proceedings of the Electrical Energy Storage Applications and Technologies (EESAT) Conference, San Francisco, CA, USA, 17–19 October 2005. [Google Scholar]
- EoS. Eos Aurora 1000 |4000, Eos Product Description; EoS: Edison, NJ, USA, 2018. [Google Scholar]
- May, G.; Davidson, A.; Monahov, B. Lead batteries for utility energy storage: A review. J. Energy Storage 2018, 15, 145–157. [Google Scholar] [CrossRef]
- DNV GL. Battery Energy Storage Study for the 2017 IRP; 128197#-P-01-A; DNV GL: Chalfont, PA, USA, 2016. [Google Scholar]
- Aquino, T.; Zuelch, C.; Koss, C. Energy Storage Technology Assessment; HDR Report No. 10060535-0ZP-C1001; Prepared for the Public Service Company of New Mexico by HDR; HDR: Omaha, NE, USA, 2017. [Google Scholar]
- Lahiri, S. Assessing CAPEX for Storage Projects; DNV GL: Oakland, CA, USA, 2017. [Google Scholar]
- Schoenung, S.M. Overview of Energy Storage Cost Analysis. In Proceedings of the EUCI, Houston, TX, USA, 24 January 2011. [Google Scholar]
- Zakeri, B.; Syri, S. Electrical energy storage systems: A comparative life cycle cost analysis. Renew. Sustain. Energy Rev. 2015, 42, 569–596. [Google Scholar] [CrossRef]
- Hayward, J.A.; Graham, P.W. Electricity Generation Technology Cost Projections: 2017–2050; CSIRO (Commonwealth Scientific and Industrial Research Organisation): Canberra, Australia, 2017.
- Clean Energy Grid. Americans for a Clean Energy Grid, Grid-Scale Energy Storage. 2014. Available online: https://cleanenergygrid.org/wp-content/uploads/2014/08/Grid-Scale-Storage.pdf (accessed on 3 October 2018).
- Pressman, M.; Understanding Tesla’s Lithium-Ion Batteries. Evannex. 2017. Available online: https://evannex.com/blogs/news/understanding-teslas-lithium-ion-batteries (accessed on 18 July 2018).
- Minear, E.; EPRI, Palo Alto, CA, USA. Personal Communication, 12 July 2018.
- McLaren, J.; Gagnon, P.; Anderson, K.; Elgqvist, E.; Fu, R.; Rem, T. Battery Energy Storage Market: Commercial Scale, Lithium-ion Projects in the U.S.; NREL/PR-6A20-67235; National Renewable Energy Laboratory: Golden, CO, USA, 2016.
- UET (UniEnergy Technologies). UNIFLEX™ Flow Battery Preliminary Data Sheet. 2018. Available online: www.uetechnologies.com (accessed on 5 December 2018).
- Research Interfaces. Lithium-ion Batteries for Large-Scale Grid Energy Storage. 14 April 2018. Available online: https://researchinterfaces.com/lithium-ion-batteries-grid-energy-storage/ (accessed on 4 October 2018).
- Gotschall, H.; Eguchi, T. NGK’s Sodium Sulfur (NAS) Battery, the Vendor’s Perspective on Barriers & Issues Encountered in US Deployment; NGK Insulators, Presented to the California Energy Commission: Sacramento, CA, USA, 2009. [Google Scholar]
- LCE Energy. SONICK FIAMM, 48TL200 Technical Data. 2011. Available online: http://www.lcenergy.com.au/pdfs/Fiamm_SoNick_Battery_Type_48TL200_Data_Sheet.pdf (accessed on 4 October 2018).
- Rodrigues, G.D. Operating the World’s Largest Lead/Acid Battery Energy Storage System. J. Power Sour. 1990, 31, 311–320. [Google Scholar] [CrossRef]
- ITP Renewables. Lead Acid. 2020. Available online: https://batterytestcentre.com.au/project/lead-acid/ (accessed on 12 June 2020).
- EoS. Eos Aurora® 250 l 1000 System Specification Zynth® Technology; EoS: Edison, NJ, USA, 2018. [Google Scholar]
- Black & Veatch. Cost and Performance Data for Power Generation Technologies; Prepared for the National Renewable Energy Laboratory; Black & Veatch: Overland Park, KS, USA, February 2012. [Google Scholar]
- DOE (US Department of Energy). Discussion of Data for Smart Grid Metrics and Benefits: Storage System Performance Supplement. 2011. Available online: https://www.smartgrid.gov/files/energy_storage_system_performance_supplement.pdf (accessed on 14 December 2018).
- Newbery, D. A Simple Introduction to the Economics of Storage: Shifting Demand and Supply over Time and Space; EPRG Working Paper; Imperial College London and University of Cambridge—Energy Policy Research Group: London, UK; Cambridge, UK, 2016. [Google Scholar]
- DOD (US Department of Defense). US Department of Defense Manufacturing Readiness Levels; DOD: Washington, DC, USA, 2017.
- DOE (US Department of Energy). US Department of Energy Technology Readiness Assessment Guide; DOE G 413.3-4A; DOE: Washington, DC, USA, 2011.
- BLS (US Bureau of Labor Statistics). Producer Price Index-Industry Data for Electric Power Generation, Transmission and Distribution; BLS: Washington, DC, USA, 2018. Available online: https://beta.bls.gov/dataViewer/view/timeseries/PCU2211--2211--2018 (accessed on 11 July 2018).
- Viswanathan, V.; Crawford, A.; Stephenson, D.; Kim, S.; Wang, W.; Li, B.; Coffey, E.; Graff, G.; Balducci, P.; Kintner-Meyer, M.; et al. Cost and performance model for redox flow batteries. J. Power Sour. 2014, 247, 1040–1051. [Google Scholar] [CrossRef]
- Crawford, A.; Viswanathan, V.; Stephenson, D.; Wang, W.; Thomsen, E.; Reed, D.; Li, B.; Balducci, P.; Kintner-Meyer, M.; Sprenkle, V. Comparative analysis for various redox flow batteries chemistries using a cost performance model. J. Power Sour. 2015, 293, 388–399. [Google Scholar] [CrossRef] [Green Version]
- Zhang, Q.; White, R. Capacity fade analysis of lithium ion cell. J. Power Sour. 2008, 179, 793–798. [Google Scholar] [CrossRef]
- Ning, G.; White, R.; Popov, B. A generalized cycle life model of rechargeable Li-ion batteries. Electrochim. Acta 2006, 51, 2012–2022. [Google Scholar] [CrossRef]
- Kindermann, F.; Keil, J.; Frank, A.; Jossen, A. A SEI Modeling Approach Distinguishing between Capacity and Power Fade. J. Electrochem. Soc. 2017, 164, E287–E294. [Google Scholar] [CrossRef] [Green Version]
- Kulsangcharoen, P.; Klumpner, C.; Rashed, M.; Asher, G. A New Duty Cycle Based Efficiency Estimation Method for a Supercapacitor Stack under Constant Power Operation. Proc. IET 2010. [Google Scholar] [CrossRef]
- Tecate Group. Ultracapacitor & Supercapacitor Frequently Asked Questions. 2018. Available online: https://www.tecategroup.com/ultracapacitors-supercapacitors/ultracapacitor-FAQ.php (accessed on 5 September 2018).
- Mouser. Maxwell HC Series Ultracapacitor Datasheet. 2018. Available online: http://www.mouser.com/ds/2/257/datasheet_hc_series_1013793-1640.pdf (accessed on 5 September 2018).
- Amber Kinetics. Technology—Frequently Asked Questions. 2018. Available online: http://amberkinetics.com/technology/faqs/ (accessed on 5 September 2018).
- Homer Energy. Pumped Hydro. 2018. Available online: https://www.homerenergy.com/products/pro/docs/3.11/pumped_hydro.html (accessed on 5 September 2018).
- Nøvik, H.; Lia, L.; Wigestrand, M. Horizontal trash rack—A new intake concept for efficient backflushing. J. Appl. Water Eng. Res. 2014, 2, 81–90. [Google Scholar] [CrossRef]
- Dham, R.; U.S. Department of Energy, Washington, DC, USA. Personal Communication, 3 December 2018.
- Klimes, M. Understanding and Avoiding Pump Cavitation. Flow Control Network. 2017. Available online: https://www.flowcontrolnetwork.com/understanding-avoiding-pump-cavitation/ (accessed on 30 November 2018).
- Wang, J.; Lu, K.; Ma, L.; Wang, J.; Dooner, M.; Miao, S.; Jian, L.; Wang, D. Overview of Compressed Air Energy Storage and Technology Development. Energies 2017, 10, 991. [Google Scholar] [CrossRef] [Green Version]
- Darrow, K.; Tidball, R.; Wang, J.; Hampson, A. Catalog of CHP Technologies. 2014. Available online: http://www.fpuc.com/FPUCwordpress/wp-content/uploads/CHP-Ebook.pdf (accessed on 3 July 2018).
- Olson, A.; Schlag, N.; Patel, K.; Kwok, G. Capital Cost Review of Generation Technologies: Recommendations for WECC’s 10- and 20-Year Studies. 2014. Available online: https://www.wecc.biz/Reliability/2014_TEPPC_Generation_CapCost_Report_E3.pdf (accessed on 3 July 2018).
- DOE (US Department of Energy). Combined Heat and Power Technology Fact Sheet Series: Gas Turbines. July 2016. Available online: https://www.energy.gov/sites/prod/files/2016/09/f33/CHP-Gas%20Turbine.pdf (accessed on 3 July 2018).
- EIA (US Energy Information Administration). Capital Cost Estimates for Utility Scale Electricity Generating Plants. November 2016. Available online: https://www.eia.gov/analysis/studies/powerplants/capitalcost/pdf/capcost_assumption.pdf (accessed on 3 July 2018).
- Newell, S.A.; Hagerty, J.M.; Spees, K.; Pfeifenberger, J.P.; Liao, Q. Cost of New Estimates for Combustion Turbine and Combined Cycle Plants in PJM. 1 June 2018. Available online: http://files.brattle.com/files/6068_cost_of_new_entry_estimates_for_combustion_turbine_and_combined_cycle_plants_in_pjm.pdf (accessed on 3 July 2018).
- RapidTables. kWh to BTU Conversion. 2018. Available online: https://www.rapidtables.com/convert/energy/kWh_to_BTU.html (accessed on 3 August 2018).
- EASE (European Association for Energy Storage). Energy Storage Technologies. 2016. Available online: http://ease-storage.eu/energy-storage/technologies/ (accessed on 20 July 2018).
- Ailworth, E. Power Firm Seeks Giant Battery. The Wall Street Journal, 2 July 2018; B4. [Google Scholar]
- PG&E (Pacific Gas & Electric). PG&E Proposes Four New Cost-effective Energy Storage Projects to CPUC. Press Release. 29 June 2018. Available online: https://www.pge.com/en/about/newsroom/newsdetails/index.page?title=20180629_pge_proposes_four_new_cost-effective_energy_storage_projects_to_cpuc (accessed on 27 July 2018).
- Curry, C. Lithium-Ion Battery Costs and Market. Bloomberg New Energy Finance. 5 July 2017. Available online: https://data.bloomberglp.com/bnef/sites/14/2017/07/BNEF-Lithium-ion-battery-costs-and-market.pdf (accessed on 11 July 2018).
- Watanabe, C. Why Battery Cost Could Put the Brakes on Electric Car Sales. Bloomberg. 28 November 2017. Available online: https://www.bloomberg.com/news/articles/2017-11-28/electric-cars-need-cheaper-batteries-before-taking-over-the-road (accessed on 26 July 2018).
- Morris, C. Tesla is Getting Close to the Magic Battery Cost Number that will Turbocharge Demand. Evannex. 19 June 2018. Available online: https://evannex.com/blogs/news/tesla-is-getting-close-to-the-magic-battery-cost-number-that-will-turbocharge-demand (accessed on 26 July 2018).
- Damato, G. Energy Storage Cost Analysis: Executive Summary of 2017 Methods and Results; Report 3002012046; Electric Power Research Institute: Palo Alto, CA, USA, 2017. [Google Scholar]
- Wright, P. Trends in Renewable Energy and Storage. Goldman Sachs–North American Energy Summit. 10 June 2014. Available online: https://www.goldmansachs.com/our-thinking/pages/north-american-energy-summit/reports/beci-trends-in-renewable-energy-and-storage.pdf (accessed on 26 July 2018).
- Greenspon, A. The Energy Storage Landscape: Feasibility of Alternatives to Lithium Based Batteries. Harvard Energy Journal Club: Cambridge, MA, USA, 24 April 2017. [Google Scholar]
- Manuel, W. Energy Storage Study 2014. California Energy Commission Report, Turlock Irrigation District. 17 September 2014; California. Available online: https://www.energy.ca.gov/assessments/ab2514_reports/Turlock_Irrigation_District/2014-10-28_Turlock_Irrigation_District_Energy_Storage_Study.pdf (accessed on 27 July 2018).
- DiOrio, N.; Dobos, A.; Janzou, S. Economic Analysis Case Studies of Battery Energy Storage with SAM; NREL/TP-6A20-64987; National Renewable Energy Laboratory: Golden, CO, USA, 2015.
- DNV GL. California SGIP. Presentation. 4 April 2017. [Google Scholar]
- Kamath, H. Batteries and Energy Storage: Looking Past the Hype; Presentation to Tucson Electric Power. IRP Workshop on Energy Storage; Electric Power Research Institute: Palo Alto, CA, USA, 2016. [Google Scholar]
- Evertiq. Power Battery Prices Decrease as Global e-Car Market Expands. 9 July 2018. Available online: https://evertiq.com/news/44460 (accessed on 7 August 2018).
- Posawatz, T. Mine is Bigger: Why Larger EV Batteries are not the Answer. 23 July 2018. Available online: https://www.forbes.com/sites/tonyposawatz/2018/07/23/mine-is-bigger-why-bigger-bigger-ev-batteries-are-not-the-answer/#681f215f1837 (accessed on 8 August 2018).
- Chediak, M. Electric Car Batteries Drop Closer to a Cost Tipping Point. 5 December 2017. Available online: https://www.industryweek.com/energy/electric-car-batteries-drop-closer-cost-tipping-point (accessed on 6 August 2018).
- Eckert, M. Analysis Shows Continued Industry-Wide Decline in Electric Vehicle Battery Costs. 21 February 2018. Available online: https://mackinstitute.wharton.upenn.edu/2018/electric-vehicle-battery-costs-decline/ (accessed on 6 August 2018).
- Safari, M. Battery Electric Vehicles: Looking Behind to Move Forward. Energy Policy 2018, 115, 54–65. [Google Scholar] [CrossRef]
- Lambert, F. Electric Vehicle Battery Cost Dropped 80% in 6 Years down to $227/kWH—Tesla Claims to be Below $190/kWH, Electrek. 30 January 2017. Available online: https://electrek.co/2017/01/30/electric-vehicle-battery-cost-dropped-80-6-years-227kwh-tesla-190kwh/ (accessed on 6 August 2018).
- Lacey, S. Stem CTO: Lithium-Ion Battery Prices Fell 70% in the Last 18 Months, GreentechMedia. 28 June 2016. Available online: https://www.greentechmedia.com/articles/read/stem-cto-weve-seen-battery-prices-fall-70-in-the-last-18-months#gs.UwTIT0g (accessed on 6 August 2018).
- Outback Storage (OS). Containers Delivered on Site. 2018. Available online: https://outbackstoragecontainers.com/40-foot-shipping-containers-for-sale (accessed on 15 January 2019).
- Electric Car Parts Company (ECPC). 1MWH Energy Storage Banks in 40ft Containers…$759,650 each, Plus Freight. Available online: https://www.electriccarpartscompany.com/1MWH-Energy-Storage-Banks-in-40ft-Containers (accessed on 15 January 2019).
- Balducci, P.; Viswanathan, V.; Wu, D.; Weimar, M.; Mongird, K.; Alam, J.; Crawford, A.; Somani, A.; Whitener, K. The Salem Smart Power Center: An Assessment of Battery Performance and Economic Potential; PNNL-26858; Pacific Northwest National Laboratory: Richland, WA, USA, 2017.
- Viswanathan, V.V.; Crawford, A.J.; Alam, M.E.; Balducci, P.J.; Wu, D.; Hardy, T.D.; Mongird, K. Snohomish Public Utility District: An Assessment of Battery Technical Performance; PNNL-27237; Pacific Northwest National Laboratory: Richland, WA, USA, 2018.
- Crawford, A.J.; Viswanathan, V.V.; Vartanian, C.K.; Mongird, K.; Alam, M.E.; Wu, D.; Balducci, P.J. Puget Sound Energy—An Assessment of Battery Technical Performance; PNNL-28379; Pacific Northwest National Laboratory: Richland, WA, USA, 2019.
- Crawford, A.J.; Viswanathan, V.V.; Vartanian, C.K.; Alam, M.E.; Balducci, P.J.; Wu, D.; Hardy, T.D. Avista An Assessment of Battery Technical Performance; PNNL-28480; Pacific Northwest National Laboratory: Richland, WA, USA, 2019.
- Mina, A.; Public-Domain Test Data Showing Key Benefits and Applications of the UltraBattery. Australian Energy Storage Alliance. 16 December 2014. Available online: https://energystoragealliance.com.au/public-domain-test-data-showing-key-benefits-applications-ultrabattery/ (accessed on 26 July 2018).
- Vechy, S.; EnerSys, Reading, PA, USA. Personal Communication, 2 July 2018.
- Aquino, T.; Roling, M.; Baker, C.; Rowland, L. Battery Energy Storage Technology Assessment; Prepared for the Platte River Power authority by HDR; HDR: Omaha, NE, USA, 2017. [Google Scholar]
- PowerTech Systems. Lithium-ion vs Lead-Acid Cost Analysis. 2015. Available online: https://www.powertechsystems.eu/home/tech-corner/lithium-ion-vs-lead-acid-cost-analysis/ (accessed on 11 July 2018).
- Anuphjappharadorn, S.; Sukcha, S.; Sirisamphanwong, C.; Ketjoy, N. Comparison the Economic Analysis of the Battery between Lithium-ion and Lead-acid in PV Stand-alone Application. Energy Procedia 2014, 56, 352–358. [Google Scholar] [CrossRef] [Green Version]
- Lazard. Lazard’s Levelized Cost of Storage Analysis—Version 4.0. November 2018. Available online: https://www.lazard.com/media/450774/lazards-levelized-cost-of-storage-version-40-vfinal.pdf (accessed on 17 December 2019).
- BAE. Technical Specifications for Vented Lead-Acid Batteries (VLA); BAE Secura PVS solar, Tracking number 480522; BAE: Berlin, Germany, 2011. [Google Scholar]
- C&D Technologies, Inc. Deep Cycle Series: Valve Regulated Lead Acid Battery Designed for Cycling Applications. 12-1061; C&D Technologies, Inc.: Redford, MI, USA, 2012. [Google Scholar]
- C&D Technologies, Inc. Liberty AES: The Liberty AES 50 Series Cycle and PSoC Service Battery. 12-1129; C&D Technologies, Inc.: Redford, MI, USA, 2015. [Google Scholar]
- RedT Energy Storage. Gen 2 Machine Pricing Starting at $490/kWh. 2018. Available online: https://redtenergy.com/first-redt-gen-2-machine-dispatched-manufacturing-facility/ (accessed on 22 July 2018).
- Uhrig, M.; Koenig, S.; Suriyah, M.; Leibfried, T. Lithium-based vs. Vanadium Redox Flow Batteries—A Comparison for Home Storage Systems. Energy Procedia 2016, 99, 35–43. [Google Scholar] [CrossRef] [Green Version]
- Seipp, T.; Volterion GmbH, Dortmund, Germany. Personal Correspondence, 6 August 2018.
- Noack, J.L.; Wietschel, N.; Roznyatovskaya, K.; Pinkwart; Tubke, J. Techno-Economic Modeling and Analysis of Redox Flow Battery Systems. Energies 2016, 9, 627. [Google Scholar] [CrossRef]
- Selmon, E.; Wynne, H. Energy Storage Technologies for the Bulk Grid: Will Lithium-Ion Batteries Continue to Dominate Grid Storage? Sector & Sovereign Research. 1 March 2017. Available online: http://www.ssrllc.com/publication/energy-storage-technologies-for-the-bulk-grid-will-lithium-ion-batteries-continue-to-dominate-grid-storage/ (accessed on 11 July 2018).
- Herman, D. Comparison of Storage Technologies for Distributed Resource Applications. 1007301; Electric Power Research Institute: Palo Alto, CA, USA, 2003. [Google Scholar]
- Rastler, D. Electricity Energy Storage Technology Options: A White Paper Primer on Applications, Costs and Benefits; EPRI 1020676, Final Report; Electric Power Research Institute: Palo Alto, CA, USA, 2010. [Google Scholar]
- Crowe, R. Energy Storage Industry Grows to Integrate Wind, Solar. Renewable Energy World. 17 August 2011. Available online: https://www.renewableenergyworld.com/articles/2011/08/energy-storage-industry-grows-to-integrate-wind-solar.html (accessed on 15 July 2018).
- Liu, G.; Wang, D.; Dai, K. A Storage Revolution: A Low Temperature Sodium Sulfur Battery. Cleantech to Market. 10 January 2014. Available online: https://ei.haas.berkeley.edu/education/c2m/docs/Sulfur%20and%20Sodium%20Metal%20Battery.pdf (accessed on 27 July 2018).
- Karina, H.; Michel, A.; Teofilo, R. High Temperature Sodium Batteries: Status, Challenges and Future Trends. Energy Environ. Sci. 2013, 6, 734–749. [Google Scholar] [CrossRef]
- Miraldi, A.; FZSoNick, Inc., Stabio, Switzerland. Personal Communication, 12 July 2018.
- Li, G.; PNNL, Richland, WA, USA. Personal Communication, 10 July 2018.
- Benato, R.; Cosciani, N.; Crugnola, G.; Dambone Sessa, S.; Lodi, G.; Parmeggiani, C.; Todeschini, M. Sodium nickel chloride battery technology for large-scale stationary storage in the high voltage network. J. Power Sour. 2015, 293, 127–136. [Google Scholar] [CrossRef]
- Solarquotes. Sodium Nickel Chloride Batteries. Solarquotes. Available online: https://www.solarquotes.com.au/battery-storage/battery-types/sodium/ (accessed on 20 July 2018).
- EoS. EOS Aurora: Grid-Scale Energy Storage. 2017. Available online: https://eosenergystorage.com/products-technology/ (accessed on 27 July 2018).
- EoS. Cost Calculator. 2018. Available online: http://eosenergystorage.com/costcalculator (accessed on 20 July 2018).
- Yang, S.; EoS, Edison, NJ, USA. Personal Communication, 11 July 2018.
- Balducci, P.; Mongird, K.; Wu, D.; Yuan, Y.; Somani, A.; Alam, J.; Steenkamp, J. Shell Energy North America Hydro Battery System: Market Assessment 1; PNNL-27162; Pacific Northwest National Laboratory: Richland, WA, USA, 2018.
- ESMAP. Mexico’s Power Sector Transition: Pumped Storage Hydropower to Facilitate Renewable Energy Integration. 2015. Available online: https://www.esmap.org/node/56012 (accessed on 10 December 2018).
- Rehman, S.; Al-Hadhrami, L.; Alam, M. Pumped hydro energy storage system: A technological review. Renew. Sustain. Energy Rev. 2015, 44, 286–598. [Google Scholar] [CrossRef]
- DOE (US Department of Energy). DOE Global Energy Storage Database. Available online: https://www.energystorageexchange.org/ (accessed on 14 September 2018).
- IEA. Is Pumped Storage Hydropower Capacity Forecast to Expand More Quickly than Stationary Battery Storage? IEA: Paris, France, 2019. [Google Scholar]
- CAISO (California Independent System Operator). Impacts of Renewable Energy on Grid Operations. Available online: https://www.caiso.com/documents/curtailmentfastfacts.pdf (accessed on 13 December 2018).
- DOE (US Department of Energy). Hydropower Vision Report; DOE: Washington, DC, USA, 2016.
- NHA (National Hydropower Association). Challenges and Opportunities for New Pumped Storage Development. National Hydropower Association Pumped Storage Development Council. 2017. Available online: https://www.hydro.org/wp-content/uploads/2017/08/NHA_PumpedStorage_071212b1.pdf (accessed on 4 December 2018).
- Koritarov, V.; Guzowski, L.; Feltes, J.; Kazachkov, Y.; Gong, B.; Trouille, B.; Donalek, P. Modeling Ternary Pumped Storage Units; ANL/DIS-13/07; Argonne National Laboratory: Lemont, IL, USA, 2013.
- DOE (US Department of Energy). Energy Department Awards up to $9.8 Million for Next-Generation Hydropower Technologies; DOE: Washington, DC, USA, 2017.
- USBR (US Bureau of Reclamation). Mt. Elbert Pumped-Storage Powerplant: Fryingpan Arkansas Project. Available online: https://www.usbr.gov/projects/pdf.php?id=46 (accessed on 10 July 2018).
- Shan, R.; O’Connor, P.; ORNL, Oak Ridge, TN, USA. Personal Communication, 20 June 2018.
- Damato, G.; Minear, E. Energy Storage Cost Summary for Utility Planning: Executive Summary; Report 3002008877; Electric Power Research Institute: Palo Alto, CA, USA, 2016. [Google Scholar]
- Miller, R.; HDR, Omaha, NE, USA. Personal Correspondence, 12 June 2018.
- IRENA (International Renewable Energy Agency). Renewable Energy Technologies: Cost Analysis Series (Hydropower); Working Paper, Volume 1: Power Sector Issue 3/5; IRENA: Abu Dhabi, UAE, 2012. [Google Scholar]
- Steffen, B. Prospects for pumped-hydro storage in Germany. Energy Policy 2012, 45, 420–429. [Google Scholar] [CrossRef] [Green Version]
- Manwaring, M.; National Hydropower Association, Washington, DC, USA. Personal Correspondence, 6 December 2018.
- Henry, J.; Maurer, F.; Frommi, J.; Sautereau, T. Converting to Variable Speed at a Pumped-Storage Plant. Hydroworld. 1 September 2013. Available online: https://www.hydroworld.com/articles/print/volume-21/issue-5/articles/pumped-storage/converting-to-variable-speed-at-a-pumped-storage-plant.html (accessed on 4 December 2018).
- Cavazzini, G. Technological Developments for Pumped-Hydro Energy Storage; European Energy Research Alliance: Brussels, Belgium, 2014. [Google Scholar]
- Valavi, M.; Nysveen, A. Variable-Speed Operation of Hydropower Plants: Past, present, and future. In Proceedings of the 2016 XXII International Conference on Electrical Machines (ICEM), IEEE 1077- 2618/18, Lausanne, Switzerland, 4–7 September 2016; pp. 640–646. [Google Scholar] [CrossRef] [Green Version]
- DOE (US Department of Energy). Pumped Storage and Potential Hydropower from Conduits; Report to Congress; DOE: Washington, DC, USA, 2015.
- Botterud, A.; Levin, T.; Koritarov, V. Pumped Storage Hydropower: Benefits for Grid Reliability and Integration of Variable Renewable Energy. ANL/DIS-14/10; Argonne National Laboratory: Lemont, IL, USA, 2014. [Google Scholar]
- Manwaring, M.; National Hydropower Association, Washington, DC, USA. Personal Communication, 12 July 2018.
- Manwaring, M.; National Hydropower Association, Washington, DC, USA. Personal communication, 12 June 2018.
- Witt, A.; Chalise, D.; Hadjerioua, B.; Manwaring, M.; Bishop, N. Development and Implications of a Predictive Cost Methodology for Modular Pumped Storage Hydropower (m-PSH) Projects in the United States; ORNL/TM-2016/590; Oak Ridge National Laboratory: Oak Ridge, TN, USA, 2016.
- International Energy Agency (IEA). World Energy Outlook; IEA: Paris, France, 2008; ISBN-13: 978 92 64 04560-6. [Google Scholar]
- Witt, A.; Hadjerioua, B.; Martinez, R.; Bishop, N. Evaluation of the Feasibility and Viability of Modular Pumped Storage Hydro (m-PSH) in the United States; ORNL/TM-2015/ 559; Oak Ridge National Laboratory: Oak Ridge, TN, USA, 2015.
- MWH. Technical Analysis of Pumped Storage and Integration with Wind Power in the Pacific Northwest; MWH-HDC-T12; MWH: Bellevue, WA, USA, 2009. [Google Scholar]
- SENA—Shell Energy North America. Final License Application-Hydro Battery Pearl Hill, Exhibit A: Description of Existing and Proposed Project Facilities and Components; SENA: Houston, TX, USA, 2017. [Google Scholar]
- Hadjerioua, B.; DeNeale, S. Preliminary Design Specification and Cost Estimate for a Prototype Floating Membrane Reservoir System; Oak Ridge National Laboratory (ORNL): Oak Ridge, TN, USA, 2018.
- Barbour, E.; Wilson, I.A.; Radcliffe, J.; Ding, Y.; Yongliang, L. A review of Pumped Hydro Energy Storage development in significant international electricity markets. Renew. Sustain. Energy Rev. 2016, 61, 421–432. [Google Scholar] [CrossRef] [Green Version]
- Uría-Martínez, R.; Johnson, M.; O’Connor, P. 2017 Hydropower Market Report; DOE/EE-1737; Oak Ridge National Laboratory; US Department of Energy Office of Energy Efficiency & Renewable Energy: Oak Ridge, TN, USA, 2018.
- DOE (US Department of Energy). Hydropower Vision Report 2017 Update; Oak Ridge National Laboratory: Oak Ridge, TN, USA, 2016.
- General Electric (GE). Hydro Storage; General Electric: Boston, MA, USA, 2018. [Google Scholar]
- Fisher, R.; Koutnik, J.; Meier, L.; Loose, V.; Engels, K.; Beyer, T. A Comparison of Advanced Pumped Storage Equipment Drivers in the US and Europe. Hydrovision 2012. [Google Scholar] [CrossRef]
- Helix Power. Regenerative Braking Using Flywheels. In Proceedings of the NY-BEST Energy Storage Technology Conference, Syracuse, NY, USA, 20 October 2016. [Google Scholar]
- Goodwin, A. Kinetic Traction, Los Angeles, CA, USA. Personal correspondence, 9 July 2018. [Google Scholar]
- Lazarewicz, M.; Helix Power, Somerville, MA, USA. Personal Communication, 2018.
- Active Power. Why Flywheel. 2017. Available online: http://www.activepower.com/en-US/5060/why-flywheel (accessed on 20 July 2018).
- Stornetic. Powerful Storage System for Grid Services. 2018. Available online: https://stornetic.com/assets/downloads/stornetic_general_presentation.pdf (accessed on 26 July 2018).
- Hydrodynamics. Compressed Air Energy Storage. The Hydrodynamics Group. Available online: http://www.hydrodynamics-group.com/geological-consulting/compressed-air-energy-storage/overview/ (accessed on 3 August 2018).
- Breeze, P. Compressed Air Energy Storage. In Power System Energy Storage Technologies; Academic Press: Cambridge, MA, USA, 2018; pp. 23–31. ISBN 9780128129029. [Google Scholar]
- Venkataramani, G.; Ramalingam, V.; Kishore, V. Harnessing Free Energy from Nature for Efficient Operation of Compressed Air Energy Storage System and Unlocking the Potential of Renewable Power Generation. Sci. Rep. 2018. [Google Scholar] [CrossRef]
- Doughty, C.; Kelly, L.; Mathias, J. Bulk Energy Storage in California. California Energy Commission (CEC). 2016. Available online: http://www.energy.ca.gov/2016publications/CEC-200-2016-006/CEC-200-2016-006.pdf (accessed on 26 July 2018).
- Siemens. CAES Systems at Siemens; Presentation; Siemens: Munich, Germany, 2017. [Google Scholar]
- Dugan, K. Huntsman Corp. breaks ground on $64 million McIntosh expansion. Alabama Business. 2013. Available online: https://www.al.com/business/index.ssf/2013/05/huntsman_corp_breaks_ground_on.html (accessed on 14 December 2018).
- Bailie, R.; Siemens, Munich, Germany. Personal Correspondence, 3 August 2018.
- Siemens. Roundtrip Efficiency Characterization for Dresser-Rand SMARTCAES Compressed Air Energy Storage Systems; Presentation; Siemens: Munich, Germany, 2018. [Google Scholar]
- Gyuk, I. Buffering the Grid with Compressed Air Energy Storage. In Proceedings of the CAES Webinar; 2012. Available online: https://www.energy.gov/oe/articles/bulk-energy-storage-webinar-rescheduled-february-9-2012 (accessed on 17 July 2018).
- Li, J.; Du, Z.; Ruther, R.E.; An, S.J.; David, L.A.; Hays, K.; Wood, M.; Phillip, N.D.; Sheng, Y.; Mao, C.; et al. Toward Low-Cost, High-Energy Density, and High-Power Density Lithium-Ion Batteries. J. Mater. 2017, 69, 1484–1496. [Google Scholar] [CrossRef] [Green Version]
- Maxwell. Ultracapacitor Overview. 2018. Available online: http://www.maxwell.com/products/ultracapacitors (accessed on 20 July 2018).
- Maxwell. Ultracapacitors: Transforming the Grid. 2018. Available online: http://www.maxwell.com/images/documents/PowerGrid_CaseStudies_3001287_EN_1.pdf (accessed on 20 July 2018).
- Jezowski, P.; Crosnier, O.; Deunf, E.; Poizot, P.; Beguin, F.; Brousse, T. Safe and recyclable lithium-ion capacitors using sacrificial organic lithium salt. Nat. Mater. 2018, 17, 167–173. [Google Scholar] [CrossRef]
- Naoi, K.; Wako, N.; Aoyago, S.; Miyamoto, J.; Kamino, T. New Generation Nanohybrid Supercapacitor. Chem. Res. 2013, 46, 1075–1083. [Google Scholar] [CrossRef]
- Colton, J.; Ioxus, Oneonta, NY, USA. Personal Correspondence, 11 July 2018.
- Garcia, A.; Maxwell Technologies, San Diego, CA, USA. Personal Correspondence, 18 June 2018.
- Atmaja, T.D. Energy Storage System Using Battery and Ultracapacitor on Mobile Charging Station for Electric Vehicle. Energy Procedia 2015, 68, 429–437. [Google Scholar] [CrossRef] [Green Version]
- Sahay, K.; Dwivedi, B. Supercapacitors Energy Storage System for Power Quality Improvement: An Overview. J. Electr. Syst. 2009, 5, 4. [Google Scholar]


| Technology | Nominal DC Voltage (V) | Source Year, Author(s) |
|---|---|---|
| Lithium-ion | 860 (a) | |
| Lithium-ion | 1221 | 2018, Samsung [7] |
| Sodium-sulfur | 640 (b) | 2005, Kishinevsky [8] |
| Sodium-metal halide | 640 (c) | |
| Zinc-hybrid cathode | 768 (d) | 2018, EoS [9] |
| Lead acid | 756 (e) | 2018, May et al. [10] |
| Battery Chemistry | Wh/L | Source Year, Author(s) |
|---|---|---|
| Redox flow | 12.5 | 2018, UET [21] |
| Lithium-ion | 80 | 2018, Research Interfaces [22] |
| Lithium-ion | 90−130 (a) | 2018, Research Interfaces [22] |
| Sodium-sulfur | 40 | 2009, Gotschall and Eguchi [23] |
| Sodium halide | 65 (b) | 2011, LCE Energy [24] |
| Lead acid Chino | 16 (c) | 1990, Rodrigues [25] |
| Lead acid estimated | 22.5 (d) | 2020, ITP Renewables [26] |
| Zinc-hybrid cathode | 17 | 2018, EoS [27] |
| Chemistry | L/Wh Normalized | (L/Wh Normalized) 0.33 | C&C Cost $/kWh, 2018 | C&C Cost $/kWh, 2025 |
|---|---|---|---|---|
| Lithium-ion | 0.12 | 0.53 | 101 | 96 |
| Sodium halide | 0.19 | 0.61 | 115 | 110 |
| Sodium-sulfur | 0.31 | 0.70 | 133 | 127 |
| Lead acid | 0.78 | 0.93 | 176 | 167 |
| Zinc-hybrid cathode | 0.73 | 0.91 | 173 | 164 |
| Redox flow battery | 1 | 1 | 190 | 180 |
| Technology | MW | MWh | E/P |
|---|---|---|---|
| BESS | 1 | 4 | 4 |
| Ultracapacitor | 1 | 0.0125 | 0.0125 |
| CAES | 250 | 4000 | 16 |
| Flywheel | 20 | 5 | 0.25 |
| PSH | 2000 | 32,000 | 16 |
| Chemistry Type | 2018 to 2025 Cost Decrease |
|---|---|
| Lithium-ion (NMC) | 31% |
| Vanadium redox | 29% |
| Zinc air | 28% |
| Sodium sulfur | 24% |
| Sodium-metal halide | 30% |
| Lead acid | 15% |
| Chemistry | Final RTE/Initial RTE | Calendar Life (Years) | Annual RTE Loss |
|---|---|---|---|
| Lithium-ion loss | 0.959 | 10 | 0.50% |
| Sodium sulfur | 0.956 | 13.5 | 0.34% |
| Lead acid | 0.898 | 3 | 5.40% |
| Zinc-hybrid | 0.878 | 10 | 1.50% |
| Redox flow battery | 0.847 | 15 | 0.40% |
| Sodium-metal halide | 0.956 | 12.5 | 0.35% |
| Ultracapacitor | 0.979 | 16 | 0.14% |
| Flywheel | N/A | >20 | 0.14% |
| Lithium-Ion | Lead Acid | Redox Flow | Sodium-Sulfur | Sodium-Metal | Zinc-Hybrid Cathode | ||||||||
|---|---|---|---|---|---|---|---|---|---|---|---|---|---|
| Halide | |||||||||||||
| Parameter | 2018 | 2025 | 2018 | 2025 | 2018 | 2025 | 2018 | 2025 | 2018 | 2025 | 2018 | 2025 | |
| Capital Cost–Energy Capacity ($/kWh) | 271 | (189) | 260 | (220) | 555 | (393) | 661 | (465) | 700 | (482) | 265 | (192) | |
| Power Conversion System ($/kW) | 288 | (211) | 350 | (211) | 350 | (211) | 350 | (211) | 350 | (211) | 350 | (211) | |
| Balance of Plant ($/kW) | 100 | (95) | 100 | (95) | 100 | (95) | 100 | (95) | 100 | (95) | 100 | (95) | |
| Construction and Commissioning Cost ($/kWh) | 101 | (96) | 176 | (167) | 190 | (180) | 133 | (127) | 115 | (110) | 173 | (164) | |
| Total Project Cost ($/kW) | 1876 | (1446) | 2194 | (1854) | 3430 | (2598) | 3626 | (2674) | 3710 | (2674) | 2202 | (1730) | |
| Total Project Cost ($/kWh) | 469 | (362) | 549 | (464) | 858 | (650) | 907 | (669) | 928 | (669) | 551 | (433) | |
| O&M Fixed ($/kW-yr) | 10 | (8) | 10 | (8) | 10 | (8) | 10 | (8) | 10 | (8) | 10 | (8) | |
| System RTE | 0.86 | 0.72 | 0.675 | (0.7) | 0.75 | 0.83 | 0.72 | ||||||
| Annual RTE Degradation Factor | 0.50% | 5.40% | 0.40% | 0.34% | 0.35% | 1.50% | |||||||
| Response Time (limited by PCS) | 1 s | 1 s | 1 s | 1 s | 1 s | 1 s | |||||||
| Cycles at 80% DoD | 3500 | 900 | 10,000 | 4000 | 3500 | 3500 | |||||||
| Life (Years) | 10 | 2.6 | (3) | 15 | 13.5 | 12.5 | 10 | ||||||
| MRL | 9 | (10) | 9 | (10) | 8 | (9) | 9 | (10) | 7 | (9) | 6 | (8) | |
| TRL | 8 | (9) | 8 | (9) | 7 | (8) | 8 | (9) | 6 | (8) | 5 | (7) | |
| Cost Parameter | Combustion Turbine | PSH (b) | Flywheel (c) | CAES (b) | Ultracapacitor (d) | |||
|---|---|---|---|---|---|---|---|---|
| Capital–Energy Capacity ($/kW) | 940 | 2638 | 2400 | 1669 | 400 | |||
| Power Conversion System ($/kW) | N/A | Included in Capital Cost | Included in Capital Cost | N/A | 350 (255) | |||
| Balance of Plant ($/kW) | 100 (95) | |||||||
| Construction and Commissioning ($/kW) | 480 (e) | 80 (e) | ||||||
| Total Project Cost ($/kW) | 940 | 2638 | 2880 | 1669 | 930 (835) | |||
| Total Project Cost ($/kWh) | 165 | 11,520 | 105 | 74,480 (66,640) | ||||
| O&M Fixed ($/kW-year) | 13 | 15.9 | 5.6 | 16.7 | 1 | |||
| System RTE | 0.328 | 0.8 | 0.86 | 0.52 | 0.92 | |||
| Annual RTE Degradation Factor | 0.14% | 0.14% | ||||||
| Response Time | From cold start: 10 min Spin ramp rate: 8.33%/min Quick start ramp rate: 22.2%/min | FS | AS | Ternary | 0.25 s | From cold start: 10 min | 0.016 s | |
| SIA to FLG | 5–70 s | 60 s | 20–40 s | |||||
| Shutdown to FG | 75–120 s | 90 s | 65–90 s | From online to full power: 5 min | ||||
| SIA to FL | 50–80 s | 70 s | 25–30 s | |||||
| Shutdown to FL | 160–360 s | 230 s | 80–85 s | From full speed no load to FL: 3.33 min | ||||
| FL to FG | 90–220 s | 280 s | 25–60 s | |||||
| FG to FL | 240–500 s | 470 s | 25–45 s | From offline to FL: 4 min | ||||
| Cycles at 80% DoD | N/A | 15,000 | 200,000 | 10,000 | 1 million | |||
| Life (Years) | 20 | >25 | >20 | 25 | 16 | |||
| MRL | 10 | 9 (10) | 8 (9) | 8 (9) | 9 | |||
| TRL | 9 | 8 (9) | 7(8) | 7 (8) | 8 | |||
| Capital Cost ($/kW) | Notes | Source Year, Author(s) |
|---|---|---|
| 1176 | 44.5 MW net capacity unit | 2014, Darrow et al. [48] |
| 825 | Recommended value based on review of integrated resource planning (IRP) documents | 2014, Olson et al. [49] |
| 1193 | 40.5 MW net capacity unit | 2016, US DOE [50] |
| 1101 | 100 MW facility, 2 units | 2016, US EIA [51] |
| 678 | 237 MW single unit | 2016, US EIA [51] |
| 903–1012 | Cost of new entry (CONE) study in five US regions | 2018, Newell et al. [52] |
| 651 | Cost and performance projection for a 211 MW gas turbine power plant | 2012, Black and Veatch [28] |
| Fixed O&M ($/kW-yr) | Variable O&M ($/kWh) | Notes | Source Year, Author(s) |
|---|---|---|---|
| 9 | Recommended value based on IRP documents | 2014, Olson et al. [49] | |
| 17.50 | 0.0035 | 100 MW facility, 2 units | 2016, US EIA [51] |
| 6.8 | 0.0107 | 237 MW single unit | |
| 13.7–25.6 | 0.00425–0.00429 | CONE study in 5 US regions | 2018, Newell et al. [52] |
| 5.26 | 0.03 | Cost and performance projection for a 211 MW gas turbine power plant | Black and Veatch (2012) [28] |
| Capital Cost ($/kWh) | Notes | Source Year, Author(s) |
|---|---|---|
| $325–$700 | Includes DC-Side Modules and BMS | 2017, Lahiri [13] |
| $325–$450 | NMC system | 2016, DNV GL [11] |
| $350–$525 | LFP system | 2016, DNV GL [11] |
| $340–$450 | NMC system | 2017, Aquino et al. [12] |
| $340–$590 | LFP system | 2017, Aquino et al. [12] |
| $273 | Includes cell and pack cost only | 2017, Curry [57] |
| $285 | 2017, Watanabe [58] | |
| $540 | 2014, Wright [61] | |
| $400 | 2017, Greenspon [62] | |
| $573 | 2014, Manuel [63] | |
| $300 | Balance of system was $570/kW or $143/kWh | 2015, DiOrio et al. [64] |
| $409–$662 | 2017, DNV GL [65] | |
| $180–$520 | 2015 cost NMC | 2016, Kamath [66] |
| $180–$520 | 2015 cost NCA | |
| $300–$450 | 2015 LFP | |
| $209–$343 | Calculated from installed costs of $335–$530/kWh by subtracting PCS, grid integration and equipment, tax, fees, and G&A costs | Damato (2017) [60] |
| $209 | 2018, Morris [59] |
| Cost ($/kWh) | Component | Year | Source Year, Author |
|---|---|---|---|
| $250–300 | Pack | 2018 | 2018, Evertiq [67] |
| $200 | Pack | 2018 | 2018, Posawatz [68] |
| $209 | Pack | 2017 | 2017, Chediak [69] |
| $236 (a) | Pack | 2017 | 2018, Eckert [70] |
| $190 | Pack | 2018 | 2018, Safari [71] |
| $250 | Pack | 2016 | 2018, Safari [71] |
| $227 | Pack | 2016 | 2017, Lambert [72] |
| $200–250 | Pack | 2016 | 2016, Lacey [73] |
| Fixed O&M Cost ($/kW) | Variable O&M Cost ($/kWh) | Notes | Source Year, Author(s) |
|---|---|---|---|
| $6–$12 | $0.0003 | Excludes major maintenance cost | 2017, Lahiri [13] |
| $6–$14 | $0.0003 | Excludes major maintenance cost | 2017, Aquino et al. [12] |
| $10 | 2014, Manuel [63] | ||
| $20 | 2015, DiOrio et al. [64] | ||
| £10 | 2016, Newbery [30] |
| Cycles | Life Years | DC-DC RTE | Notes | Source Year, Author(s) |
|---|---|---|---|---|
| 2500 | 15 | 2018, May et al. [10] | ||
| 3500 | 10 | 77–85% | 2017, Aquino et al. [12] | |
| 10 | 83% | 2014, Manuel [63] | ||
| 400–1200 | 80–90% | 2017, Greenspon [62] | ||
| 9 | 89% | Based on an AC-AC RTE of 85% and 0.96 factor | Newbery (2016) [30] | |
| 5475 | 92% | 70% DoD | 2015, DiOrio et al. [64] | |
| 2000–10,000 | 15–20 | 90–98% | Not including auxiliary loads | 2016, EASE [54] |
| 87–91% | Three different battery chemistries AC-AC RTE of 83–87% | 2018, Viswanathan et al. [77] 2019, Crawford et al. [78,79] |
| Battery Capital Cost ($/kWh) | Notes | Source Year, Author(s) |
|---|---|---|
| $200–500 | $150–$350/kW for PCS, $80–120/kW BOP, $150–180/kW C&C | 2017, Aquino et al. [82] |
| $183 (a) | 100 kWh installed; 50 kWh usable. | 2015, PowerTech Systems [83] |
| $120 | 2014, Anuphjappharadorn et al. [84] | |
| $400–$700 | 2016, Kamath [66] | |
| $160–$240 | $400-$600/kWh installed. Remove PCS, BOP, and C&C costs. | 2018, May et al. [10] |
| $130–$260 (a) | For up to 10 MWh | 2016, EASE [54] |
| $240 | 12 V, >150 Ah module | Vendor specifications (b) |
| Cycles | Life Years | RTE | Source Year, Author(s) |
|---|---|---|---|
| 500 (at 50% DoD) | 5.2 | 2015, PowerTech Systems [83] | |
| 1.5–2 | 75% | 2014, Anuphjappharadorn et al. [84] | |
| 600 (at 80% DoD) | 2015, DiOrio et al. [64] | ||
| 1250 (at 80% DoD) | 2011, BAE [86] | ||
| 2000 | 15 | 79–84% | 2018, May et al. [10] |
| 600 | 2012, C&D Technologies, Inc. [87] | ||
| 1200 | 20 | 95% | 2015, C&D Technologies, Inc. [88] |
| Capital Cost ($/kWh) | Notes | Source Year, Author(s) |
|---|---|---|
| $490 | 5 kW, 20 kWh | 2018, RedT Energy Storage [89] |
| $444 | 400 Euros | 2016, Uhrig et al. [90] |
| $463 | 2016, Noack et al. [92] | |
| $730–$1200 | Includes PCS cost and $131/kWh performance guarantee | 2017, Aquino et al. [12] |
| $542–952 | After removing PCS and performance guarantee costs | 2017, Aquino et al. [82] |
| $500–$700 | 2016, DNV GL [11] | |
| $468 | 2017, Selmon and Wynne [93] | |
| $490 | 5 kW, 20 kWh | 2018, RedT Energy Storage [89] |
| $444 | 400 Euros | 2016, Uhrig et al. [91] |
| $463 | 2016, Noack et al. [92] | |
| $730–$1200 | Includes PCS cost and $131/kWh performance guarantee | 2017, Aquino et al. [12] |
| $542–952 | After removing PCS and performance guarantee costs | 2017, Aquino et al. [82] |
| $500–$700 | 2016, DNV GL [11] | |
| $468 | 2017, Selmon and Wynne [93] | |
| $435–584 | PNNL calculations–increased energy cost by 10% to account for lower DoD than the 80% DoD used for the calculations. Increased cost by 15% to account for container, DC controls, BMS. | 2014, Viswanathan et al. [34]; 2015, Crawford et al. [35] |
| $357–552 | $570-$910 for installed cost. Removed PCS, grid integration and equipment tax, fees, and G&A costs. | 2017, Damato [60] |
| $676 | Volterion stack costs including control units was 800 Euros/kW. Conversion to US dollars and using stack costs as 35% of DC system cost. | 2018, Seipp [91] |
| $488 | Volterion mid-term stack costs—mid-term was not specified, it may be assumed to be 2021 | 2018, Seipp [91] |
| $293 | Based on stack cost of $250/kW, a 69% reduction due to research & development | 2018, Seipp [91] |
| Cycles | Life Years | RTE | Source Year, Author(s) |
|---|---|---|---|
| 5000 | 14 | 65–78% | 2017, Aquino et al. [12] |
| 10,000 | 15 | 70% | 2018, May et al. [10] |
| >12,000 | 10–20 | 70–75% | 2016, EASE [54] |
| 70.5% | 2016, Uhrig et al. [90] | ||
| >10,000 | 20–30 | 75–80% | 2017, Greenspon [62] |
| 10,000 | 15 | 70% | 2018, May et al. [10] |
| Capital Cost ($/kWh) | Notes | Source Year, Author(s) |
|---|---|---|
| $500–$1000 | 4MW/16 MWh | 2017, Aquino et al. [12] |
| $400–$1000 | 2016, Kamath [66] | |
| $800–$1000 | 2016, DNV GL [11] | |
| $500 | 2011, Crowe [96] | |
| $319 | 2014, Liu et al. [97] | |
| $455 | 2014, Viswanathan et al. [34] |
| Cycles | Life Years | RTE | Source Year, Author(s) |
|---|---|---|---|
| 15 | 77% | 2016, DNV GL [11] | |
| 4500 | 15 | 77–83% | 2017, Aquino et al. [12] |
| 4000 | 10 | 77% | 2018, May et al. [10] |
| 2000–5000 | 15 | 75–85% | 2016, EASE [54] |
| Cycles | Life Years | RTE | Source |
|---|---|---|---|
| 4500 | 15 | 88% | 2018, Miraldi [99] |
| 4500 | <15 | 80–95% | 2016, EASE [54] |
| 4500 | 15 | 89% | 2015, Benato et al. [101] |
| 4000 | 10 | 75% | 2018, May et al. [10] |
| 92% | 2018, Li [100] | ||
| 3500 | 2018, Solarquotes [102] |
| Item | $/kW |
|---|---|
| Total Cost $/kW | 2640 |
| Owner’s cost | 370 |
| EPC | 390 |
| Tunnels | 135 |
| Powerhouse excavation | 80 |
| Powerhouse | 835 |
| Upper reservoir | 420 |
| Estimated lower reservoir | 420 |
| Capital Cost ($/kW) | Notes | Source Year, Author(s) |
|---|---|---|
| $1500–$4700 | 2017, Aquino et al. [82] | |
| $70–$230/kWh | 2016, Kamath [66] | |
| $2020 | $762/kW in 1985 converted to 2018 dollars using 3% escalation rate | 2018, US Bureau of Reclamation [116] |
| $250–$350/kWh | 2018, May et al. [10] | |
| $1500–$2000 | Target cost for project to be economical. Excludes transmission upgrade cost of $700/kW and civil and infrastructure cost of $460/kW | 2018, Manwaring [128] |
| $3000 | For 50 MW system | 2018, Manwaring [128] |
| $1300 | Projected cost for Eagle Mountain PSH in Southern California | 2018, Manwaring [128] |
| $1800–$3200 | Adjustable-speed PSH | 2018, Shan and O’Connor [117] |
| $2230 | 2012, Black and Veatch [28] | |
| $1500–$5100 | 2017, Damato [60] |
| Fixed O&M ($/kW-yr) | Notes | Source Year, Author(s) |
|---|---|---|
| $6.2–43.3 | 2017, Aquino et al. [82] | |
| $17.6 | 2007 costs | 2018, US Bureau of Reclamation [116] |
| $5–20 | Fixed decreases from $20/kW-yr at 200 MW to $7.5/kW-yr at 2000 MW to $5/kW-yr at 2800 MW | 2018, Uría-Martínez et al. [137]; 2018, Shan and O’Connor [117] |
| $30.8 | 500 MW plant | 2012, Black and Veatch [28] |
| Cycles | Life Years | RTE | Source Year, Author(s) |
|---|---|---|---|
| 20 | 82% | 2017, Aquino et al. [82] | |
| 20,000 | 50 | 80% | 2018, May et al. [10] |
| >20 | 70–87% | 2018, Shan and O’Connor [117] |
| Status | Shan and O’Connor (2018) [117] | General Electric (2018) [139] |
|---|---|---|
| Shutdown to online (generating mode) | 60–90 s | 220 s |
| Online generating to shutdown | 220 s | |
| Online to full-load generating | 5–15 s | 60 s |
| Shutdown to full generation | 120 s | |
| Spinning-in-air to full-load generating | 5–15 s | |
| Online to full load | 80 s | |
| Shutdown to normal pumping | 6 min | 300 s |
| Spinning-in-air to normal pumping | 60 s | |
| Full load to online | 60 s | |
| Full generation to shutdown | 250 s | |
| Full pumping to shutdown | 150 s | |
| Full load to full generation | 220 s | |
| Full generation to full load | 500 s |
| Fixed Speed | Advanced Fixed Speed | Extra Fast Fixed Speed | Adjustable Speed | Ternary with Horizontal Francis Turbine | Ternary with Horizontal Pelton Turbine | ||
|---|---|---|---|---|---|---|---|
| Source: | Shan and O’Connor (2018) [117] | GE (2018) [139] | Fisher et al. (2012) [140] | Fisher et al. (2012) [140] | Fisher et al. (2012) [140] | Fisher et al. (2012) [140] | Fisher et al. (2012) [140] |
| Shutdown to online (generating mode) | 60−90 | ||||||
| Online to full generation | 5−15 | ||||||
| Spinning-in-air to full-load generating | 5−15 | 60 | 70 | 20 | 60 | 40 | 20 |
| Shutdown to full generation | 120 | 90 | 75 | 90 | 90 | 65 | |
| Full generating to spinning-in-air | 80 | ||||||
| Full generation to shutdown | 150 | ||||||
| Shutdown to spinning-in-air | 220 | ||||||
| Spinning-in-air to shutdown | 220 | ||||||
| Shutdown to full-load pumping | 360 | 300 | 340 | 160 | 230 | 85 | 80 |
| Spinning-in-air to full-load pumping | 60 | 80 | 70 | 50 | 70 | 30 | 25 |
| Full-load pumping to spinning-in-air | 60 | ||||||
| Full pumping to shutdown | 150 | ||||||
| Full load to full generation | 220 | 190 | 90 | 280 | 60 | 25 | |
| Full generation to full load | 500 | 420 | 240 | 470 | 45 | 25 | |
| Capital Cost ($/kW) | Notes | Source Year, Author(s) |
|---|---|---|
| $2400 | 20 MW/5 MWh Beacon Power flywheel plant | Aquino et al. (2017a) [12] |
| $600 | 333 kW, 1.5 kWh system excluding installation | 2018, Goodwin [142] |
| $1050 | 1 MW, 0.0074 MWh system including installation | 2018, Lazarewicz [143] |
| Cycles | Life Years | RTE | Source Year, Author(s) |
|---|---|---|---|
| Unlimited | 20 | 70–80% | 2017, Aquino et al. [12] |
| 100,000 | 20 | 81% | 2014, Manuel [63] |
| 20 | 98% | 2017, Active Power [144] | |
| <4 million | 20 | 85–90% | 2018, Helix Power [141] |
| 20 | 86% | 2018, Goodwin [142] | |
| 85% | 2018, Stornetic [145] | ||
| 175,000–200,000 | 2017, Aquino et al. [82] |
| Vendor | kW | kWh | $/kW | Cost $ | $/kWh | E/P (h) | $/kW from Fit | $/kWh Calculated |
|---|---|---|---|---|---|---|---|---|
| Beacon [12] | 1000 | 250 | 2400 | 2,400,000 | 9600 | 0.25 | 2411 | 9645 |
| Helix [141] | 1000 | 25 | 1000 | 1,000,000 | 40,000 | 0.025 | 865 | 34,592 |
| Kinetic [142] | 999 | 4.5 | 600 | 599,400 | 133,200 | 0.004505 | 724 | 160,710 |
| Capital Cost ($/kW) | Notes | Source Year, Author(s) |
|---|---|---|
| $1105 | $590/kW in 1991 US dollars | 2017, Siemens [150] |
| $1481 | 2017, Aquino et al. [82] | |
| $1600–2300 | Includes 12 to 48 h of solution-mined storage capacity | 2017, Aquino et al. [12] |
| $1050-$1400 | 2018, Bailie [152]; 2018, Siemens [153] | |
| $1047 | 900$/kW in 2010 US dollars | 2012, Black and Veatch [28] |
| Item | Cost ($/kW) | Percent of Total Cost |
|---|---|---|
| Turbine | 270 | 30% |
| Compressor | 130 | 14% |
| Balance of Plant | 50 | 6% |
| Cavern | 50 | 6% |
| EPC | 30 | 3% |
| Owner’s cost | 360 | 40% |
| Item | Cost ($/kW) | Percent of Total Cost |
|---|---|---|
| Power island | 550–650 | 49% |
| BOP/EPC | 450–550 | 41% |
| Cavern Cost | 50–200 | 5–14% |
| E/P (h) | 10 | 16 | 20 | 30 | 40 |
|---|---|---|---|---|---|
| $/kW | 1567 | 1567 | 1567 | 1567 | 1567 |
| $/kWh for cavern | 5.1 | 4.8 | 4.7 | 4.2 | 3.8 |
| Total cost $/kW | 1618 | 1644 | 1660 | 1694 | 1720 |
| $/kWh | 162 | 103 | 83 | 56 | 43 |
| Cycles | Life Years | RTE | Notes | Source Year, Author(s) |
|---|---|---|---|---|
| 10,000 | 25 | 65% | 2018, May et al. [10] | |
| 50% | Diabatic system | 2017, Aquino et al. [12] | ||
| >30 | >70% | Adiabatic system | 2016, EASE [54] | |
| >30 | >70% | Adiabatic system | 2017, Aquino et al. [12] | |
| 54% | 2012, Gyuk [154] | |||
| 73% | 2018, Bailie [152] | |||
| 67.12% | 2016, Li et al. [155] | |||
| 69% | RTE based on heat rate of 4910 Btu/kWh for CAES | 2012, Black and Veatch [28] |
| Parameter | Value |
|---|---|
| Discount rate/weighted cost of capital | 7.6% |
| Annual O&M escalation rate | 2.5% |
| Insurance rate | 0.479% |
| Property tax rate | 0.56% |
| Federal and State income tax rate | 24.873% |
| Annual energy output | 1,772,690 kWh |
| Technology | Year | Capital Cost | BOP | PCS | C&C | O&M | Total |
|---|---|---|---|---|---|---|---|
| Sodium-sulfur | 2018 | $349 | $13 | $46 | $70 | $12 | $490 |
| 2025 | $246 | $13 | $28 | $67 | $9 | $362 | |
| Lithium-ion | 2018 | $174 | $16 | $46 | $65 | $11 | $312 |
| 2025 | $121 | $15 | $34 | $62 | $9 | $241 | |
| Lead Acid | 2018 | $405 | $39 | $136 | $274 | $11 | $866 |
| 2025 | $343 | $37 | $82 | $260 | $9 | $731 | |
| Sodium-Metal Halide | 2018 | $385 | $14 | $48 | $63 | $11 | $521 |
| 2025 | $265 | $13 | $29 | $60 | $9 | $377 | |
| Zinc-Hybrid Cathode | 2018 | $170 | $16 | $56 | $111 | $11 | $365 |
| 2025 | $123 | $15 | $34 | $105 | $9 | $287 | |
| Redox Flow | 2018 | $293 | $13 | $46 | $100 | $12 | $464 |
| 2025 | $207 | $13 | $28 | $95 | $10 | $352 | |
| Pumped Storage Hydro | 2018 | $288 | $0 | $0 | $0 | $20 | $308 |
| 2025 | $288 | $0 | $0 | $0 | $20 | $308 | |
| Compressed Air | 2018 | $182 | $0 | $0 | $0 | $21 | $203 |
| 2025 | $182 | $0 | $0 | $0 | $21 | $203 | |
| Flywheels | 2018 | $284 | $0 | $0 | $5 | $4 | $293 |
| 2025 | $284 | $0 | $0 | $0 | $4 | $288 | |
| Ultracapacitor | 2018 | $51 | $13 | $45 | $0 | $0 | $109 |
| 2025 | $51 | $12 | $33 | $0 | $0 | $96 | |
| Combustion Turbine | 2018 | $111 | $0 | $0 | $0 | $16 | $127 |
| 2025 | $111 | $0 | $0 | $0 | $16 | $127 |
| Technology | Year | Capital Cost | BOP | PCS | C&C | O&M | Total |
|---|---|---|---|---|---|---|---|
| Sodium-sulfur | 2018 | $87 | $3 | $12 | $18 | $3 | $123 |
| 2025 | $61 | $3 | $7 | $17 | $2 | $91 | |
| Lithium-ion | 2018 | $43 | $4 | $12 | $16 | $3 | $78 |
| 2025 | $30 | $4 | $8 | $15 | $2 | $60 | |
| Lead Acid | 2018 | $101 | $10 | $34 | $69 | $3 | $216 |
| 2025 | $86 | $9 | $21 | $65 | $2 | $183 | |
| Sodium-Metal Halide | 2018 | $96 | $3 | $12 | $16 | $3 | $130 |
| 2025 | $66 | $3 | $7 | $15 | $2 | $94 | |
| Zinc-Hybrid Cathode | 2018 | $43 | $4 | $14 | $28 | $3 | $91 |
| 2025 | $31 | $4 | $8 | $26 | $2 | $72 | |
| Redox Flow | 2018 | $73 | $3 | $12 | $25 | $3 | $116 |
| 2025 | $52 | $3 | $7 | $24 | $2 | $88 | |
| Pumped Storage Hydro | 2018 | $18 | $0 | $0 | $0 | $1 | $19 |
| 2025 | $18 | $0 | $0 | $0 | $1 | $19 | |
| Compressed Air | 2018 | $11 | $0 | $0 | $0 | $1 | $13 |
| 2025 | $11 | $0 | $0 | $0 | $1 | $13 | |
| Flywheels | 2018 | $2936 | $0 | $0 | $57 | $76 | $3069 |
| 2025 | $2936 | $0 | $0 | $0 | $76 | $3012 | |
| Ultracapacitor | 2018 | $6894 | $1719 | $6017 | $10 | $240 | $14,880 |
| 2025 | $6894 | $1633 | $4418 | $0 | $240 | $13,185 | |
| Combustion Turbine | 2018 | $111 | $0 | $0 | $0 | $38 | $149 |
| 2025 | $111 | $0 | $0 | $0 | $38 | $149 |
© 2020 by the authors. Licensee MDPI, Basel, Switzerland. This article is an open access article distributed under the terms and conditions of the Creative Commons Attribution (CC BY) license (http://creativecommons.org/licenses/by/4.0/).
Share and Cite
Mongird, K.; Viswanathan, V.; Balducci, P.; Alam, J.; Fotedar, V.; Koritarov, V.; Hadjerioua, B. An Evaluation of Energy Storage Cost and Performance Characteristics. Energies 2020, 13, 3307. https://doi.org/10.3390/en13133307
Mongird K, Viswanathan V, Balducci P, Alam J, Fotedar V, Koritarov V, Hadjerioua B. An Evaluation of Energy Storage Cost and Performance Characteristics. Energies. 2020; 13(13):3307. https://doi.org/10.3390/en13133307
Chicago/Turabian StyleMongird, Kendall, Vilayanur Viswanathan, Patrick Balducci, Jan Alam, Vanshika Fotedar, Vladimir Koritarov, and Boualem Hadjerioua. 2020. "An Evaluation of Energy Storage Cost and Performance Characteristics" Energies 13, no. 13: 3307. https://doi.org/10.3390/en13133307
APA StyleMongird, K., Viswanathan, V., Balducci, P., Alam, J., Fotedar, V., Koritarov, V., & Hadjerioua, B. (2020). An Evaluation of Energy Storage Cost and Performance Characteristics. Energies, 13(13), 3307. https://doi.org/10.3390/en13133307