Article

Rapid Wear Modelling in a Slurry Pump Using Soft 3D Impeller Material

Department of Mechanical Engineering, University of Alberta, Edmonton, AB T6G 1H9, Canada
*
Author to whom correspondence should be addressed.
Energies 2020, 13(12), 3264; https://doi.org/10.3390/en13123264
Submission received: 19 May 2020 / Revised: 22 June 2020 / Accepted: 22 June 2020 / Published: 24 June 2020

Abstract

:
Slurry transport systems are often limited in run length by the life of the pump internals, especially the impeller. The present work investigated abrasive wear of the impeller of a Hayward Gordon XR2(7) Torus Recessed Impeller slurry pump in a flow loop. The stock stainless steel impeller was replaced by a set of plastic test impellers with the same nominal geometry, fabricated by additive manufacturing (3D printing). A parametric set of abrasive wear experiments was conducted at five pump rotational speeds and three solid concentrations of garnet slurry in a pipe flow loop. Pump performance tests were conducted using impellers with progressive wear conditions, to investigate how a worn impeller affects hydraulic power delivery. A parabolic fit was imposed to describe the relationship between head and flow rate, and an empirical model was proposed to predict the pump head with damaged impellers. When the rotational speed is high, the damaged impeller has a larger effect on the pump’s performance than when the rotational speed is low. The head difference between the undamaged impeller and a 7.62%-mass-loss damaged impeller was 1.5 m at 1750 rpm rotational speed, however, for 850 rpm, the head difference was 1 m. Implications for pump diagnostics in other types of systems are discussed. This experiment gives a method for rapidly assessing wear locations, and provides a tool to predict wear rates on harder materials if scaling parameters are available. This first attempt at a scaling law is not reliable enough to accurately predict the wear rate for specific conditions, but shows the relative wear as a function of pertinent parameters.

1. Introduction

Centrifugal slurry pumps are widely used for the transportation of solids in mining, dredging and other industries. Slurry pump impellers are prone to failure, because curved flow streamlines inside the pump lead to both particle impingement and sliding abrasive wear. In turn, pump service life can vary depending on the slurry type, particle concentration, particle size distribution and liquid chemistry. Functional failures lead to production loss and negative environmental impacts. Improving the understanding of wear on impellers can improve predictions of the remaining useful life of pumps, which in turn allows for predictive maintenance, and enables optimization of the service life of the slurry system.
Numerical simulations of the flow field around hydraulic parts of pumps and empirical experiments are both common approaches to studying the effects of wear on the wet-end parts of pumps. Numerical analysis using computational fluid dynamics (CFD) can yield fast, approximate results; however, CFD cannot describe the actual flow and particle interaction behaviour. Particles in flow, how they approach the wall, squeeze-film effects at the wall, and how to mesh the model all affect the inertial and hydrodynamic forces on particles, and their interactions with flow, thus their modeled impact velocity. Velocity at the wall greatly influences the damage during a contact event, the number of contact events, and the overall quantitative wear rate. CFD can diagnose a worn area, but affordable CFD modelling cannot accurately quantify wear rate, due to the changes of geometry and the irregular motions of particles.
Empirical approaches, especially field experiments on actual equipment, can yield good results for the flow conditions examined; however, these methods take a long time to obtain and analyze experimental data, and an operating facility cannot practically run to failure or accept many outages to install and remove test components. Some techniques do allow for short assessment of the wear rate on a surface without running a component to failure. The multilayer paint technique, used by Wu et al. [1] Lipsett and Bhushan [2] and others, is a fast qualitative visualization method for determining the high wear regions of a turbo machine, or a stationary vessel with slurry flowing through it. Results using this method are helpful to designers interested in modifying impeller and casing geometry; however, this method can quantify the wear rate only with controlled paint layers (thickness and material properties), which is hard to standardize because of the dependence of the paint application method. As well, these results are for short-term operation only, and cannot help in finding how damaged impellers (with a geometry change over time) affect wear behavior and pump performance unless partially consumed impellers are removed from service to be prepared, reinstalled, and then replaced after a testing interval.
The parameters that affect erosive wear can be divided into four aspects: particles, materials, flow properties and the geometry of targets. Particle parameters include size or size distribution, impingement angle, and shape [3,4,5,6,7,8,9,10,11]. Relevant material properties of particles and the target wall surface include hardness and material structure [3]. The flow properties include flow rate and structure, density of flow, and solids concentration [4,6,7,12,13]. Geometry parameters, for an impeller specifically, include inlet and outlet angle, number of blades, the presence or absence of a diffuser, and other pump internal features that influence flow structure [14,15,16].
Empirical models for erosion have been proposed based on parameters that affect wear rate. Most researchers assume that wear rate has a power relationship with those parameters. Elkholy [17] developed an empirical model for cast iron, representing cases with hard and brittle materials. Gupta et al. [17] assumed an empirical model on the basis of Elkholy’s model:
E = k V m d n C q
where k, m, n, and q are empirically determined constants. Gupta et al. [18] also selected brass and mild steel for accelerated wear studies, and obtained two specific empirical equations for these two materials:
E b r a s s = 0.178 V 2.4882 d 0.291 C 0.516
E m i l d   s t e e l = 0.223 V 2.148 d 0.344 C 0.556
Finnie [19] [Equations (4)–(6)], Oka et al. [20] [Equation (7)] and Hashish [21] [Equations (8) and (9)] developed wear rate models for material loss during a wall interaction by a single particle, which depends on impact angle, particle velocity, particle size, material hardness, and other factors.
When
tan α p K 6 ,   Q v = m p V p 2 p φ K ( sin 2 α p 6 K ( sin α p ) 2
when
tan α p K 6 ,   Q v = m p V p 2 p φ K ( K ( cos α p ) 2 6 )
K is a constant defined by:
K = 3 C D ρ a 8 r ρ p
where C D is the drag coefficient.
E = ( sin α p ) n 1 ( 1 + H v ( 1 sin α p ) ) n 2 E 90
where E 90 is the erosion rate at normal angle, n 1 and n 2 . are constants which are determined by material hardness and other impact conditions, including particle properties.
Q v = 7 π m p ρ p ( V p C K ) 2.5 sin 2 α p sin α p
C K = 3 σ R f 3 / 5 ρ p
where R f is the particle roundness factor, which depends on the average diameter of particle corners to the diameter of the maximum inscribed circle.
Most studies related to slurry pump performance have investigated the effect of the properties of slurries and the geometries of wet-end pump parts on pump performance. The properties of slurry flow include the size of particles, specific gravity of solids, solids concentration, operating conditions, and the Froude number of particles [22,23,24,25,26]. Geometric parameters include the number of vanes and the shape of vanes [27,28,29]. Few studies have been reported on how damaged impellers affect pump performance, despite the importance of the relationship between the degree of damage of impellers and the pump head, as it affects system performance.
In this study, wear behavior is investigated for a semi-open impeller that runs at different steady-state duty points. The material of the manufacturer’s impeller will be replaced with a softer material, but the geometry of the impeller will not be changed. To reduce time of preparing the samples, 3D printing technology will be applied. Using these soft material samples, instead of the typical materials (hard metal) used in the production of impellers, we investigated the accelerated wear behavior of slurry pump impellers. With the damaged samples, it is also possible to find out how the damaged impellers affect pump performance.

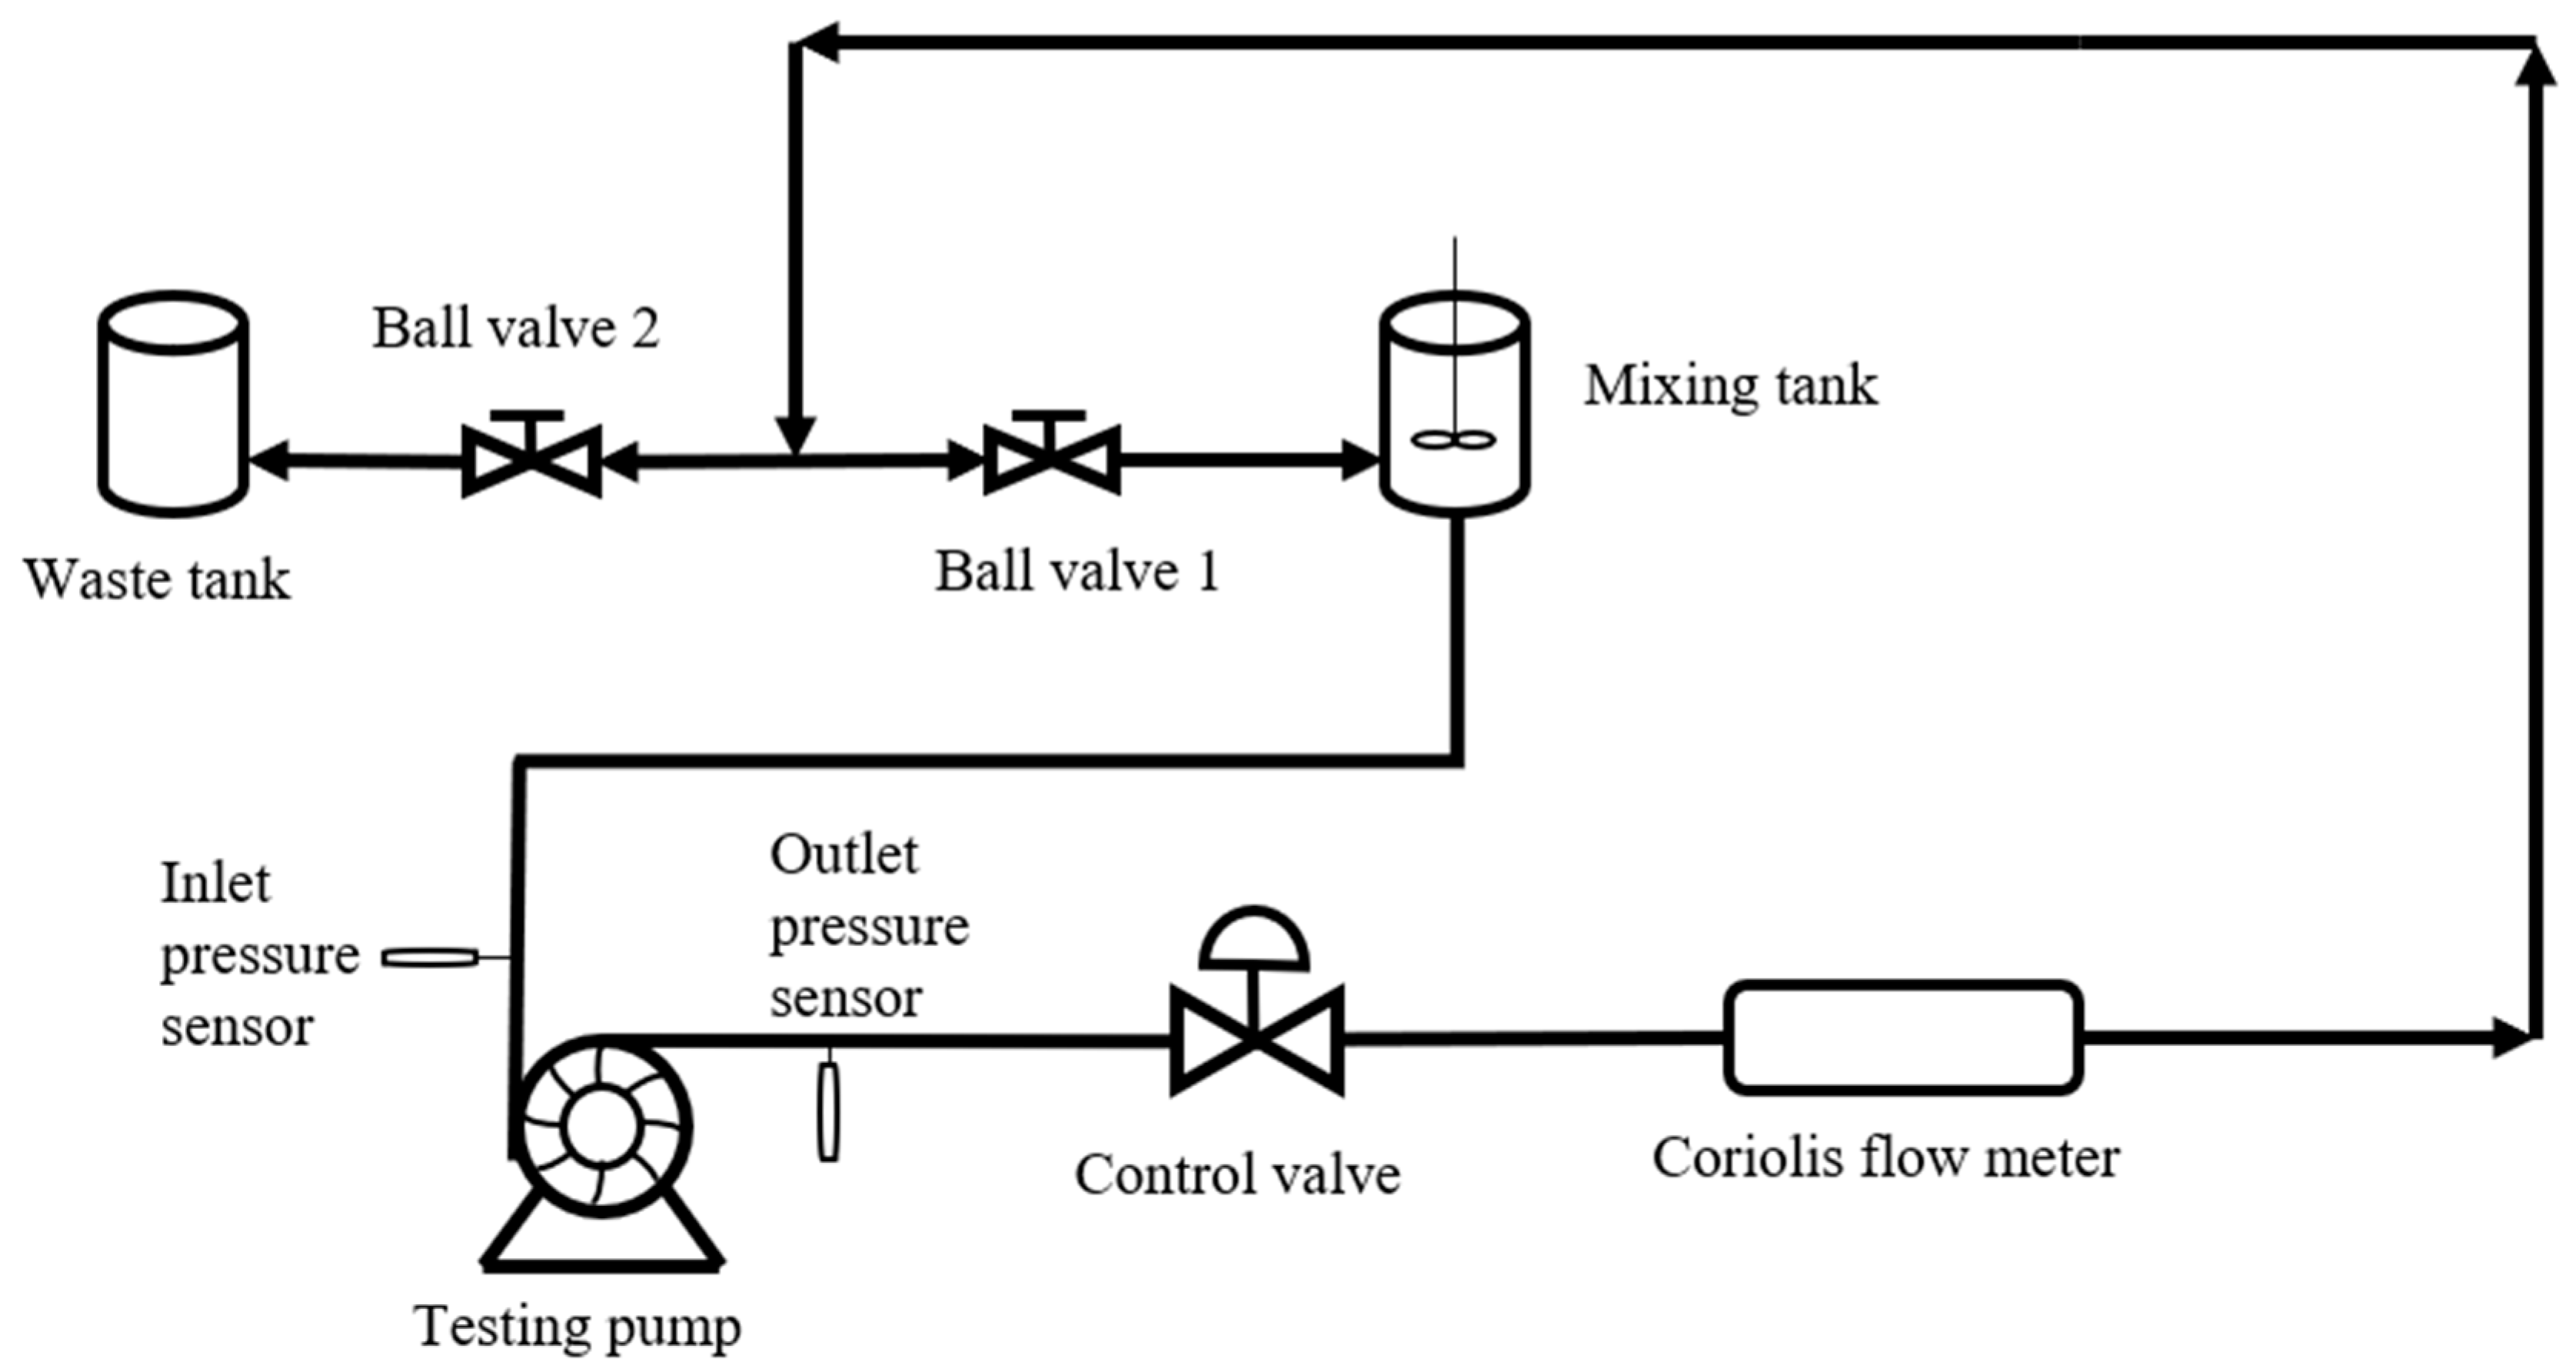
2. Experimental Development

Figure 1 shows the pipe flow loop used in this investigation. The loop is comprised of 12 m of 50-mm diameter schedule 40 steel pipe, downstream of the testing pump. Upstream of the pump, a 5.5 m rubber hose with a 76 mm inner diameter connects to 0.33 m of Schedule 40 steel pipe, with a nominal diameter of 80 mm. The flow loop also includes a bi-directional, resilient seated knife-gate valve, two ball valves, tanks for particle addition and withdrawal, and a 50 cm long transparent pipe as a viewing section. Two 200 kPa range pressure sensors (American Sensor Technologies: AST4000P00002B4E1000) are separately located near the suction and discharge side of the pump, and a Coriolis flow meter (Endress + Hauser Proline Promass 83i Coriolis meter) measures flow rate and flow temperature.
The slurry pump under test is a Hayward–Gordon XR2(7) Torus Recessed Impeller Vortex Pump (See Figure 2). This type of centrifugal pump has a semi-open impeller, which is located at the back of the casing; and it is often employed in heavy duty slurry conditions, since it allows the passage of larger solid objects in the flow. Its nominal suction size, nominal discharge size and nominal impeller diameter are 80 mm, 50 mm and 178 mm, respectively. The maximum rotational speed is 1765 rpm and the best efficiency is 44%.
The pump impeller has eight straight vanes. The height of each vane is 20 mm. The material for the manufacturer’s impeller is Ni-hard (cast iron with Ni and Cr alloy), chosen to provide wear resistance for the pump. The impeller was replaced with a set of impellers made of soft materials to give the experiments an accelerated damage accumulation rate (See Figure 3b). The shape and size of the sample impeller was the same as that of the original manufacturer.
The sample impellers were produced by additive manufacturing. After comparing samples produced by different kinds of 3D printers, a Stratasys PolyJet printer was selected to build the sample impellers. VeroGray, a rigid opaque material, was chosen to produce the samples since it is popular for prototypes and suitable for some tests under light conditions. Samples (See Figure 3) using VeroGray have smooth surfaces and accurately show features of the impeller model. This material has a proprietary composition, but its SDS characteristics indicate a modulus of elasticity of 2–3 GPa, and a Rockwell Hardness between 83 and 86, similar to polymers like polystyrene. Few voids appear in these samples, ensuring the accuracy of the weight of samples after wear tests by limiting the uptake of water, dust or small particles into the material. Post-treatment of the testing samples, included dehydrating the samples at 50 °C for 4 h, was conducted to ensure no water remained in the samples.
In this study, experiments were divided into two parts: wear tests and pump performance tests. The pump head was investigated as an indicator of pump performance. The same loop which is shown in Figure 1 was used. Firstly, after putting in a new sample impeller, pump performance tests ran for 10 rotational speeds (850 rpm, 950 rpm, 1050 rpm, 1150 rpm, 1250 rpm, 1350 rpm, 1450 rpm, 1550 rpm, 1650 rpm and 1750 rpm) with water. Secondly, after the performance tests, each wear test under different experimental conditions ran for 24 h in total. Table 1 shows the wear conditions. Finally, pump performance tests were performed with worn sample impellers. To see the relationship of mass loss and wear time, a series of wear experiments under similar wear conditions (5 g/g or 5 mass% solids mass concentration running for 24 h) were conducted on the same sample. The sample was removed, cleaned and replaced into the pump to conduct pump performance tests. Following these steps, the pump performances of sample impellers with different degrees of damage were tested.
Garnet from Sil Industrial Minerals was used as the erodent (See Figure 4). The garnet had Mohs hardness of 7–8 and specific gravity in the range of 3.75–4.3 (heavier than sand). With this kind of garnet, wear patterns on the sample impellers could be easily created and reduced the experimental time.

3. Results and Discussion

3.1. Wear Pattern Observation

Figure 5 and Figure 6 show wear patterns on the sample impeller. The eight blades have similar wear patterns. Vanes are subject to more abrasion than other areas of sample impellers. Material loss occurs at the trailing edges and intersections between the blades and the hub. According to Li et al. [11] the region near the hub experiences larger shear stress and particle impact. The suction sides of the blades experience more abrasion than the pressure sides. This observation is consistent with results from previous studies (Mehta et al. [31] Zhang et al. [32] Li et al. [11]). Worn surfaces are smooth because garnets are used as the erodent, and they have relatively large specific gravity, causing more sliding wear than impact wear. Increasing rotational speed or solids concentration can lead to more material loss, but the effect of solids concentration is smaller than the effect of rotational speed (or flow rate), which can be seen from Figure 5 and Figure 6.
Specifically, in Figure 5, the images (a), (b) and (c) show how increasing speed, keeping other variables constant, causes obvious erosion at the impeller tip where the red ovoid shows. The higher speeds result in wear, which makes the blade sharper, with a concave area near the base. In Figure 5, images (d)–(i) show both sides of the vanes with increased speed. The rate of wear evidently increases with speed, and the shape of the impeller near the hub is clearly more affected. The initial straight impeller shape is highly curved near the hub with increasing speed.
In Figure 6, similar photo angles are provided to show the effect of increasing the solids concentration. The end, front and back of the impellers are compared for 5% mass (Figure 6a,c,e) vs. 10% mass (Figure 6b,d,f). Again, it is clear, and not surprising, that wear sites are localized, and obviously indicate where there is a relatively high velocity impact of the erodent on the impeller surfaces. The quantity of mass removal is consistent with these patterns of qualitative material removal. The value of the images however, would be to assist in the design of pumps so that shape or material choice, or local hardening, could be focused in sensitive locations to significantly increase impeller life.
In conclusion, the observed eroded zone using this experimental method is similar to previous studies; however, the worn surfaces of the samples in this study are different from the hard materials that are normally used to service impellers. This may be because garnet was used as the erodent, which has a relatively large specific gravity, making impingement angles low and leading to more sliding wear than in comparable studies.

3.2. Effect of Flow Rate and Solids Concentration

Figure 7 shows the relationship between flow rate and wear rate, under two solids concentrations conditions, in log–log axes. The two curves shown each fit to three points, at 5% and 10% mass fraction, respectively. Most notable is the consistency of the fairly sparse data for the six points, showing a fairly repeatable power law exponent (2.94 for 5% and 2.52 for 10%) and a higher wear rate, as would be expected, for the higher solids fraction.
Figure 8 presents the relationship between solids concentration and wear rate at two different flow rate conditions in the log–log axes. Again, it appears that a power law relationship is loosely observed, with an exponent which decreases with flow velocity, in spite of the higher overall wear at the higher flow rate.
The relationships between solids concentration and flow rate are shown in Table 2. Table 3 presents exponents of this study and previous studies. The exponents of flow rate at two different concentrations, 5 and 10 g/g (mass%), are 2.9403 and 2.5152, respectively, which are larger than the velocity exponents of brass and mild steel in Gupta et al.’s study [18], and hard iron in Elkholy’s study [17]. According to Pool et al. [33] the velocity exponents for ductile materials should be in the range of 2 to 3, and for brittle the range of 3 to 5, in accord with our findings. Roy et al. [34] also found that the wear rate of polymer composites was much greater than that of metallic materials.
The exponents of the concentrations at rotational speeds of 1200 rpm and 1050 rpm are 0.5168 and 1.4567, respectively. Compared to previous studies (in Table 3), both of these exponents are less than those of previous studies. For now, it is hard to explain the discrepancy, implying that more experiments should be conducted to verify the results. In this study, solids concentration was deemed uniform everywhere in the entire flow loop; however, this is not representative of most applications. Although a mixer was mounted above the tank to increase particle suspension, the garnets had high specific gravity. With the suction effect upstream of the pump, particles deposited at the bottom of the pipe, affecting the experiments. Comparing the exponents of solids concentration with flow rate, it is obvious that flow rate has a dominant effect over wear rate. This conclusion can also be qualitatively verified by the wear pattern observations in Figure 5 and Figure 6.
Repeated experiments were not conducted for each possible wear condition. Wear tests under conditions of 5 g/g (mass %) and 1200 rpm rotational speed were repeated.
In this study, six data sets were obtained. Although more data could provide more definitive conclusions, the results from this this study are enough to provide informative insight that demonstrates a similarity to previous studies. In the meantime, the soft materials used to fabricate the samples, and the choice of erodent in this study, ensure the unchangeable mechanism of wear on the impellers, which also shows the value of this method.

3.3. Effect of Damaged Impeller on Pump Performance

For the performance tests, clear water was used as the carried fluid. Figure 9 shows the relationships between pump head and flow capacity for impellers damaged to different degrees and for different rotational speed, and compares these experimental data with the manufacturer’s pump performance data. The degree of damage to an impeller was calculated by percentage of mass loss of an impeller. The data were fit by a parabolic relationship, which is given by the following:
H = A Q 2 + B Q + C
where A, B and C are the coefficients, which depend on rotational speed and degree of damage of the impellers. In this case, parabolic function was chosen for its simplicity, and because it follows the typical pump characteristic curve to a reasonable extent. A higher order fit might follow the observations more closely, but it would make it more confusing to follow the effect on the coefficients. To show the effect of different degrees of damage on the impellers, it was helpful to fix coefficients A and B and let coefficient C change with different percentages of impeller mass loss. For each rotational speed from Figure 9a–j, the pump head increased with the flow rate before achieving a peak value, which occurs because circulation is produced at the suction side of the pump or in the pump volute, especially when rotational speed is low, which can affect the head on the discharge side [35]. The manufacturer’s pump head predictions are higher than the observed head in this study. The head differences between experimental data and manufacturer’s data increased as the flow rate increasing. Several reasons caused the head differences in the experimental data and manufacturer’s data. The polymer impellers and different test loops that were used in this experiment may have influenced the pump performance. It should be noted that the testing pump in this study was used for some years, which may have caused head losses.
The change of coefficient C (constant) with different percentages of mass loss is the effect one would observe if erosion simply shifted the entire pump characteristic curve down, and this is a first guess as to what pump wear might do to performance. Using the least-squares regression method to consider the percentage of mass loss and rotational speed, an empirical model was assumed, which is given by the following:
C = a T + b e c M L
where a, b and c are the coefficients which depend on the properties of the impeller. T is the pump’s rotational speed. The reason why we chose an exponential model to describe the relationship between the percentage of mass loss and the coefficient C is that pump head loss is assumed to be stable after a certain damage degree. In the case of fixing the imposed parabolic coefficients A and B and allowing coefficient C to be varied, the specific empirical model, on the basis of Equation (3), is as follows:
C = 0.01 T 7.89 e 1.22 M L
The R2 value is 0.987.
In this study, a new experimental approach is proposed that ensures a reasonable acceleration of the wear rate with a wear mechanism similar to normal conditions, which quantifies the wear pattern and the wear rate at the same time. A parametric study was conducted into how solids concentration and flow rate affect wear. The experimentally determined exponents for solids concentrations and flow rate are larger than those found by others in studies using hard materials. Flow rate has a dominant effect on wear rate, as expected, due to the influence on particle incident velocity and on the rate of collision with the impeller. Characteristic head curves showing pump performance after wear illustrate clearly the important effects. Few studies have considered how damaged impellers affect the pump head; however, this method allowed a low-cost investigation, from which a preliminary empirical model was found to estimate the head of a pump with a damaged impeller. This model has the potential to be a guide for industrial applications, and additional work should consider other pump types and flow conditions.

4. Conclusions and Future Work

A method has been developed and demonstrated to estimate the performance curve of a pump with a damaged impeller, by comparing percentage of mass loss over a period of time with the corresponding steady-state operating condition of a slurry pumping system. For an impeller with a particular material and shape, a quadratic curve can be fit to the manufacturer’s pump head curve; our results illustrate an estimate for the derating of the pump performance as a function of wear [Equation (11)]. In this way, pump head curves can be obtained by knowing the percentage of mass loss and rotational speed for the type of pump studied.
Replacing a manufacturer’s impeller with a soft material impeller can yield reasonable similarity to normal conditions. This approach assumes that the impeller material does not affect the distribution of particle contacts. The contact distribution will depend on how the particles exit streamlines to contact the impeller, which depends on the particle properties in a given flow field, including particle density, size distribution and geometry, as well as how the impeller speed and geometry affect the flow, and fluid properties, such as density, viscosity and the particle concentration. This method recognizes that the damage accumulation rate will depend on parameters such as relative hardness between the particles and impeller, as well as particle asperities, and so the present work should not be applied directly to other configurations, but rather be used as a method for testing. The results using a soft material impeller are consistent with previous studies using harder materials, under the conditions observed, which indicates that the method is useful for determining where abrasive wear will appear, and gives insights into the relative severity of the wear. This experimental method for testing the effect of accelerated wear on performance saves time and cost, compared to long-term studies using more wear resistant materials. The key observations are:
(1)
The highest rate of mass loss occurs at the trailing edges of the blades and intersections between the blades and hub.
(2)
From the observation of the wear patterns and parametric studies on solids concentration and flow rate, the effect of flow rate is dominant.
(3)
Using soft materials to produce samples increases wear rate, which makes exponents of parameters larger than in field studies using harder materials.
(4)
Damaged impellers affect pump performance, and the relationship between pump head and the degree of damage to impellers can be predicted for an impeller with particular shape and material. We have developed a novel and simple method to characterize the observed derate, which could be developed to harder materials to provide useful estimates of future deratings in design and operation. The estimate that head performance derate is a function of mass loss alone is reasonably valid.
Initial attempts to run these experiments with silica sand did not produce wear at a high enough rate to make this method feasible. This illustrates the importance of relative hardness between the impeller and the particle in the damage mechanisms. Future work should examine the effect of the ratio of particle hardness with respect to impeller hardness.
To make this test method more industrially useful, a comparative assessment should be made between the results from laboratory-scale and results from field tests, to determine the similarity between these results. For an empirical model to predict damaged impeller pump curves, more experiments should be conducted with different types of impellers, and they should cover a wider range of operating conditions, with a non-dimensional family of damaged pump curves that will allow for comparative assessment. In future, families of curves may yield insights into the design of impellers, as well as material selection for wear rate optimization by manufacturers and maximum run length by process operators.

Author Contributions

C.J. conducted the experiments and preliminary analysis, and wrote most of the manuscript. B.A.F. led the investigation of the effect on turbomachinery performance. M.G.L. led the investigation into the experimental effects of damage. All authors have read and agreed to the published version of the manuscript.

Funding

This research was funded by the Natural Sciences and Engineering Council of Canada (BAF to give details here.)

Conflicts of Interest

The authors declare no conflict of interest.

Nomenclature

Roman Symbols
CConcentration (kg/kg)
C D Drag coefficient
DDiameter of particle (m)
EWear rate (kg/s)
HPump head (m)
H v Initial material hardness (N/mm2)
MLPercentage of mass loss for an impeller (%)
m p Mass of a single particle (kg)
pConstant plastic flow stress when particle impacting wall
QFlow capacity (m3/h)
Q v Volume loss of material removed by a single particle (m3)
R f Particle roundness factor
rParticle radius (m)
TRotational Speed (rpm)
VFlow velocity (m/s)
V p Particle velocity (m/s)
Greek Letters
α p Angle of particles striking the surface (rad)
ρ a Density of air (kg/m3)
ρ p Particle density (kg/m3)
σ Material flow stress (Pa)
φ Ratio of depth of particle contact surface and the depth of the cut

References

  1. Wu, J.; Ngyuen, B.; Graham, L.; Zhu, Y.; Kilpatrick, T.; Davis, J. Minimizing impeller slurry wear through multilayer paint modelling. Can. J. Chem. Eng. 2005, 83, 835–842. [Google Scholar] [CrossRef]
  2. Lipsett, M.G.; Bhushan, V. Modeling erosion wear rates in slurry flotation cells. J. Fail. An. Preven. 2011, 12, 51–65. [Google Scholar] [CrossRef]
  3. Walker, C.I. Slurry pump side-liner wear: Comparison of some laboratory and field results. Wear 2001, 250, 81–87. [Google Scholar] [CrossRef]
  4. Chandel, S.; Singh, S.N.; Seshadri, V. Experimental study of erosion wear in a centrifugal slurry pump using coriolis wear test rig. Particul. Sci. Technol. 2012, 30, 179–195. [Google Scholar] [CrossRef]
  5. Arabnejad, H.; Mansouri, A.; Shirazi, S.A.; McLaury, B.S. Development of mechanistic erosion equation for solid particles. Wear 2015, 332, 1044–1050. [Google Scholar] [CrossRef]
  6. Zhong, Y.; Minemura, K. Measurement of erosion due to particle impingement and numerical prediction of wear in pump casing. Wear 1996, 199, 36–44. [Google Scholar] [CrossRef]
  7. Shen, Z.J.; Li, R.N.; Han, W.; Zhao, W.G.; Wang, X.H. The research on particle trajectory of solid-liquid two-phase flow and erosion predicting in screw centrifugal pump. In Proceedings of the IOP Conference Series: Materials Science and Engineering, Hangzhou, China, 18–21 October 2015; Volume 129, pp. 12–52. [Google Scholar]
  8. Nguyen, V.B.; Nguyen, Q.B.; Zhang, Y.W.; Lim, C.Y.M.; Khoo, B.C. Effect of particle size on erosion characteristics. Wear 2016, 348, 126–137. [Google Scholar] [CrossRef]
  9. Dong, X.; Zhang, H.; Wang, X. Finite Element Analysis of wear for centrifugal slurry pump. In Proceedings of the 6th International Conference on Mining Science & Technology, Procedia Earth and Planetary Science, Xuzhou, China, 18–20 October 2009. [Google Scholar]
  10. Tian, H.H.; Addie, G.R.; Pagalthivarthi, K.V. Determination of wear coefficients for erosive wear prediction through Coriolis wear testing. Wear 2005, 259, 160–170. [Google Scholar] [CrossRef]
  11. Yoganandh, J.; Natarajan, S.; Kumaresh Babu, S.P. Erosive wear behavior of nickel-based high alloy white cast iron under mining conditions using Orthogonal Array. J. Mater. Eng. Perform. 2013, 22, 2534–2541. [Google Scholar] [CrossRef]
  12. Li, Y.; Zhu, Z.; He, Z.; He, W. Abrasion characteristic analyses of solid-liquid two-phase centrifugal pump. J. Therm. Sci. 2011, 20, 283. [Google Scholar] [CrossRef]
  13. Pagalthivarthi, K.V.; Gupta, P.K. Prediction of erosion wear in multi-size particulate flow through a rotating channel. Fluid Dyn. Mater. Process. 2009, 5, 93–122. [Google Scholar]
  14. Fort, I.; Jirout, T. The relation between the rate of erosion wear of a pitched blade impeller and its process characteristics. Chem. Eng. Res. Des. 2011, 89, 1929–1937. [Google Scholar] [CrossRef]
  15. Wei, L.; Shi, W.; Jiang, X.; Chen, B.; Wu, Y. Analysis on Internal Solid-liquid Two-phase Flow in the Impeller of Sewage Pump. Proc. Eng. 2012, 31, 170–175. [Google Scholar] [CrossRef] [Green Version]
  16. Varley, F.A. Effects of impeller design and surface roughness on the performance of centrifugal pumps. Proc. Inst. Mech. Eng. 1961, 175, 955–989. [Google Scholar] [CrossRef]
  17. Elkholy, A. Prediction of abrasion wear for slurry pump materials. Wear 1983, 84, 39–49. [Google Scholar] [CrossRef]
  18. Gupta, R.; Singh, S.N.; Sehadri, V. Prediction of uneven wear in a slurry pipeline on the basis of measurements in a pot tester. Wear 1995, 184, 169. [Google Scholar] [CrossRef]
  19. Finnie, I. Erosion of surface by solid particles. Wear 1960, 3, 87–103. [Google Scholar] [CrossRef]
  20. Oka, Y.I.; Okamura, K.; Yoshida, T. Practical estimation of erosion damage caused by solid particle impact: Part 1: Effects of impact parameters on a predictive equation. Wear 2005, 259, 95–101. [Google Scholar] [CrossRef]
  21. Hashish, M. A model for abrasive-waterjet (AWJ) machining. J. Eng. Mater. Technol. 1989, 111, 154–162. [Google Scholar] [CrossRef]
  22. Gandhi, B.K.; Singh, S.N.; Seshadri, V. Effect of speed on the performance characteristics of a centrifugal slurry pump. J. Hydraul. Eng. 2002, 128, 225–233. [Google Scholar] [CrossRef]
  23. Noon, A.A.; Kim, M. Erosion wear on centrifugal pump casing due to slurry flow. Wear 2016, 364, 103–111. [Google Scholar] [CrossRef]
  24. Kumar, S.; Gandhi, B.K.; Mohapatra, S.K. Performance characteristics of centrifugal slurry pump with multi-sized particulate bottom and fly ash mixtures. Particul. Sci. Technol. 2014, 32, 466–476. [Google Scholar] [CrossRef]
  25. Burgess, K.E.; Reizes, J.A. The effect of sizing, specific gravity and concentration on the performance of centrifugal slurry pumps. Proc. Institut. Mech. Eng. 1976, 190, 391–399. [Google Scholar] [CrossRef]
  26. Walker, C.I.; Goulas, A. Performance characteristics of centrifugal pumps when handling non-Newtonian homogeneous slurries. Proc. Institut. Mech. Eng. Part A Power Process. Eng. 1984, 198, 41–49. [Google Scholar] [CrossRef]
  27. Walker, C.F.; Wells, P.J.; Pomat, C. The Effect of Impeller Geometry on the Performance of Centrifugal Slurry Pump. In Proceedings of the 4th International Conference on Bulk Materials, Storage, Handling and Transportation: 7th International Symposium on Freight Pipelines, Institution of Engineers, Wollongong, Australia, 6–8 July 1992. [Google Scholar]
  28. Cellek, M.S.; Engin, T. Parametric investigation of a centrifugal slurry pump while handling clear water. J. Therm. Sci. Technol. 2016, 36, 19. [Google Scholar]
  29. Roco, M.C.; Marsh, M.; Addie, G.R.; Maffett, J.R. Dredge pump performance prediction. J. Pipelines 1986, 5, 171–190. [Google Scholar]
  30. Jiang, C. Investigating Impeller Wear and Its Effect on Pump Performance. Master’s Thesis, University of Alberta, Edmonton, AB, Canada, 2019. [Google Scholar]
  31. Mehta, M.; Kadambi, J.R.; Sastry, S.; Sankovic, J.M.; Wernet, M.P.; Addie, G.; Visintainer, R. Particle Velocities in the Rotating Impeller of a Slurry Pump. In Proceedings of the 5th Joint Fluids Engineering Conference, Fluids Engineering Division, San Diego, CA, USA, 30 July–2 August 2007. [Google Scholar]
  32. Zhang, Y.; Li, Y.; Cui, B.; Zhu, Z.; Dou, H. Numerical simulation and analysis of solid-liquid two-phase flow in centrifugal pump. Chin. J. Mech. Eng. 2013, 26, 53–60. [Google Scholar] [CrossRef]
  33. Pool, K.V.; Dharan, C.K.H.; Finnie, I. Erosive wear of composite materials. Wear 1986, 107, 1–12. [Google Scholar] [CrossRef]
  34. Roy, M.; Vishwanathan, B.; Sundararajan, G. The solid particle erosion of polymer matrix composites. Wear 1994, 171, 149–161. [Google Scholar] [CrossRef]
  35. Karassik, I.J. Centrifugal pump operation at off-design conditions. Chem. Proce. 1987, 157–158. [Google Scholar]
Figure 1. Experimental pipe loop setup.
Energies 13 03264 g001
Figure 2. Test pump (From Hayward–Gordon Company).
Energies 13 03264 g002
Figure 3. (a) VeroGray sample impeller, (b) Sample impeller on the workbench.
Energies 13 03264 g003
Figure 4. Magnified view of garnets on 5 mm square grid. The garnet size and roundness evolved during experiments so that fresh garnet had to be replaced in the system regularly. The observed rate of material removal was linear over the 110 h of testing [30].
Energies 13 03264 g004
Figure 5. Wear patterns after different rotational speeds with 5 g/g (5 mass%) and 24 h: (a) 1200 rpm, worn surface at the end of blades; (b) 1500 rpm, worn surface at the end of blades; (c) 1750 rpm, worn surface at the end of blades; (d) 1200 rpm, worn surface at suction side; (e) 1500 rpm, worn surface at suction side; (f) 1750 rpm, worn surface at suction side; (g) 1200 rpm, worn surface at pressure side; (h) 1500 rpm, worn surface at pressure side; (i) 1750 rpm, worn surface at pressure side.
Energies 13 03264 g005
Figure 6. Wear patterns after different solids concentration with 1200 rpm and 24 h: (a) 5 g/g (5 mass%), worn surface at the end of blades; (b) 10 g/g (10 mass%), worn surface at the end of blades; (c) 5 g/g (5 mass%), worn surface at suction side; (d) 10 g/g (10 mass%), worn surface at suction side; (e) 5 g/g (5 mass%), worn surface at pressure side; (f) 10 g/g (10 mass%), worn surface at pressure side.
Energies 13 03264 g006
Figure 7. The relationship of wear rate and flow rate for different solids concentrations [5 g/g (5 mass%) and 10 g/g (10 mass%)] in log–log axes.
Energies 13 03264 g007
Figure 8. The relationship between wear rate and solids concentration for different rotational speeds (1050 rpm and 1200 rpm) in log–log axes.
Energies 13 03264 g008
Figure 9. Pump head curves of damaged impellers for different rotational speed with water carried: (a) 850 rpm; (b) 950 rpm; (c) 1050 rpm; (d) 1150 rpm; (e) 1250 rpm; (f) 1350 rpm; (g) 1450 rpm; (h) 1550 rpm; (i) 1650 rpm; (j) 1750 rpm.
Energies 13 03264 g009aEnergies 13 03264 g009b
Table 1. Wear tests conditions.
Rotational Speed (rpm)Solids Concentration [g/g (mass%)]
10505%
10%
15%
12005%
10%
15%
135010%
15005%
17655%
Table 2. The effect of solids concentration and flow rate on wear rate.
Parameters That Affect Wear RateRelationship
5 g/g (5 mass%) solids concentration E = 9.2 × 10 6 V 2.94
10 g/g (10 mass%) solids concentration E = 2.38 × 10 5 V 2.52
1200 rpm rotational speed E = 6.12 × 10 4 C 0.517
1050 rpm rotational speed E = 2.43 × 10 3 C 1.52
Table 3. Exponents of solids concentration and flow velocity in previous studies and this study.
StudiesExponents of VelocityExponents of Concentration
Gupta et al. [18]:
Brass
Mild steel

2.4882
2.148

0.516
0.556
Elkholy [17] (Cast iron)2.390.682
Pool et al. [33]:
Ductile polymer
Brittle polymer

2–3
3–5
N/A
This work (VeroGray)2.72781.0161

