Article

Load Curtailment Optimization Using the PSO Algorithm for Enhancing the Reliability of Distribution Networks

1
Department of Electric and Electronic Engineering, Universidad Nacional de Colombia, Bogotá 111321, Colombia
2
Advanced Power and Energy Center, Electrical Engineering and Computer Science, Khalifa University, Abu Dhabi 127788, UAE
*
Author to whom correspondence should be addressed.
Energies 2020, 13(12), 3236; https://doi.org/10.3390/en13123236
Submission received: 28 April 2020 / Revised: 6 June 2020 / Accepted: 16 June 2020 / Published: 22 June 2020

Abstract

:
Power systems are susceptible to disturbances due to their nature. These disturbances can cause overloads or even contingencies of greater impact. In case of an extreme situation, load curtailment is considered the last resort for reducing the contingency impact, its activation being necessary to avoid the collapse of the system. However, load shedding systems seldom work optimally and cause either excessive or insufficient reduction of the load. To resolve this issue, the present paper proposes a methodology to enhance the load curtailment management in medium voltage distribution systems using Particle Swarm Optimization (PSO). This optimization seeks to minimize the amount of load to be cut off. Restrictions on the optimization problem consist of the security operation margins of both loading and voltage of the system elements. Heuristic optimization algorithms were chosen, since they are considered an online basis (allowing a short processing time) to solve the formulated load curtailment optimization problem. Best performances regarding optimal value and processing time were obtained using a PSO algorithm, qualifying the technique as the most appropriate for this study. To assess the methodology, the CIGRE MV distribution network benchmark was used, assuming dynamic load profiles during an entire week. Results show that it is possible to determine the optimal unattended power of the system. This way, improvements in the minimization of the expected energy not supplied (ENS) as well as the System Average Interruption Frequency Index (SAIDI) at specific hours of the day were made.

Graphical Abstract

1. Introduction

The energy dependence of modern societies requires power grids to fulfill high levels of reliability, availability, quality, security, among others. However, electric systems are susceptible to failures due to their size and complexity. Major failures commonly occur at generation and transmission level. Nevertheless, the distribution level, which is the final link between the power generation system and the final user, is considered part of the grid that most frequently endures outages [1]. In order to avoid outages and the collapse of the whole distribution system, the load curtailment is contemplated as an option [2]. There are three main situations in which load shedding is activated: when frequency falls under unsafe conditions, in case of voltage instability [3] and when the loading of assets such as transformers or lines are outside security margins.
Whenever load curtailment is employed, it is aimed at minimizing the impact on the users, since energy shortage can cause adverse effects on electronic equipments, industrial level productions, telecommunications, among others. In addition, quality index such as System Average Interruption Duration Index ( S A I D I ) and System Average Interruption Frequency Index ( S A I F I ) are impacted by service interruption. In this way, an optimization of load curtailment is convenient in order to maximize the amount of power supplied to users during a contingency. Therefore, a reduction in the time without service that the final user experiences is expected, avoiding excessive or insufficient load cut off. This optimization can thus reduce the impact for the user as well as for the distribution operator of the system.
Regulations and standards of different countries establish penalties for network operators who do not comply with conditions of service quality as well as incentives to create mechanisms that improve it. Energy distribution companies can be monetarily penalized if they do not provide the minimum quality standards, such as long-term blackout requirements, or do not comply with the parameters of reliability established by xthe standards. For example, in Australia, it is stipulated that the distribution operator shall make payments to customers who experience interruptions. These payments range from 100 to 200 dollars for frequency interruptions of 9 to 15 times and payments from 100 to 605 dollars for interruptions of 12 h –48 h [4]. In England, Wales, and Scotland, it is stipulated that, if the electricity supply fails, the distributor refund £54 to the consumer if it is a domestic consumer, or £108 if it is a business consumer [5]. In the United States, one of the most recent penalties was introduced by the North American Electric Reliability Corporation (NERC) to the company Avangrid Networks Inc., which supplies power to around 2.2 million customers. Avangrid was fined 450,000 dollars for failing to meet reliability standards set forth by NERC [6]. The European Union manages quality service based on incentives. For instance, the avoidance of an outage of only half an hour in customer minutes could be worth as much as 0.5 percent of the total value of the electricity sold in the year [7].
Recently, given the penetration of microgrids, control strategies to optimize the scheduling and curtailment of load as well as generation are addressed by taking advantage of microgrid control [8,9], demand response strategies [10], and economic issues [11,12]. However, characteristics such as market prices, smart metering, and distributed generation control are not available, impeding the implementation of these strategies in most of the conventional distribution systems.
In recent years, different research studies focusing on distribution networks have been published in order to reduce penalties, generate new incentives, and improve the quality of energy services, making them more reliable by ensuring their optimal operation. A review of optimal operation of smart distribution networks is presented in [13,14]. Nonetheless, most active network management schemes such as coordinated voltage control, reactive power compensation, generation curtailments, among others, are not available in the prevalent distribution networks. In fact, the common scheme to operate conventional distribution networks during contingencies is the centralized control of load curtailment. For this reason, the entire system should be prepared to follow a procedure to minimize the impact of the interruption in any possible scenario of contingency, given a load forecast demand. Additionally, these mentioned curtailment proposals, when they are solved with traditional solvers (GAMS/GUROBI/CPLEX/MINLP), demand a high processing time to get the optimal point [15,16,17]. This indicates that heuristic techniques are an alternative to solve this problem when an online basis is required.
In view of the above concerns, this article presents a practical methodology to optimize load curtailment during a contingency through load forecasting applied to conventional distribution networks. This seeks to reduce the contingency impact on both the SAIDI index and the expected energy not supplied by using a centralized control. This methodology formulates an optimization problem considering the security margins of the network and the expected contingency behavior during an entire day and assuming a load forecasting for each load. The result is the minimization of load curtailment per hour during the day for each load of the system. The optimization is performed trough the Particle Swarm Optimization algorithm (PSO). This procedure is suitable for real-time operation during contingencies as well as for long-term planning of conventional distribution networks, providing an optimal load shedding strategy and identifying contingencies of high impact on the reliability indexes. The main contributions of this paper are listed below:
  • A Fourier series is used to fit the load forecast hourly and during the week days;
  • A simple formulation to optimize load curtailment during contingencies is proposed in order to enhance the reliability of conventional distribution systems;
  • A practical implementation taking into account the conventional operator resources with limited information is suggested.
The paper consists of the following sections: Section 2 presents the background on load curtailment optimization methods; Section 3 addresses the proposed procedure based on the PSO method; Section 4 presents the assessment of the procedure with the CIGRE MV distribution network benchmark; Finally, Section 5 presents the conclusions.

2. Background

2.1. Load Curtailment Methods

Factors that force a power system to load shed are mostly related to frequency and voltage system issues. Because of this, load shedding is classified into two groups: under frequency load shedding (UFLS) and under voltage load shedding (UVLS) [18], the ULVS being the most common. To illustrate those concepts, an agent-based scheme is proposed for UFLS in [19].
Different meta-heuristic methods based on the aforementioned schemes have been developed to optimize load shedding. According to [20], meta-heuristic methods such as PSO, Evolutionary Programming (EP), Quantum Inspired Evolutionary Programming (QIEP), Genetic Algorithm (GA), and others, have been adapted to problems of UVLS scheme, including the optimum minimum amount of load curtailment, the optimum location to shed, and the timing of load shedding. Most of these methods have one or more of the following objective-focused functions to minimize: costs of load loss, amount of load to be shed, time of shedding, and location of the optimum point in the system where shedding should be performed [21]. For example [20], a minimum amount of load to be shed by locating the optimum point of shedding can be deduced through GA. Using PSO, an optimal overall solution of the system can be obtained by minimizing load shedding and maintaining the stability margins in the system. Finally, QIEP provides the lowest amount of load shedding in all the cases evaluated.
At the distribution level, new techniques are proposed for optimal load shedding. However, most of these proposals consider smart grids operating in islanded mode [22], with distributed generation, frequency control, and generation curtailment, among other technologies. For instance, in [23], energy storage is considered to improve system reliability. In [24], a hierarchical shedding strategy to recover frequency and voltage in microgrids is proposed. Consequently, this load shedding method increases both frequency and voltage stability of the system. To solve some of the objective functions previously described, meta-heuristic techniques are commonly used [25]. In [26], an optimal load shedding scheme using meta-heuristic techniques for frequency and voltage stability is proposed. In [27], islanded operation of distribution grids with distributed generation is studied: a procedure is proposed to optimize system reliability indices, such as SAIDI and SAIFI, during load shedding through GA. According to [20], PSO presents numerous advantages compared to other meta-heuristic algorithms, such as a simpler implementation, smaller computational burden, and faster convergence. Therefore, PSO is suitable for solving several load shedding problems.
However, most of the aforementioned load shedding techniques are focused on frequency and voltage recovery, or both, during disturbances in microgrids. It is worth noting that, for conventional distribution networks, load curtailment strategies for security operation that optimize the reliability of the system during long-term contingencies are limited. According to the taxonomy presented in [13], an active network management scheme that uses the load curtailment as control variable, in order to minimize the impact of a contingency on the power reliability index, is not addressed. Consequently, this work focuses on optimizing load curtailment during contingencies, using a PSO algorithm based on a short-term load forecasting, in order to enhance the reliability of conventional distribution systems. This metha-heuristic method was selected based on the following concerns: the number of variables to optimize (power to be shed for each load), the complexity of solving AC power flows in distribution systems, and the number and type of restrictions of the problem to be solved, such as loading of transformers and lines, and voltage security margins.

2.2. Particle Swarm Optimization Algorithm

The Particle Swarm algorithm was initially developed by Kennedy, Eberhart, and Shi in their article “Particle Swarm Optimization” published in 1995 [28,29]. Its operation is based on the behavior of swarms of birds and fishes in which the movement of an individual results from combining the particular decisions of each individual in the swarm. To establish the algorithm, a series of steps is taken [30]:
  • Establish the number of individuals in the swarm. Each individual must have information on its position, value, speed, where it is traveling to, and a record of the best position where it has been;
  • Evaluate each individual or particle with the objective function;
  • Update the position and speed of each particle;
  • If the results do not comply with the optimization criteria established in the objective function and its restrictions, return to step 2 cyclically until convergenced is achieved.
At each iteration, as new and better positions are discovered, the movement of the swarm is actualized. The convergence of the method does not ensure the best results since this convergence can refer either to the best known global position or to the confluence of the swarm towards at a specific point in the space, whether optimal or not [31].

2.3. Reliability Index SAIDI

According to IEEE Std 1366-2003 [32], S A I D I index indicates the total duration of interruption for the average customer during a predefined period of time. It is commonly measured in customer minutes or customer hours of interruption. Equation (1) is used to calculate this index, where t i is the duration of each interruption, U i is the number of users affected by each interruption, n is the number of interruptions during a given period of time, and N is the total number of users of the system:
S A I D I = i = 1 n t i × U i N

3. Proposed Procedure for Load Shedding Optimization

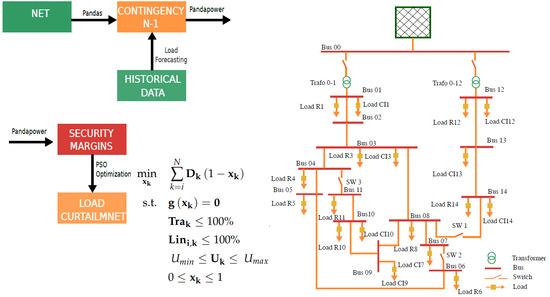
This section addresses the procedure for load shedding optimization based on a short-term load forecasting. Figure 1 shows the methodology proposed. On the one hand, the procedure begins with net data input to model the system in order to run load flows. On the other hand, load values are estimated by fitting historical data through Fourier series [33]. Using network and load forecasting model, contingencies are simulated disconnecting assets and running load flows to estimate both overloads and voltages outside the security margins. Based on the contingency assessment, the load shedding optimization algorithm is executed for each hour of the day in order to maintain loading and voltages within the security limits during the system operation.
The security margins established are the overload of both transformers and lines, and the voltage limits in buses. When these limits are exceeded, the system is considered at risk and therefore load curtailment should be performed. However, an optimization of load shedding should be performed in order to minimize the power to be shed to the users hourly while the system operates inside security margins. The formulation of the optimization problem is as follows:
min x k k = i N D k 1 x k s . t . g x k = 0 Tra k 100 % Lin i , k 100 % U m i n U k U m a x 0 x k 1 ,
where i , k are the buses of the system; g x k = 0 are the balance equations (power flow equations); N is the number of buses with loads; x k is the load shedding factor at bus k, being 0 total disconnection and 1 no power cut off; D k is the load required at bus k; Tra k is the loading of transformer connected at bus k; Lin i , k is the loading of line between i , k buses; and U k is the set of bus voltages. In this way, in order to solve this non-convex problem in an online basis (short processing times), it is not possible to use commercial solvers. On the contrary, heuristic techniques are well adapted in such case [15].
To optimize load curtailment, this paper proposes the use of PSO algorithm. PSO optimizes the load curtailment by allocating the amount of power to disconnect per load if required. PSO was selected as the method to optimize load shedding because of its simple implementation, fast convergence, and adaptability to the problem. To summarize, Figure 2 shows the proposed algorithm for load curtailment optimization considering the operating security margins, where t k is the hour to assess and x k is the vector with the load factor to cut off.

4. Load Shedding Algorithm Assessment

A simulation using the CIGRE medium voltage distribution network benchmark [35] was performed in order to evaluate the proposed methodology for load curtailment optimization. The simulation was executed by implementing the algorithm shown in Figure 2 into a Python script.

4.1. Simulation Description

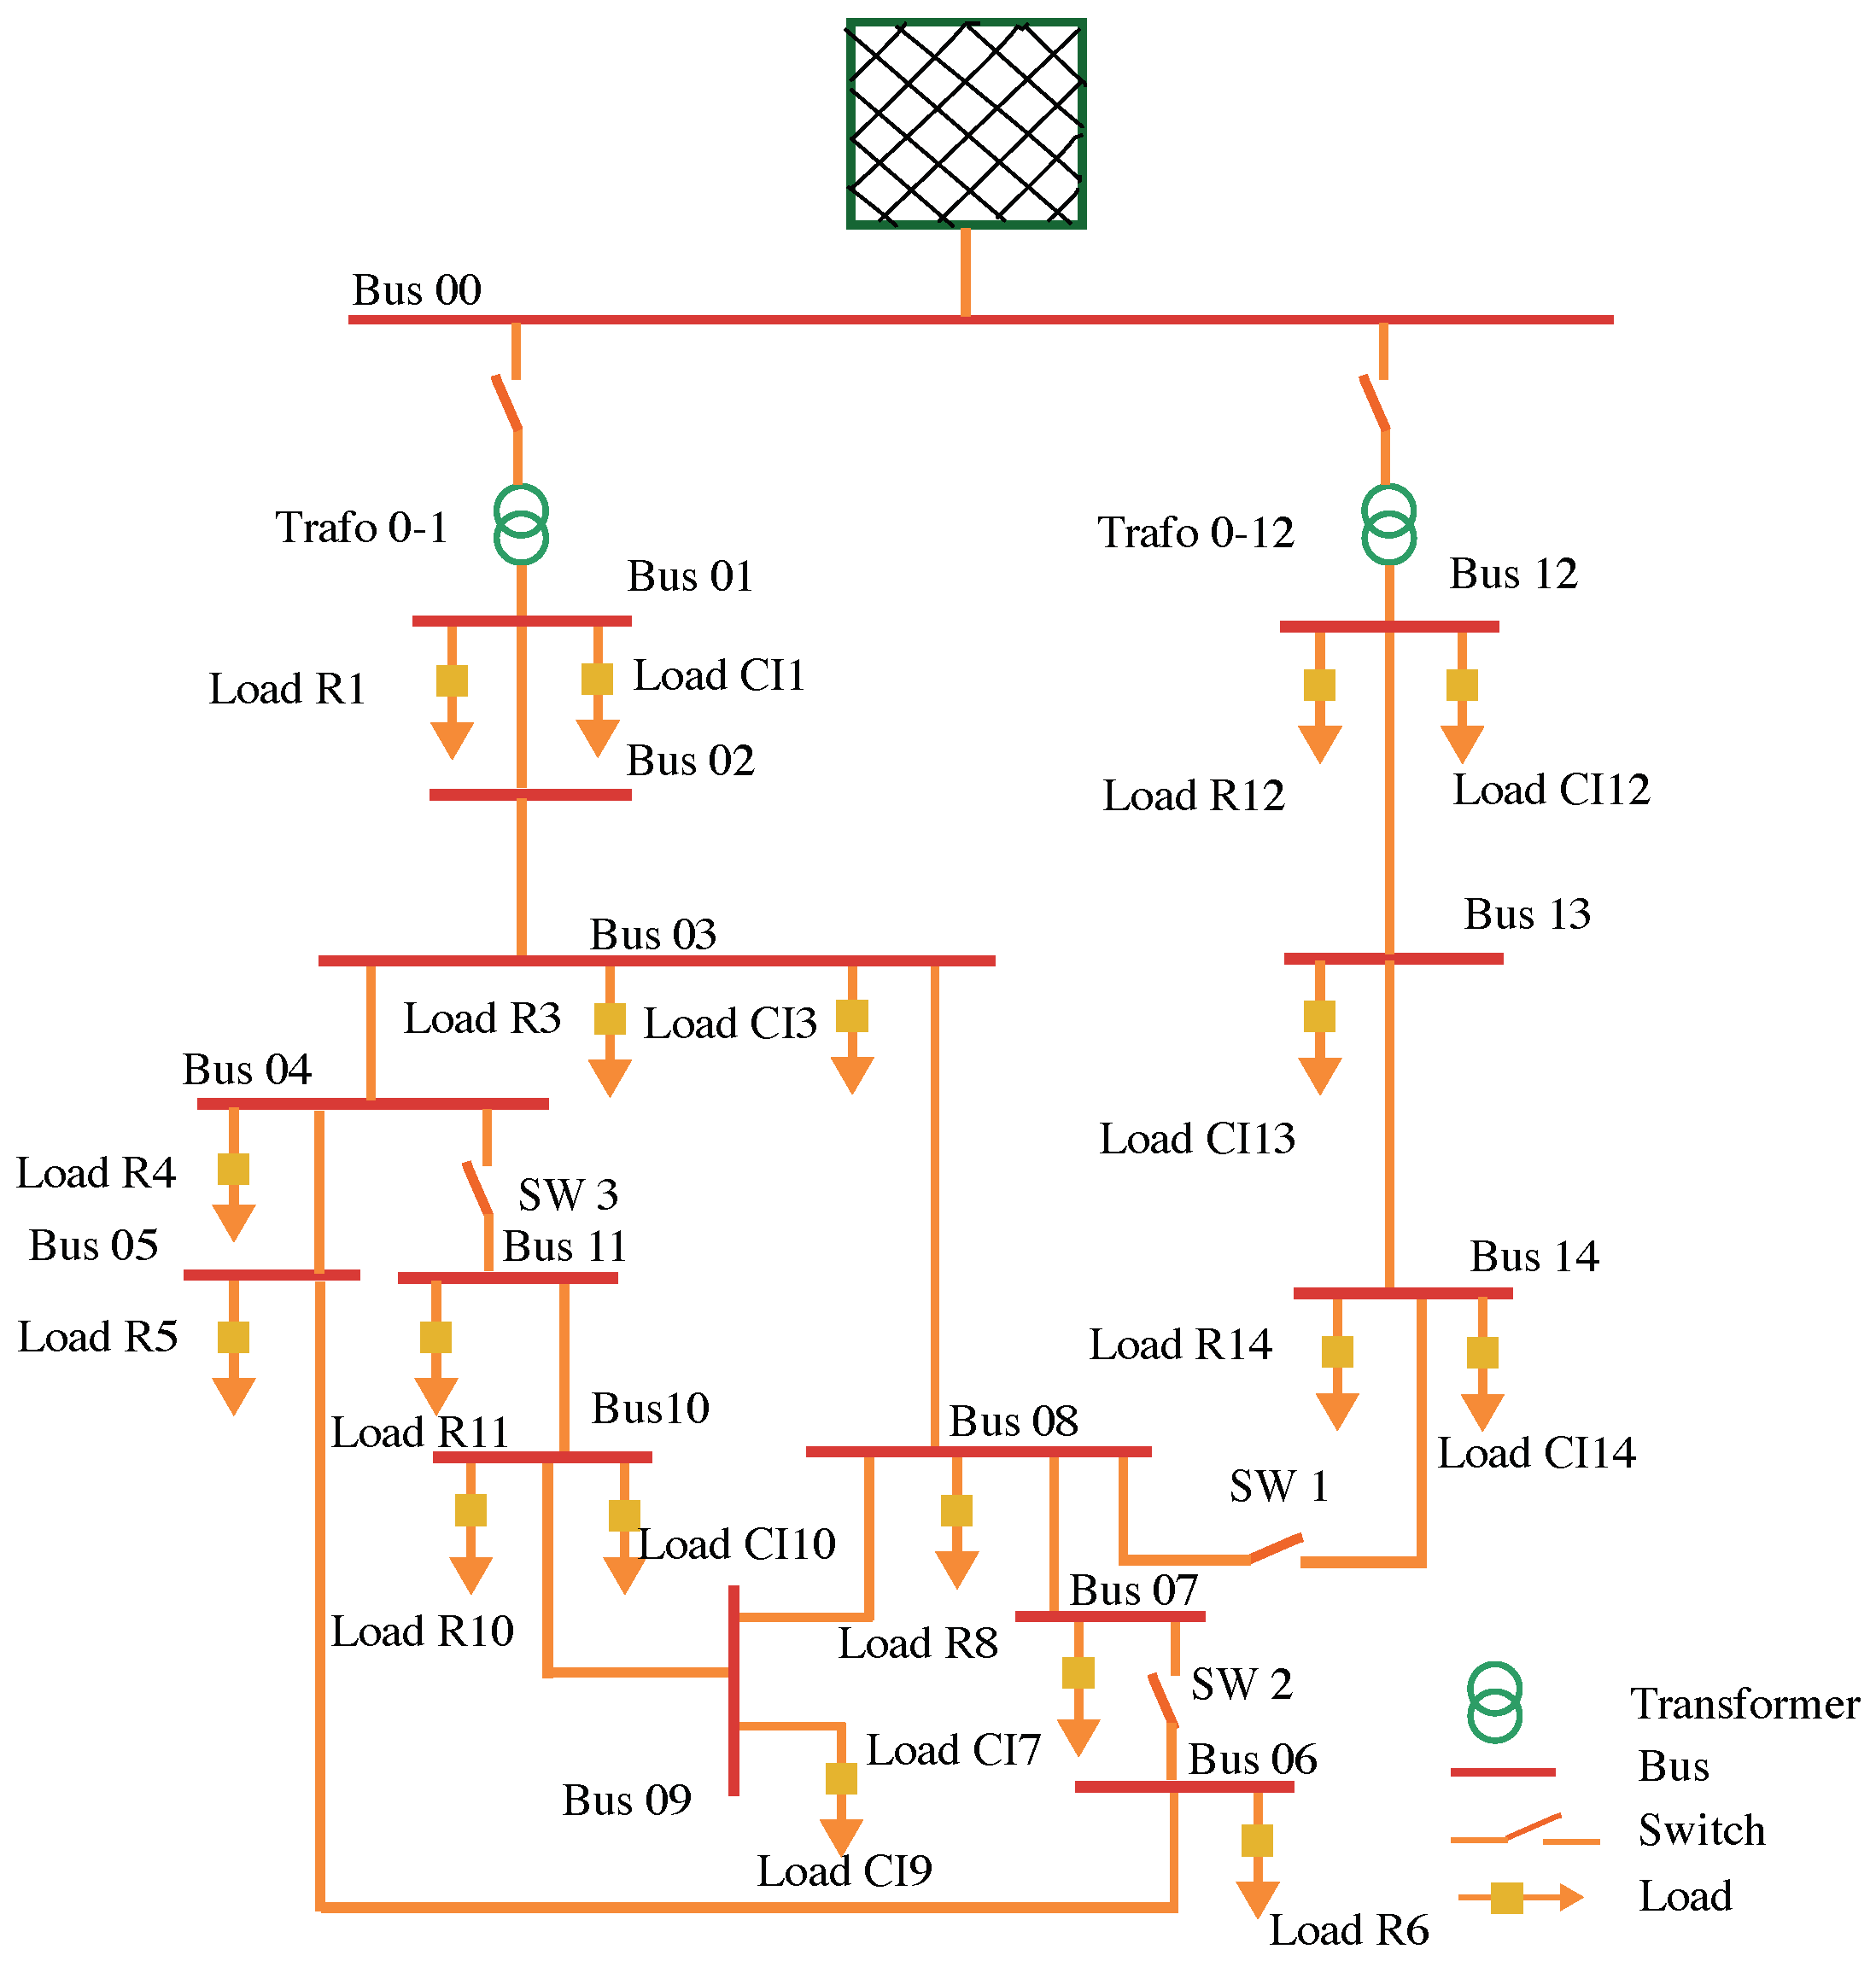
Figure 3 shows the assumed distribution network [35]. This system includes two power transformers, 18 loads, and 15 lines. In order to perform the simulation, power profiles with time stamps of 1 h during one week were assumed for each load. The load profiles were fitted to Fourier series using historical records [33]. Pandapower tool [34] was used to run load flows with the Newton–Raphson algorithm. The load flow was executed for each hour during an entire week in order to identify violations of the security margins in three assumed scenarios: The first one consists in the operation in normal conditions; the second one, under contingency without optimization of load curtailment; and the third one, operation under contingency with an optimal load curtailment.
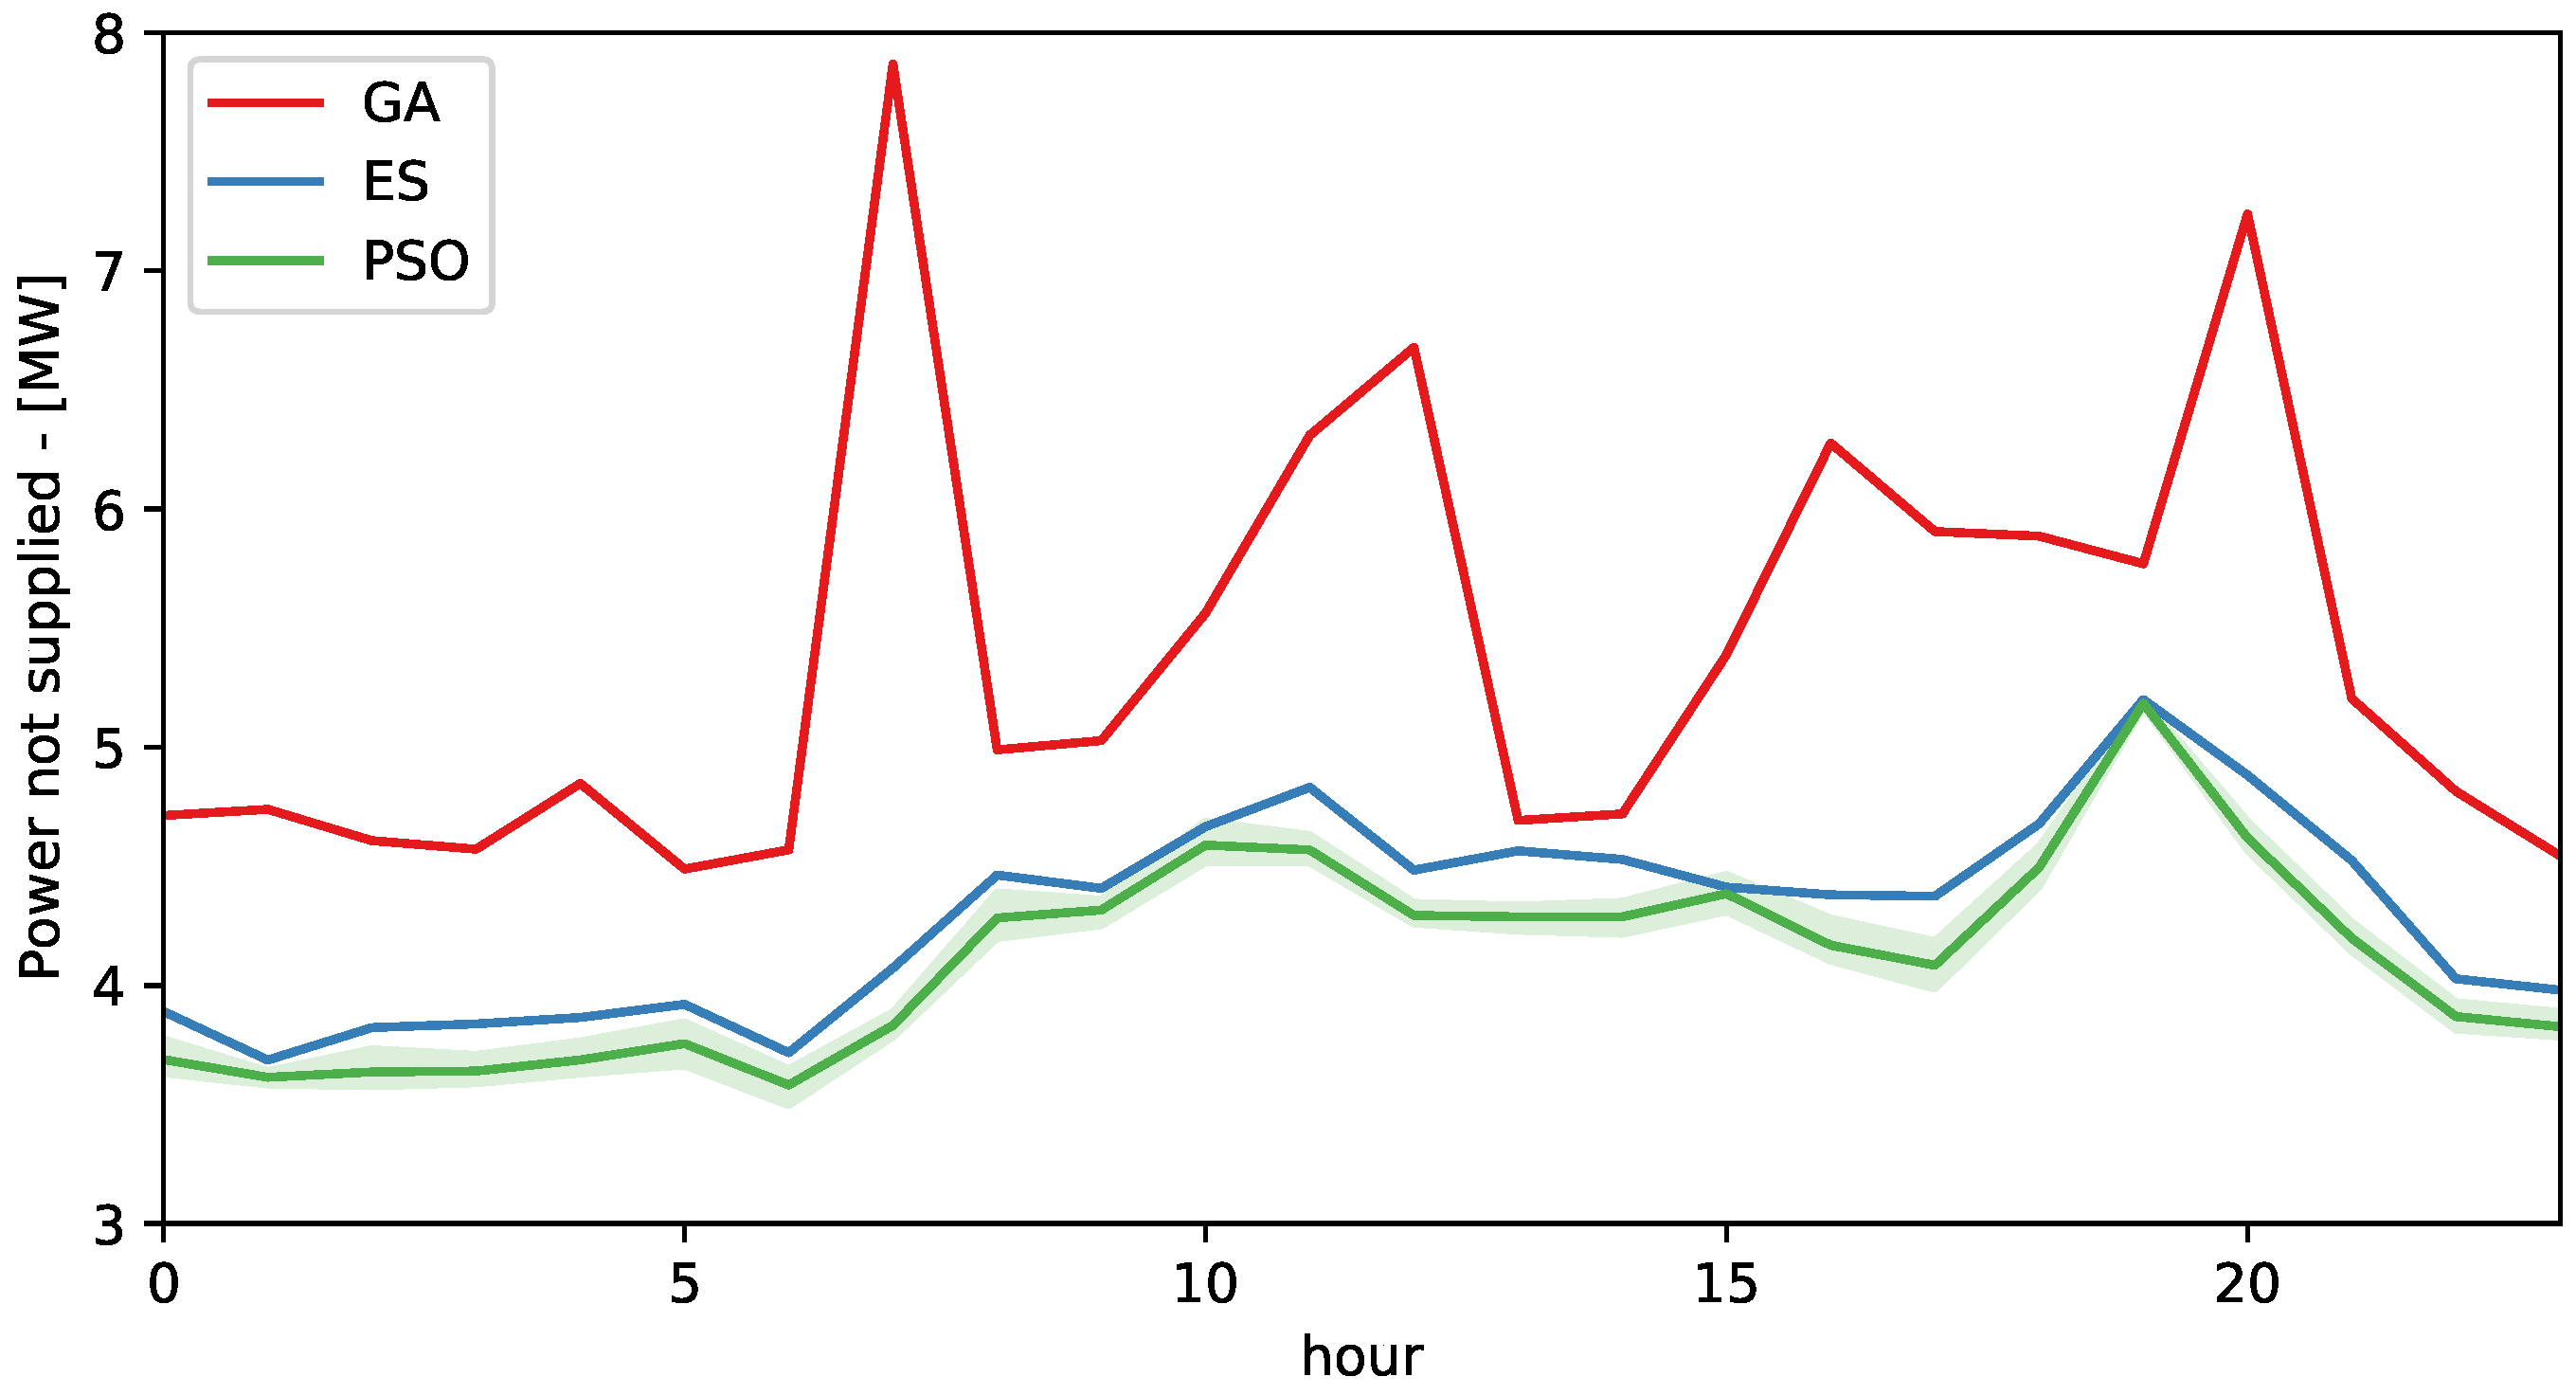
The PSO algorithm was utilized to optimize the load curtailment thanks to the inspyred library [36]. A population size of 40, a neighborhood size of 10, and 2000 max evaluations were used as fitting parameters. The assumed security margins were both the loading of transformers and lines below 100%, and bus voltages limits from 0.9 pu to 1.1 pu . The algorithm was run 168 24 × 7 times. The entire simulation elapsed 2.5 h in a laptop with 8 GB RAM and a 2.3 G Hz Dual-Core Intel Core i5 processor. In order to evaluate the algorithm convergence, 10 runs were performed for Thursdays, which are considered the most critical days. Similarly, the response of the PSO method was compared with GA and Evolution Strategy (ES) optimization techniques using the inspyred library. The population size and max evaluations were 40 and 2000, respectively. Figure 4 shows the results of the 10 trials and the comparison with GA and ES to solve Equation (2). It can be noticed that the PSO converges to the optimum in the 10 trials with a maximum difference of 0.33 M W . Furthermore, the PSO algorithm here employed demonstrated performance advantages when compared to other meta-heuristic methods: better optimal points and better stability under multiple runs.

4.2. Simulation Results

The simulation was performed assuming a contingency resulting from a failure of the transformer TR 0-1. The model evaluation is realized through a comparison of the system operating according to the three different scenarios previously defined. Figure 5 shows the simulation results of the load behavior under the first and third scenarios. Figure 5b,d shown the load curtailment during Thursday and Saturday performing with the optimization algorithm. On Sunday, load cut-off was not necessary.
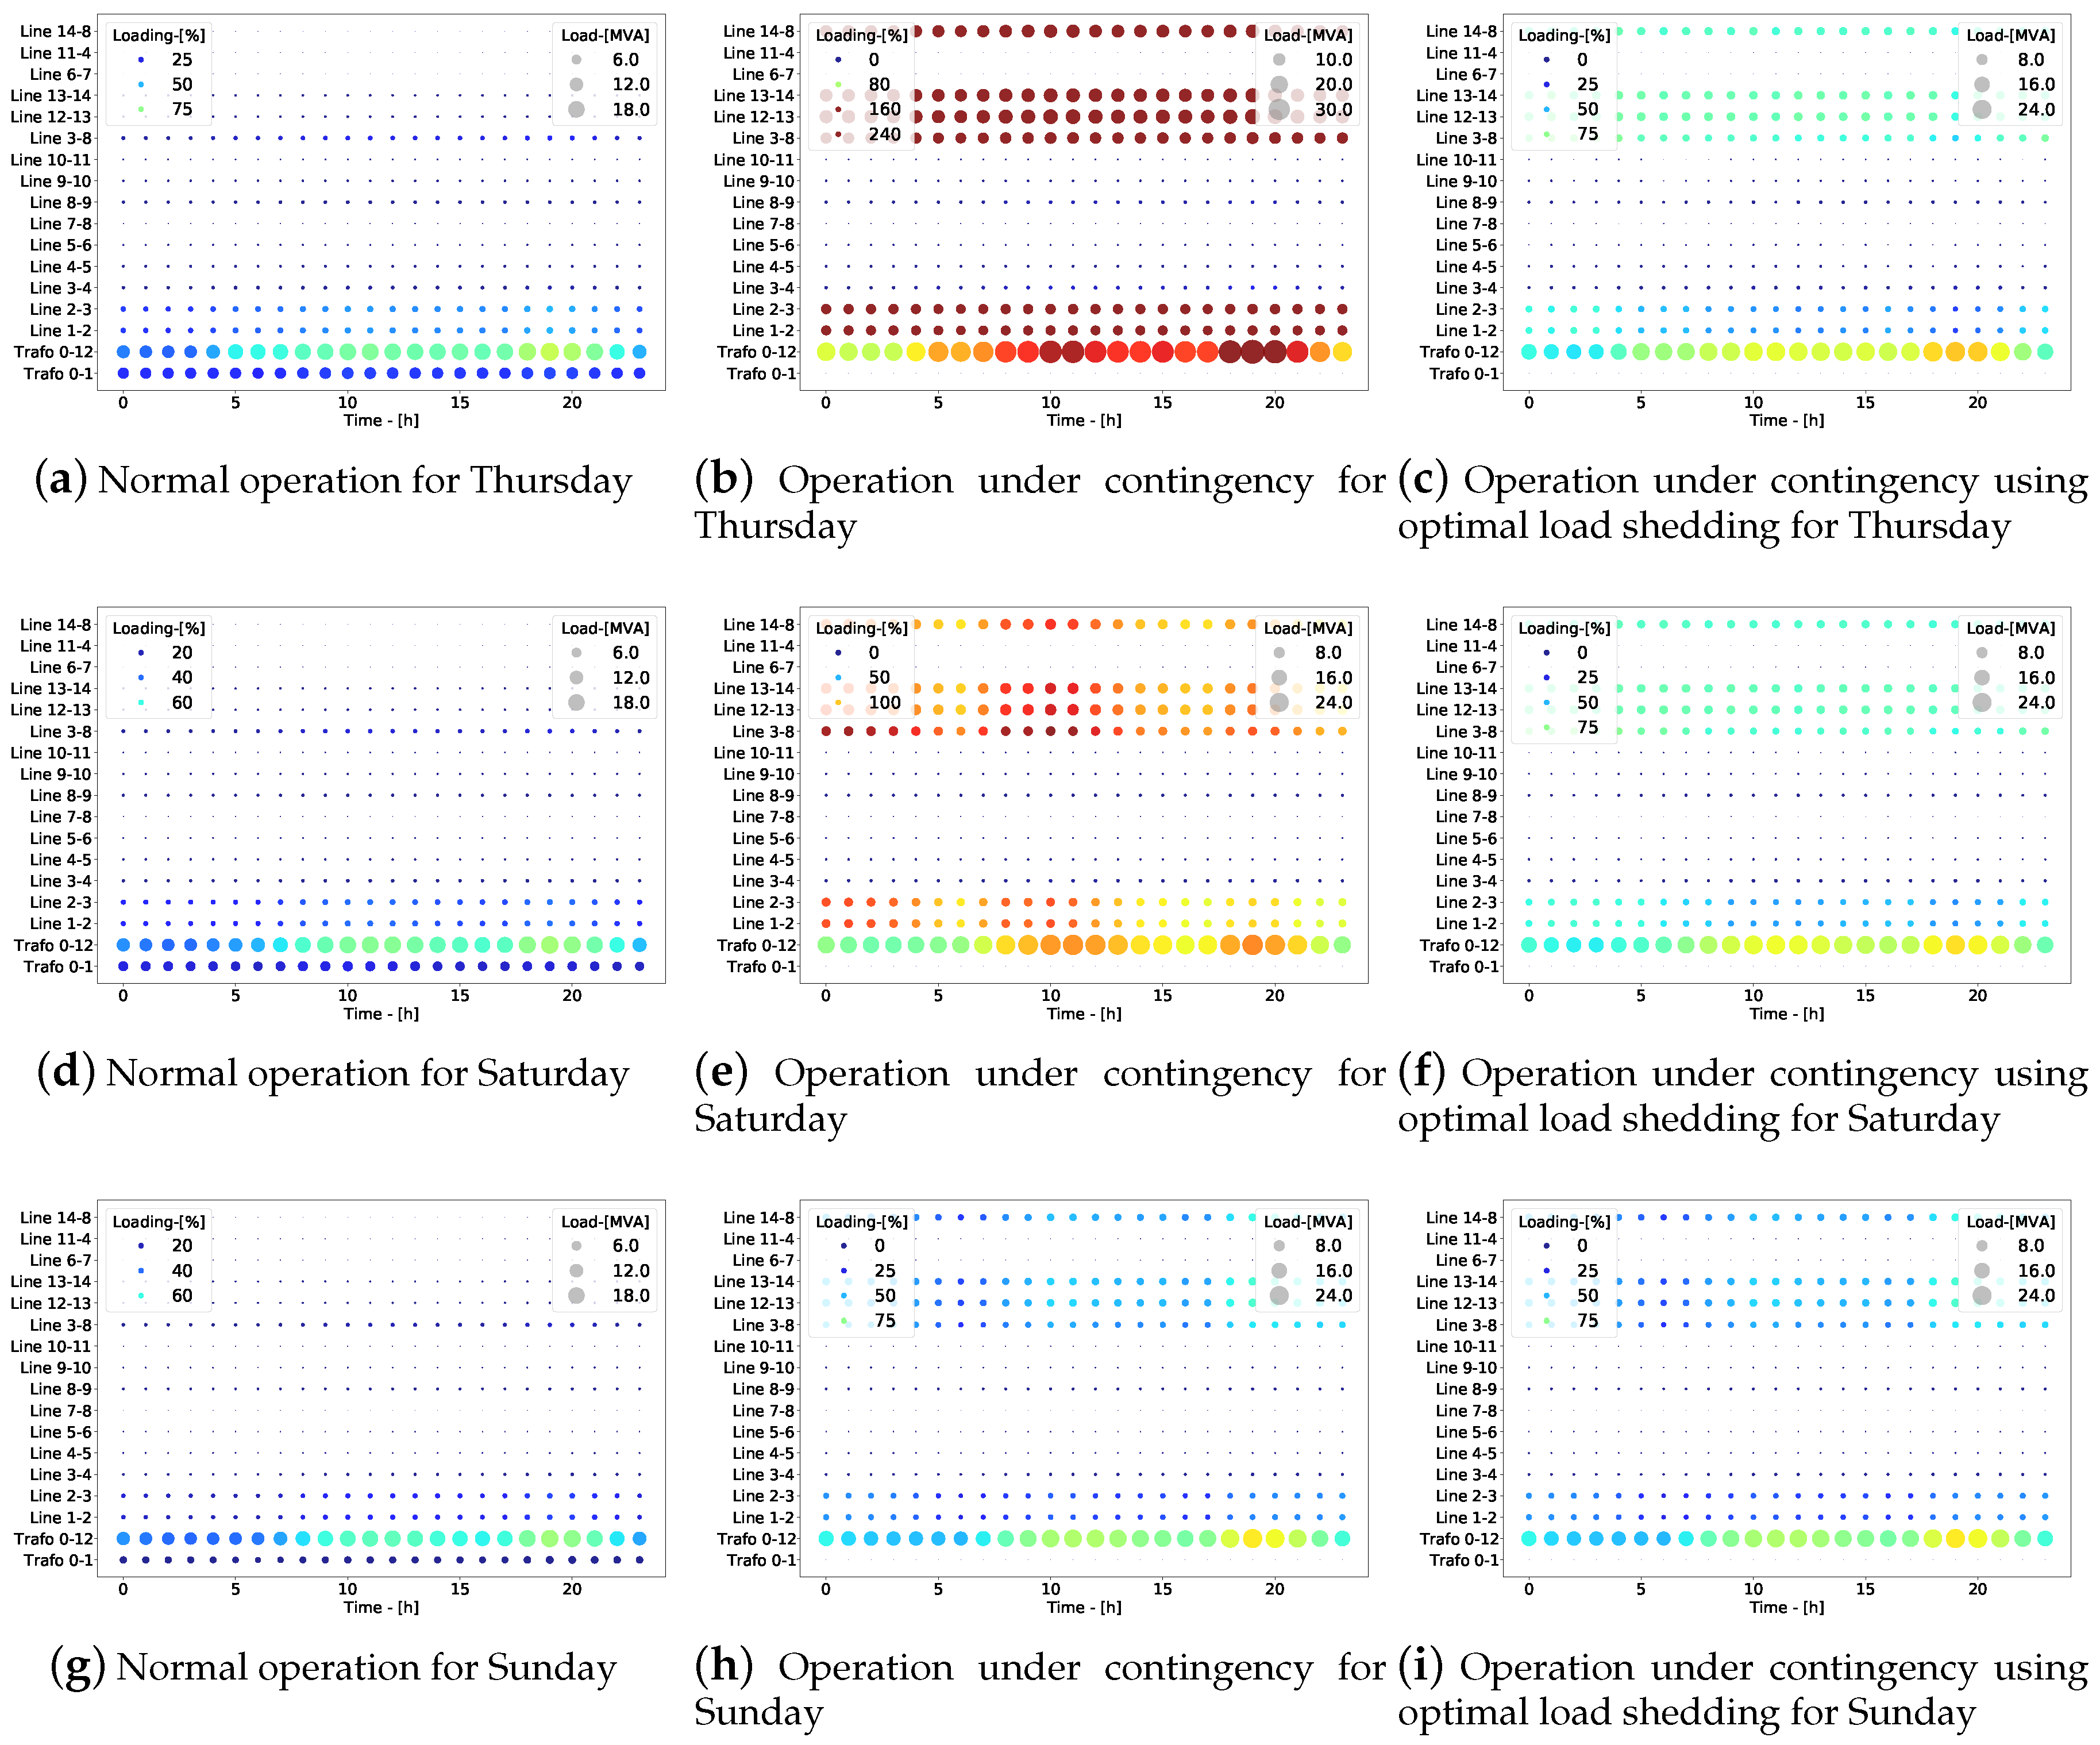
To illustrate the performance of the transformers and lines for the three scenarios, Figure 6 shows their loadings on different days. Here, it can be noted that, during normal operation, Figure 6a,d,g, the loading of the transformer 0-12 is close to 70% with a power flow close to 20 M VA during the load peaks, opposite to transformer 0-1. The loading of Transformer 0-1 presents a constant value close to 30% with a power flow of 10 M VA approximately. The lines show a low loading, lower than 50%. However, during the contingency, Trafo 0-12 and lines 1-2, 2-3, 3-8, 12-13, 13-14, and 14-8 suffer an overload on Thursdays, as shown in Figure 6b. In that case, switch SW1 is assumed to be closed. These overloads will reach 240%. These violations of the loading security margins are a consequence of TR 0-1 failure, since, during the contingency, through these lines and the Trafo 0-12 flows the power to supply the loads R1 and CI1, approximately 7 M VA . Under such operating conditions, these loads are located at the end of the circuit. Additionally, Trafo 0-12 shows the maximum overloads from 9:00 a.m. to 11:00 a.m. and from 5:00 p.m. to 8:00 p.m. This coincides with Figure 5a, which shows that the maximum loads peak occurs during these periods. A similar behavior occurs on Saturdays. However, on those days, the overloading of the asset is lower in time and magnitude, as shown Figure 6e. By contrast, on Sundays, there is no overloading of the transformers and lines, as shown in Figure 6h. Finally, Figure 6c,f,i show the loading using the load curtailment optimization algorithm to ensure the compliance of security margins during the contingency operation. Here, it can be appreciated that, by using the load shedding strategy, the lines and transformers present a higher loading than in normal operation (scenario one), but are maintained within security margins, as can be noted by comparing with scenario two.
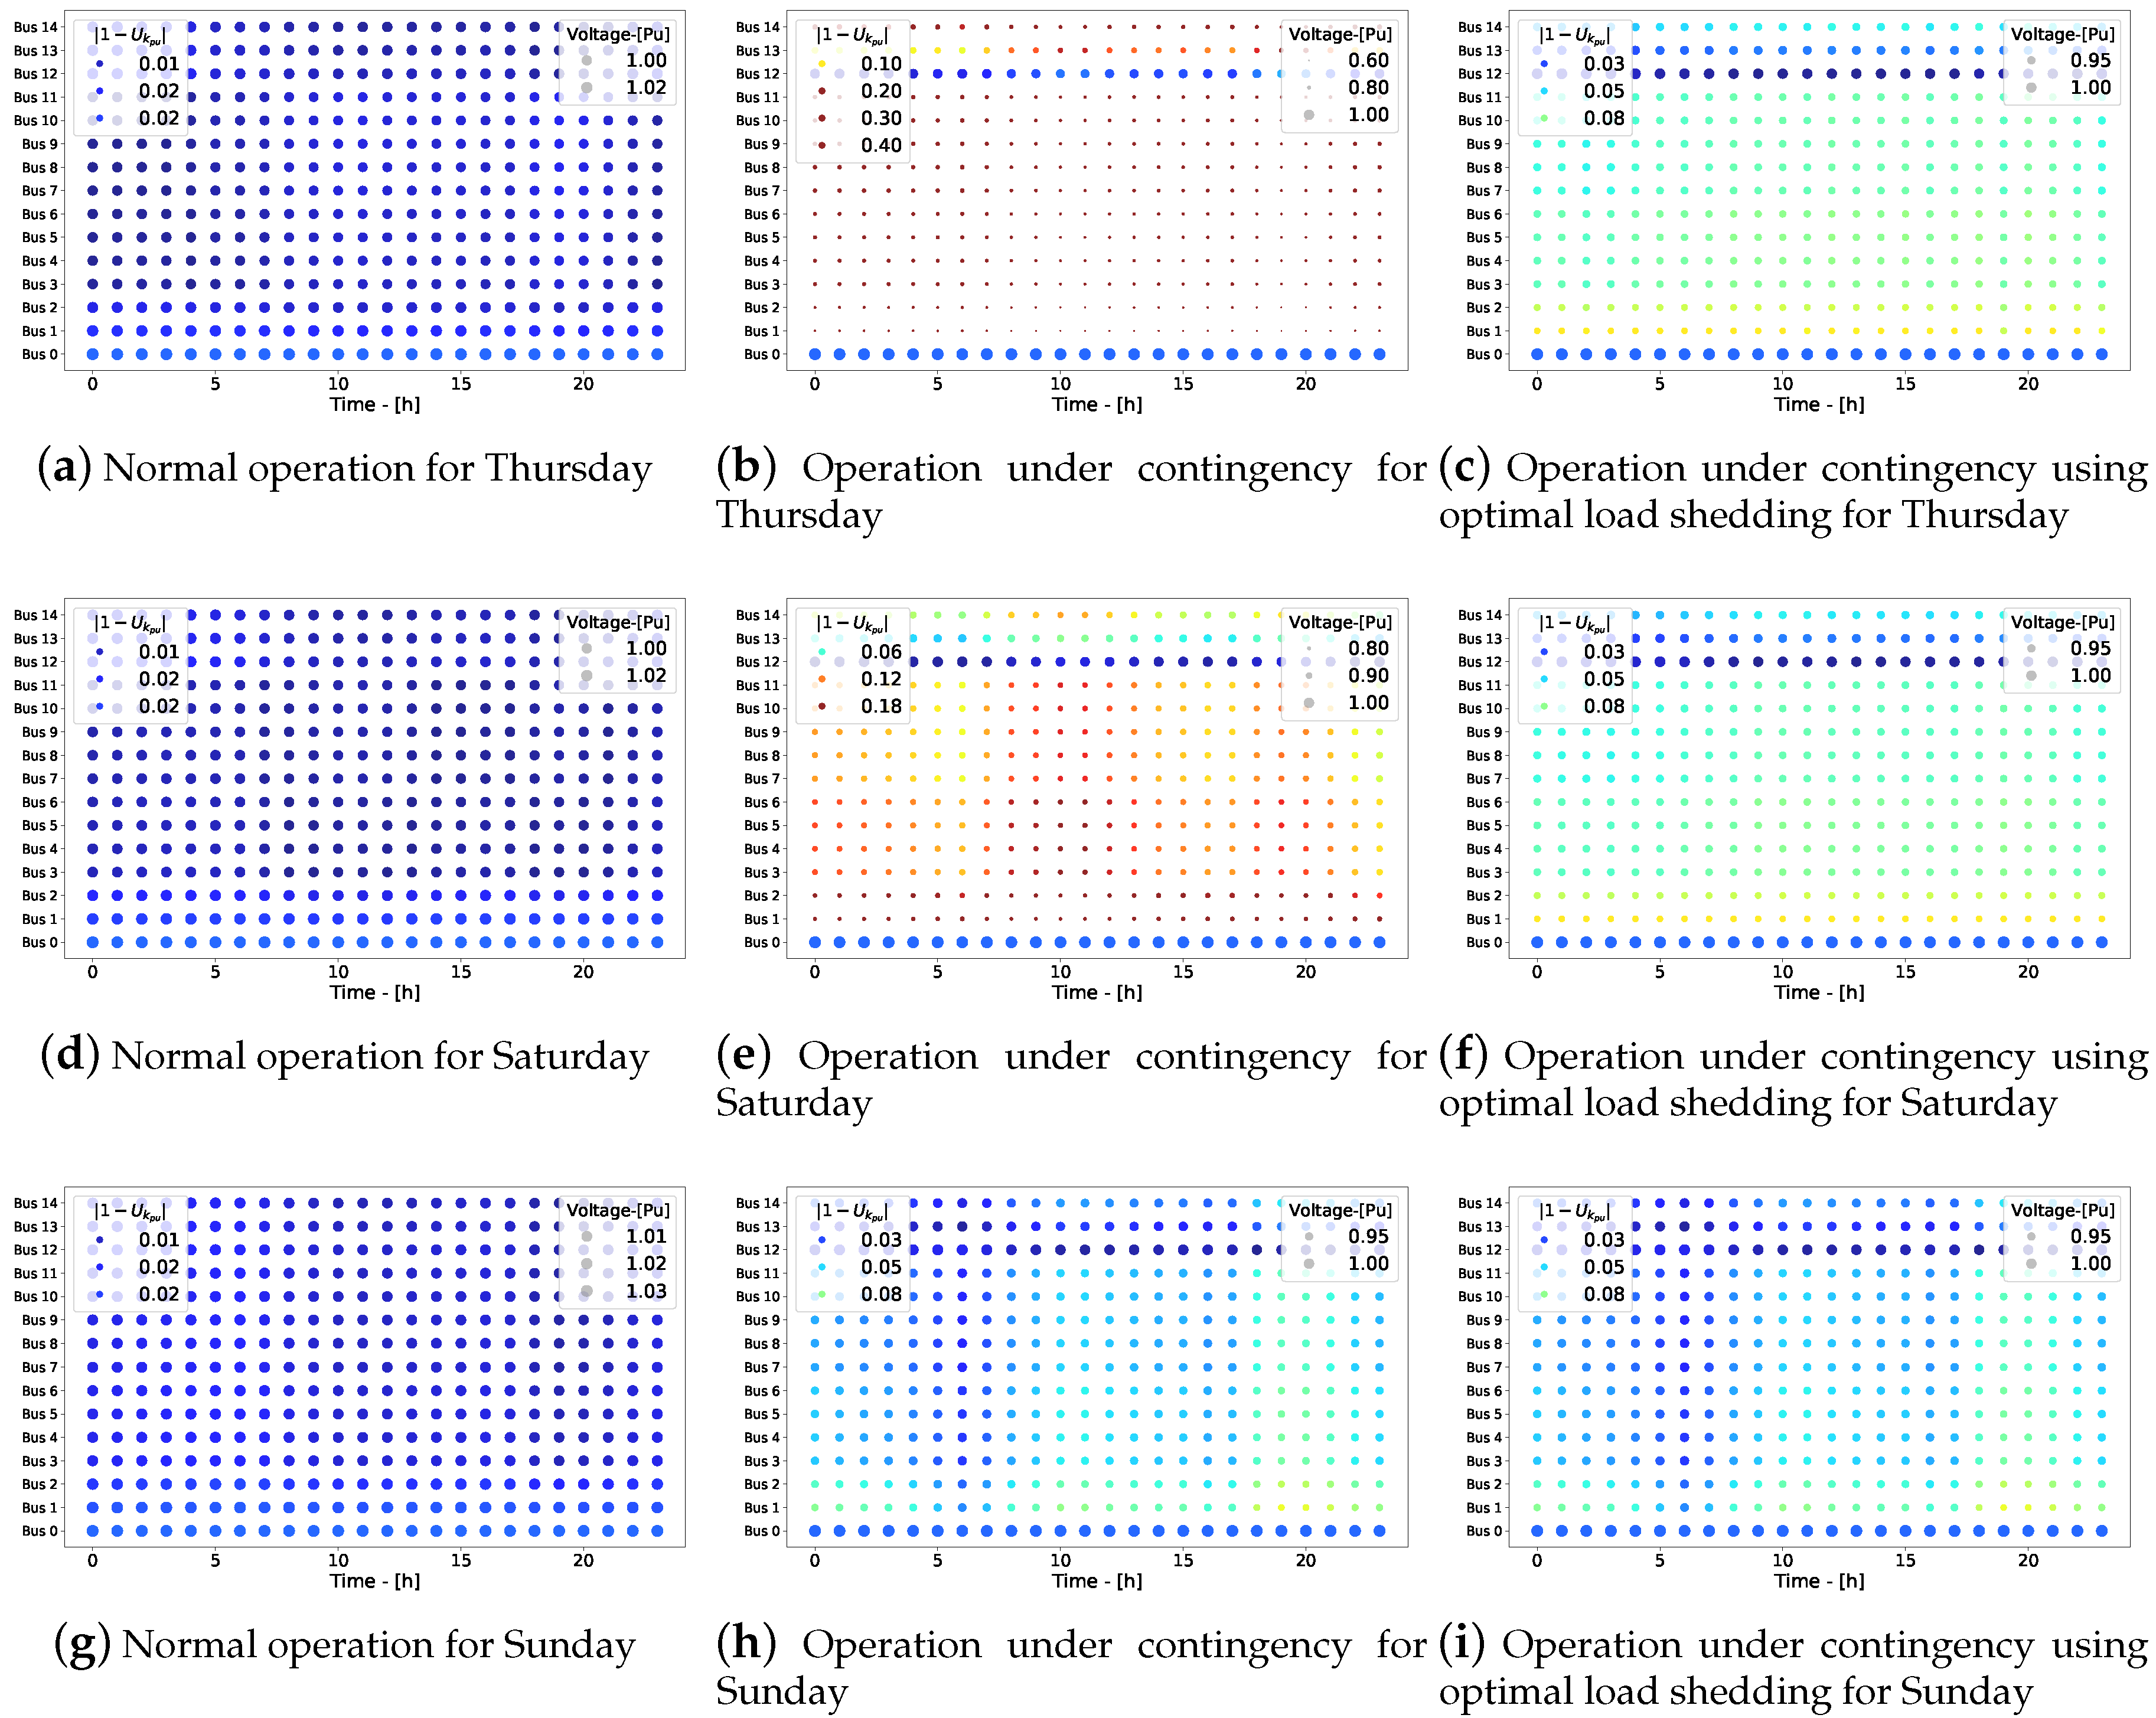
The second type of security margins is related to voltage limits. Figure 7 shows both the voltage magnitude and voltage deviation in nodes of the system for the three scenarios. As can be seen, there is a behavior similar to the one obtained in the violation of loading security margins. In scenario one, normal operation, the bus voltage deviation is lower than 0.02 pu, as expected. This is shown in Figure 7d,g. In scenario two, the most critical days for voltage margin violations are Thursdays. On these days, the voltage drops to 0.6 pu in almost all buses, as shown in Figure 7b. On Saturdays, the maximum voltage deviation is 0.18 pu. However, as shown in Figure 7h, on Sundays, voltage security margin violations do not occur when Trafo 0-1 is out of service. In scenario three, the use of the proposed algorithm for load curtailment allows maintaining the operating voltage inside the security margins, as shown in Figure 7c,f,i, where a maximum deviation of 0.08 pu is observed.

4.3. Simulation Results Assessment

In order to assess the simulation results, both the expected energy not supplied (EENS) and the SAIDI are computed for contingencies, considering on the one hand the optimal load curtailment algorithm, and on the other hand the opening of the SW1. These changes in the switch status are assumed to be the conventional method used by system operators to avoid operating the network out of security margins. To compute the S A I D I , the power cut off was assumed to be equivalent to the affected users, and the total number of users was assumed equal to the total power supplied. The EENS was computed as the expected power to supply minus the power supplied during the contingency for both cases. Figure 8 shows the total power supplied hourly for the three assumed scenarios during the week. It is worth noting the impact of performing the algorithm for load curtailment. In all cases, the energy supplied using the proposed algorithm was greater than in the scenario where the conventional method is used (opening SW1).
To summarize, Table 1 shows the S A I D I and EENS for each day during the entire week. The average reduction in SAIDI and EENS due to the use of load curtailment optimization was 4.5 h ≈ 62% and 94.7 M W h ≈ 61%, respectively. The values of S A I D I obtained for both cases are considered high for a distribution network. These results are a consequence of the power furnished by TR 0-1, through which flows almost half the power supplied to the loads. Additionally, a duration of an entire day for the failure of this transformer was assumed.

4.4. Scalability of the Proposed Method

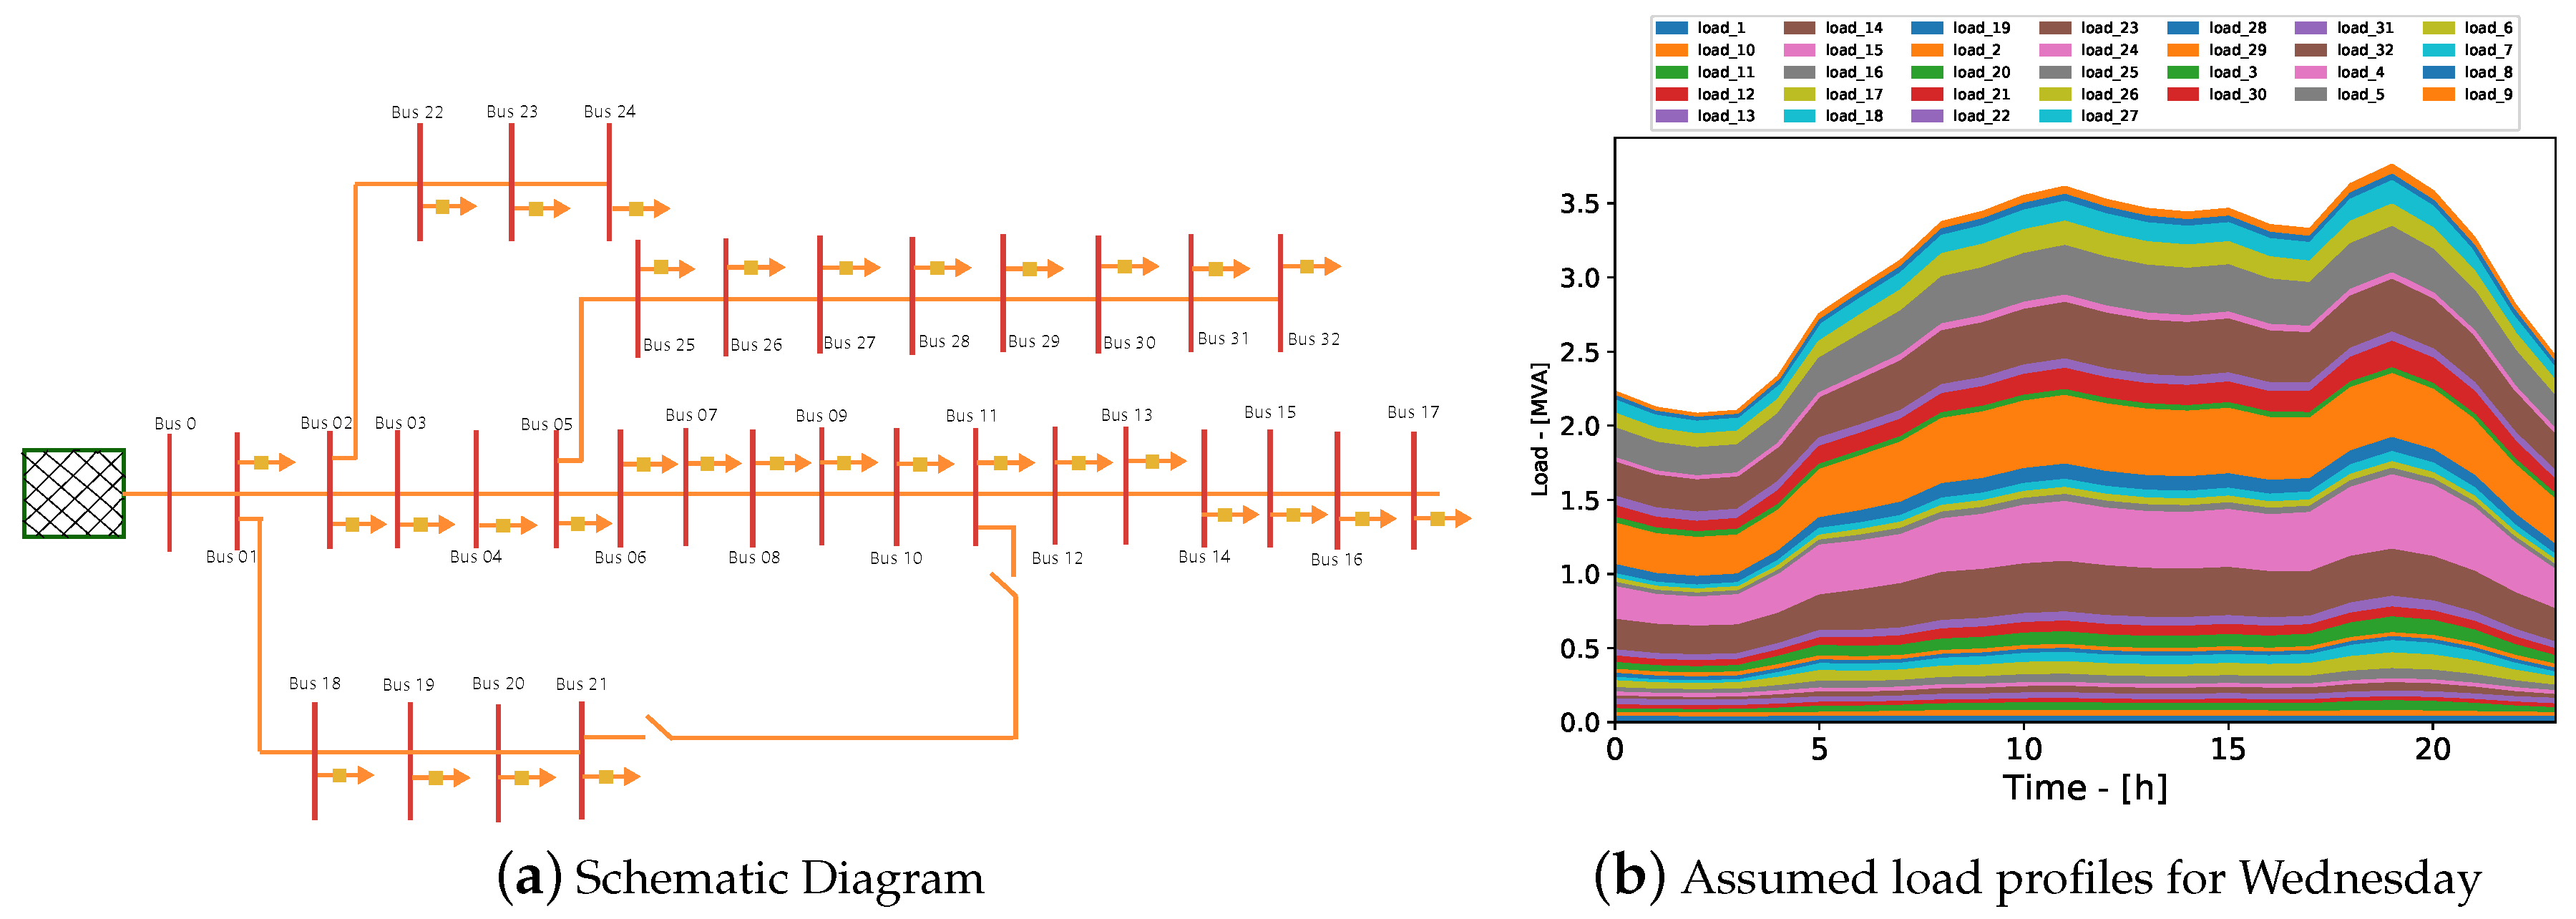
In order to assess the scalability of the proposed method, the IEEE 33 bus test system was used to evaluate the algorithm, similarly to the previous analysis. Figure 9 shows the topology of the system and the assumed load profiles for Wednesdays. Those days were contemplated as the most critical.
For evaluating the algorithm, a failure of the line 1-2 was assumed. This failure was considered as critical contingency given the topology of the system and the lack of reactive power [37]. The bus voltages for three scenarios: normal operation, under contingency assuming that the line 21-11 is operating, and using the proposed algorithm are shown in Figure 10. On one hand, in Figure 10b, voltage violations during the contingency without load shedding can be noted. On the other hand, Figure 10c shows that, using the load shedding algorithm, the system operates with the bus voltages inside the security margins with line 21-11 operating.
The energy supplied by hour for the three assumed scenarios is shown in Figure 11. In the conventional scenario, where line 21-11 is open, it is expected to supply only the loads 18,19,20,21. Therefore, the energy supplied is approx. 10% of the expected. With the load shedding algorithm, more than 50% of the expected energy is supplied. Finally, the elapsed time for the whole day simulation was approximately 30 min , equivalent to 1.25 min per hour simulated. For the CIGRE medium voltage distribution network benchmark, the average elapse time per hour simulated was 56 s . The increase in time is a consequence of a greater number of loads; therefore, there is a greater number of decision variables. It is worth noting that these simulations were run on a personal laptop. In a workstation, a reduction in computing time is expected.

5. Conclusions

This article addresses an algorithm for optimizing load curtailment during contingencies of conventional distribution networks. The algorithm uses load forecasting and considers the operating security margins. As a result of the algorithm assessment, improvements in the load to cut off during contingencies were made and therefore a reduction enhanced in the S A I D I as well as in the expected energy not supplied was provided.
Results using the proposed algorithm to optimize load shedding showed that it is not always necessary to shed all the power of a load in order to keep the system operating safely. Hence, by obtaining a hourly load curtailment based on demand forecast, shedding constant power during the duration of a contingency can be avoided. With this strategy, a minimum power to cut off hourly is obtained, thereby contributing to the quality service by reducing the duration of the interruptions.
However, the proposed algorithm does not consider the operation of switches, reactive compensation or smart grid technologies. Additionally, as a consequence of the elapsed time to converge, this procedure is not suitable for frequency or voltage recovery using load shedding. These issues are open to future research.

Author Contributions

Conceptualization, L.M.C., D.L.A., S.R. and A.S.A.-S.; methodology, L.M.C., S.R. and D.L.A.; validation, L.M.C. and D.L.A.; formal analysis, D.L.A., S.R., L.M.C. and A.S.A.-S.; investigation, L.M.C., D.L.A. and A.S.A.-S.; resources, L.M.C. and D.L.A.; data curation, L.M.C.; writing—original draft preparation, L.M.C., S.R. and D.L.A.; writing—review and editing, D.L.A., S.R. and A.S.A.-S.; visualization, L.M.C., D.L.A. and A.S.A.-S.; funding acquisition and supervision, D.L.A., S.R. and A.S.A.-S. All authors have read and agreed to the published version of the manuscript.

Funding

This research was supported by Universidad Nacional de Colombia, the Fondo Nacional para el Financiamiento de la Ciencia, la Tecnología y la Innovación-FRANCISCO JOSE DE CALDAS-MINCIENCIAS under award 811 of 2018 and by Khalifa University under Award FSU-2018-25.

Conflicts of Interest

The authors declare no conflict of interest.

References

  1. Lacommare, K.H.; Berkeley, L.; Eto, J.H.; Berkeley, L. Distinguishing Among the Sources of Electric Service Interruptions. In Proceedings of the 2018 IEEE International Conference on Probabilistic Methods Applied to Power Systems (PMAPS), Boise, ID, USA, 24–28 June 2018; pp. 1–6. [Google Scholar] [CrossRef]
  2. Liu, Y.; Fan, R.; Terzija, V. Power system restoration: A literature review from 2006 to 2016. J. Mod. Power Syst. Clean Energy 2016, 4, 332–341. [Google Scholar] [CrossRef] [Green Version]
  3. Mohaghar, A.; Shahriari, S.; Hasani, B. A New Mathematical Model of Optimization Load Shedding in Distribution Systems to Achieve Strategic Objectives of Electricity Demand Side Management. Technical Report 2. Glob. J. Manag. Stud. Res. 2015, 2, 132–141. [Google Scholar]
  4. The Essential Services Commission of South Australia. Electricity Distribution Code; Government Administration Adelaide: Adelaide, Australia, 2015.
  5. Power Networks, U. Guaranteed Standards of Performance for Metered Demand Customers of Electricity Distribution Companies in England, Wales & Scotland; Wales & Scotland Office of Gas and Electricity Markets (OFGEM): London, UK, 2013; pp. 1–7.
  6. Certification, R.C.; Standards, E.R.; Prefix, N.D.; Filed, P.; Corp, R.; Standards, M.R. NERC Full Notice of Penalty Regarding Avangrid; North American Reliability Corporation: Washington, DC, USA, 2019; Volume 7. [Google Scholar]
  7. Pollitt, M.G. The European Single Market in Electricity: An Economic Assessment. Rev. Ind. Organ. 2019, 55, 63–87. [Google Scholar] [CrossRef] [Green Version]
  8. Mohiti, M.; Monsef, H.; Anvari-Moghaddam, A.; Lesani, H. Two-Stage Robust Optimization for Resilient Operation of Microgrids Considering Hierarchical Frequency Control Structure. IEEE Trans. Ind. Electron. 2019, 1. [Google Scholar] [CrossRef]
  9. Calderaro, V.; Galdi, V.; Graber, G.; Piccolo, A. Generation Rescheduling and Load Shedding in Distribution Systems Under Imprecise Information. IEEE Syst. J. 2018, 12, 383–391. [Google Scholar] [CrossRef]
  10. Vahedipour-Dahraie, M.; Anvari-Moghaddam, A.; Guerrero, J.M. Evaluation of reliability in risk-constrained scheduling of autonomous microgrids with demand response and renewable resources. IET Renew. Power Gener. 2018, 12, 657–667. [Google Scholar] [CrossRef] [Green Version]
  11. Stochastic Risk-Constrained Scheduling of Renewable-Powered Autonomous Microgrids With Demand Response Actions: Reliability and Economic Implications. IEEE Trans. Ind. Appl. 2020, 56, 1882–1895. [CrossRef]
  12. Alqunun, K.; Guesmi, T.; Farah, A. Load shedding optimization for economic operation cost in a microgrid. Electr. Eng. 2020. [Google Scholar] [CrossRef]
  13. Evangelopoulos, V.A.; Georgilakis, P.S.; Hatziargyriou, N.D. Optimal operation of smart distribution networks: A review of models, methods and future research. Electr. Power Syst. Res. 2016, 140, 95–106. [Google Scholar] [CrossRef]
  14. Vargas, A.; Saavedra, O.R.; Samper, M.E.; Rivera, S.; Rodriguez, R. Latin American Energy Markets: Investment Opportunities in Nonconventional Renewables. IEEE Power Energy Mag. 2016, 14, 38–47. [Google Scholar] [CrossRef]
  15. Soares, J.; Lobo, C.; Silva, M.; Morais, H.; Vale, Z. Relaxation of non-convex problem as an initial solution of meta-heuristics for energy resource management. In Proceedings of the 2015 IEEE Power Energy Society General Meeting, Denver, CO, USA, 26–30 July 2015; pp. 1–5. [Google Scholar]
  16. Asrari, A.; Ansari, M.; Bibek, K.C. Real-time Congestion Prevention in Modern Distribution Power Systems via Demand Response of Smart Homes. In Proceedings of the 2019 North American Power Symposium (NAPS), Wichita, KS, USA, 13–15 October 2019; pp. 1–6. [Google Scholar]
  17. Lou, X.; Yau, D.K.Y.; Nguyen, H.H.; Chen, B. Profit-Optimal and Stability-Aware Load Curtailment in Smart Grids. IEEE Trans. Smart Grid 2013, 4, 1411–1420. [Google Scholar] [CrossRef]
  18. Jianjun, F.A.Z.; Dong, S.B.Z.; Yang, G.; Zhihong, T.C.Y. Load Shedding control Strategy for power system Based on the system frequency and voltage stability (Apr 2018). In Proceedings of the 2018 China International Conference on Electricity Distribution, Tianjin, China, 17–19 September 2018; pp. 17–19. [Google Scholar]
  19. Xie, J.; Liu, C.C.; Sforna, M.; Xu, Y. Consensus weighting of a multi-agent system for load shedding. Int. J. Electr. Power Energy Syst. 2020, 117, 105615. [Google Scholar] [CrossRef]
  20. Verayiah, R.; Mohamed, A.; Shareef, H.; Abidin, I.Z. Under Voltage Load Shedding Scheme Using Meta-heuristic Optimization Methods. Prz. Elektrotechniczny 2014. [Google Scholar] [CrossRef]
  21. Raghu, C.N.; Manjunatha, A. Assessing Effectiveness of Research for Load Shedding in Power System. Int. J. Electr. Comput. Eng. (IJECE) 2017, 7, 3235–3245. [Google Scholar] [CrossRef]
  22. Gao, H.; Chen, Y.; Xu, Y.; Liu, C.C. Dynamic load shedding for an islanded microgrid with limited generation resources. IET Gener. Transm. Distrib. 2016, 10, 2953–2961. [Google Scholar] [CrossRef]
  23. Awad, A.S.A.; EL-Fouly, T.H.M.; Salama, M.M.A. Optimal ESS Allocation and Load Shedding for Improving Distribution System Reliability. IEEE Trans. Smart Grid 2014, 5, 2339–2349. [Google Scholar] [CrossRef]
  24. Nourollah, S.; Aminifar, F.; Gharehpetian, G.B. A Hierarchical Regionalization-Based Load Shedding Plan to Recover Frequency and Voltage in Microgrid. IEEE Trans. Smart Grid 2019, 10, 3818–3827. [Google Scholar] [CrossRef]
  25. Dreidy, M.; Mokhlis, H.; Mekhilef, S. Application of meta-heuristic techniques for optimal load shedding in islanded distribution network with high penetration of solar PV generation. Energies 2017, 10, 150. [Google Scholar] [CrossRef] [Green Version]
  26. Application of hybrid meta-heuristic techniques for optimal load shedding planning and operation in an islanded distribution network integrated with distributed generation. Energies 2018, 11, 1134. [CrossRef] [Green Version]
  27. Narayanan, K.; Siddiqui, S.A.; Fozdar, M. Hybrid islanding detection method and priority-based load shedding for distribution networks in the presence of DG units. IET Gener. Transm. Distrib. 2017, 11, 586–595. [Google Scholar] [CrossRef]
  28. Kennedy, J.; Eberhart, R. Particle Swarm Optimization. In Proceedings of the ICNN’95—International Conference on Neural Networks, Perth, WA, Australia, 27 November–1 December 1995; pp. 1942–1948. [Google Scholar]
  29. Sanchez, A.; Romero, A.; Rattá, G.; Rivera, S. Smart charging of PEVs to reduce the power transformer loss of life. In Proceedings of the 2017 IEEE PES Innovative Smart Grid Technologies Conference—Latin America (ISGT Latin America), Quito, Ecuador, 20–22 September 2017; pp. 1–6. [Google Scholar]
  30. Sengupta, S.; Basak, S.; Alan, R.; Ii, P. Particle Swarm Optimization: A Survey of Historical and Recent Developments with Hybridization Perspectives. Mach. Learn. Knowl. Extr. 2018, 1, 10. [Google Scholar] [CrossRef] [Green Version]
  31. Poli, R. An Analysis of Publications on Particle Swarm Optimisation Applications. J. Artif. Evol. Appl. 2014, 1–10. [Google Scholar] [CrossRef]
  32. Society, I.P.E. IEEE Std 1366™-2003: IEEE Guide for Electric Power Distribution Reliability Indices; IEEE: Piscataway, NJ, USA, 2004. [Google Scholar]
  33. Cruz, L.M.; Alvarez, D.L.; Rivera, S.R.; Herrera, F.A. Short-Term Demand Forecast Using Fourier Series. In Proceedings of the 2019 IEEE Workshop on Power Electronics and Power Quality Applications (PEPQA), Manizales, Colombia, 30–31 May 2019; pp. 1–5. [Google Scholar]
  34. Thurner, L.; Scheidler, A.; Sch, F.; Menke, J.H.; Dollichon, J.; Meier, F.; Meinecke, S.; Braun, M. Pandapower—An Open-Source Python Tool for Convenient Modeling, Analysis, and Optimization of Electric Power Systems. IEEE Trans. Power Syst. 2018, 33, 6510–6521. [Google Scholar] [CrossRef] [Green Version]
  35. Conseil International des Grands réseaux électriques. Comité d’études C6. Benchmark Systems for Network Integration of Renewable and Distributed Energy Resources: Task Force C6.04; [Brochures thématiques]; CIGRE: Paris, France, 2014. [Google Scholar]
  36. Tonda, A. Inspyred: Bio-inspired algorithms in Python. Genet. Program. Evolvable Mach. 2020, 21, 269–272. [Google Scholar] [CrossRef] [Green Version]
  37. Wang, Y.; Zhao, T.; Ju, C.; Xu, Y.; Wang, P. Two-Level Distributed Voltage /Var Control using Aggregated PV Inverters in Distribution Network s. IEEE Trans. Power Deliv. 2019, 1. [Google Scholar] [CrossRef]
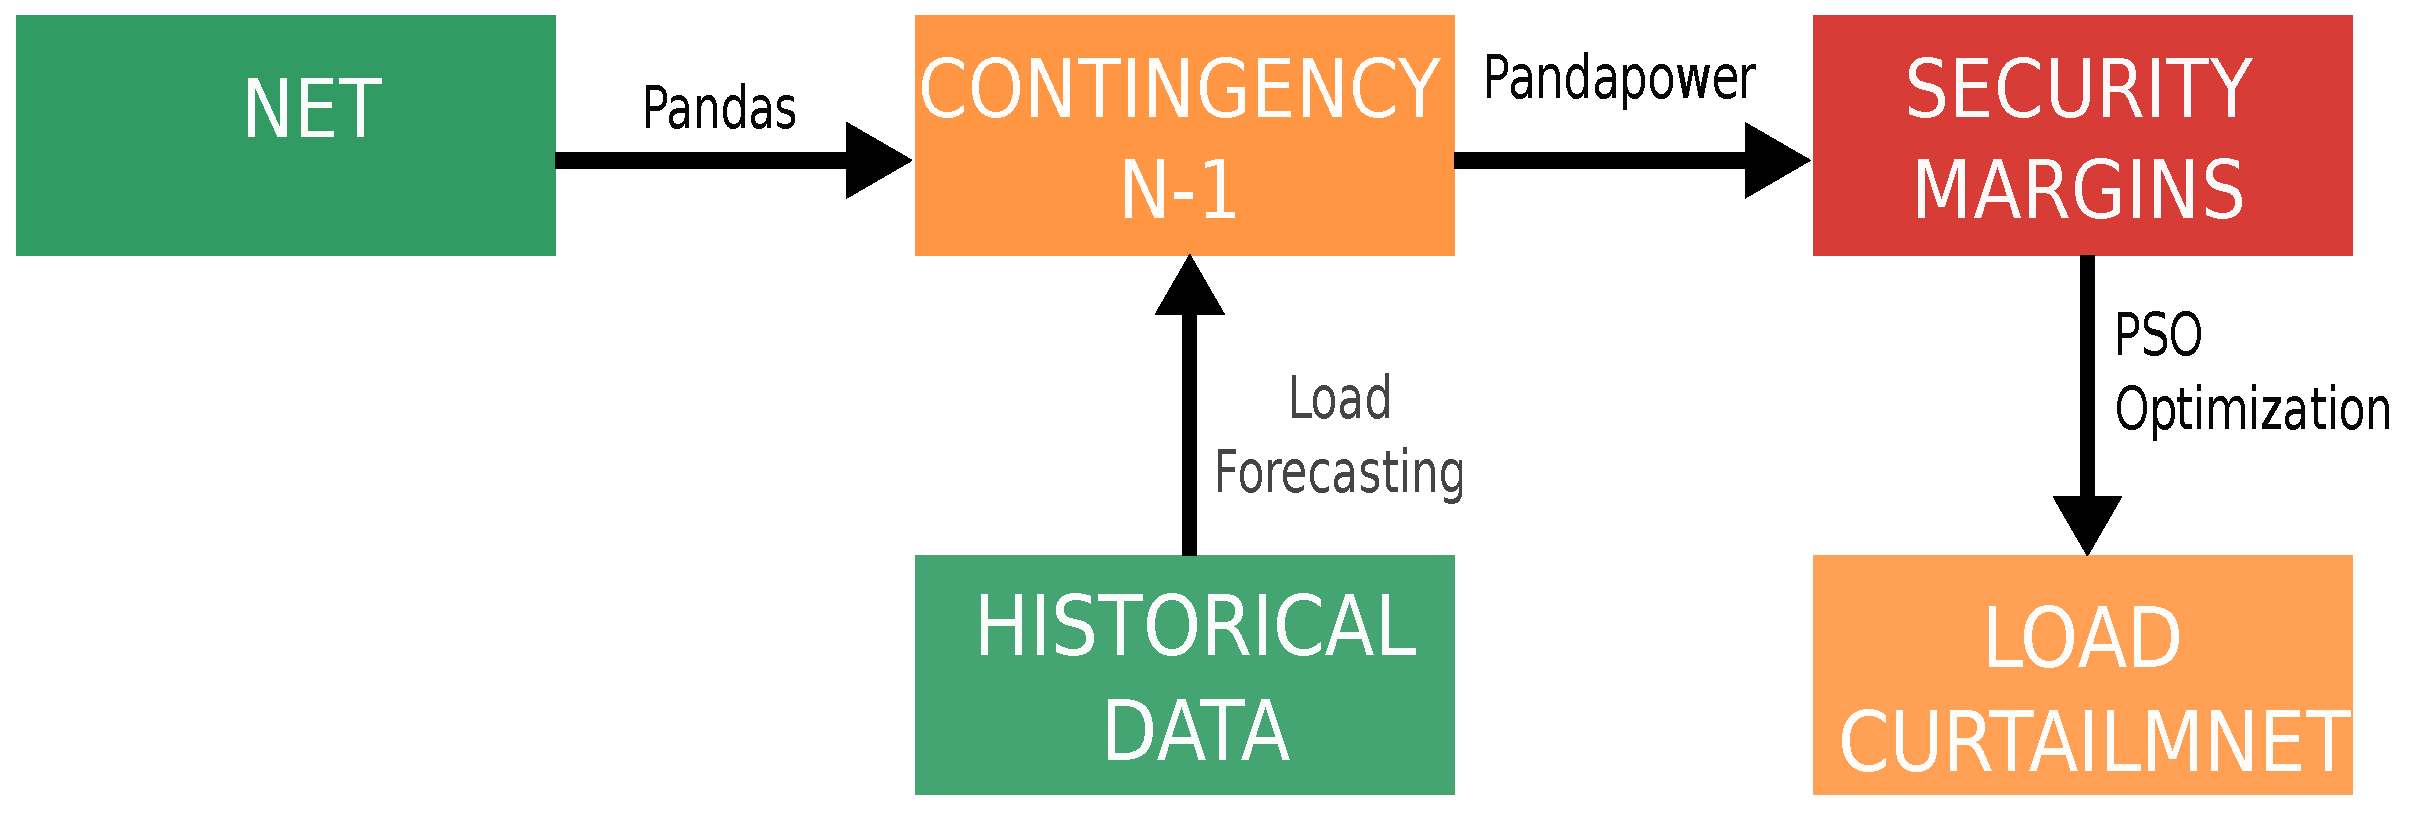
Figure 1. Proposed methodology for load curtailment optimization.
Energies 13 03236 g001
Figure 2. Load shedding algorithm. (Line 2 [33]; Line 3 [34])
Energies 13 03236 g002
Figure 3. CIGRE medium voltage distribution network benchmark [35].
Energies 13 03236 g003
Figure 4. Performance of metaheuristic algorithms for load curtailment optimization.
Energies 13 03236 g004
Figure 5. Load considering both normal operation and load shedding using the proposed methodology, when Trafo 0-1 is out of service.
Energies 13 03236 g005
Figure 6. Loading of lines and transformers for different days and hours considering: the normal operation, a contingency when transformer Trafo 0-1 is out of service and the results of load shedding using the proposed methodology for the same contingency.
Energies 13 03236 g006
Figure 7. Bus voltages for different days and hours considering: the normal operation, a contingency when transformer Trafo 0-1 is out of service, and the results of load shedding using the proposed methodology for the same contingency.
Energies 13 03236 g007
Figure 8. Energy Supplied by hour for the three assumed scenarios: normal operation, conventional method (Open SW1), and proposed method (Load Curtailment).
Energies 13 03236 g008
Figure 9. IEEE 33 bus radial distribution system.
Energies 13 03236 g009
Figure 10. Bus voltages for different days and hours considering: the normal operation, a contingency when line 1-2 is out of service, and the results of load shedding using the proposed methodology for the same contingency.
Energies 13 03236 g010
Figure 11. Energy Supplied during Thursday for normal operation, conventional method (Open line 21-11) and proposed method (Load Curtailment) for IEEE 33 bus distribution system.
Energies 13 03236 g011
Table 1. Assessment of the simulation results.
Conventional Method (Opening SW1)Proposed Load Curtailment
Weekdays S A I D I -( h )EENS-( M W h ) S A I D I -( h )EENS-( M W h )
Monday6.82137.71.8740.2
Tuesday8.14179.53.6381.0
Wednesday8.04176.13.5277.8
Thursday8.39199.84.24101.6
Friday7.63170.93.2273.0
Saturday6.89144.22.2347.0
Sunday4.4375.60.010.1
Mean7.2154.82.760.1