Article

Streaming Electrification Phenomenon of Electrical Insulating Oils for Power Transformers

Faculty of Electrical Engineering, Automatic Control and Informatics, Opole University of Technology, Prószkowska 76, 45-758 Opole, Poland
Energies 2020, 13(12), 3225; https://doi.org/10.3390/en13123225
Submission received: 19 May 2020 / Revised: 5 June 2020 / Accepted: 15 June 2020 / Published: 22 June 2020

Abstract

:
The subject matter of this study was the problem of the ECT (electrostatic charging tendency) of mineral insulation oils during their flow. The electrostatic charges generated may lead to partial discharges, and as a consequence, to the breakdown of a power transformer insulation system. In this study, the results of the ECT of mineral oils used in transformers were compared. The method of streaming electrification of insulation liquids using a flow-through system was used. The influence of flow speed, temperature, and the pipe material on the values of the electrification current and volume charge density qw were analyzed. The results obtained in this study should be taken into account regarding the operation of power transformers.

1. Introduction

The issue of streaming electrification in transformers cooled with flowing mineral oil was managed by working group 12/15-02 appointed by the CIGRE (Conference Internationale des Grands Reseaux Electriques) [1,2] and by the Massachusetts Institute of Technology and Electric Power Research Institute within the project named Static Electrification in Power Transformers [3]. Initially, the research on ECT was carried out on real transformers [4] and then on big laboratory systems modeling their operation [5]. The large systems used for ECT tests were technically complicated and very expensive (e.g., a large amount of test liquid was required). Next, small laboratory systems were introduced. The main advantages of small laboratory systems include the simple construction, low experimental costs, simplicity and stability of measurements, small sample of insulating liquid, easy change of flow parameters, oil type, and solid phase. ECT tests of various dielectric liquids, presented in the following works, were carried out in rotating or flow systems and their modifications. The ECT results from different measuring systems can be compared using the volume charge density qw. Zmarzły and Kędzia [6] presented the measurement results of the 1/f noise generated by streaming electrification. The tests were performed in a rotating electrometer system. Zdanowski et al. [7] presented the results of the most favorable conditions of ECT measurements in the rotating disk system. The work showed that a proper selection of the disk parameters makes the measured volume charge density qw independent of the hydrodynamic conditions in the measuring system on the solid and liquid phase border. Zmarzły and Boczar [8] presented streaming current distributions measured in an overflow system under laminar and turbulent conditions. Charge density distributions were determined in both cases. Zmarzły [9] presented an analytically derived model of streaming electrification phenomena in a turbulent flow. Current density distributions were determined for the entire range of conductivity and viscosity of the liquids. Zmarzły and Frącz [10] presented the results of measurements and analysis of the flow electrification process in an oscillating electrodes system. Zmarzły and Frącz [11] presented the results of measurements and analysis of the flow electrification process in a swinging cylinder system. This system is similar to the Couette system. De Tinguy et al. [12] gave a solution for the streaming current measurements using conductive materials. Consequently, the ECT of pure hydrocarbons and their mixtures [13,14,15], mineral and synthetic oils [16,17,18,19,20,21,22,23,24,25,26,27], natural and synthetic esters [28,29,30], and their mixtures with mineral oil [31,32] were examined. The research results show that the process of mineral oil electrification is very complex and depends on physicochemical properties that change due to temperature, aging processes, humidity, and electric field strength, among others. Other factors determining the streaming electrification of mineral oil are hydrodynamic conditions (flow speed), physical properties, and the surface structure of the solid material relative to how it flows. This article presents the results of streaming electrification current measurements of mineral oils in the flow-through system. During this study, the analysis of volume charge density qw from the Abedian–Sonin model was carried out. It was found that the qw charge did not depend on the oil flow velocity and could be used to compare the ECT tests. This paper shows a comparison between ECT tests of fresh Nytro Taurus oil (Nynas, Stockholm, Sweden) and nine samples of transformer oils in service. Nytro Taurus oil is the most commonly used oil in Polish transformers. The results show that the ECT of oils is different, although the basic physicochemical parameters are similar. These are important results to be utilized, especially due to the occurrence of hot spots in the transformer. The issues analyzed are interesting from a scientific point of view and are also important in terms of the operation and diagnostics of power transformers.

2. Materials and Methods
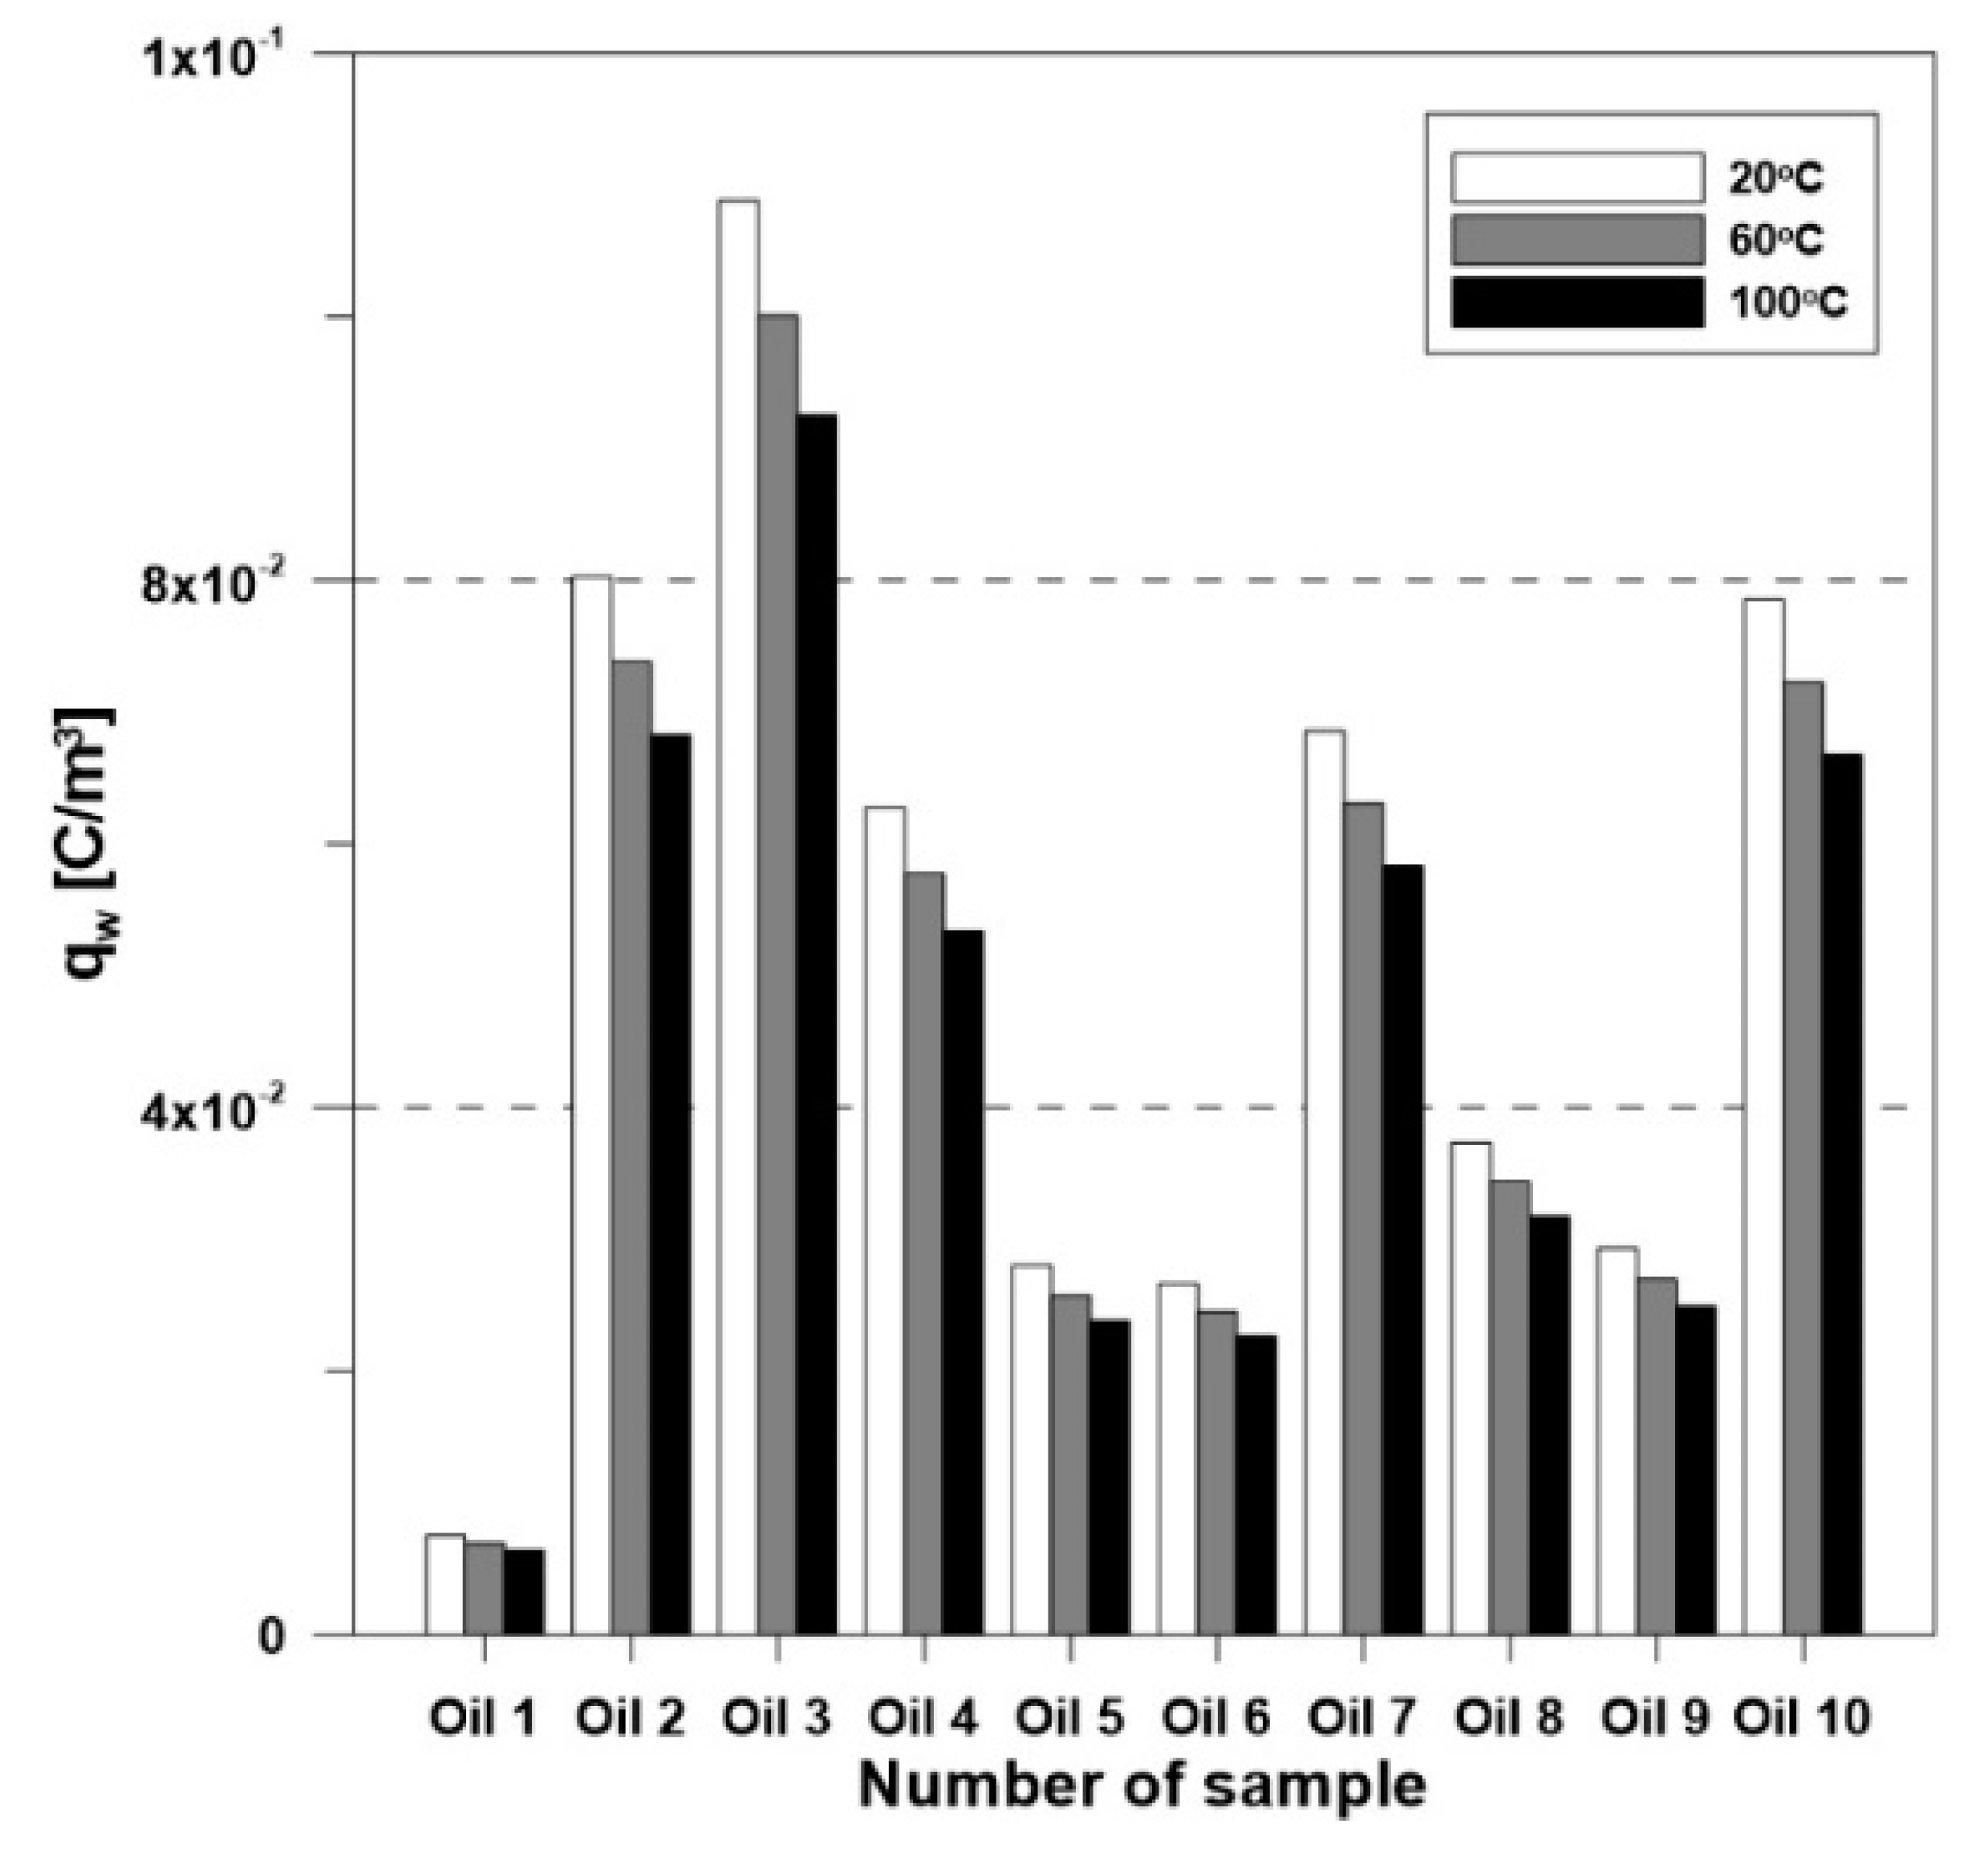
The flow-through system (Figure 1) for the investigation of streaming electrification of mineral oil consisted of an airtight upper container in which a heater, solenoid valve, and a measuring pipe were installed. The lower container was placed on Teflon insulators in a Faraday cage and connected with a Keithley 6517A electrometer. Dedicated software installed on a portable computer was used for configuring the meter and registering and visualizing the measurements [33].
The liquid flow speed through the pipe was adjusted by changing the pressure of nitrogen in the upper container and the flow time was adjusted using the solenoid valve. The oil temperature was controlled using a heater with a thermostat. The measurements of the electrification current of mineral oils were taken in the flow speed range from 0.34 to 1.75 m/s within 120 seconds. The temperature was stabilized in the range from 20 to 100 °C. A detailed description of the measuring system can be found in References [30,31]. The investigations were carried out on a sample of Nytro Taurus fresh insulation oil (oil 1) and nine oil samples (oils 2–10), which were collected from transformers operating in the Polish power system. The oil sample volume for the ECT test was 5 liters. The pipes of 400 mm length and 4 mm diameter made from aluminum, cellulose, or aramid paper. The volume charge density qw was determined using the mathematical Abedian–Sonin electrification model [34], taking into consideration the electrification current and the properties of insulation liquids (Table 1). The electrification current in this model for any pipeline length was found using Equations (1) and (2):
I q w π R 2 v = R e τ w λ 2 ρ v 2 R 2 [ 1 δ λ sin h ( δ λ ) ] + δ λ sin h ( δ λ ) [ 2 λ 2 1 + R δ 2 λ 2 ]
I = I [ 1 e l L ]
where I—electrification current for infinite pipe length, qw—volume charge density on the phase border, R—pipe radius, v—average liquid velocity, Re—Reynolds number, τw—shearing stresses, λ—Debye length, ρ—liquid density, δ—laminar sublayer thickness, I—electrification current for any pipe length, L—characteristic length of the pipe, and l—length of the pipe.

3. Results

Figure 2 shows the characteristics of the streaming electrification current generated due to the flow of the Nytro Taurus fresh mineral oil (oil 1) through the pipes made from various materials. The streaming electrification current was linearly dependent on the flow rate of the insulation liquid. It was found that the intensity of the streaming electrification phenomenon significantly depended on the material the measuring pipe was made from. The mineral oil tested was least electrified for the flow through a cellulose pipe. The highest values of the electrification current were measured when using a metal pipe (aluminum). When changing the flow speed from 0.34 to 1.75 m/s, the electrification current increased from 0.5 to 2.55 pA (cellulose pipe), from 0.9 to 4.5 pA (aramid pipe), and from 1.2 to 6.3 pA (aluminum pipe). In Figure 3, the plots of the electrification current of oils 1–3 using an aluminum pipe are compared. A logarithmic scale was used for a better comparison of the current characteristics.
In Figure 4, the results of the electrification current investigations for all oil samples at T = 20 °C and v = 0.34 m/s (gravitational flow) are listed in the form of a bar graph. It was observed that the oils that are currently in operation became electrified from a few to a dozen or so times more than fresh mineral oil. Determining the influence of temperature on the electrification of mineral oils constituted another stage of the research. By analyzing the I = f(T) characteristics, it was found that temperature had a significant influence on the generation of electrostatic charges during the flow of mineral oils. With a temperature increase in the range from 20 to 100 °C, the value of the measured electrification current of oil 1 increased exponentially for each type of measuring pipe used (Figure 5).
For a sample flow speed of v = 1 m/s and temperature of T = 100 °C, the electrification current of the fresh mineral oil increased: 23 pA in a cellulose pipe, 39 pA in an aramid pipe, and 52 pA in an aluminum pipe. A comparison of current characteristics in the temperature function of oils 1–3 is shown using a logarithmic scale (Figure 6).
To fully visualize the differences in the measured electrification current values vs. temperature of all oil samples, a collective bar graph was made (Figure 7). Of all the tested samples collected from transformers, oil 3 displayed the highest values of electrification currents in the whole range of flow speed and temperature. At 20 °C and at the maximum flow speed (1.75 m/s), the electrification current of oil 3 was 80 pA, and it achieved a value of 548 pA at 100 °C. Based on the measurements of the electrification currents and selected physicochemical properties of mineral oil samples (Table 1), the volume charge density qw at the solid and liquid phase contact border was determined using the mathematical Abedian–Sonin model. According to the model’s assumptions, this parameter constitutes a material index that describes the ECT of insulation liquid since it is dependent on the properties of the liquid and the surface of a solid body, and it does not depend on hydrodynamic conditions (liquid flow speed). The characteristics qw = f(v) for oil 1 shown in Figure 8 successfully verified the adopted model’s assumptions. The average values of charge qw for fresh mineral oil flowing through the cellulose, aramid, and aluminum pipes at 20 °C were 0.0033 C/m3, 0.0059 C/m3, and 0.0079 C/m3, respectively.
The parameter analyzed did not depend on the flow speed of the oils either. To give an example, the volume charge density qw of oils 1–3 using the aluminum pipe were compared (Figure 9). In this case, the average values of the volume charge density qw were 0.0079 C/m3, 0.077 C/m3, and 0.11 C/m3, respectively. A collective representation of the volume charge density qw for all oils for 20 °C is shown as a bar graph (Figure 10). A temperature increase caused a drop in qw for all insulation liquids, regardless of the pipe material used (Figure 11, Figure 12 and Figure 13). In the case of oil 3, the density of charge qw when using an aluminum pipe decreased from 0.11 C/m3 (20 °C) to 0.09 C/m3 (100 °C).
The change of qw resulted from the influence of temperature on other physicochemical parameters included in the Abedian–Sonin model. Temperature has a significant impact on most measured physicochemical values of insulation liquids, including conductivity and relative permittivity, as well as the parameters connected with hydrodynamics, such as kinetic viscosity or oil density. This fact shows that temperature does not directly cause the danger of static electrification in a transformer insulation system. However, its significance cannot be ignored as it has a significant impact on the aging processes taking place in a transformer insulation system.

4. Conclusions

In this study, the results of the ECT of mineral oils collected from operating transformers were compared with the Nytro Taurus fresh mineral oil from Nynas. The investigations were carried out in a flow-through system with a pipe. The influence of the oil flow speed (0.34–1.75 m/s), temperature (20–100 °C), and the type of the measuring pipe material (cellulose paper, aramid paper, aluminum) on the size of the streaming electrification current were analyzed. All the parameters mentioned significantly affected the generation of electrostatic charges in insulation oil during its flow. The model analyses showed that the volume charge density qw depended on physicochemical properties, oil temperature, and the measuring pipe material. However, this parameter did not depend on the flow speed of the insulation liquid. The research carried out confirmed that it was possible to use the volume charge density qw as the parameter for determining the ECT of liquid dielectrics. It was also found that the Nytro Taurus fresh mineral oil had the lowest ECT and oil 3 had the highest ECT. The oils currently being used have various ECTs, although their physicochemical properties are similar. The research showed that the streaming electrification phenomenon is a complex process and it may also be significant in the oils whose basic insulation properties are within the limits of operational standards. The chemical composition of the oil may influence the size of the ECT. Aging processes taking place during the long-time use of oil in a transformer, which changes its physicochemical properties, constitutes another factor determining the phenomenon of electrification. Even though ECT investigations are not required in the diagnostics of transformer insulation systems, they may provide an additional parameter. There is a considerable need to monitor the ECT of mineral oils in use as this phenomenon may influence the initiation of partial discharges in a transformer insulation system, even though the basic physicochemical properties of oil do not show any deviations from the applicable standards. ECT test results should be extended to more oil samples. It would be interesting to create a charge density qw database to compare the ECT results from different transformers. Transformer manufacturers carry out ECT tests at the customer’s request. ECT tests should be combined with tests of other oil parameters, e.g., acoustic emission.

Funding

This research received no external funding.

Conflicts of Interest

The authors declare no conflict of interest.

References

  1. Tagaki, T.; Ishi, T.; Okada, T.; Kurita, K.; Tamura, R.; Murata, H. Reliability Improvement of 500 kV Large Capacity Power Transformer; Paper 12-02; CIGRE S12: Paris, France, 1978; Volume 12. [Google Scholar]
  2. Lindgren, S.R.; Washabaugh, A.P.; Zahn, M.; von Guggenberg, P.; Brubaker, M.; Nelson, J.K. Temperature and Moisture Transient Effects on Flow Electrification in Power Transformers; Paper 15/12-02; CIGRE, General Session: Paris, France, 1992; Volume 1. [Google Scholar]
  3. Sierota, A.; Rungis, J. Electrostatic Charging in Transformers Oils. Testing and Assessment. IEEE Trans. Dielectr. Electr. Insul. 1994, 1, 804–870. [Google Scholar] [CrossRef]
  4. Higaki, M.; Kako, Y.; Moriyama, M.; Hirano, M.; Hiraishi, K.; Kurita, K. Static Electrification and Partial Discharges Caused by Oil Flow in Forced Oil Cooled Core Type Transformers. IEEE Trans. Power Appar. Syst. 1979, 98, 1259–1267. [Google Scholar] [CrossRef]
  5. Krause, C.; Knoll, E.; Alff, J.; Stonitsch, R. Impact of AC-Fields on Dielectric Charging in a Full-Scale Power Transformer. In Proceedings of the 9th International Symposium High Voltage Engineering, Graz, Austria, 28 August–1 September 1995; pp. 1080/1–1080/4. [Google Scholar]
  6. Zmarzły, D.; Kędzia, J. A Noise Analyzer for Monitoring Static Electrification Current. J. Electrost. 2005, 63, 409–422. [Google Scholar] [CrossRef]
  7. Zdanowski, M.; Wolny, S.; Zmarzły, D.; Kędzia, J. The Analysis and Selection of the Spinning Disk System Parameters for The Measurement of Static Electrification of Insulation Oils. IEEE Trans. Dielectr. Electr. Insul. 2007, 14, 480–486. [Google Scholar] [CrossRef]
  8. Zmarzły, D.; Boczar, T. Measurements of Distribution of Streaming Electrification Current Inside a Pipe. IEEE Trans. Dielectr. Electr. Insul. 2009, 16, 1681–1685. [Google Scholar] [CrossRef]
  9. Zmarzły, D. Streaming Electrification Current Model in a Round Pipe in Turbulent Regime. IEEE Trans. Dielectr. Electr. Insul. 2013, 20, 1497–1509. [Google Scholar] [CrossRef]
  10. Zmarzły, D.; Frącz, P. Streaming Electrification in the Swinging Plate System. IEEE Trans. Dielectr. Electr. Insul. 2017, 24, 3217–3225. [Google Scholar] [CrossRef]
  11. Zmarzły, D.; Frącz, P. Dynamics of Impulse Response of Streaming Electrification Current in Swinging Cylinder System Insulation. IEEE Trans. Dielectr. Electr. Insul. 2018, 25, 713–720. [Google Scholar] [CrossRef]
  12. De Tinguy, M.; Paillat, T.; Leblanc, P.; Touchard, G. Critical analysis of the flow electrification measurement for a conductive solid/liquid couple. Int. J. Plasma Environ. Sci. Technol. 2020, 14, e01001. [Google Scholar]
  13. Zdanowski, M.; Wolny, S.; Zmarzły, D.; Boczar, T. ECT of Ethanol and Hexane Mixtures in The Spinning Disc System. J. Electrost. 2007, 65, 239–243. [Google Scholar] [CrossRef]
  14. Zdanowski, M.; Kędzia, J. Research on the Electrostatic Properties of Liquid Dielectric Mixtures. J. Electrost. 2007, 65, 506–510. [Google Scholar] [CrossRef]
  15. Zdanowski, M. Influence of Composition of Dielectric Liquid Mixtures on Electrostatic Charge Tendency and Physicochemical Parameters. IEEE Trans. Dielectr. Electr. Insul. 2008, 15, 527–532. [Google Scholar]
  16. Ren, S.; Li, H.; Zhong, L.; Yu, Q.; Tang, C.; Zhu, H.; Cao, X.; Hanai, M.; Yamada, S.; Imamura, T.; et al. Research on Streaming Electrification of Insulation Mineral Oil. In Proceedings of the 2009 IEEE 9th International Conference on the Properties and Applications of Dielectric Materials, Harbin, China, 19–23 July 2009; pp. 988–991. [Google Scholar]
  17. L-Adawy, M.; Paillat, T.; Touchard, G.; Cabaleiro, J.M. Numerical Simulation of the Electrical Double Layer Development: Pysicochemical Model at the Solid and Dielectric Liquid Interface for Laminar Flow Electrification Phenomenon. IEEE Trans. Dielectr. Electr. Insul. 2011, 18, 1463–1475. [Google Scholar] [CrossRef]
  18. Vihacencu, M.S.; Notingher, P.V.; Paillat, T.; Jarny, S. Flow Electrification Phenomenon for Newtonian and Non-Newtonian Liquids: Influence of Liquid Conductivity, Viscosity and Shear Stress. IEEE Trans. Dielectr. Electr. Insul. 2014, 21, 693–703. [Google Scholar] [CrossRef]
  19. Fofana, I.; Bouslimi, Y.; Hemmatjou, H.; Volant, C.; Tahiri, K. Relationship between Static Electrification of Transformer Oils with Turbidity and Spectrophotometry Measurements. Int. J. Electr. Power Energy Syst. 2014, 54, 38–44. [Google Scholar] [CrossRef]
  20. Chen, Q.; Lin, L.; Gao, Y.; Li, J. Flow Electrification Characteristics of Oilpressboard Insulation under AC Superimposed on DC Electric Field. IEEE Trans. Dielectr. Electr. Insul. 2015, 22, 2915–2922. [Google Scholar] [CrossRef]
  21. Dai, J.; Wu, K.; Jiang, Y.; Cheng, C.; Zhou, J. A Numerical Simulation Model for Oil Flow Electrification under DC Voltage. In Proceedings of the 2017 International Symposium on Electrical Insulating Materials (ISEIM), Toyohashi, Japan, 11–15 September 2017; pp. 687–690. [Google Scholar]
  22. Gao, Y.; Li, F.; Lu, W.; Zhao, W. Effect of Temperature on Flow Electrification under DC Electrical Field. J. Eng. 2019, 2019, 2893–2896. [Google Scholar] [CrossRef]
  23. Ishikawa, T.; Yasuda, K.T.; Igarashi, T.; Yanabu, S.; Ueta, G.; Okabe, S. Effect of Temperature on the Streaming Electrification Characteristics of Silicone Oil. IEEE Trans. Dielectr. Electr. Insul. 2009, 16, 273–280. [Google Scholar] [CrossRef]
  24. Nakajima, A.; Miyahara, H.; Ishikawa, T.; Wada, J.; Yanabu, S. Streaming Electrification Characteristics of Silicone Oil. IEEE Trans. Dielectr. Electr. Insul. 2008, 15, 519–526. [Google Scholar] [CrossRef]
  25. Yoshida, M.; Moriguchi, S.; Sato, G.; Konishi, Y.; Hasegawa, M. Development of Testing Method for Static Electrification Within Power Transformer Using Suspended Cellulose Fibers in Insulating Oil. In Proceedings of the 21st International Symposium on High Voltage Engineering, Budapest, Hungary, 28 November 2019; pp. 908–916. [Google Scholar]
  26. Ren, S.; Liu, Q.; Zhong, L.; Yu, Q.; Xu, Y.; Cao, X.; Hanai, M.; Yamada, S.; Mori, S. Electrostatic Charging Tendency and Correlation Analysis of Mineral Insulation Oils under Thermal Aging. IEEE Trans. Dielectr. Electr. Insul. 2011, 18, 499–505. [Google Scholar]
  27. Leblanc, P.; Paillat, T.; Cabaleiro, J.M.; Touchard, G. Flow electrification investigation under the effect of the flow parameters. Int. J. Plasma Env. Sci. Technol. 2018, 11, 156–160. [Google Scholar]
  28. Zelu, Y.; Paillat, T.; Morin, G.; Perrier, C.; Saravolac, M. Study on Flow Electrification Hazards with Ester Oils. In Proceedings of the 2011 IEEE International Conference on Dielectric Liquids (ICDL), Trondheim, Norway, 26–30 June 2011. [Google Scholar]
  29. Talhi, M.; Fofana, I.; Flazi, S. Comparative Study of the Electrostatic Charging Tendency between Synthetic Ester and Mineral Oil. IEEE Trans. Dielectr. Electr. Insul. 2013, 20, 1598–1606. [Google Scholar] [CrossRef]
  30. Zdanowski, M. Streaming Electrification of Mineral Insulating Oil and Synthetic Ester MIDEL 7131®. IEEE Trans. Dielectr. Electr. Insul. 2014, 21, 1127–1132. [Google Scholar] [CrossRef]
  31. Zdanowski, M.; Maleska, M. Streaming Electrification of Insulating Liquid Mixtures. Arch. Electr. Eng. 2019, 68, 387–397. [Google Scholar]
  32. Rajab, A.; Gumilang, H. Study on static electrification of the PFAE-mineral oil mixture. In Proceedings of the Conference on Innovation in Technology and Engineering Science, Padang, Indonesia, 8–9 November 2018; Volume 602. [Google Scholar]
  33. Zdanowski, M.; Ozon, T. Measuring system for a streaming electrification tests of insulating liquids. Poznan University of Technology Academic Journals. Elect. Eng. 2016, 86, 393–403. (In Polish) [Google Scholar]
  34. Abedian, B.; Sonin, A.A. Theory for Electric Charging in Turbulent Pipe Flow. J. Fluid Mech. 1981, 120, 199–217. [Google Scholar] [CrossRef]
Figure 1. Flow-through system for the investigation of streaming electrification of insulation liquids: 1—upper container, 2—liquid, 3—solenoid valve, 4—measuring pipe, 5—lower container, 6—Faraday cage, 7—Teflon insulator, H—heater with a thermostat, and E—Keithley 6517A electrometer.
Energies 13 03225 g001
Figure 2. Electrification current vs. flow velocity of oil 1 (1—cellulose pipe, 2—aramid pipe, 3—aluminum pipe, T = 20 °C).
Energies 13 03225 g002
Figure 3. Electrification current vs. flow velocity of selected mineral oils (aluminum pipe, T = 20 °C).
Energies 13 03225 g003
Figure 4. Electrification current vs. pipe material for all mineral oils (v = 0.34 m/s, T = 20 °C).
Energies 13 03225 g004
Figure 5. Electrification current vs. temperature of oil 1 (1—cellulose pipe, 2—aramid pipe, 3—aluminum pipe, v = 1 m/s).
Energies 13 03225 g005
Figure 6. Electrification current vs. temperature of selected mineral oils (aluminum pipe, v = 1 m/s).
Energies 13 03225 g006
Figure 7. Electrification current vs. temperature for all mineral oils (aluminum pipe, v = 1 m/s).
Energies 13 03225 g007
Figure 8. Volume charge density qw vs. flow velocity of oil 1 (T = 20 °C).
Energies 13 03225 g008
Figure 9. Volume charge density qw vs. flow velocity of selected mineral oils (alum. Pipe, T = 20 °C).
Energies 13 03225 g009
Figure 10. Volume charge density qw vs. pipe material for all mineral oils (T = 20 °C).
Energies 13 03225 g010
Figure 11. Volume charge density qw vs. temperature of oil 1.
Energies 13 03225 g011
Figure 12. Volume charge density qw vs. temperature of selected mineral oils (aluminum pipe).
Energies 13 03225 g012
Figure 13. Volume charge density qw vs. temperature for all mineral oils (aluminum pipe).
Energies 13 03225 g013
Table 1. Properties of the mineral oils under study (20 °C).
Sample NumberDensity
(kg/m3)
Viscosity
(m2/s)
Conductivity
(S/m)
Relative
Permittivity (–)
Oil 18712.20 × 10−51.22 × 10−132.20
Oil 28661.66 × 10−56.58 × 10−122.21
Oil 38771.46 × 10−52.63 × 10−122.22
Oil 48821.31 × 10−52.14 × 10−112.24
Oil 58831.29 × 10−53.17 × 10−112.23
Oil 68781.48 × 10−51.29 × 10−112.21
Oil 78811.70 × 10−51.17 × 10−112.22
Oil 88831.59 × 10−52.95 × 10−112.23
Oil 98871.29 × 10−51.43 × 10−112.21
Oil 108851.33 × 10−52.92 × 10−112.23

