Abstract
Solar absorption cycles for air conditioning systems have recently attracted much attention. They have some important advantages that aid in reducing greenhouse gas emissions. In this work, design and thermo-economic analyses are presented in order to compare between two different collector types (parabolic trough and evacuated tube) by water–lithium bromide absorption systems, and to select the best operating conditions. Generally, the system consists of three major parts. The first part is the solar field for thermal power conversion. The second part is the intermediate cycle, which contains a flashing tank and pumping system. The third part is the water lithium bromide absorption chiller. A case study for a sports arena with 700–800 kW total cooling load is also presented. Results reveal that a parabolic trough collector combined with H2O–LiBr (PTC/H2O–LiBr) gives lower design aspects and minimum rates of hourly costs (USD 5.2/h), while ETC/H2O–LiBr configuration give USD 5.6/h. The H2O–LiBr thermo-economic product cost is USD 0.14/GJ. The cycle coefficient of performance COP was in the range of 0.5 to 0.9.
1. Introduction
In recent years, the utilization of renewable energies has allowed the development of new technologies to reduce carbon dioxide (CO2) emissions, greenhouse gasses, and global warming. Air conditioning and refrigeration are widely used in various sectors, whether industrial or domestic and in developing countries, the energy demand is expecting to increase by 35% between 2010 and 2035 [1]. This increase is associated with world population and economic growth. Besides, air conditioning consumption has been increasing worldwide, significantly affecting energy demand, due to the high-power consumption of compression systems [2]. However, like any thermal systems, energy consumption should be considered and be manipulated. Furthermore, the growing requirements related to thermal comfort are also observed. Moreover, in the last few years, there has been increasing attention paid to effective technologies in order to achieve both energy saving and CO2 emission reduction [3]. As a clean source of energy is needed for refrigeration and air conditioning cycles, a growing interest in the use of solar thermal applications to produce renewable and sustainable energy, coupled with the remarkable progress being made in nanotechnology, has been observed, along with many innovative solutions. Rashid [4] presented a novel design of a hybrid solar thermal and natural gas power plant, based on parabolic trough collectors (PTC). The main objective was to study the techno-economic feasibility and environmental impacts of various configurations of hybrid and non-hybrid systems for concentrated solar power (CSP). Generally, cooling power production needs electrical or mechanical power, whereas absorption chillers can produce chilled water from low-temperature heat. Such heat can be provided by solar thermal collectors [5]. Sheha et al. [6] investigated the cost-savings potential in the performance of air conditioning systems in domestic homes through dynamic real-time optimization. Two different electricity price ranges were implemented. The results show that the energy costs are significantly reduced for the optimized cases with battery energy storage versus cases without a battery, under each price level.
On the other hand, the cooling load tends to coincide with the availability of solar radiation [7], which makes it interesting to consider the use of solar radiation as an energy source for a system of air conditioning. In this sense, different alternatives have been studied, as has the use of photovoltaic panels or thermal engines in compression systems, and solar thermal collectors in absorption or adsorption systems. The main difference between a compression system and one of absorption or adsorption is that, within the cycle, the mechanical compressor is replaced by a thermal compressor. Conventional cooling systems have used environmentally harmful refrigerants, such as chlorine, fluorine, and carbon compounds (CFCs), which destroy the ozone layer, unlike absorption cooling, which generally uses organic compounds, making it a very effective alternative for saving electricity and reducing the environmental pollution. Furthermore, absorption systems achieve primary energy savings and reduce greenhouse gas emissions for solar fractions higher than about 50% [8]. Therefore, absorption refrigeration systems could be a good alternative in order to reduce electricity consumption in industrial cooling, and they can also and profit economics [9,10,11,12].
For these systems, the most commonly used refrigerant/absorbent pairs reported in the literature are water/lithium bromide (H2O–LiBr) and ammonia/water (NH3–H2O) [8]. The most widely used system for a commercial for air conditioning is the water/lithium bromide pair, while for refrigeration the more common is the ammonia/water pair [13]. The most common configurations of a system are single-effect or double-effect. The single-effect configuration has a coefficient of operation between 0.6 and 0.8. The double-effect has an operating coefficient of 1.2 [14,15,16]. The most used of these configurations is the single-effect since the temperatures required for the generator are in the range of the temperature obtained in low-temperature solar thermal collectors. The solar thermal collectors utilized in absorption systems include flat plate collectors (FPC), evacuated tube collectors (ETC), and parabolic through collectors (PTC). From these technologies, the ones most widely integrated with a double-effect are the PTCs and the ETCs. For configurations of a single effect, FPC and ETC are used [16]. According to comparative studies, the best configuration for an absorption system with solar assistance is a single effect using H2O–LiBr as a working pair [17]. For improving the performance of absorption systems, the most widely used technique is to have a water storage tank, to diminish the differences that may exist between the cooling demand and the radiation of the solar energy [18] Y. Hwang et al. [19] mentioned that the research in solar thermal cooling technologies should be directed towards the development of advanced high-efficiency and high-temperature solar collectors, and the development of high-efficiency cooling technologies working with low temperatures, both at low costs. In addition, there must be a commitment to seeking the best-operating conditions that allow the maximum global efficiency of the system, despite their having high-efficiency technologies individually.
Currently, there are worldwide facilities for both demonstrations and the commercial use of solar-assisted adsorption or absorption systems. The loads they handle are mainly medium (50 kW to 250 kW) and some small loads (10 kW to 50 kW) since the main limitation to the application of this technology is the space needed to install the solar thermal collectors [20]. In solar cooling technologies, one of the most difficult parameters determining the cost of the system, as this technology is still in development. Currently, the figures that are handled by the demonstration projects are between USD 1600 and 3200 per kW of refrigeration [21].
One of the advantages of the absorption cycle is the possibility of using various heat sources as the input to the generator. Wang et al. [22] studied a proposed solar cooling system based on a double-effect H2O–LiBr absorption chiller coupled with a parabolic trough collector (PTC), to cover the cooling load in various building applications. The simulation results have been compared with the experimental data and the thermodynamic analysis of a solar cooling system for a hotel case study, showing that the average coefficient of performance COP of the absorption chiller is about 1.195, and the entire solar cooling system reaches a solar energy utilization efficiency of 61.98%.
In order to reach higher energy efficiency, Calise et al. [23] demonstrated a novel high-temperature technology driven by solar energy in a combined cycle power (CCP) plant and performed a thermo-economic evaluation of a novel solar cooling system for the CCP plant. Delaˇc et al. [24] have designed a solar air conditioning system for cooling and heating purpose. The system is comprised of absorber and condenser heat recovery, and the scenario presentation has demonstrated up to a 53% recovery of absorber and condenser heat. Bellos et al. [25] carried out a thermo-economic analysis of solar absorption air conditioning system based on four different collectors, including evacuated tube collectors (ETC), flat plate collectors (FPC), parabolic through collectors (PTC) and compound parabolic collectors (CPC). The results of the comparisons show that the configuration of the system with the optimum exegetic efficiency and maximum COP recorded was PTC, due to its high efficiency. Aman et al. [26] presented exergy and energy evaluations of an aqua ammonia water chiller coupled with a flat plate thermal collector (FPC) for domestic application.
In a recent study, Al-Falahi Adil [27] investigated the energy performance of a solar absorption air conditioning system integrated with ETC, in the climate of Baghdad, Iraq. It was concluded that the seasonal collector efficiency and solar fractions are 54% and 58%, respectively, and the absorption chiller COP was 0.44. Relevant to the H2O–LiBr chiller we have used in this study, Cabrera et al. [28] reported that the most widely utilized solar cooling technologies are the single effect H2O–LiBr integrated with FPC, and that with ETC. The chiller’s coefficient of performance (COP) ranged between 0.5 and 0.8 at a hot generator temperature of about 75–95 °C. A single effect H2O–LiBr is considered in this study.
Various types of thermal solar collectors can be coupled with single-effect absorption chillers. Cabrera et al. [28] investigated the utilization of PTC for solar cooling applications. It was concluded that a lightweight and small sized modular PTC can easily be mounted on the building’s rooftop, and ought to be the goal of the producers. A comparison of various cooling technologies combined with PTC is additionally given in [28], and a general overview of the parabolic trough collectors can be found in [29]. Fong et al. [30] compared various solar thermal collectors and cooling systems for air conditioning applications in buildings in tropical areas. They concluded that, for the absorption cycle, the PTC is slightly higher in the consumption of energy than the FPC by 7.3%, which differs from the evacuated tube collectors by 36.5%. A. Aliane [31] explored different case studies on solar thermal absorption systems. Ayman et al. [32] investigated, by a developed model, a proposed design for a pilot test unit of 10 kW electrical power, with capacity for 1.7 m3/day of desalinated water, and 3.6 TR (Ton of Refrigeration) cooling load capacity. The system showed how it was very effective in utilizing solar energy for power generation, water desalination, and air conditioning systems. H2O–LiBr was used for the air conditioning/cooling part. Wang et al. [33] investigated the effect of large temperature gradients and serious nanoparticles photothermal conversion efficiency on direct absorption solar collectors. Rasool Elahi [34] studied the effect of using solar plasma for the enhancement operation of solar-assisted absorption cycles. Related to thermo-economics, Salehi [35] studied the feasibility of using absorption heat pumps to cover space heating load; in this study, absorption compression and absorption (H2O–LiBr and NH3–H2O) -enhanced heat pumps are investigated for heating space loads of 2 MW(Mega Watt). Utilizing geothermal hot springs as heat sources for refrigerant evaporation, the freezing problem is prevented, and the coefficient of performance COP ranged between 1.4 and 1.6.
It is clear from the literature that solar energy has a great influence on refrigeration and/or air conditioning processes. Different types and configurations of solar collectors have been applied for such purposes. The most common type used was the evacuated tube collector. Moreover, it has been noticed that H2O–LiBr have been used for most of the research activities in this regard for air conditioning applications. The aim of this work is to optimize and design H2O–LiBr absorption air conditioning systems that are operated by two different types of solar collectors (ETC and PTC), based on energy, exergy, design and cost. Selecting the best operating conditions has also been a focus. The following general outlines are proposed for this work:
- ✓
- H2O–LiBr absorption cycles have been studied under different operating conditions. The selection was made based on the best-operating conditions.
- ✓
- Two different types of solar collectors (ETC and PTC) have been compared, while combining them with absorption cycles.
- ✓
- A detailed mathematical model has been performed.
- ✓
- The comparison is performed based on the terms of energy, exergy, design, cost, and thermo-economics. The design technique of modeling has been adopted in this study.
- ✓
- Based on the optimized selection, a case study for a 700–800 kW (200–230 TR) cooling load has been performed.
2. Proposed System Configuration
The solar absorption air conditioning (AAC) system under study is comprised of several important elements. One such element is the heat medium production cycle, which includes solar thermal collectors, a solar flash tank, a pump, and a distribution cycle. Another important element is the cold medium production cycle, which integrates an absorption chiller, a cooling tower, and two circulating pumps connected respectively to absorber and evaporator. The currently proposed cycles are shown in Figure 1 and Figure 2. The energy obtained from the incident solar radiation heats the water in a field of solar thermal collectors; then, the hot water flows into a solar tank and is subsequently transported to the absorption chiller to produce chilled water, which circulates through a conventional distribution system of individual fan coils to deliver cold air to the building. The cooling water dissipates the heat of the absorber and condenser of the chiller through the cooling tower. The currently proposed thermal cooling system is comprised of the following important elements:
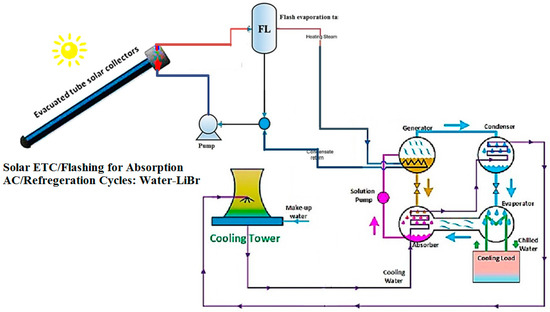
Figure 1.
Tube solar collector-assisted H2O–LiBr absorption air conditioning cycle.
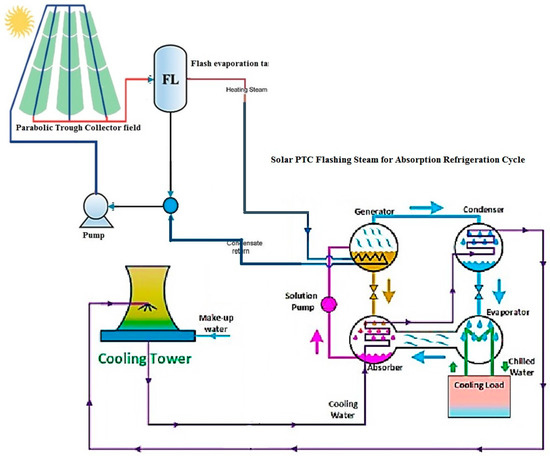
Figure 2.
Trough solar collector-assisted H2O–LiBr absorption air conditioning cycle.
- ➢
- Evacuated tube collector (ETC) and/or parabolic trough collector (PTC) for thermal power generation. Water working fluid is the main fluid through the solar part.
- ➢
- A flash evaporation tank is used for steam generation.
- ➢
- The pumping unit has been used for flow circulation and pressure drop issues.
The H2O–LiBr absorption part contains the following:
- ➢
- Air conditioning as a cooling load, and this part is attached to the evaporator unit. The fan cooling unit is attached to the air cooler unit.
- ➢
- Absorber unit.
- ➢
- Generator unit, and this part is attached to the solar part. The flash evaporation tank will generate sufficient steam in order to drive on the generator unit.
- ➢
- Condenser unit for condensation process, which will be cooled down by the use of the mechanical draft cooling tower.
- ➢
- A mechanical draft cross flow cooling tower is used for the condenser unit. The water cooling cycle is passing through the absorber unit before cooling down the condenser unit.
- ➢
- The cycle is considered a closed cycle related to the working flowed through it.
3. Methodology, Mathematical Model and Assumptions
The proposed configurations in this study require iterative programming to calculate the complicated flows (recycling and backflow). Therefore, to perform dedicated modeling for this type of innovative plant, the Simulink software, a product of a MATLAB work, was selected for its high flexibility and capability in managing unstable situations. Two models were developed based on the proposed configurations. Both models have been built in accordance with the calculation method of the design. The user assigns the boundary currents of the system (outlet temperature, ambient temperature, inlet cooling water temperature, etc.), and then all the design data will be calculated (surface area, length, volume, mass flow rate, etc.). Hence, the user allocates the required amount of cooling load on the evaporator, and afterward all the potential data for all the units in the system will be computed in sequence. Identifying the cooling load of the system allows for the calculation of the required heat load. In addition, the design limits and required performance calculations can be instantly passed. The modeling assumptions are listed in Table 1. The liquid- and vapor-saturated phases of pressure, temperature, enthalpy, specific volume and specific entropy are recorded after the modeled blocks and lookup tables. A source of the physical properties is provided by the chemistry book on the National Institute of Standards and Technology NIST website [36]. In general, the optimization procedure was done in order to reduce costs and techno-economic solutions. Table 1 illustrates the design operating conditions and the assumptions that were considered in this work. The mathematical model that was used in this work is described in Appendix A in detail.

Table 1.
Assumptions for the ETC/PTC-H2O/LiBr configurations.
4. Results and Comments
As illustrated earlier, the proposed cycles for the current study are two cycles. Therefore, it is very important to optimize the AAC cycle before the attachment of solar collectors. Such optimization would reduce the design aspects, such as area. Meanwhile, the lowering of the cost values and the thermo-economic product cost goes to the end-user. For such optimization purposes, different operating conditions have been examined in this section. The optimization processes address the effect of different operating conditions on COP, COPmax, exergy destruction rate, mass flow rates, and design aspects such as areas and volume.
4.1. Optimization of H2O–LiBr Cycle
4.1.1. Absorber Temperature Effect (H2O–LiBr)
Figure 3 shows the data results based on the effect of absorber temperature on the other design parameters, such as COP, COPmax, exergy destruction rate, mass flow rates, and design aspects. Data has been obtained at different refrigerant loads, from 15 to 45 kW (50 to 150 TR), and different values of absorber operating temperature (30–35 °C). Figure 3a reflects the effect of absorber temperature on COP. Increasing the absorber temperature would cause a slight decrease in the COP. The same behavior has been noticed in Figure 3b as an effect on the COPmax. This was happened because of the following relation between the absorber temperature and the COP and COPmax ().
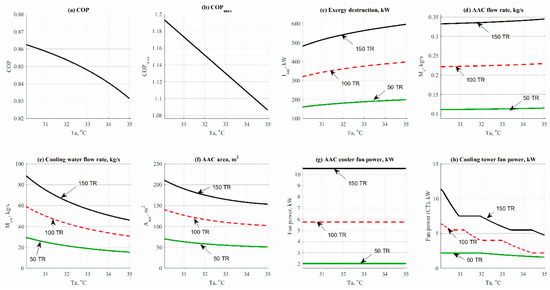
Figure 3.
Data results based on the effect of the absorber temperature parameter.
Increasing the load has no effect on the COP and/or COPmax as noticed. In general, the COP was in the range of 0.8 to 0.86. Figure 3c shows that increasing the absorber temperature would increase the exergy destruction rate. For example, at 28.5 kW (100 TR load), the exergy destruction rate has been increased from 300 kW up to nearly 400 kW. The same behavior was noticed in the total mass flow rate, as shown in Figure 3d. The mass flow rate was in increasing mode vs the increase of absorber temperature. The variation of the absorber temperature had no high significant effect on the flow rate when compared against the refrigerant load. However, the effect is considered remarkable when compared to the cooling water flow rate (Figure 3e). Based on Equations (36)–(38), increasing the absorber temperature would decrease the cooling flow rate, which is considered more economical to the cycle total cost. Meanwhile, a remarkable reduction in the AAC area is noticeable in Figure 3f. For instance, the total AAC area has been decreased, from 210 m2 down to 150 m2 at 150 TR load. Figure 3g shows that there is no effect on the evaporator fan cooler unit. The effect would happen in the case of a change in evaporator temperature. Figure 3h reflected the change in cooling tower mass flow rate by the cause of absorber temperature. The fan power has been decreased significantly. The increase of load would increase the fan power, while increasing the absorber temperature would decrease the power in the cooling tower fan. Generally, increasing the absorber temperature is used to decrease the cost, with a slight decrease in performance too. A value of 35 °C would be recommended in this study for the absorber unit.
4.1.2. Condenser Temperature Effect (H2O–LiBr)
The data results of the effect of condenser temperature variation on the other design parameters are displayed in Figure 4. Data has been obtained at different refrigerant loads, 15–45 kW (50–150 TR), and different values of condenser operating temperature (40–45 °C). Figure 4a outlines the effect of condenser temperature on the COP. It is clearly seen that increasing the condenser temperature would cause a slight decrease in the COP; the same as the absorber temperature effect. The same behavior can be noticed in Figure 4b as an effect on the COPmax. This happened because of the following relation between the condenser temperature and the COP and COPmax ().
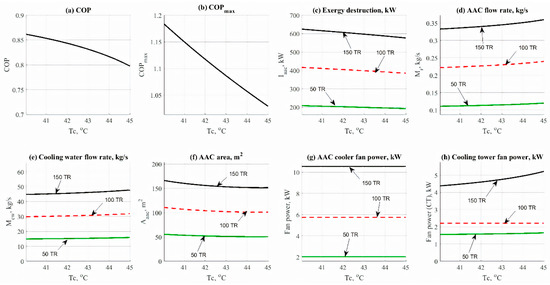
Figure 4.
Data results based on the effect of condenser temperature parameter.
Increasing the load has no effect on the COP and/or COPmax as noticed. In general, the COP was in the range of 0.8 to 0.85. Figure 4c clearly shows that increasing the condenser temperature would decrease the exergy destruction rate, which is considered a remarkable effect. For example, at 45 kW (150 TR) cooling load, the exergy destruction rate has been decreased, from 630 kW down to nearly 580 kW. The obtained results for the behavior of the total mass flow rate are shown in Figure 4d. An increase in condenser temperature augments the mass flow rate. The effect of condenser temperature on the flow rate is not significantly high when compared against the refrigerant load. However, the effect is considered remarkable when compared with the cooling water flow rate (Figure 4e). The condenser temperature would cause an increase in the cooling flow rate, which is considered to be not recommendable according to cost limitations. A slight reduction in the AAC area can be noticed in Figure 4f. For instance, the total AAC area has been decreased, from 160 m2 down to 150 m2, at 45 kW (150 TR) load. Figure 4g shows that there is no effect on the evaporator fan cooler unit. The effect would happen in the case of the change in evaporator temperature. Figure 4h reflects the change in cooling tower mass flow rate by the cause of condenser temperature. The fan power has been increased significantly. The increase in load would increase fan power. Increasing the condenser temperature would increase the power of the cooling tower fan. Generally, decreasing the condenser temperature decreases the cost, with a slight increase in performance too. A value of 43 °C would be recommended in this study for the condenser unit.
4.1.3. Evaporator Temperature Effect (H2O–LiBr)
The data results based on the variation of evaporator temperature over the other design parameters (COP, COPmax, exergy destruction rate, mass flow rates and design aspects) are presented in Figure 5. Data has been obtained at different refrigerant loads between 3.5 and 28.5 kW (1 and 100 TR), and different values of evaporator operating temperature (5–10 °C). Figure 5a shows the effect of the evaporator temperature on the COP. Increasing the evaporator temperature would cause a slight increase in the COP. The same behavior can be noticed in Figure 5b as an effect on the COPmax. This happened because of the following relation between the evaporator temperature and the COP and COPmax ().
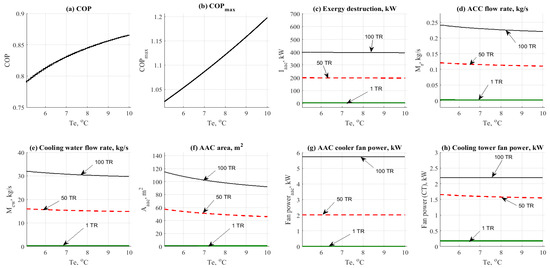
Figure 5.
Data results based on the effect of evaporator temperature parameter.
Increasing the load has no effect on the COP and/or COPmax as noticed. In general, the COP was in increasing range mode, from 0.8 up to 0.85. Figure 5c shows that increasing the evaporator temperature has no remarkable effect on the exergy destruction rate, which is quite beneficial to the system with regards to reducing or halting the exergy destruction rate. For example, at 28.5 kW (100 TR) load, the exergy destruction rate was fixed at 400 kW. A decreasing behavior was noticed in the total mass flow rate, as shown in Figure 5d. The mass flow rate was in decreasing mode vs the increase of evaporator temperature. The effect of evaporator temperature on the flow rate is not significantly high when viewed against the refrigerant load. Moreover, the effect is considered on the same line when viewed related to the cooling water flow rate (Figure 5e). The evaporator temperature would cause a decrease in the cooling flow rate, which is considered recommended according to cost limitations. A slight reduction in the AAC area can be noticed in Figure 5f too. For instance, the total AAC area has been decreased, from 117 m2 down to 90 m2, at 28.5 kW (100 TR) load. Figure 5g shows that there is no effect on the evaporator fan cooler unit. Figure 5h reflects the change in cooling tower mass flow rate by the cause of the evaporator temperature. The fan power has been decreased significantly. The increase in load would increase fan power. Increasing the evaporator temperature would slightly decrease the power in the cooling tower fan. Generally, increasing the evaporator temperature decreases the cost, with a remarkable increase in performance too. A value of 7–10 °C would be recommended in this study for the evaporator unit.
4.1.4. Generator Temperature Effect (H2O–LiBr)
Figure 6 shows the data results based on the effect of generator temperature on the other design parameters, such as COP, COPmax, exergy destruction rate, mass flow rates and design aspects. Data has been obtained at different refrigerant loads, between 15 and 45 kW (50 and 150 TR) and different values of the generator operating temperature (80–90 °C). Figure 6a shows the effect of the generator temperature on the COP. Increasing the generator temperature would cause a remarkable increase in the COP. The same behavior can be noticed in Figure 6b as an effect on the COPmax. This happened because of the following relation between the generator temperature and the COP and COPmax ().
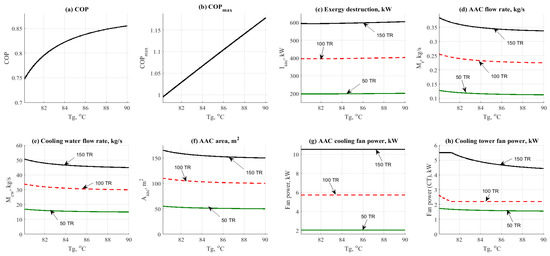
Figure 6.
Data results based on the effect of generator temperature parameter.
Increasing the load has no effect on the COP and/or COPmax as noticed. In general, the COP was in the increasing range mode, from 0.7 up to 0.87. Figure 6c shows that increasing the generator temperature has a slight effect on the exergy destruction. For example, at 45 kW (150 TR) load, the exergy destruction rate was a little bit fixed, at 600 kW. A remarkable decreasing behavior was noticed in the total mass flow rate, as shown in Figure 6d. The mass flow rate was in decreasing mode vs the increase in generator temperature. Moreover, the effect is considered on the same line when comparing it related to the cooling water flow rate (Figure 6e). The generator temperature would cause a decrease in the cooling flow rate, which is considered recommended according to cost limitations. A slight reduction in the AAC area can be noticed in Figure 6f, too. For instance, the total AAC area decreased, from 110 m2 down to 100 m2, at 28.5 kW (100 TR) load. Figure 6g shows that there is no effect on the generator fan cooler unit. Figure 6h reflects the change in cooling tower mass flow rate by the cause of generator temperature. The fan power has been decreased significantly. The increase in load would increase fan power. Increasing the generator temperature would slightly decrease the power in the cooling tower fan. Generally, increasing the generator temperature decreases the cost, with a remarkable increase in performance, too. A value of 85–90 °C would be recommended in this study for the generator unit.
4.1.5. Solar Field Top Temperature Effect (H2O–LiBr)
Figure 7 and Figure 8 show the data results based on the effect of solar collector temperature on the other design parameters, such as mass flow rates and design aspects. Data has been obtained at different refrigerant loads, between 15 and 45 kW (50 and 150 TR) and different values of solar collector operating temperature (100–200 °C for ETC, and 200–300 °C for PTC). Figure 7a and Figure 8a show the effect of solar collector temperature on the solar field mass flow rate. Increasing the solar collector temperature would cause a remarkable decrease in the solar field mass flow rate. The main reason for this is related to energy balance across the solar field, as presented in this relation . The same behavior can be noticed in Figure 7b and Figure 8b, as an effect on the total mass flow rate.
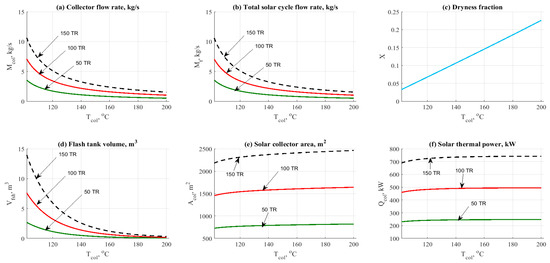
Figure 7.
Data results based on the effect of ETC outlet top temperature.
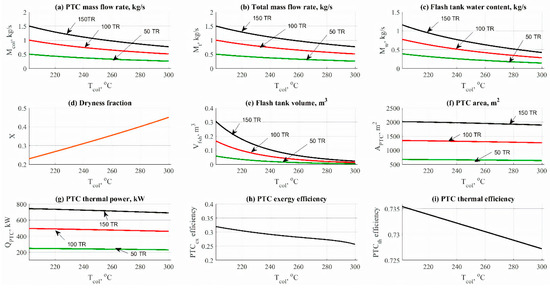
Figure 8.
Data results based on the effect of PTC outlet top temperature.
However, the PTC gives lower results in the total mass flow rate, according to the increase in top temperature when compared against the ETC. Increasing the load has no effect on the dryness fraction, as noticeable in Figure 7c and Figure 8d. Generally, the dryness fraction X was in the increasing range, from 5% up to 25% in the case of ETC, and 24% up to 45% in the case of PTC. Increasing the dryness fraction means more steam could be used for the generator unit, which is probably a favorable effect. Figure 7d and Figure 8e show that increasing the solar collector temperature has a massive effect on the flash tank volume. However, the PTC recorded lower tank volume results when compared against the ETC. The solar field area also has an increasing effect based on temperature increases. Figure 7e and Figure 8f represent that effect. It is quite clear that increasing the outlet temperature would increase the area of the solar field. However, the PTC recorded lower total area when compared against the ETC.
Figure 7f and Figure 8g represent the change in total thermal power based on the change in top solar field temperature. Figure 8h,i show the effect of top solar temperature on the performance indicators, such as efficiency and exergy efficiency. Increasing the top solar field temperature would decrease both efficiencies, due to the increase of thermal exergy destruction rate across the solar field for both cases. Values of 150–200 °C and 250–300 °C would be recommended in this study, for ETC and PTC solar collectors, respectively. Based on the obtained results, it is quite interesting to assign the operating temperature as follows:
- ➢
- Ta = 35 °C.
- ➢
- Tc = 43 °C.
- ➢
- Te = 7~10 °C.
- ➢
- Tg = 85~90 °C.
- ➢
- ETC Thigh = 150~200 °C.
- ➢
- PTC Thigh = 250~300 °C.
4.1.6. Cooling Load Effect (H2O–LiBr)
The cooling load effect on ETC-H2O–LiBr and PTC-H2O–LiBr cycles is shown in Figure 9 and Figure 10. Both figures address the effect on hourly costs, levelized power cosst, and thermo-economic product costs. As expected, the behavior in the figure was in increasing mode, due to the load and energy demand for all units. Solar collectors recorded the highest values of hourly costs among the other units, as shown in Figure 9a and Figure 10a.
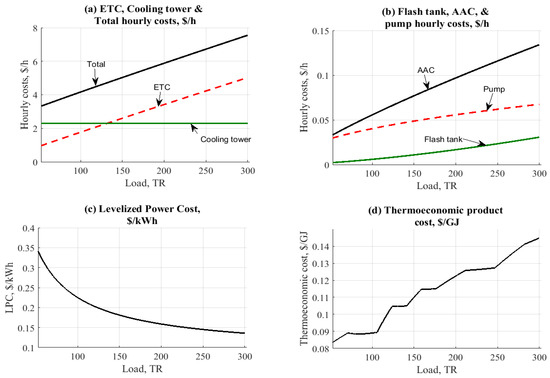
Figure 9.
Data results based on the effect of cooling load.
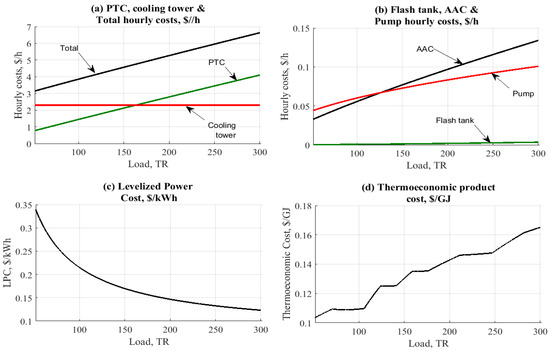
Figure 10.
Data results based on the effect of cooling load.
However, PTC was recorded as lower by 12% than the ETC, related to the hourly costs parameter. The main reason for this is related to the increase in collector operating temperature (250 °C vs 150 °C). Increasing the collector temperature will generate more steam for the AAC unit. The cooling tower comes next, by USD 2.2/h for both operations. AAC, pumps and flashing tanks are shown in Figure 9b and Figure 10b. It is clear in the figures that AAC is recorded a little bit higher than the pump and flashing tank, based on the total needed area.
Figure 9c and Figure 10c show the effect of cooling load on the levelized power cost, USD/kWh. The results are nearly the same based on the close results between the two configurations related to the pumping unit and the cooling tower. The levelized power cost ranged between USD 0.15/kWh and USD 0.35/kWh. The same close behavior is noticeable when comparing the thermo-economic product costs. Results were centralized around USD 0.08 to 0.14~0.16/GJ for both configurations, with a minor advantage to the ETC (Figure 9d and Figure 10d). As anticipated, increasing the load would increase the cost of exergy. Solar PTC and/or ETC are considered the main cause of such an effect, related to the large area needed to cover the load.
4.2. Case Study Results
The case study presented in this section compares between two configurations at a specific load point. The case study was about a sports arena which is located in Baghdad, Iraq. The arena is a USD 14 million, 3000-seat indoor sports facility focused around basketball, volleyball and athletics. The whole project will be centrally air conditioned by a 58–66 kW (200–230 TR) solar absorption cycle. The evaporator will be designed to work between 7 and 12 °C. Table 2 shows the data results for two configurations in the case of using the solar absorption cycle. A 58 kW (200TR) cooling load has been selected as an example for such a comparison. Environmental operating conditions are fixed at a specific value for simplicity. From the solar field results, PTC/H2O–LiBr resulted in the lowest area needed, and it is quite important to reduce the needed area. ETC/H2O–LiBr comes next. For design aspects such as flashing tank design, it was clear the operation of PTC-H2O–LiBr gives the lowest results, which were the most favorable, at 0.11 m3, followed by ETC/H2O–LiBr with 1 m3. The same behavior was also noticed related to the dryness fraction. The same behavior is also noticed related to the exergy destruction rate. The results reveal that PTC is considered an advantage to the cycle vs the ETC operation. Minimum driving steam was recorded by PTC/H2O–LiBr (0.4 kg/s), which lead to low flashing tank volume and lower solar field area. COP was found to be remarkable related to the H2O–LiBr cycle. For hourly costs, PTC/H2O–LiBr is noted as the lowest among the rest. By achieving USD 5.2/h, PTC-H2O–LiBr is considered the best option in this case study. Lower hourly costs for the solar field is considered the vital term to judge the system cost. The thermo-economic cost is nearly the same for the two configurations, within the range of USD 0.14-0.16/GJ.

Table 2.
Data results based on a 200 TR load case study.
5. Conclusions
In this work, two configurations of solar-assisted absorption air conditions (AAC) cycles are presented. H2O–LiBr absorption chillers have been considered. For the solar part, the simulation was carried out with an evacuated tube collector (ETC) and parabolic trough collector (PTC) technology as the main source of thermal power. The novelty of this work emerged from the connection type between the solar part and the absorption part. A flash evaporation tank has been used as an intermediate unit between both parts. Energy, exergy and cost analyses are presented in this work. According to the analysis results, the following conclusions can be drawn:
- ▪
- A flashing tank has been used for two configurations. Water steam is considered the main working fluid through the solar cycle.
- ▪
- Energy, exergy and cost balances are performed for all units.
- ▪
- Design aspects, such as solar area and flashing tank volume, were found to have a great influence on the cycle cost.
- ▪
- Optimization of the operating conditions, such as temperature, has been performed for two configurations. The following values of operating conditions are considered the best, related to design aspects, COP, exergy destruction rate and cost:
- ⚬
- Ta = 35 °C.
- ⚬
- Tc = 43 °C.
- ⚬
- Te = 7–10 °C.
- ⚬
- Tg = 85–90 °C.
- ⚬
- ETC Thigh = 150–200 °C.
- ⚬
- PTC Thigh = 250–300 °C.
- ▪
- ▪ Among configurations, PTC/H2O–LiBr gives remarkable results compared to the ETC.
- ▪
- A case study is presented in a sports arena located in Baghdad, Iraq, for which the needed cooling load was in the range of 700 to 800 kW. PTC-H2O–LiBr was recorded as the best based on design and hourly costs. The required solar area was in the range of 2000 to 2500 m2, while the total hourly costs were in the range of USD 4–5/h, which is quite attractive.
- ▪
- PTC/H2O–LiBr gives the lowest values related to exergy destruction rates for all units. Moreover, the exergy destruction rate for the AAC was in the vicinity of 55 kW. As expected, the solar field would harvest greater exergy destruction rates for two the configurations due to the large area and mass flow rate effect. the PTC-H2O–LiBr exergy destruction rate results are in the range of 930–1000 kW.
- ▪
- PTC/H2O–LiBr gives the lowest value of flashing tank design aspects, such as width 0.4–0.5 m, height 0.8 m, and volume 0.11 m3. ETC/H2O–LiBr comes next, with a total flashing tank equal to 1 m3.
- ▪
- It is quite clear that PTC-H2O–LiBr, followed by ETC/H2O–LiBr, have remarkable results according to the terms of energy, design and cost. Generally, the PTC system is considered the best choice for the H2O–LiBr solar cooling system.
For future work, we suggest comparing the solar thermal absorption chiller and vapor compression electrical chiller, taking into consideration the effect of environmental conditions.
Author Contributions
Conceptualization, A.A.-F.; methodology, A.A.-F.; validation, A.A.-F.; formal analysis, A.A.-F.; investigation, A.A.-F.; data curation, A.A.-F.; writing—original draft preparation, A.A.-F.; writing—review and editing, F.A.; supervision, B.E. All authors have read and agreed to the published version of the manuscript.
Funding
The authors received no specific funding for this work. The corresponding author would like to thank the Technical University of Darmstadt, enabling the open-access publication of this paper.
Conflicts of Interest
The authors declare no conflict of interest.
Nomenclature
| A | Availability, kWArea, m2 |
| At | Tube cross sectional area, m2 |
| Af | Amortization factor, 1/y |
| AAC | Absorption Air Conditioning |
| C | Thermo-economic cost stream, USD/kJ |
| Cp | Specific heat capacity, kJ/kg °C @ constant pressure |
| COP | Coefficient of Performance |
| D | Diameter, m |
| Denv | Collector glass envelope diameter, m |
| E | Exergy stream, kW |
| ETC | Evacuated Tube Collector |
| f | Function |
| FHP | Fan power, kW |
| H, h | Height, m, Enthalpy, kJ/kg |
| Hdish | Dish parabola height, m |
| Is | Solar intensity, W/m2 |
| i | Interest rate, % |
| L | Length, m |
| Lm | Module length, m |
| LMT | Logarithmic Mean Temperature, °C |
| LPC | Levelized Power Cost, USD/kWh |
| LTp | Plant life time, y |
| M | Mass flow rate, kg/s |
| NOT | Number of Tubes |
| NOC | Number of Collectors |
| NOL | Number of Loops |
| P | Power, or Pressure, bar |
| ΔP | Pressure, bar |
| Q | Thermal power, kW |
| RPR | Relative Performance Ratio |
| Re | Raynold’s Number |
| S, s | Entropy, kJ/kg °C |
| T | Temperature, °C |
| U | Overall heat transfer coefficient, W/m2 °C |
| V, Vol | Volume, cm3 |
| v | Vel°City, m/s |
| W | Power, Work, kW |
| Wc | Collector width, m |
| X | Concentration percentage, % |
| Z | Hourly cost, USD/h |
| Subscripts | |
| a, abs | Absorber |
| air | Air |
| amb | Ambient |
| a-hex | From absorber to heat exchanger stream |
| c | Condenser |
| c-evp | From condenser to evaporator stream |
| col | Collector |
| cw | Cooling water |
| e | Evaporator |
| etc | Evacuated tube collector |
| e-abs | From evaporator to absorber stream |
| f | Liquid phase |
| fan | Fan |
| fsh | Flashing tank |
| fst | Flashing steam |
| g | Generator, vapor phase |
| g-hex | From generator to heat exchanger stream |
| i | Inlet |
| loop | Loop |
| o | Out |
| p | Pump |
| ptc | Parabolic trough collector |
| pi,o | Pump inlet and outlet |
| q | Heat |
| r | Refrigerant |
| s | Steam |
| st | Steam |
| str | Strong |
| t | Turbine, total |
| w | Water |
| wk | Weak solution |
| Greek | |
| η | Efficiency, % |
| ρ | Density, kg/m3 |
| μ | Dynamic viscosity, Pas |
Appendix A Detailed Mathematical Model
Mathematical model of the proposed configurations
Solar Field (ETC and/or PTC):
For ETC, the efficiency is calculated based on the following relation [37]:
Where Is is in kW and ambient temperature Tamb is in °C.
Thermal useful load on the ETC, kW:
Where Mcol is in kg/s, Cp is in kJ/kg °C and the temperature difference is in °C.
Total ETC area, m2:
Solar field design:
ETC module area Aetc, m2 can be calculated where Dt is the tube diameter (m), Lt is the tube length (m), and NOT is the number of tubes per one module. The total number of evacuated tube collectors N°C can be calculated from the following equation.
The number of loops NOL, loop area Aloop and loop length Lloop can be calculated by assigning the hydraulic mass flow rate Mhyd, kg/s. Mcol will be calculated based on the load between the flash tank and the AAC unit.
The corresponding efficiency equation for the medium–high temperatures’ parabolic trough collectors (PTC) is given by the following equation, where To is the outlet collector top temperature (°C), and Tamb is the ambient temperature (°C) [38].
Where a11 W/m2 = 4.5 × 10⁻⁶, a21 W/m2 = 0.039, a31 W/m2 = 3 × 10⁻⁴, .
The collector total area is estimated based on the collector energy balance equation as a function of collector efficiencies, as:
Where Qu is the collector’s useful thermal power, and (Is) is the solar flux over the collector area, and APTC is the collector total area. The collector useful energy equation may exist according to the following relation:
Where h is the enthalpy difference across the collector in kJ/kg, and Mcol is the total field mass flow rate in kg/s. The PTC total length is then calculated based on collector width (m) and glass envelope diameter (m).
By knowing the total mass flow rate, which is calculated from the boiler heat exchanger load, and by assigning the hydraulic mass flow rate as an input, the total number of loops, loop area, loop width, and number of solar PTC’s are then calculated as follows,
where Lm is assigned as module length, m
Total pressure losses are calculated based on major and minor losses along the field length. The general loss equation is performed as following [39,40],
where
Dt is the inner tube diameter (m)
Flashing tank:
Flash Cyclone tank design data are calculated as the following:
Tube Inlet and outlet tank steam area based on steam velocity Vst (m/s) and vapor density (kg/m3):
Tube diameter (m):
Flash tank height (m) [38]:
Flash tank width (m):
Flash tank total volume (m3):
Flashing enthalpy is equal to the well enthalpy coming from the solar collector (kJ/kg):
The flashing dryness fraction is calculated based on flashing enthalpy, liquid enthalpy, hf (kJ/kg), and dry vapor enthalpy, hg (kJ/kg):
Total mass flow rate (kg/s):
Unvaporized water (kg/s):
Pump unit [40]:
Pump work kW:
Total pressure difference bar:
Outlet pump enthalpy (kJ/kg):
Absorption Air Conditioning (AAC) unit H2O–LiBr [41]:
1. The absorber unit [27]:
Solution concentration outlet to the heat exchanger (kg), LiBr/kg solution, where Ta is the absorber temperature (°C), and Te is the evaporator temperature (°C):
Strong solution mass flow rate (kg/s) is then calculated based on refrigerant mass flow rate, Mr (kg/s), and the concentration stream comes from the generator unit Xg_hex:
Weak solution mass flow rate (kg/s) is then calculated based on refrigerant mass flow rate, Mr (kg/s), and the concentration stream comes from the generator unit Xg_hex:
The enthalpy of LiBr/water solution of concentration X kg/LiBr kg solution at temperature T (°C) outlet to the heat exchanger unit [29]:
where can be calculated from the following correlation [24,29],
Absorber thermal power (kW):
Outlet cooling water temperature from the absorber unit goes to the condenser unit based on absorber effectiveness (°C) and is then calculated based on inlet cooling water temperature Tacwo and absorber temperature:
Cooling tower mass flow rate (kg/s) is calculated based on the energy balance through the absorber tube [27]:
where
Overall heat loss (kW/m2 °C) [24]:
Log Mean Temp to find the absorber area (m2):
where Tam is the absorber mean temperature (°C)
Absorber area (m2):
2. Heat exchanger unit [41]:
Outlet heat exchanger temperature to the absorber unit (°C):
Outlet heat exchanger temperature stream goes to the generator unit (°C):
where the specific heat capacity of lithium bromide/water solution of concentration X kg LiBr/kg solution is given by [42],
The enthalpy of LiBr/water solution of concentration X kg/LiBr kg solution at temperature T (°C) outlet to the absorber unit:
can be calculated from the following correlation [38,43], where
3. Generator unit [41]:
Solution concentration outlet to the heat exchanger, kg LiBr/kg solution:
where Tc is the condenser temperature (°C)
Outlet enthalpy from the generator to the condenser unit (kJ/kg):
where
Generator thermal power (kW):
Inlet driving steam mass flow rate to the generator (kg/s):
where ls is the latent heat (kJ/kg)
The overall heat transfer coefficients in the evaporator are calculated as following [22,24,29]:
Generator heat transfer area (m2):
4. Condenser unit:
The enthalpy stream outlet from the condenser to the evaporator (kJ/kg) of pure water liquid at temperature (°C):
Condenser thermal power (kW):
Inlet cooling water enthalpy (kJ/kg):
Outlet cooling water enthalpy (kJ/kg):
5. Evaporator unit:
The enthalpy (kJ/kg) of saturated water vapor at temp (°C) from the evaporator to absorber unit:
Thermal load on evaporator unit (kW) [29]:
Refrigerant mass flow rate (kg/s):
6. Fan unit [38]:
Cooling air mass flow rate (kg/s) is calculated based on thermal power (Qe, kW), the specific heat capacity of the air, Cp (kJ/kg °C) and the temperature difference between input and outlet cases (°C):
Air flow velocity (m/s) based on air duct diameter Dta (m), mass flow rate, and air density:
A pressure drop across the air cooled condenser (kPa) based on air density, air velocity and mean air temperature, Tam (°C):
Fan Power (kW):
Exergy, Cost and Performance [42,43,44,45]:
For any system going under steady-state, the mass, energy and entropy balances equations under steady-state conditions should be developed as follows:
The general form of the availability is defined by the following equation:
Where A2 − A1 = 0 is the non-flow availability change in steady-state condition,
is the availability transfer due to the heat transfer between the control volume and its surroundings,
is equal to the negative value of the work produced by the control volume, but in most cases, the control volume has a constant volume, therefore Aw can be further simplified. I = Tamb × Sgen is the availability of destruction in the process. The flow availability is expressed as,
Thus, the general form in the steady-state condition would become
In conventional economic analysis, a cost balance is usually formulated for the overall system operating at steady state, as the following:
Where is the cost rate according to inlet and outlet streams, and is the capital investment and operating and maintenance costs. In exergy costing, a cost is associated with each exergy stream. Thus, for inlet and outlet streams of matter with associated rates of exergy transfer, power W, and the exergy transfer rate associated with heat transfer Equation, can be written as the following:
Where ci,o, w, q denote average costs per unit of exergy in USD/kJ for inlet (i), outlet (o), power (w), and energy (q), respectively. For hourly costs estimation, the following correlations are considered:
For cost analysis, the amortization factor should be calculated first as presented here, Amortization factor, 1/y,
Collector investment cost is calculated based on the folloing area correlation (USD),
operating and maintenance cost is then calculated (USD),
Total annual cost, USD/y is then calculated based on operating and maintenance cost and investment cost parameters, as following,
and hourly costs are calculated, USD/h,
Flashing tank cost is calculated based on the following total tank volume correlation (USD),
Total annual cost, USD/y is then calculated
hourly costs are calculated (USD/h),
Absorption cycle cost is calculated based on the following total area correlation (USD),
Total annual cost, USD/y is then calculated,
hourly costs are calculated (USD/h),
Pump cost is calculated based on the following pump power correlation (USD),
Total annual cost,USD/y is then calculated , hourly costs are calculated (USD/h),
Cooling tower hourly costs [31] is calculated based on the following wet bulb temperature correlation (USD),
total annual cost, USD/y is then calculated
Total hourly costs USD/h is then calculated based on all parameters as the following,
Total Plant Cost is also calculated based on the total annual costs for all unit (USD/y),
The total thermo-economic equation is calculated based on the cost and exergy stream through the proposed cycles, (USD/G)J,
where cp is the thermo-economic product cost( USD/GJ), cw is the power cost in USD/kWh (~0.065), and Wtot is the total cycle power (kW), Exfo is the exergy stream outlet from the system to the user (kW). For performance calculations, the COP is calculated based on evaporator and generator thermal powers,
where the Max COP is found as,
and the relative performance ratio could be then estimated as,
References
- Al-Alili, A.; Hwang, Y.; Radermacher, R. Review of solar thermal air conditioning technologies. Int. J. Refrig. 2014, 39, 4–22. [Google Scholar] [CrossRef]
- Balaras, C.A.; Grossman, G.; Henning, H.M.; Ferreira, C.A.I.; Podesser, E.; Wang, L.; Wiemken, E. Solar air conditioning in Europe—An overview. Renew. Sustain. Energy Rev. 2007, 11, 299–314. [Google Scholar] [CrossRef]
- Bittanti, S.; DeMarco, A.; Giannatempo, M.; Prandoni, V. A Dynamic Model of an Absorption Chiller for Air Conditioning. In Proceedings of the International Conference on Renew. Energies and Power Quality, (ECREPQ’10), Granada, Spain, 25–28 March 2010. [Google Scholar]
- Rashid, K. Design, Economics, and Real-Time Optimization of a Solar/Natural Gas Hybrid Power Plant. Ph.D. Thesis, The University of Utah, Salt Lake City, UT, USA, 2019. [Google Scholar]
- Mallah, A.R.; Zubir, M.N.M.; Alawi, O.A.; Newaz, K.M.S.; Badry, A.B.M. Plasmonic nanofluids for high photothermal conversion efficiency in direct absorption solar collectors: Fundamentals and applications. Solar Energy Mater. Solar Cells 2019, 201, 110084. [Google Scholar] [CrossRef]
- Sheha, M.N.; Powell, K.M. Dynamic Real-Time Optimization of Air-Conditioning Systems in Residential Houses with a Battery Energy Storage under Different Electricity Pricing Structures. In Computer Aided Chemical Engineering; Elsevier: Amsterdam, The Netherlands, 2018; Volume 44, pp. 2527–2532. [Google Scholar]
- Casals, X.G. Solar absorption cooling in Spain: Perspectives and outcomes from the simulation of recent installations. Renew. Energy 2006, 31, 1371–1389. [Google Scholar] [CrossRef]
- Molero-Villar, N.; Cejudo-Lopez, J.M.; Domínguez-Muñoz, F.; Carrillo-Andrés, A. A comparison of solar absorption system configurations. Solar Energy 2012, 86, 242–252. [Google Scholar] [CrossRef]
- Alrwashdeh, S.S.; Ammari, H. Life cycle cost analysis of two different refrigeration systems powered by solar energy. Case Stud. Therm. Eng. 2019, 16, 100559. Available online: https:// www.sciencedirect.com (accessed on 18 May 2020). [CrossRef]
- Mone, C.D.; Chau, D.S.; Phelan, P.E. Economic feasibility of combined heat and power and absorption refrigeration with commercially available gas turbines. Energy Convers. Manag. 2001, 42, 1559–1573. [Google Scholar] [CrossRef]
- Rodríguez-Muñoz, J.L.; Belman-Flores, J.M. Review of diffusion–absorption refrigeration technologies. Renew. Sustain. Energy Rev. 2014, 30, 145–153. [Google Scholar] [CrossRef]
- Bataineh, K.; Taamneh, Y. Review and recent improvements of solar sorption cooling systems. Energy Build. 2016, 128, 22–37. [Google Scholar] [CrossRef]
- Henning, H.M. Solar assisted air conditioning of buildings–an overview. Appl. Therm. Eng. 2007, 27, 1734–1749. [Google Scholar] [CrossRef]
- Pintaldi, S.; Perfumo, C.; Sethuvenkatraman, S.; White, S.; Rosengarten, G. A review of thermal energy storage technologies and control approaches for solar cooling. Renew. Sustain. Energy Rev. 2015, 41, 975–995. [Google Scholar] [CrossRef]
- Li, Z.F.; Sumathy, K. Technology development in the solar absorption air-conditioning systems. Renew. Sustain. Energy Rev. 2000, 4, 267–293. [Google Scholar] [CrossRef]
- Balaras, C.A.; Hans-Martin, H.; Wiemken, E.; Grossman, G. Solar cooling: An overview of European applications design guidelines. ASHRAE J. 2006, 48, 14. [Google Scholar]
- Kim, D.S.; Ferreira, C.I. Solar refrigeration options–a state-of-the-art review. Int. J. Refrig. 2008, 31, 3–15. [Google Scholar] [CrossRef]
- Chidambaram, L.A.; Ramana, A.S.; Kamaraj, G.; Velraj, R. Review of solar cooling methods and thermal storage options. Renew. Sustain. Energy Rev. 2011, 15, 3220–3228. [Google Scholar] [CrossRef]
- Wang, Y.; Wang, C.; Feng, X. Optimal match between heat source and absorption refrigeration. Comput. Chem. Eng. 2017, 102, 268–277. [Google Scholar] [CrossRef]
- Wang, R.Z.; Ge, T.S.; Chen, C.J.; Ma, Q.; Xiong, Z. QSolar sorption cooling systems for residential applications: Options and guidelines. Int. J. Refrig. 2009, 32, 638–660. [Google Scholar] [CrossRef]
- International Energy Agency. Technology Roadmap: Solar Heating and Cooling. Int. Energy Agency 2012. Available online: https://www.iea.org (accessed on 18 June 2020).
- Wang, J.; Yan, R.; Wang, Z.; Zhang, X.; Shi, G. Thermal performance analysis of an absorption cooling system based on parabolic trough solar collectors. Energies 2018, 11, 2679. [Google Scholar] [CrossRef]
- Calise, F.; Libertini, L.; Vicidomini, M. Design and optimization of a novel solar cooling system for combined cycle power plants. J. Clean. Prod. 2017, 161, 1385–1403. [Google Scholar] [CrossRef]
- Delač, B.; Pavković, B.; Lenić, K. Design, monitoring and dynamic model development of a solar heating and cooling system. Appl. Therm. Eng. 2018, 142, 489–501. [Google Scholar] [CrossRef]
- Bellos, E.; Tzivanidis, C.; Antonopoulos, K.A. Exergetic, energetic and financial evaluation of a solar driven absorption cooling system with various collector types. Appl. Therm. Eng. 2016, 102, 749–759. [Google Scholar] [CrossRef]
- Aman, J.; Ting, D.K.; Henshaw, P. Residential solar air conditioning: Energy and exergy analyses of an ammonia–water absorption cooling system. Appl. Therm. Eng. 2014, 62, 424–432. [Google Scholar] [CrossRef]
- Al-Falahi, A.; Alobaid, F.; Epple, B. A New Design of an Integrated Solar Absorption Cooling System Driven by an Evacuated Tube Collector: A Case Study for Baghdad, Iraq. Appl. Sci. 2020, 10, 3622. [Google Scholar] [CrossRef]
- Cabrera, F.J.; Fernández-García, A.; Silva, R.M.P.; Pérez-García, M. Use of parabolic trough solar collectors for solar refrigeration and air-conditioning applications. Renew. Sustain. Energy Rev. 2013, 20, 103–118. [Google Scholar] [CrossRef]
- Fernández-García, A.; Zarza, E.; Valenzuela, L.; Pérez, M. Parabolic-trough solar collectors and their applications. Renew. Sustain. Energy Rev. 2010, 14, 1695–1721. [Google Scholar] [CrossRef]
- Fong, K.F.; Chow, T.T.; Lee, C.K.; Lin, Z.; Chan, L.S. Comparative study of different solar cooling systems for buildings in subtropical city. Solar Energy 2010, 84, 227–244. [Google Scholar] [CrossRef]
- Aliane, A.; Abboudi, S.; Seladji, C.; Guendouz, B. An illustrated review on solar absorption cooling experimental studies. Renew. Sustain. Energy Rev. 2016, 65, 443–458. [Google Scholar] [CrossRef]
- Abdelhay, A.O.; Fath, H.E.; Nada, S.A. Solar driven polygeneration system for power, desalination and cooling. Energy 2020, 198(C), 117341. [Google Scholar] [CrossRef]
- Wang, K.; He, Y.; Kan, A.; Yu, W.; Wang, D.; Zhang, L.; She, X. Significant photothermal conversion enhancement of nanofluids induced by Rayleigh-Bénard convection for direct absorption solar collectors. Appl. Energy 2019, 254, 113706. [Google Scholar] [CrossRef]
- Elahi, R.; Nagassou, D.; Mohsenian, S.; Trelles, J.P. Enhanced solar radiation absorption by carbon dioxide in thermodynamic nonequilibrium: A computational study. Solar Energy 2020, 195, 369–381. [Google Scholar] [CrossRef]
- Salehi, S.; Yari, M.; Rosen, M.A. Exergoeconomic comparison of solar-assisted absorption heat pumps, solar heaters and gas boiler systems for district heating in Sarein Town, Iran. Appl. Therm. Eng. 2019, 153, 409–425. [Google Scholar] [CrossRef]
- Available online: https://webbook.nist.gov/chemistry/name-ser/ (accessed on 3 February 2020).
- Vakiloroaya, V.; Ha, Q.P.; Skibniewski, M. Modeling and experimental validation of a solar-assisted direct expansion air conditioning system. Energy Build. 2013, 66, 524–536. [Google Scholar] [CrossRef]
- Carles Bruno, J.; Ló pez-Villada, J.; Letelier, E.; Romera, S.; Coronas, A. Modelling and Optimisation of Solar Organic Rankine Cycle Engines for Reverse Osmosis Desalination; Elsevier: Amsterdam, The Netherlands, 2008. [Google Scholar]
- Nafey, A.S.; Sharaf, M.A.; García-Rodríguez, L. A New Visual Library for Design and Simulation of Solar Desalination Systems (SDS); Elsevier: Amsterdam, The Netherlands, 2010. [Google Scholar]
- Sharaf Eldean, M.A.; Soliman, A.M. A new visual library for modeling and simulation of Renew. energy desalination systems (REDS). Desalin. Water Treat. 2013, 51, 6905–6920. [Google Scholar] [CrossRef]
- Lansing, F.L. Computer modeling of a single stage lithium bromide/water absorption refrigeration unit. JPL Deep Space Netw. Prog. Rep. 1976, 42, 247–257. [Google Scholar]
- Sharaf, M.A. Design and Simulation of Solar Desalination Systems. Ph.D Thesis, Suez Canal University, Ismailia Governorate, Egypt, 2011. [Google Scholar]
- Sharaf, M.A.; Nafey, A.S.; García-Rodríguez, L. Author’s Personal Copy Thermo-Economic Analysis of Solar Thermal Power Cycles Assisted MED-VC (Multi Effect Distillation-Vapor Compression) Desalination Processes; Elsevier: Amsterdam, The Netherlands, 2011. [Google Scholar]
- Sharaf, M.; Nafey, A.; Desalination, L.G.-R. Exergy and Thermo-Economic Analyses of A Combined Solar Organic Cycle with Multi Effect Distillation (MED) Desalination Process; Elsevier: Amsterdam, The Netherlands, 2011. [Google Scholar]
- Castro, M.M.; Song, T.W.; Pinto, J.M. Minimization of operational costs in cooling water systems. Chem. Eng. Res. Des. 2000, 78, 192–201. Available online: https://www.sciencedirect.com/science/article/abs/pii/S026387620071882X (accessed on 10 May 2020). [CrossRef]
© 2020 by the authors. Licensee MDPI, Basel, Switzerland. This article is an open access article distributed under the terms and conditions of the Creative Commons Attribution (CC BY) license (http://creativecommons.org/licenses/by/4.0/).