Abstract
In the increasingly frequent global financial turmoil, investors prefer to invest in stable assets to hedge risks. Crude oil naturally has dual use value as a general commodity and as a financial asset, which has attracted wide attention. In this paper, we adopt a wavelet coherence analysis to study the standard of crude oil as a hedging asset and analyze the dynamic correlation of crude oil and stock market price fluctuations in the four economies of the United States, Japan, China and Hong Kong at different frequencies. The empirical evidence shows that crude oil can be conditionally used as a hedging asset for underlying securities. From the perspective of space, crude oil is suitable for investors in China’s stock market as a hedging asset, while for stock markets in the US, Japan and Hong Kong, the ability of crude oil to hedge risk has been greatly weakened. From the perspective of investment term, although crude oil cannot be regarded as a hedging asset for long-term investment, it can still play a hedging role in the short term. When the market is in a state of panic, the ability of oil to hedge risk is stronger.
1. Introduction
Crude oil, one of the main hedging assets in asset allocation, has attracted many researchers’ attention. The main reason why crude oil is regarded as a hedging asset for underlying securities is that crude oil and the stock market are independent of each other. Because of this, using the financial attributes of crude oil trading to allocate crude oil products can resist market risks and reduce investors’ portfolio losses when the stock market is extremely volatile, which has been fully proved in a series of studies. Foroni et al. [1] studied how the correlation between crude oil and the US stock market varied over time and found that the US stock market and crude oil were relatively independent of each other in terms of returns, and that crude oil could hedge the risk of changes in the stock market. Apergis and Miller [2] analyzed the impact of stock returns on crude oil prices in eight developed countries based on Vector Error Correction (VEC) and Vector Autoregressive (VAR) methods and found that stock returns and crude oil prices are independent when extreme situations occur in the stock market. It was found that this kind of independence exists not only in the financial markets of developed countries but also in the stock markets of emerging economies. Raza et al. [3] divided the stock markets of emerging economies between May 2008 and June 2015 into long-term ones and short-term ones and studied the hedging capacity of crude oil for each type. The conclusion showed that crude oil can be used as a hedging asset in the stock markets of all emerging economies in the long and short term. Basher and Sadorsky [4] used the rolling window method to study the dynamic correlation between crude oil price and emerging market stock index, showing that crude oil was the best hedging tool for emerging market stocks before the economic downturn in 2018–2019. Kumar [5] studied the non-linear causality between crude oil and stock market through the Nonlinear Autoregressive Distribution Lag (NARDL) model and found that the current decline of the stock market will cause the next crude oil price to rise due to hedging, speculation, asset preservation and other reasons.
Since the outbreak of the Corona Virus Disease (COVID-19) epidemic, the double decline of security assets and crude oil prices, combined with the huge changes in global capital markets in the past decade, has made crude oil increasingly suspected to be a hedging asset for securities. In particular, in March 2020, the US stock market fell into a technical bear market, with four circuit breakers in one month. The drying up of liquidity in the financial markets intensified the selling of US stocks, bonds, gold and commodities, and the price of crude oil also plummeted. The logic behind these can be linked to the nature of the current crisis. The prolonged economic slowdown is driven by the COVID-19 epidemic. By implementing measures to contain the virus, both the industrial and consumer sectors were affected, leading to an over-supply of crude oil and also indicating suspicion of its relevance as a safe-haven asset. In this context, crude oil, as a hedging asset of security assets, needs to be further tested. From the literature, there are some relevant empirical studies on the hedging of crude oil. Jin et al. [6] believed that in the global market, gold dominated the crude oil market in response to market information and was a more effective carrier of value storage than crude oil. Maghyereh et al. [7] found that during a period of financial crisis, crude oil was a weak but costly hedge asset in the stock markets of the Gulf Cooperation Council countries. Sarwar et al. [8], based on the data of three major Asian crude oil-importing countries from 2000 to 2016, found that investors should choose to hold more stocks rather than crude oil to spread risk. Besides, although there is a negative correlation between crude oil and securities, the correlation is not stable. The hedging ability of oil price responds to risk differently, depending on the causes behind the shocks. The demand–supply side of the oil market cannot be ignored. A positive relationship between the price fluctuation of stock and oil prices is found only when the price of oil rises due to an oil-market specific demand shock such as an increase in precautionary demand driven by concerns about future crude oil supply shortfalls [9,10]. Chang et al. [11] investigated portfolio strategies with crude oil as a hedging asset and found that the risk aversion of crude oil varied over time, and that its influence on the portfolio varied at different stages. Sharma and Rodriguez [12] believed that the ability of crude oil to resist the risk of stock market price fluctuations would weaken with the increase in the degree of financialization, and that the cost of crude oil as a hedging tool would be higher after the financial crisis. When market risks are caused by the decline of the crude oil price, crude oil cannot be used as a hedging asset [13]. Arouri et al. [14] showed that the ability of oil and gold to hedge risks was different in extreme market declines, and that gold was a safe haven for investors.
The correlation between investor sentiment and the price fluctuation of the underlying asset in the market will be significantly improved when subjected to external shocks, and the hedging function of the crude oil asset will also change to a certain extent. Investors in financial markets are often not completely rational, especially when a financial crisis occurs in a financial market, when the correlation between investor sentiment and market price fluctuation will be significantly increased [15]. Ahmadi et al. [16] explored the investment–uncertainty relationship for oil and gas. Oil price dynamics are driven by a combination of aggregate demand and speculative shocks, which dominate the oil supply shocks. On the other hand, investor sentiment can affect price fluctuations in the financial markets where they invest. Oliveira et al. [17] used the investor sentiment index provided by the American Association of Individual Investors (AAII) to confirm that investor sentiment was closely related to fluctuation of the stock market price. Balcilar et al. [18] investigated the relationship between “herd effect” in the stock market and oil speculation and found that a large amount of “herd effect” existed in periods of high volatility of stock prices. He et al. [19] found that investor sentiment was a systematic factor affecting prices, and also discovered that excess returns were related to emotional change in the same period, which affected the volatility of returns. Lee et al. [20] believed that the level value and change of emotion were strongly correlated with market returns. Chen et al. [21] thought that the ability of crude oil to predict stocks was driven by the change of investor sentiment over time. On the other hand, investor sentiment was also found to have a contagion effect across countries and regions. Baker et al. [22] synthesized investor sentiment in six major stock markets through principal component analysis to represent global investor sentiment and found that global sentiment can infect investors in local stock markets. Chang, et al. [23] constructed the proxy variable of investor sentiment and found through their research that investor sentiment can infect the global stock market, but that high-quality information, law and the corporate governance environment can help reduce the cross-market contagion speed of investor sentiment. Hudson and Green [24] constructed proxy variables of investor sentiment in the US and the UK markets respectively. The study found that investor sentiment in the US market could influence the price of the UK stock market, while investor sentiment in the UK market had no influence on the domestic stock market, so it was suggested that investor sentiment in the UK market originates in the US.
This paper holds that crude oil as a hedging asset is conditional. On the one hand, crude oil and underlying assets have different temporal and spatial correlations. On the other hand, the correlation mechanism between crude oil and underlying assets is affected by investors’ psychology, so the strength of the risk hedging function has a strong correlation with market sentiment. Based on this, this paper studies the time-space heterogeneity between crude oil and underlying securities by means of wavelet coherence analysis and investigates their correlation differences in the long and short term. Then this paper further studies the mechanism of market sentiment, taking crude oil as a hedging asset, and focuses on the time and space correlation between crude oil and underlying securities under panic sentiment. The main contributions of this paper are as follows. First of all, the conditions of crude oil as an underlying hedging asset are studied. The existing literature regards crude oil as a hedging asset on the basis of its fluctuation attribute. However, since the 2008 financial crisis, the time-space difference in the fluctuation of the underlying assets of securities has become increasingly strong. This paper studies the time-space conditions of crude oil as a hedging asset. Secondly, the paper studies the differences of crude oil as a hedging asset between the long and short term. Ahmadi et al. [16] identifies five structural shocks in the oil market, namely: oil supply shocks; global demand shocks; speculative demand shocks; other oil market-specific shocks; and stock market shocks. Based on investment behavior, we focus on speculative demand shocks, and further divide the holding assets of investors. According to their frequency, hedging conditions are analyzed based on the length of investors’ investment objectives. Investors’ short-term holdings of financial assets are mostly motivated by speculative motives or emergency measures to avoid the impact of major events. It is found that in the short term, the correlation between crude oil and underlying securities is weaker. Thirdly, this paper introduces the situation of investor sentiment and analyzes the mechanism in the process of risk hedging. The panic index is incorporated into the framework of analyzing the risk-hedging property of crude oil, and the risk-hedging ability of crude oil under panic sentiment is studied from the perspectives of space, time and frequency. It is found that when the market is in a state of panic, crude oil as a financial asset plays an important role.
The rest of this paper is as follows. Part 2 constructs the wavelet coherence analysis model and analyzes the sample and variable selection of crude oil as a hedging asset. Part 3 analyzes the heterogeneous correlation between crude oil and different underlying assets from the dimensions of time and space to study the condition of crude oil as a hedging asset. In part 4, Chicago Board Options Exchange Volatility Index (VIX) is introduced to analyze the correlation mechanism between asset prices and crude oil in different space-time conditions, so as to study the dynamic adjustment mechanism of crude oil as a hedging asset. Part 5 gives the conclusion of this paper.
2. Methodology
2.1. Wavelet Coherence Analysis
Only when crude oil and related underlying assets are independent of each other or have a negative relationship can crude oil be the underlying asset to hedge. There are significant differences in the factors influencing the price fluctuation of financial assets in different space. In different space, the maturity of the financial market, laws and regulations, the composition of market investors and the risk preference of investors may have very big differences. These differences make the direction and degree of the fluctuation of the underlying asset price in different markets vary, and then the correlation between the fluctuation of the underlying asset price and the fluctuation of the crude oil price is also different [25,26,27]. From the perspective of market investment behavior, the financial market is the integration of investment and speculation, and market participants have significant differences in the length of holding assets. When the components of investment and speculation in different markets are different, the correlation between crude oil and the underlying asset will also change. When long-term investment is dominant, the correlation between crude oil and underlying assets is more stable. Thus, there are also differences in whether crude oil can be used as a hedging asset according to different frequency-domain price fluctuation data [28]. Crude oil price fluctuations have a high degree of homogeneity in the global scope, while the underlying assets of securities have a very strong heterogeneity in different time and space around the world. Therefore, this paper investigates the conditions of crude oil as a hedging asset in different time and space. The wavelet coherence analysis technique can combine the time domain and the frequency domain to quantify the dynamic correlation between sequences. It can not only analyze the relationship between high-frequency (i.e., short-term fluctuations) and low-frequency (i.e., long-term fluctuations) sequences but also explain the temporal variation of the possible relationship, which enables us to detect the multi-scale correlation between variables. Based on this, the wavelet coherence analysis method is selected in this paper to study the changing correlation between crude oil price fluctuations and underlying securities in the short term (high-frequency) and the long term (low-frequency), investigating the space-time conditions of crude oil as a hedging asset. The mother wavelet is used to produce small waves. It is expressed as a function of time t and scale s as:
where τ, s and respectively represent time location, frequency (Period) and the normalization factor. A real or complex value function ψ (.) is defined over the real axis. The normalization factor ensures that the transformation remains comparable across scales and over time.
The continuous wavelet transform (CWT) is performed in wavelet analysis. It provides the freedom to select wavelets according to the length of data, and the redundancy in CWT makes the interpretation and discovery of patterns or hidden information easier. A continuous wavelet transform of a discrete time series () with respect to ψ (.), can be represented as:
where * denotes the complex conjugate. Notably, the wavelet transform preserves the energy of a time series that can be used to analyze the power spectra.
The cross-wavelet power of two time series and with the continuous transforms and can be expressed as:
where represents the region of high common power between two time series in time-frequency space.
The basic form of the wavelet coherence analysis model is the wavelet squared coherence between the two time series:
where and represent wavelet square coherence and the smoothing operator respectively; and are the time series continuous wavelet transform of crude oil price fluctuation and stock market index fluctuation. The value of wavelet square coherence varies between 0 (no common fluctuation) and 1 (high common fluctuation), which can be regarded as the proportional correlation square between series. In addition, the wavelet coherence framework enables us to study the lead-lag relationship between sequences, while avoiding the problem of square coherence, which cannot distinguish the positive and negative relationships between sequences.
In Equation (5), the parameters and give the virtual part and the real part of the smooth power spectrum respectively. In a time-scale wavelet coherence map, the phase difference is usually represented by a direction arrow. If the sequence is positively correlated, the arrow points to the right; if the sequence is negatively correlated, the arrow points to the left. If the arrow points up, crude oil price volatility is ahead of stock market index volatility; otherwise, it points down.
2.2. Variables and Data
The data selected in this paper are from the period January 4, 2004 to April 6, 2020. The main reasons are as follows. First, on September 22, 2003, the Chicago Board Options Exchange (CBOE) revised the Volatility Index (VIX) to change the target selection from Standard & Poor’s 100 (S&P 100) to S&P 500, and it changed the series of call options and put options closest to the evaluation to all series so as to provide market participants with an emotional indicator that could better reflect the overall trend of the market through a broader range of underlying assets, with data disclosure starting in 2004. According to its implementation period, the crude oil and stock index data in this paper have very strong comparability from January 4, 2004 to April 6, 2020. Second, the trading days of financial products in different markets are not synchronized due to different holidays; in order to maintain the consistency of data time, we exclude the relevant data with missing value dates.
In terms of sample types, this paper selected the four stock markets of the United States, Japan, China and Hong Kong as the subject matter. Since 2008, due to the rapid spread of the international financial crisis, many developed economies have suffered great impact, while the economic development of East Asia is very strong, which, in recent years, has stood out in terms of financial and economic development. Mainland China, Japan and Hong Kong are the main economic and financial centers in East Asia. Besides, the status of the United States as a world financial center cannot be ignored. The stock value of these four markets accounts for more than 75% of the world’s market [29]. In terms of economic status, the United States, Japan and mainland China are the top three economies in the world, while Hong Kong is the main financial center in the world. From the perspective of sample structure, the sample includes not only the mature stock markets of developed countries (the United States and Japan), but also the stock markets of emerging economies (mainland China and Hong Kong).
This paper uses the spot price of Brent crude oil (USD per barrel) as a hedging asset to study its relationship with the stock markets of various countries. At present, more than 65% of the world’s real crude oil is linked to the Brent pricing system, which is the benchmark for oil price. Data come from the US Energy Information Administration. Panic is measured by the VIX, which reflects market investors’ expectations of future index volatility. The VIX is based on the S&P 500’s real-time mid quotes for call and put options, and it is designed to measure the expected volatility of the US stock market over a 30-day period. Globally, it is one of the most recognized volatility indicators, widely reported by the financial media and closely watched by various market participants as a daily market indicator. When the VIX is relatively high, it indicates that market participants expect the volatility of the future market to be more intense, and it also reflects their uneasy psychological state. On the contrary, if the VIX is relatively low, it means that market participants expect the volatility of the future market to be moderate. When the daily rise of the VIX is greater than 0, the market is considered to be in a state of panic, as measured by the Chicago Board Options Exchange (CBOE). For the stock market, the Shanghai Stock Exchange Composite Index (SSEC), the S&P 500 index (SP500), the Nikkei 225 Index (N225) and the Hang Seng Index (HSI) are used to characterize the stock market changes in mainland China, the US, Japan and Hong Kong, China, with data from the Choice database. In this paper, all price volatility is extracted by the Autoregressive Integrated Moving Average - Generalized Autoregressive Conditional Heteroskedastic (ARIMA-GARCH) model based on stable price data.
According to the data sources and pretreatment methods, the crude oil and stock market price fluctuations in the United States, Japan, China and Hong Kong are plotted in Figure 1. The main axes represent crude oil price fluctuations with the black line, and the secondary axes represent stock market price fluctuations with the colored lines.
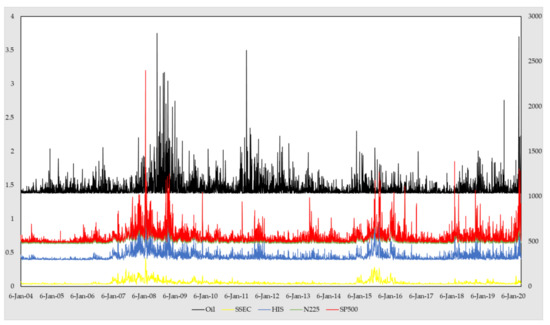
Figure 1.
Crude oil and stock market price fluctuations in the United States, Japan, China and Hong Kong.
As can be seen from Figure 1, the price fluctuation trends of crude oil and stock markets in various countries were not consistent. Generally speaking, the price fluctuation of crude oil was relatively stable compared with the stock market of various countries, except in the period of global financial crisis in 2008 when there was a big crest. However, there are significant differences in the price fluctuations of stock markets in different countries. Mainland China’s stock market has the largest price volatility; the second is the US, which continued to fluctuate to a peak after 2017. Japan’s stock market continues to fluctuate, with little volatility; Hong Kong’s stock market has the smallest price volatility. In addition, the volatility of crude oil and the stock markets is closely related to the market panic index. By comparing the price fluctuations of crude oil and the stock markets of various countries, it can be found that the price fluctuations of crude oil are highly similar to those of the US stock market. In a certain period, the fluctuation of crude oil price is consistent with the Japanese stock market and the Hong Kong stock market, while the price fluctuation trends of crude oil and the Chinese stock market are relatively independent from each other. Therefore, this paper mainly adopts the wavelet coherence analysis method to study the time-frequency correlation between the stock markets of the United States, Japan, mainland China and Hong Kong and the fluctuation of the Brent crude oil price.
3. The Time and Space Effects of Crude Oil and Stock Markets
3.1. Spatial Heterogeneity between Crude Oil Markets and Stock Markets
The relationship between crude oil and the financial market has always been a focus of academic circles, but discussion of the heterogeneity of crude oil’s hedging ability in different financial markets is relatively lagging. Many studies have focused on the relationship between oil prices and stock prices in specific markets. Wen, et al. [30] studied crude oil price risk and China’s stock market and pointed out that crude oil price risk had a negative impact on China’s entire industry. Kang et al. [31] and Gatfaoui [32] investigated the relationship between oil price and US crude oil stock price through quantitative and qualitative methods and concluded that there was a strong negative correlation between West Texas Intermediate (WTI) price and crude oil stock price. Boubaker and Raza [33] established a wavelet model of oil price versus Brazil, Russia, India, China, South Africa (BRICS) stock price and found that the stock price was directly affected by news and by itself, and indirectly affected by crude oil and other prices. Most existing research focusing on the synchronicity between the crude oil market and the financial market does not take into account the differences in crude oil hedging ability in different financial markets with different attributes, such as market maturity, the laws and regulations, the composition of market investors, the risk preference of investors, etc. Therefore, this paper studies the spatial heterogeneity of the crude oil market and different stock markets. According to the research method mentioned in Section 2.1, we can produce a wavelet coherence diagram of crude oil and the stock markets of the United States, Japan, China and Hong Kong, as shown in Figure 2.
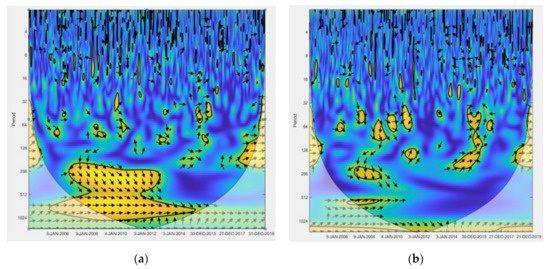
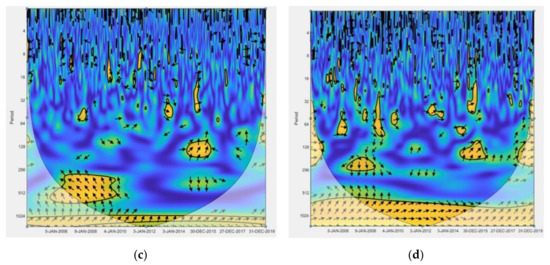
Figure 2.
The co-movement between the oil and stock markets in time-frequency space. (a) The US stock market, SP500; (b) the Japanese stock market, N225; (c) the mainland China’s stock market, SSEC; (d) the Hong Kong’s stock market, HSI. The area affected by edge effects is the semi-transparent region at the left and right boundary separated by the black U-shaped curve, which is the cone of influence (CoI). The thick black contours within CoI are the regions of significant coherence (at 5% level calculated using an 1000 Monte Carlo simulation). Abbreviations: SP500, S&P 500; N225, Nikkei 225 Index; SSEC, Shanghai Stock Exchange Composite Index; HIS, Hang Seng Index.
In the wavelet coherence analysis, the values of wavelet square coherence are represented by different colors, and the values of relative phase are represented by arrows. The color range of coherence is from blue (low coherence, close to 0) to red (high coherence, close to 1); that is, the color from cold to warm represents the correlation from weak to strong. In the wavelet coherence diagram, the horizontal axis represents time, and the vertical axis represents period (number of days). The relative phase represents the lead-lag and dependence relationship between crude oil and stock market price fluctuations. If the arrow points to the right, there is a positive correlation between the two sequences. If it points to the left, it has a negative correlation. If the arrow goes up, it indicates that the first sequence leads to the other sequence, and if the arrow goes down, it indicates that the first sequence lags behind the other. In this paper, the first sequence of all the wavelet coherence graphs is the fluctuation of the crude oil price, and the other represents the price fluctuation of the stock market. When the correlation between the two markets is weak or negative, it means that crude oil is suitable as a hedging asset. When the correlation is strong and positive, crude oil with common fluctuations is not suitable to be a hedging asset. If the price fluctuation of the stock market is caused by the price fluctuation of the crude oil market, crude oil is not suitable to be a hedging asset, and vice versa.
From Figure 2, it can be seen that there is spatial heterogeneity in the relationship between crude oil and the stock markets in various countries. Based on this, crude oil, as an underlying hedging security, varies in different spatial ranges. The hedging capacity of crude oil is weak in the US stock market, followed by the Hong Kong stock market and the Japanese stock market, while it is strong in China’s stock market. Figure 2 also shows that most of the time-frequency space is dominated by cold colors, which indicates that the correlation between crude oil and stock market is weak, so crude oil is suitable as a hedging asset. However, large differences exist among different countries. For the US stock market, compared with the other three countries, the time-frequency plane is dominated by warm colors, and the arrow points to the right. This shows that the fluctuation of the crude oil price is positively correlated with that of the US stock market in a certain period of time and frequency. On the one hand, as the US is a major importer of crude oil, the daily activities of American companies are in great need of crude oil. With the background of “irreversible investment theory”, the investment decisions of enterprises are often influenced by the fluctuation of stock prices, and then the daily production and investment decisions of enterprises affect the fluctuation of the international crude oil price [34]. Change in the crude oil price is closely related to the industrial development and macroeconomic stability of the United States. On the other hand, the United States is the global financial center, and changes in the American stock market will cause huge spillovers on the global financial market [35]. Crude oil’s growing financial attribute plays an important role in the determination of price fluctuation. With the deepening of world economic integration and regional economic cooperation, crude oil has become more and more closely connected with the American stock market [36]. Therefore, crude oil is not suitable as a hedging asset in the US stock market. The stock markets of Hong Kong and Japan, however, have a significant positive relationship with crude oil price volatility in a few periods and frequencies. For the Hong Kong stock market, many studies have shown that it is a market with stronger mutability or variability than a random sequence, and that it responds to external news very quickly and sensitively. When extreme economic events occur, the news of the volatility in the Hong Kong stock market and oil price will be affected by the external environment and spread rapidly in the global financial market, resulting in a common volatility trend. Similarly, as one of the modern mature financial markets, Japan established its stock index and launched its stock index futures relatively early. The Japanese stock market has a high degree of internationalization and is greatly affected by global economic integration. Therefore, Japanese stock market regulators and investors are very alert to the risks from overseas markets. For mainland China’s stock market, according to Figure 2, in addition to most of the cold color coverage, the warm color also points to the left, and crude oil has a negative correlation with stock price fluctuations. As a developing country, China’s financial market system is constantly improving. Compared with developed countries, its financial market is not mature. The price fluctuation of China’s stock market is greatly affected by policy, leading to the relatively independent trends of the Shanghai composite index and crude oil price. When China’s stock market index falls under the influence of domestic policies, speculative funds tend to turn to commodity futures markets such as crude oil to hedge the risks brought by domestic policies and boost the rise of oil prices, resulting in the negative correlation between international oil prices and China’s stock market. Therefore, there is no common fluctuation between crude oil price and the Chinese stock market, and crude oil can be used as a hedging asset for Chinese stock market investors. As a robustness check, we reran the whole analysis according to WTI crude oil price volatility and the corresponding results reported in Figure A1 generally confirmed our findings.
3.2. Long-and Short-Term Effects of Crude Oil Market and Stock Market
As the impact of institutional time and other factors in different countries may affect the behavior of investors in the stock market, it is also necessary to explore whether there are differences between the long-term effect and the short-term effect [37,38,39]. Masih and Masih [29] studied the dynamic causality among international stock price indexes, and they believed that there was a significant interdependence between the Organization for Economic Cooperation and Development (OECD) and Asian markets as well as the leadership of the US and UK markets in the short and long term. Bao et al. [40] applied a deep learning method to financial research and introduced long-term and short-term memory models to predict stock price. Engle et al. [41] explored the relationship between stock market volatility and macroeconomic activity and distinguished short-term and long-term movements with the new class of component models, finding that macro fundamentals also play an important role in stock price trend in the short term. Generally speaking, in the stock market, the long term refers to 6 months or more, the medium term refers to 1 month to 6 months, and the short term generally refers to less than 1 month. In the stock market, long-term operation involves investment in enterprises, while medium and short-term operation involves investment in the market. Different shareholders will choose according to their own situation suitable for their own operation mode. However, generally speaking, the risks in the stock market tend not to be long-term. In addition to the period of financial crisis, the risks spread in the global financial market, and the crude oil market is also affected, so long-term investment of more than six months is not considered here. Therefore, in this paper, we study crude oil as a hedging asset and enlarge the wavelet coherence diagrams of the crude oil market and the stock market according to different periods, taking 20 trading days (one month) as the boundary, periods 20 days as short-term and 20 period 120 as long-term.
Compared with the long term, the correlation between crude oil and the stock market is lower in the short term, and the hedging ability is stronger. In Figure 3, no matter which country’s stock market, in the short term, the wavelet coherence graph is covered by cold colors, while in the long run, there are more right-pointing arrows, and the stock market is positively correlated to fluctuation of the crude oil price. In the short run, crude oil is suitable as a hedging asset in the stock market. In cross-border investment activities, market investors are more sensitive to stock market volatility caused by domestic policies and carry out arbitrage. Because the financial markets of the United States, Japan, mainland China and Hong Kong are rich in financial derivatives, investors can use different combinations of instruments to hedge risks when the stock market volatility increases, and the tolerance of stock volatility is greater. In the long run, from August 2008 to January 2011 and from August 2015 to June 2016, the phase between crude oil and stock markets of various countries points to the upper right, showing strong correlation. The main reason lies in the contagion effect of global economic and political events in various financial markets. From August 2008 to January 2011, during the financial crisis, the sub-prime mortgage crisis in the United States, along with the relationship between banks through asset prices, liquidity and other channels, has formed a domino effect, bringing huge risk exposure to the global financial and derivative markets, and crude oil with financial attributes has also been affected. During the period from August 2015 to June 2016, Organization of Petroleum Exporting Countries’ s (OPEC) insistence on not reducing production triggered a wave of oil price decline, as the organization gave up the production ceiling and OPEC production continued to rise as Iran returned to the crude oil market. The huge fluctuation of the crude oil market had the same impact on the global financial market. The positive correlation between crude oil and China’s stock market shows that the long-term trend in both is influenced by the global economic background and has convergence factors. The price fluctuation of the crude oil market is determined by its own internal factors and by external factors of global risk, so the correlation is strong.
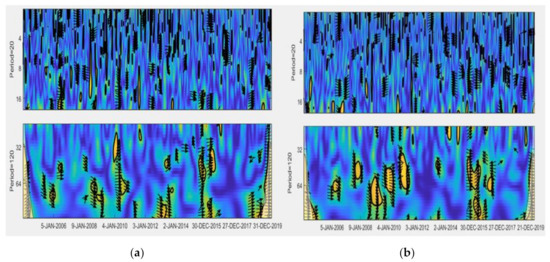
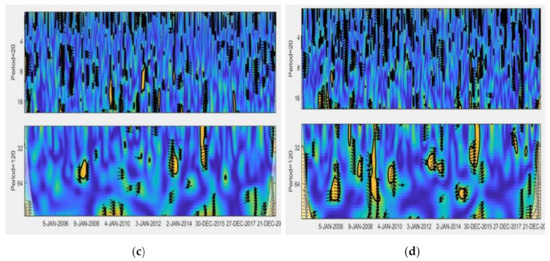
Figure 3.
The long-term and short-term wavelet coherence diagrams of crude oil price fluctuation and stock markets: (a) US stock market, SP500; (b) Japanese stock market, N225; (c) mainland China’s stock market, SSEC; (d) Hong Kong stock market, HSI.
For investors from all over the world, it is of great significance to study the dynamic relationship between crude oil price fluctuation and the stock market for portfolio risk management. Although crude oil is not a hedging asset for long-term investment, it can still play a hedging role in the short term. For investors in the stock markets of the United States, Japan and Hong Kong, the short-term hedging strategy of crude oil can lock the cost in advance and hedge the risk of stock price fluctuation. However, the outbreak of global events (such as financial crisis) causes the risk to spread in the financial market, and the crude oil market is inevitably affected, so it cannot be used as a hedging asset. For investors in mainland China’s stock market, in addition to internal factors such as the supply and demand of crude oil and the fluctuations brought to China’s stock market, crude oil can effectively hedge the investment risk of the stock market. As a robustness check, we reran the whole analysis according to WTI crude oil price volatility and the corresponding results reported in Figure A2 generally confirm our findings.
4. Analysis of Crude Oil’s Hedging Ability in the Context of Panic
4.1. Spatial Differences of the Hedging Ability of Crude Oil Under Panic
In order to understand the hedging ability of crude oil, it is of great significance to study the different impact of market sentiment changes on crude oil and the stock market in different environments. In fact, behind the state and uncertainty of the stock market, to a large extent, is the change of market sentiment, which is a systematic risk. Stock market return is positively correlated with the sentiment of market participants [17,20,42]. In different stock markets, the influence mechanism of market sentiment may be different. Boubaker and Raza [33] believed that crude oil prices and stock market prices are directly affected by news of their own changes. According to the different market participants, the spillovers between markets are quite different. Crude oil exporting countries are less attractive to international investors during periods of high market volatility [43]. He et al. [19] found that the negative impact of past risk compensation on stock returns also showed different signs of past investor sentiment. In a bear market, market sentiment is low, and stock market uncertainty is high, so the sentiment of risk aversion is strong, and investors prefer to invest in safe assets [44].
With the market in a state of panic, the ability of crude oil to hedge risk still varies significantly from country to country. Compared with Figure 2, Figure 4 has a larger area of cold colors in time and frequency, and the correlation between crude oil and the stock markets of various countries is weaker. In general, panic will promote the ability of oil to hedge risk. When the market is in a panic mood, risk aversion is strong, and investors tend to shift their investment to safe assets. For the Japanese stock market, the time-frequency plane is dominated by warm colors and the arrow points to the right. The fluctuation of the crude oil price is the same as that of the Japan and Hong Kong stock markets during the crude oil declining period, so it is not suitable as a hedging asset. When the correlation between crude oil and stock market is strong and positive, panic in the stock market is due to the impact of crude oil volatility. As Japan and Hong Kong are highly internationalized, market investors are very sensitive to global financial events and are very vulnerable to the impact of global financial events. For the stock markets of the United States and mainland China, when the market is in a panic, crude oil has a weak correlation with it, so it is more suitable to be a hedging asset. Panic in the stock market is mainly due to the fluctuation of the stock market caused by changes of the internal policies of various countries, while international crude oil will not be affected by the internal policies of individual countries. In 2015, the Federal Reserve’s first interest rate rise after the financial crisis in 2015 was moderate and expected by the market, so it did not pose a huge threat to the crude oil industry. However, the increase of interest rate for the US dollar raises the cost of capital, which leads to capital outflow, and the driving force for the stock market is relatively weakened, which is one of the incentives for the decline of the US stock price. For mainland China’s stock market, the introduction of the circuit breaker mechanism is in itself conducive to curbing the sharp rise and fall of stock prices, but the mechanism is applicable to the more mature securities market dominated by institutional investors; for China’s existing stock market, on the contrary, it further enlarges the herd effect under negative expectation, causing huge fluctuations in the stock market. As a robustness check, we reran the whole analysis according to WTI crude oil price volatility and the corresponding results reported in Figure A3 generally confirm our findings.
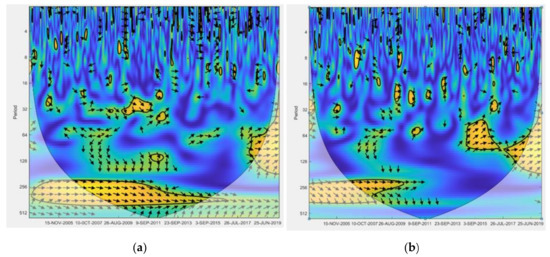
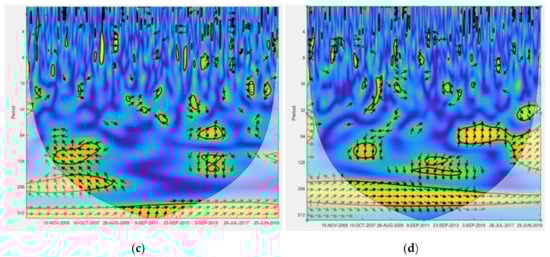
Figure 4.
The co-movement between the oil and stock markets in the time-frequency space in the context of panic. (a) US stock market, SP500; (b) Japanese stock market, N225; (c) mainland China’s stock market, SSEC; (d) Hong Kong stock market, HSI.
4.2. Structural Change of Crude Oil’s Hedging Ability under Panic Sentiment
In the long run, the correlation between returns on different financial assets will not remain constant. Mahata et al. [45] separated the stock market into the long term and the short term. They considered the structural change relationship between the financial market and extreme events under different time scales and helped market participants to determine investment strategies. Salisu and Fasanya [46] found that there was a structural fracture in the crude oil market, which would have a lasting impact on the crude oil market under the impact of huge economic and political events. Ewing and Malik [47] discussed the persistence and asymmetric effects of oil price fluctuations under different market conditions. The empirical results showed that if structural fractures were taken into account in the model, both good news and bad news would have much great impact on volatility.
When the market is in panic sentiment, the hedging effect of crude oil has structural changes. As can be seen from Figure 5, before 2015, in the long run, the correlation between crude oil and the stock markets of various countries was comparatively weaker and the risk hedging ability was stronger. During financial crisis, there is a positive correlation between the crude oil market and the stock market in the short term. Considering the long-run investment term, crude oil prices experienced a decade of rising before 2015, displaying a very good feature of a hedging asset. From June 2005 to October 2007, the trend in crude oil prices was generally stable, and within the rational range of international crude oil prices. In November 2007, crude oil prices began to rise and peaked in July 2008. The main reason for this lies in OPEC’s decision to cut production, which was driven by good news on both sides of the supply and demand chain, together with a period of rapid global economic growth and strong global demand for crude oil. However, the global financial crisis in October 2008 triggered a sharp downturn in oil prices. Since the second quarter of 2009, the global economy has gradually emerged from the financial crisis, coupled with oil supply crises (such as the OPEC production limit, the Libyan war in 2011 and the Iranian oil embargo in 2012), and oil prices have risen again. Therefore, when the domestic financial market is faced with economic policy and institutional risks, crude oil can be used as a hedging asset in both the short term and the long term. After 2015, the correlation between short-term crude oil and the stock markets of various countries was weaker and the risk-hedging ability of crude oil was stronger. In the long run, the stock market was positively related to and led by fluctuation of the crude oil price. At this time, panic in the stock markets of various countries was caused by fluctuation of the crude oil price. Since 2015, the international oil price has plummeted by more than 40%. From the perspective of market factors, international crude oil price volatility is gradually affected by its financial attributes. OPEC, the crude oil supplier, does not reduce production, and the shale oil and gas production in the United States continues to increase, leading to sufficient crude oil supply. In addition, the economies of Europe, Japan and emerging countries are generally depressed, and crude oil consumption is small. China, in particular, has been a major driver of global crude oil demand. However, in 2015, China’s economy slowed down significantly. Its GDP growth dropped and the stock market crisis became a black swan in the global financial market in the summer, causing market concerns. At the same time, China’s stagnant demand for coal and natural gas has caused huge economic losses for these industries. The oversupply of crude oil in the market has led to a drop in oil prices. In terms of non-market factors, crude oil price is also affected by factors like geopolitical factors, US dollar liquidity, US dollar trend and financial and personal speculation. Federal Funds Rate increases have helped strengthen the dollar, raising the cost of capital and pushing down oil prices. Market factors and non-market factors work together to influence oil prices and the trend of oil prices, causing panic in the spread of financial markets, and then affecting the stock market price fluctuations in various countries.
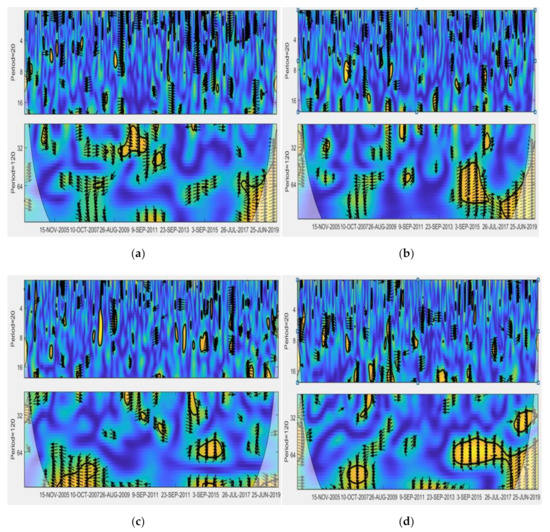
Figure 5.
The long-term and short-term wavelet coherence of crude oil price volatility and stock market during panic. (a) US stock market, SP500; (b) Japanese stock market, N225; (c) mainland China’s stock market, SSEC; (d) Hong Kong stock market, HIS.
Taking market panic sentiment into consideration can help financial investors further understand the hedging nature of crude oil assets. To a large extent, behind the correlation between crude oil and the stock market are changes of market sentiment, but the characteristics and influence mechanism of market sentiment change may be different. When the internal factors of crude oil spill into the stock market, and global economic events cause market panic, crude oil with huge fluctuations is not suitable as a hedging asset. When national political and economic policies affect the stock market and cause panic, the market risk aversion sentiment is strong, and crude oil is suitable as a hedging asset.
5. Conclusions
Due to the current COVID-19 pandemic, searching for safe-haven assets is an important issue during the period of risk to the global financial market. Traditional candidates for a safe haven such as gold, cryptocurrency, forex currencies and commodities may lose some effectiveness given the nature of the current crisis. Their role as safe haven assets must, therefore, be re-evaluated. Due to the global spread of COVID-19, stock markets all over the world have responded in terms of growing risks and changing inter-market linkages. Both assets have experienced disastrous losses since February 2020 and have been moving at a very similar trend during this period. The locking down of cities and borders also affects international trade, and thus puts the foreign exchange market into great uncertainty. The profound impact of this health crisis has caused investors all over the world to suffer great losses, and thus the demand for safe-haven assets has become even more urgent, an unprecedented event that will have a profound impact on practitioners and policymakers.
In the context of great changes in the global capital market, the stability of the hedging ability of oil deserves attention and discussion. Based on wavelet coherence analysis, this paper empirically studies the dynamic correlation between spot oil price volatility and the stock uncertainty index at different frequencies. Through the empirical analysis, this paper holds that oil’s role as a hedging asset is conditional.
- In space, the correlation between the crude oil market and the stock market of different countries is heterogeneous. Crude oil can be used as a hedging asset in the US stock market to the extent of 60%. In the Japanese and Hong Kong stock markets, crude oil can perform at 80% hedging capacity, while in mainland China’s stock market, crude oil hedging capacity reaches 90%. If the price fluctuation of the stock market is caused by the price of oil rises due to an oil market-specific demand shock, crude oil is not suitable to be a hedging asset, such as in financial crises. Our findings both complement and reinforce the evidence in Kilian and Park [9] and Ahmadi et al. [10] about the relationship between crude oil prices and the stock markets.
- There is a strong correlation between crude oil as a hedging asset and the maturity of the underlying assets of investors. Compared with the long term, the correlation between crude oil and the stock market is lower in the short term, and the hedging ability is stronger. This result is further consistent with Ahmadi et al. [16] who showed that this negative effect tends to be positive after one year from the shock.
- When the market is in a state of panic, crude oil has a stronger ability to hedge risk in the face of price fluctuations of underlying securities. First, when the market is in a state of panic, the hedging abilities of crude oil are still significantly different among the stock markets of various countries. The crude oil price fluctuates in the same way as the Japan and Hong Kong stock markets in the period of crude oil price decrease. As a hedging asset, it can cover about 85% of the time range. For the stock markets of the United States and mainland China, crude oil has a weak correlation with them, and it can be regarded as a hedging asset in more than 90% of cases. Second, when the market is in panic, there are structural changes in crude oil’s hedging capacity. Before 2015, compared with the short term, in the long term crude oil had stronger risk hedging ability. After 2015, in the short term, crude oil has had a stronger ability to hedge risks.
Author Contributions
Conceptualization, H.Z.; Data curation, S.X.; Formal analysis, Z.D.; Funding acquisition, S.X.; Methodology, Z.D.; Project administration, S.X.; Resources, S.X.; Software, Z.D.; Supervision, H.Z.; Validation, H.Z.; Visualization, Z.D.; Writing—Original draft, Z.D. and H.Z. All authors have read and agreed to the published version of the manuscript.
Funding
This research was funded by No. 291[2019] of the Teaching Reform Research Project of ordinary universities in 2019 and by the Natural Science Funds of Hunan Province (2018JJ3107).
Acknowledgments
The authors are most grateful to the anonymous referees for their helpful comments and suggestions.
Conflicts of Interest
The authors declare no conflict of interest.
Appendix A

Figure A1.
The co-movement between WTI crude oil and stock markets in time-frequency space. (a) The US stock market, SP500; (b) the Japanese stock market, N225; (c) mainland China’s stock market, SSEC; (d) Hong Kong’s stock market, HSI.

Figure A2.
Long-term and short-term wavelet coherence diagrams of WTI crude oil price fluctuation and stock markets: (a) US stock market, SP500; (b) Japanese stock market, N225; (c) mainland China’s stock market, SSEC; (d) Hong Kong stock market, HSI.

Figure A3.
The co-movement between WTI crude oil and stock markets in time-frequency space in the context of panic. (a) US stock market, SP500; (b) Japanese stock market, N225; (c) mainland China’s stock market, SSEC; (d) Hong Kong stock market, HSI.
References
- Foroni, C.; Guerin, P.; Marcellino, M. Explaining the time-varying effects of oil market shocks on US stock returns. Econ. Lett. 2017, 155, 84–88. [Google Scholar] [CrossRef]
- Apergis, N.; Miller, S.M. Do structural oil-market shocks affect stock prices? Energy Econ. 2009, 31, 569–575. [Google Scholar] [CrossRef]
- Raza, N.; Jawad Hussain Shahzad, S.; Tiwari, A.K.; Shahbaz, M. Asymmetric impact of gold, oil prices and their volatilities on stock prices of emerging markets. Resour. Policy 2016, 49, 290–301. [Google Scholar] [CrossRef]
- Basher, S.A.; Sadorsky, P. Hedging emerging market stock prices with oil, gold, VIX, and bonds: A comparison between dcc, adcc and go-garch. Energy Econ. 2016, 54, 235–247. [Google Scholar] [CrossRef]
- Kumar, S. Asymmetric impact of oil prices on exchange rate and stock prices. Q. Rev. Econ. Finance 2019, 72, 41–51. [Google Scholar] [CrossRef]
- Jin, J.Y.; Yu, J.; Hu, Y.; Shang, Y. Which one is more informative in determining price movements of hedging assets? Evidence from bitcoin, gold and crude oil markets. Phys. A 2019, 527, 13. [Google Scholar] [CrossRef]
- Maghyereh, A.I.; Awartani, B.; Tziogkidis, P. Volatility spillovers and cross-hedging between gold, oil and equities: Evidence from the Gulf Cooperation Council countries. Energy Econ. 2017, 68, 440–453. [Google Scholar] [CrossRef]
- Sarwar, S.; Khalfaoui, R.; Waheed, R.; Dastgerdi, H.G. Volatility spillovers and hedging: Evidence from Asian oil-importing countries. Resour. Policy 2019, 61, 479–488. [Google Scholar] [CrossRef]
- Kilian, L.; Park, C. The impact of oil price shocks on the US stock market. Int. Econ. Rev. 2009, 50, 1267–1287. [Google Scholar] [CrossRef]
- Ahmadi, M.; Manera, M.; Sadeghzadeh, M. Global oil market and the US stock returns. Energy 2016, 114, 1277–1287. [Google Scholar] [CrossRef]
- Chang, C.L.; McAleer, M.; Tansuchat, R. Crude oil hedging strategies using dynamic multivariate GARCH. Energy Econ. 2011, 33, 912–923. [Google Scholar] [CrossRef]
- Sharma, S.; Rodriguez, I. The diminishing hedging role of crude oil: Evidence from time varying financialization. J. Multinatl. Financ. Manag. 2019, 52–53, 17. [Google Scholar] [CrossRef]
- Hernandez, J.A.; Shahzad, S.J.H.; Uddin, G.S.; Kang, S.H. Can agricultural and precious metal commodities diversify and hedge extreme downside and upside oil market risk? An extreme quantile approach. Resour. Policy 2019, 62, 588–601. [Google Scholar] [CrossRef]
- Arouri, M.E.; Lahiani, A.; Nguyen, D.K. World gold prices and stock returns in China: Insights for hedging and diversification strategies. Econ. Model. 2015, 44, 273–282. [Google Scholar] [CrossRef]
- Wen, F.H.; Xu, L.H.; Ouyang, G.D.; Kou, G. Retail investor attention and stock price crash risk: Evidence from China. Int. Rev. Financ. Anal. 2019, 65, 15. [Google Scholar] [CrossRef]
- Ahmadi, M.; Manera, M.; Sadeghzadeh, M. The investment-uncertainty relationship in the oil and gas industry. Resour. Policy 2019, 63, 101439. [Google Scholar] [CrossRef]
- Oliveira, N.; Cortez, P.; Areal, N. Stock market sentiment lexicon acquisition using microblogging data and statistical measures. Decis. Support Syst. 2016, 85, 62–73. [Google Scholar] [CrossRef]
- Balcilar, M.; Demirer, R.; Ulussever, T. Does speculation in the oil market drive investor herding in emerging stock markets? Energy Econ. 2017, 65, 50–63. [Google Scholar] [CrossRef]
- He, Z.F.; He, L.J.; Wen, F.H. Risk compensation and market returns: The role of investor sentiment in the stock market. Emerg. Mark. Finance Trade 2019, 55, 704–718. [Google Scholar] [CrossRef]
- Lee, W.Y.; Jiang, C.X.; Indro, D.C. Stock market volatility, excess returns, and the role of investor sentiment. J. Bank. Finance 2002, 26, 2277–2299. [Google Scholar] [CrossRef]
- Chen, C.D.; Cheng, C.M.; Demirer, R. Oil and stock market momentum. Energy Econ. 2017, 68, 151–159. [Google Scholar] [CrossRef]
- Baker, M.; Wurgler, J.; Yuan, Y. Global, local, and contagious investor sentiment. J. Financ. Econ. 2012, 104, 272–287. [Google Scholar] [CrossRef]
- Chang, Y.Y.C.; Faff, R.W.; Hwang, C.-Y. Sentiment contagion, corporate governance, information and legal environments. Corporate Governance, Information and Legal Environments. J. Int. Financ. Mark. Inst. Money 2009, 58, 269–283. [Google Scholar]
- Hudson, Y.; Green, C.J. Born in the USA? Contagious investor sentiment and UK equity returns (No. 2013_13); Department of Economics, Loughborough University: Loughborough, UK, 2013. [Google Scholar]
- Li, Z.; Zhong, J. Impact of economic policy uncertainty shocks on China’s financial conditions. Finance Res. Lett. 2019. [Google Scholar] [CrossRef]
- Bildirici, M.E.; Badur, M.M. The effects of oil prices on confidence and stock return in China, India and Russia. Quant. Financ. Econ. 2018, 2, 884–903. [Google Scholar] [CrossRef]
- Liu, K.; Luo, C.; Li, Z. Investigating the risk spillover from crude oil market to BRICS stock markets based on copula-pot-covar models. Quant. Finance Econ. 2019, 3, 754–771. [Google Scholar] [CrossRef]
- Wen, F.H.; Zhao, Y.P.; Zhang, M.Z.; Hu, C.Y. Forecasting realized volatility of crude oil futures with equity market uncertainty. Appl. Econ. 2019, 51, 6411–6427. [Google Scholar] [CrossRef]
- Masih, R.; Masih, A.M. Long and short term dynamic causal transmission amongst international stock markets. J. Int. Money Finance 2001, 20, 563–587. [Google Scholar] [CrossRef]
- Wen, F.H.; Xiao, J.H.; Xia, X.H.; Chen, B.; Xiao, Z.Y.; Li, J.Y. Oil prices and chinese stock market: Nonlinear causality and volatility persistence. Emerg. Mark. Finance Trade 2019, 55, 1247–1263. [Google Scholar] [CrossRef]
- Kang, W.S.; Ratti, R.A.; Vespignani, J. The impact of oil price shocks on the US stock market: A note on the roles of US and Non-US oil production. Econ. Lett. 2016, 145, 176–181. [Google Scholar] [CrossRef]
- Gatfaoui, H. Linking the gas and oil markets with the stock market: Investigating the US relationship. Energy Econ. 2016, 53, 5–16. [Google Scholar] [CrossRef]
- Boubaker, H.; Raza, S.A. A wavelet analysis of mean and volatility spillovers between oil and BRICS stock markets. Energy Econ. 2017, 64, 105–117. [Google Scholar] [CrossRef]
- Li, Z.; Liao, G.; Albitar, K. Does corporate environmental responsibility engagement affect firm value? The mediating role of corporate innovation. Bus. Strat. Environ. 2019. [Google Scholar] [CrossRef]
- Liu, X.Y.; An, H.Z.; Huang, S.P.; Wen, S.B. The evolution of spillover effects between oil and stock markets across multi-scales using a wavelet-based GARCH-BEKK model. Phys. A 2017, 465, 374–383. [Google Scholar] [CrossRef]
- Liao, G.K.; Li, Z.H.; Du, Z.Q.; Liu, Y. The heterogeneous interconnections between supply or demand side and oil risks. Energies 2019, 12, 17. [Google Scholar] [CrossRef]
- Cai, X.J.; Tian, S.; Yuan, N.; Hamori, S. Interdependence between oil and East Asian stock markets: Evidence from wavelet coherence analysis. J. Int. Financ. Mark. Inst. Money 2017, 48, 206–223. [Google Scholar] [CrossRef]
- Dutta, A. Oil and energy sector stock markets: An analysis of implied volatility indexes. J. Multinatl. Financ. Manag. 2018, 44, 61–68. [Google Scholar] [CrossRef]
- Ftiti, Z.; Guesmi, K.; Abid, I. Oil price and stock market co-movement: What can we learn from time-scale approaches? Int. Rev. Financ. Anal. 2016, 46, 266–280. [Google Scholar] [CrossRef]
- Bao, W.; Yue, J.; Rao, Y.L. A deep learning framework for financial time series using stacked autoencoders and long-short term memory. PLoS ONE 2017, 12, 24. [Google Scholar] [CrossRef]
- Engle, R.F.; Ghysels, E.; Sohn, B. Stock market volatility and macroeconomic fundamentals. Rev. Econ. Stat. 2013, 95, 776–797. [Google Scholar] [CrossRef]
- Li, Z.H.; Dong, H.; Huang, Z.H.; Failler, P. Asymmetric effects on risks of virtual financial assets (VFAs) in different regimes: A case of bitcoin. Quant. Finance Econ. 2018, 2, 860–883. [Google Scholar] [CrossRef]
- Bein, M.A.; Aga, M. On the linkage between the international crude oil price and stock markets: Evidence from the NORDIC and other European oil importing and oil exporting countries. Rom. J. Econ. 2016, 19, 115–134. [Google Scholar]
- Selmi, R.; Mensi, W.; Hammoudeh, S.; Bouoiyour, J. Is bitcoin a hedge, a safe haven or a diversifier for oil price movements? A comparison with gold. Energy Econ. 2018, 74, 787–801. [Google Scholar] [CrossRef]
- Mahata, A.; Bal, D.P.; Nurujjaman, M. Identification of short-term and long-term time scales in stock markets and effect of structural break. Phys. A 2020, 545, 12. [Google Scholar] [CrossRef]
- Salisu, A.A.; Fasanya, I.O. Modelling oil price volatility with structural breaks. Energy Policy 2013, 52, 554–562. [Google Scholar] [CrossRef]
- Ewing, B.T.; Malik, F. Modelling asymmetric volatility in oil prices under structural breaks. Energy Econ. 2017, 63, 227–233. [Google Scholar] [CrossRef]
© 2020 by the authors. Licensee MDPI, Basel, Switzerland. This article is an open access article distributed under the terms and conditions of the Creative Commons Attribution (CC BY) license (http://creativecommons.org/licenses/by/4.0/).