1. Introduction
Pile installation by driving is a high-risk activity in any construction project. Inefficient pile driving can potentially cause material damage to the piles and project delays that may have great financial implications. Selected driving equipment must be capable of installing piles to a target depth within a given time-frame without overstressing the pile. A comprehensive driveability analysis is therefore essential to any project involving pile foundations. In the offshore environment, this is even more important as delays can have significant financial costs and associated risks [
1]. Driveability analyses must consider all aspects of pile installation, such as soil conditions and soil-structure interaction, driving equipment performance, and pile specifications including geometrical and material properties.
Driveability analyses require calculation of Static Resistance to Driving (SRD) profiles, which are a measure of the soil resistance to pile installation. SRD is analogous to the axial capacity of a pile and represents the cumulative increase in shaft capacity associated with further pile penetration. This also encompasses a base resistance that is associated with each driving increment. Schneider and Harmon [
2] claim that SRD is similar to pile static axial capacity except that the resistance often differs due to consolidation, stress equalization, and ageing effects (capacity increases over time).
The total resistance of a pile to driving is commonly presented in terms of the blow counts (hammer impacts) per 0.25 m penetration required to drive the pile to its target installation depth. This can be estimated using wave equation analysis whereby the inputs include a combination of SRD, pile properties, hammer properties, and dynamic resistance components. Solving the wave equation enables incorporation of the dynamic components including inertia and viscous rate effects, which contribute to the resistance. These are represented by damping and quake values, as discussed in more detail in
Section 2. The solution to the wave equation allows estimation of the blow counts required to drive a pile, the installation-related stresses, and an estimate of the driving time. It should be noted that an over-estimation of blow counts is considered conservative, unlike an over-estimation of axial capacity, which is considered unconservative. It is desirable that a driveability study would lead to a slight over-estimation of the required blow-counts to install a pile.
Arguably the most challenging aspect of performing driveability studies lies with the accurate modelling of soil-structure interaction [
1,
3,
4]. Several models have been put forward to derive SRD profiles, see for example [
2,
5,
6,
7,
8]. Many of these approaches are highly empirical and are biased to the dataset from which they are derived. Due to the analogous relationship between a pile being installed and a penetrating cone, Cone Penetration Tests (CPTs) have become popular in recent years as a way to more accurately encapsulate pile-soil interaction behavior. There are various CPT-based methods already developed to determine the axial static capacity of piles [
9,
10]. Due to the similarity between axially loaded piles and piles being installed by driving, it is of interest to assess the applicability of these approaches to estimating pile driveability [
1]. However, there are some notable differences in the behavior. Firstly, several of these CPT-based axial capacity methods have been developed based on pile load tests conducted between 10 and 30 days after pile installation. Previous studies have indicated that static pile capacity may increase over time after pile driving [
11,
12,
13,
14,
15]. Based on this premise, the pile resistance experienced during driving should be less than the capacity measured after some time has passed. The application of a time factor to account for this ageing is therefore of interest. Secondly, during pile driving, the shear resistance measured at a given point below the ground surface reduces as the pile tip penetration increases, a phenomenon known as friction fatigue. Schneider and Harmon [
2] suggest calculating the pseudo average shaft friction to accommodate changes in the shape of shear resistance distribution during pile driving. More details on this are provided in subsequent sections. Thirdly, the pile penetration per blow during driving is typically less than the failure criteria used to derive the base capacity in CPT-based axial capacity approaches including the IC-05, Fugro-05 and UWA-05 methods. These models incorporate a base resistance corresponding to a pile tip displacement of 0.1D, where D is the pile diameter. A reduction factor is therefore required to consider the actual pile tip displacement encountered during driving [
1,
16]. Finally, residual stresses on the pile base may be significantly miss-represented, which could lead to considerable error particularly in the case of the UWA-05 base resistance [
1,
17]. Ignoring residual stresses could lead to an underestimation of the base resistance during driving.
In this paper, factors influencing the prediction of pile driveability using CPT-based approaches are investigated. Three CPT-based static capacity models are trialed, namely IC-05, UWA-05 and Fugro-05. The effects of pile ageing on the derived SRD profiles, base-mobilization and residual stresses are investigated with a view to understanding their influence on the perceived driveability of piles. Models are compared to measured pile installation records on relatively slender piles at Blessington, Ireland to appraise the performance of the methods used. Finally, the influence of operating parameters within the wave equation analysis including damping (toe and skin), quake, hammer stroke height, and efficiency is assessed.
2. Background to Pile Driveability
2.1. Wave Equation Analysis
The main parameters of interest from a driveability study are the blow counts required to install the pile, the driving stresses experienced by the pile during installation and the time required to drive a pile to a target installation depth. These can be estimated using wave equation analysis. The factors affecting a pile’s resistance to driving include the soil’s SRD profile, increases in the pile capacity due to inertia (mass) and viscous rate effects (damping). Methods to define the SRD as an input to the pile driveability analysis are discussed in
Section 2.2. The inertia and viscous rate effects are accounted for automatically within the wave equation solution procedure. It is necessary to specify damping (energy dissipation) and quake (displacement to achieve yield) values for a given analysis. A 1-D commercially available finite-difference wave equation solver, GRLWEAP [
18], is used in the present study to estimate the blow-counts required to install piles and to investigate how variations in the input parameters influence the predictions using CPT-based approaches. GRLWEAP is a commonly-used commercially available software, created by Pile Dynamics [
18]. It enables estimation of soil resistance and dynamic stresses in piles, selection of appropriate driving equipment, determination of whether a pile will be over-stressed, determination of the likelihood of refusal, and estimation of driving time. The response of a pile can be predicted by GRLWEAP through solving the wave equation shown in Equation (1):
where u is the displacement of the pile (m), ρ is the density of the pile material (kg/m
3), E is the Young’s modulus (N/m
2) and
is the wave speed.
The various inputs and outputs of a pile driveability study in the context of the present paper are shown in
Figure 1. This paper focusses on the influence of various factors affecting the SRD profile, derived by appropriate modification of CPT-based axial static capacity approaches for piles, as well as the influence of uncertainty in the damping and quake values, used for a given calculation.
2.2. Static Resistance to Driving (SRD)
Soil resistance to pile driving comprises both static and dynamic components. The SRD is analogous to axial static capacity and includes shaft friction and base resistance. Unlike static capacity however, which only has a single base resistance and shaft capacity distribution, a SRD profile has a base resistance for each driving increment. Moreover, the shaft capacity also varies according to pile penetration. Further differences between pile static capacity and SRD arise due to time effects (ageing), consolidation, stress equalisation, and the definition of soil failure used to derive base resistance in static load tests [
2].
The occurrence of plugging in open-ended piles during driving can be represented by the Incremental Filling Ratio (IFR), which affects base resistance in the definition of SRD. In fully coring conditions (IFR = 1), end bearing is mobilized on the pile annulus (q
ann) only, and both internal
) and external
) shaft friction are mobilized along the shaft surface area. Alm and Hamre [
8] and Schneider and Harmon [
2] suggest reducing unit shaft friction to 50% and applying on both the internal and external pile wall, which is approximately the same as applying the full external shaft friction without any internal shaft friction. Methods to derive estimates of shaft friction are presented in
Section 2.3.
The shaft stress distribution associated with each pile penetration increment is altered due to friction fatigue, whereby the shear resistance at a given point below ground level reduces with advancement of the pile tip. Some existing SRD models incorporate this by inclusion of a degradation term typically of the form (h/R)
n, where h is the vertical distance from the pile tip to the point in the ground where the stress is being calculated and R is the pile radius. This term changes the shape of the soil shear stress distribution as the pile penetrates, therefore an averaging technique to obtain one global SRD profile for input to the wave equation solver is required. Schneider and Harmon [
2] suggest that the shape of the shaft stress distribution has a negligible effect on the bearing graph and suggest calculating the pseudo-average shaft friction between successive depth increments
) as follows:
where ∑
QS,L is the cumulative shaft resistance at the pile tip depth, ∑
QS,L-1 is the cumulative shaft resistance at the previous depth increment, Δ
L is the depth increment, and
D is the pile diameter. Friction fatigue is incorporated to provide a more realistic estimate of the shaft friction experienced by a pile during installation.
2.3. Application of CPT-Based Axial Capacity Approaches to Predicting Pile Installation
Cone Penetration Tests (CPT) are a common and useful site investigation tool used in geotechnical characterization. Site investigations must be undertaken to determine strength parameters of soil to inform on design and construction-related matters. The correlation between cone tip resistance (qc), which is the stress experienced by a cone tip as it penetrates into soil, and pile shaft friction and base resistance has been developed over several years.
Various traditional SRD approaches have been proposed by Toolan and Fox [
6], Stevens et al. [
5] and Alm and Hamre [
8] among others. For piles installed in sand, Toolan and Fox [
6] proposed that unit base resistance and unit skin friction be determined as a weighted average and a fraction of CPT q
c respectively. The q
c value used in the base resistance should be averaged over a number of pile diameters above and below the pile tip. Stevens et al. [
5] proposed determining both the unit base and skin resistance by limiting these for plugged and coring conditions. Alm and Hamre [
8] developed a model-based CPT approach using back-calculated driveability studies, which incorporated friction fatigue effects. While these approaches have been used with some success to date, there is a question over their general applicability to piles with diameters beyond those used in the respective datasets from which these were each derived.
Methods that use the CPT q
c value as a primary input parameter in estimating the axial capacity of piles in sand include Imperial College (IC-05) [
9], University of Western Australia (UWA-05) [
10], and Fugro-05 [
19]. Recent CPT-based approaches consider friction fatigue and plugging effects on piles.
The ultimate capacity of a pile is the summation of the shaft and base resistance as written in the following equation:
where
Qs is the total shaft capacity,
Qb is the total base capacity, P is the pile perimeter (
P =
πD for a circular pile and P = 4B for a square pile),
is the local shaft friction at failure along the pile shaft, z is the embedded shaft length,
Ab is the base area (
for a circular pile, and
for a square pile), q
b is the base resistance, which assumes a displacement of 0.1
D as the failure criterion (at the pile head for IC-05, and at the pile tip for UWA-05 and Fugro-05), and
D is the pile outer diameter.
2.3.1. Shaft Capacity
The shaft capacity is formulated differently for the various CPT-based axial capacity approaches. The IC-05 approach for estimating ultimate shaft resistance is shown in the following equation:
where
= 0.9 for open-ended piles in tension and 1 in all other cases,
= 0.8 for piles in tension and 1 for piles in compression and R* = (R
2 − R
i2)
0.5 where R and R
i are the external and internal pile radius respectively. Using this approach it is assumed that no plugging has occurred during installation.
is the change in radial stress experienced at the interface due to dilation.
The UWA-05 approach for estimating shaft resistance is shown as follows:
where
(ratio of tension to compression capacity) = 1 for compression and 0.75 for tension,
(effective area ratio)
where
D and
Di are the external and internal pile diameter,
IFR = the incremental increase in soil plug length over the pile penetration depth,
. Given that IFR data is not available prior to pile installation, it is recommended to assume IFR = Plug Length Ratio, (PLR = final plug length/penetration depth) based on experience of similar pile geometries and sand types or to assume IFR = 1.0 if no experience is available.
The Fugro-05 approach for estimating shaft friction is defined as follows:
which varies depending on what portion of the pile shaft is being analyzed, i.e., dependent on (
h/
R*).
2.3.2. Base Resistance
Similarly to the shaft capacity, the base resistance is formulated differently for the various axial capacity approaches. The IC-05 approach postulates two expressions depending on whether the pile is open or closed-ended. Furthermore, for the open-ended pile, the expression varies depending on the plugging condition, as follows:
where
qb0.1 is the base resistance corresponding to a displacement of 0.1D,
qc,avg is the average CPT stress (depending on which averaging technique is adopted),
DCPT is the diameter of the penetrating cone, and
Ar is the area ratio.
For the UWA-05 approach, the base resistance is formulated as follows:
For the Fugro-05 approach it is formulated as shown here:
2.4. Modifications to CPT-Based Axial Capacity Approaches to Predict Pile Installation
In order to account for the conditions experienced at installation, some modification to the axial capacity approaches can be undertaken, as discussed in the following subsections.
2.4.1. Pile Ageing
The methods described previously to calculate the axial capacity of piles (IC-05, UWA-05, and Fugro-05) were each derived empirically from pile load tests conducted between 10 and 30 days after pile installation. Various studies suggest that shaft capacity of piles driven in sand increases with time, a phenomenon termed ageing.
Jardine et al. [
11] investigated the ageing effect in dense sand by determining Intact Ageing Curves (IAC), which indicate that the shaft capacity experienced one day after driving is approximately 70% that experienced 10–30 days after driving. Gavin et al. [
15] found that ageing does not depend on whether the piles are driven in dry or partially saturated sand with salty or fresh water, however, driving reduced the resistance during installation, causing higher gains in capacity with time. Lehane et al. [
20] collected recent pile ageing information and collated into a database, including field test data at Dunkirk [
11], Blessington [
12] and Larvik [
13]. Using this database, an equation was derived to estimate the time-variation in capacity after installation, determined as:
where
t is the pile age in days and
doffset is the vertical offset that best fits the data points. This time factor can be applied to determine the shaft friction expected during installation by setting the time to zero, which reveals a time factor of 0.69 can be applied to determine the shaft friction for SRD calculations. Gavin and Igoe [
21] found that changes in shaft capacity caused by ageing effects on piles installed in Blessington sand were concentrated in a zone within five pile diameters of the tip. Therefore, this reduction factor should be used with caution on long, slender piles as it may be unconservative.
2.4.2. Base Mobilization during Driving
The unit base resistance expressions postulated in the CPT-based axial capacity methods such as UWA-05, IC-05, and Fugro-05 calculate the resistance mobilized at a pile displacement of 0.1D (outer pile diameter). During pile installation, however, the displacement per blow is expected to be significantly less than 0.1D. The UWA-05 method considers partially plugging conditions, which are represented by the Final Filling Ratio (FFR) value. This suggests a potential means for considering actual expected displacements during installation within a modified UWA-05 approach [
1,
16].
Byrne et al. [
1] propose the implementation of a three-stage base resistance-displacement model [
16] to estimate the expected base resistance mobilized during driving.
Figure 2 shows an idealized base resistance-displacement model consisting of the unit base resistance (q
b) versus the pile tip displacement (
wb) normalized by pile diameter (
D). The model consists of three portions: the initial settlement response is assumed linear until a yield strain (
wby/D = 1.5%) is exceeded, and this is followed by a non-linear parabolic stage until a strain of 0.1D is achieved. An initial residual stress
qb,res must be overcome prior to any movement occurring (see
Section 2.4.3).
The linear portion of the curve is governed by the small-strain Young’s modulus of the soil (E
0), which can be obtained from Multi-Channel Analysis of Surface Waves [
22] or from correlations to CPT tip resistance [
23,
24,
25]. The linear portion of the curve follows:
where
ν is the Poisson’s ratio,
wb is the pile tip displacement (at a given blow),
D is the outer pile diameter, and
qb,res is the residual base resistance.
The parabolic portion of the curve
wby/D < wb/D < 0.1 is modified from the original source [
1,
16] and approximated as a line as follows:
where
qb01,UWA is the unit base resistance from the UWA-05 method. The reason for approximating the parabolic portion of the curve as a line is for ease of the analysis in this paper. To modify the base resistance using the base resistance-settlement model from [
16], it is anticipated that the errors introduced in this respect will be minimal. Residual base stresses associated with the action of previous hammer blows can be incorporated as a proportion of the CPT end resistance [
1], as discussed in the next section.
2.4.3. Residual Base Stresses
During driving, the pile experiences compression under the action of a hammer blow, and subsequently tension under zero loading (rebounding). The tension force tends to cause some rebound to occur between hammer blows. The development of this condition can be considered as a residual base stress (
qb,res) developing on the pile base area. The development of this residual base stress implies that negative skin friction (
) must also develop along the pile shaft to ensure equilibrium between blows.
Figure 3 illustrate the development of the stress condition.
Paik et al. [
26] suggest that the presence of residual base stresses does not affect the ultimate bearing capacity of piles under axial static loading since the summation of residual shaft and base resistance will equal to zero. However,
qb,res must be acknowledged when considering pile driveability, since its presence alters the proportion of resistance acting at the shaft and the base, which influences the response under wave equation analyses [
1]. When a hammer impacts the pile, the residual negative skin friction must first go to zero then tend towards its limiting positive value. Meanwhile, the effective stress generated at the pile base due to a hammer impact is added to the residual base resistance already present.
Estimating the magnitude of residual base stress is challenging. Alawneh and Malwaki [
27] propose a method to estimate the post-driving residual base stresses as a function of the pile penetration length, diameter, area, shear and Young’s modulus. This method suggests residual stresses that range between 0 and 4000 kPa. Paik et al. [
26] measured residual base stresses on 0.356 m diameter closed and open-ended piles which suggests these stresses are of the order of 11–14% of CPT q
c. Similarly, Byrne et al. [
1] suggest residual base stresses could be of the order of 1–10% of q
c. Gavin and Lehane [
16] found that the residual load developed on an open-ended pile was related to the IFR values, with fully-coring piles (IFR = 100%) developing low residual loads and fully plugged piles developing higher residual loads than closed-ended piles with the same external diameter. Gavin and Igoe [
21] measured the residual load on Pile S6 considered in this paper and found that the residual base stress at the end of installation was 4 MPa, ≈ 20% of the q
c value at this pile tip level. This was for an IFR value of 40% which is unlikely to be developed by an open-ended pile in practice as at such a value it would be extremely difficult to continue pile driving due to high base resistances. In reality, the estimation of residual stress magnitude is quite an uncertain process, and depends on the relative relationship between the developing negative skin friction and the internal stresses in the pile, among other factors.
3. Analysis and Results
3.1. Driven Pile Database
In this paper, the driveability results of seven steel open-ended piles at Blessington, Ireland are used. Soil properties and ground conditions at the Blessington site are reported in [
12,
14,
16,
23] and the significant parameters are reported herein. The soil profile at this site consists of very dense over-consolidated sand. The groundwater table is approximately 13 m below ground level (bgl). The in-situ water content is relatively uniform at 10–12% above the water table. Piles are installed above the water table where pore pressure dissipates almost immediately. The sand relative density ranges between 90% and 100%. The particle size (D
50) varies between 0.1 mm and 0.15 mm based on particle size distribution analyses from samples located between 0.7–2 m bgl. The soil is well-graded angular sand with 5–10% fines content. The unit weight is approximately 20 kN/m
3, and the constant volume friction angle is approximately 37°.
A total of 10 CPTs were conducted at the site, the average, maximum and minimum profiles shown in
Figure 4a. The CPTs are quite uniform across the site. The shear wave velocity (
Vs) profiles measured using MASW are shown in
Figure 4b, and the subsequently derived shear modulus profiles (
G0) from both the CPT and MASW measurements are shown in
Figure 4c. The
G0 profiles were derived from the CPT measurements using a correlation known as a rigidity index,
G0/qc. For a given deposit
G0/qc increases with sand age and cementation [
25], and this parameter has been studied in detail by several authors [
25,
28]. For an aged, over-consolidated material such as that at Blessington, a rigidity index in the range of 5–8 is expected. In the present analysis a value of 6 was adopted.
Seven open-ended steel piles named S1–S7 were each driven 7 m into the ground, except for pile S6, which was driven 6.5 m. Each pile has an external diameter (
D) of 0.34 m, internal diameter (
Di) of 0.312 m, and wall thickness (t
w) of 0.014 m. Blow count records for each pile are plotted in
Figure 5a. All piles exhibit an increase in blow counts with penetration depth. Blow counts for pile S4 are low compared to S2, S3 and S5. Pile S6 encounters the highest blow counts compared to the remaining piles. Some of the differences in the blow counts can be accounted for by variations in the properties of the driving equipment (hammer type and stroke heights).
Table 1 provides information on the hammer properties adopted to drive each pile. Piles S1–S5 and S6, S7 were driven using 4000 kg Junttan PM16 and 5000 kg Junttan PM20 hammers, respectively. Piles S1 and S2–S5 were driven with the same constant stroke height of 0.4 m and 0.3 m accordingly. Piles S6 and S7 used a combination of stroke heights with higher energies (e.g., drop-heights) being used for Pile S7 in order to limit the blow-counts during installation and thus protect sensitive radial stress sensors used in the ageing study reported by Gavin and Igoe [
21].
Figure 5b shows the IFR measured during pile installation. All piles developed a similar IFR profile. All piles were nearly fully coring or unplugged (IFR = 1) over the first meter of pile penetration and became partially plugged (IFR = 0.4) at the end of driving with 2.45 m final plug length. Pile S4 experienced less plugging over the final metre of penetration and had a final IFR = 0.75 at the end of driving and the longest final plug length.
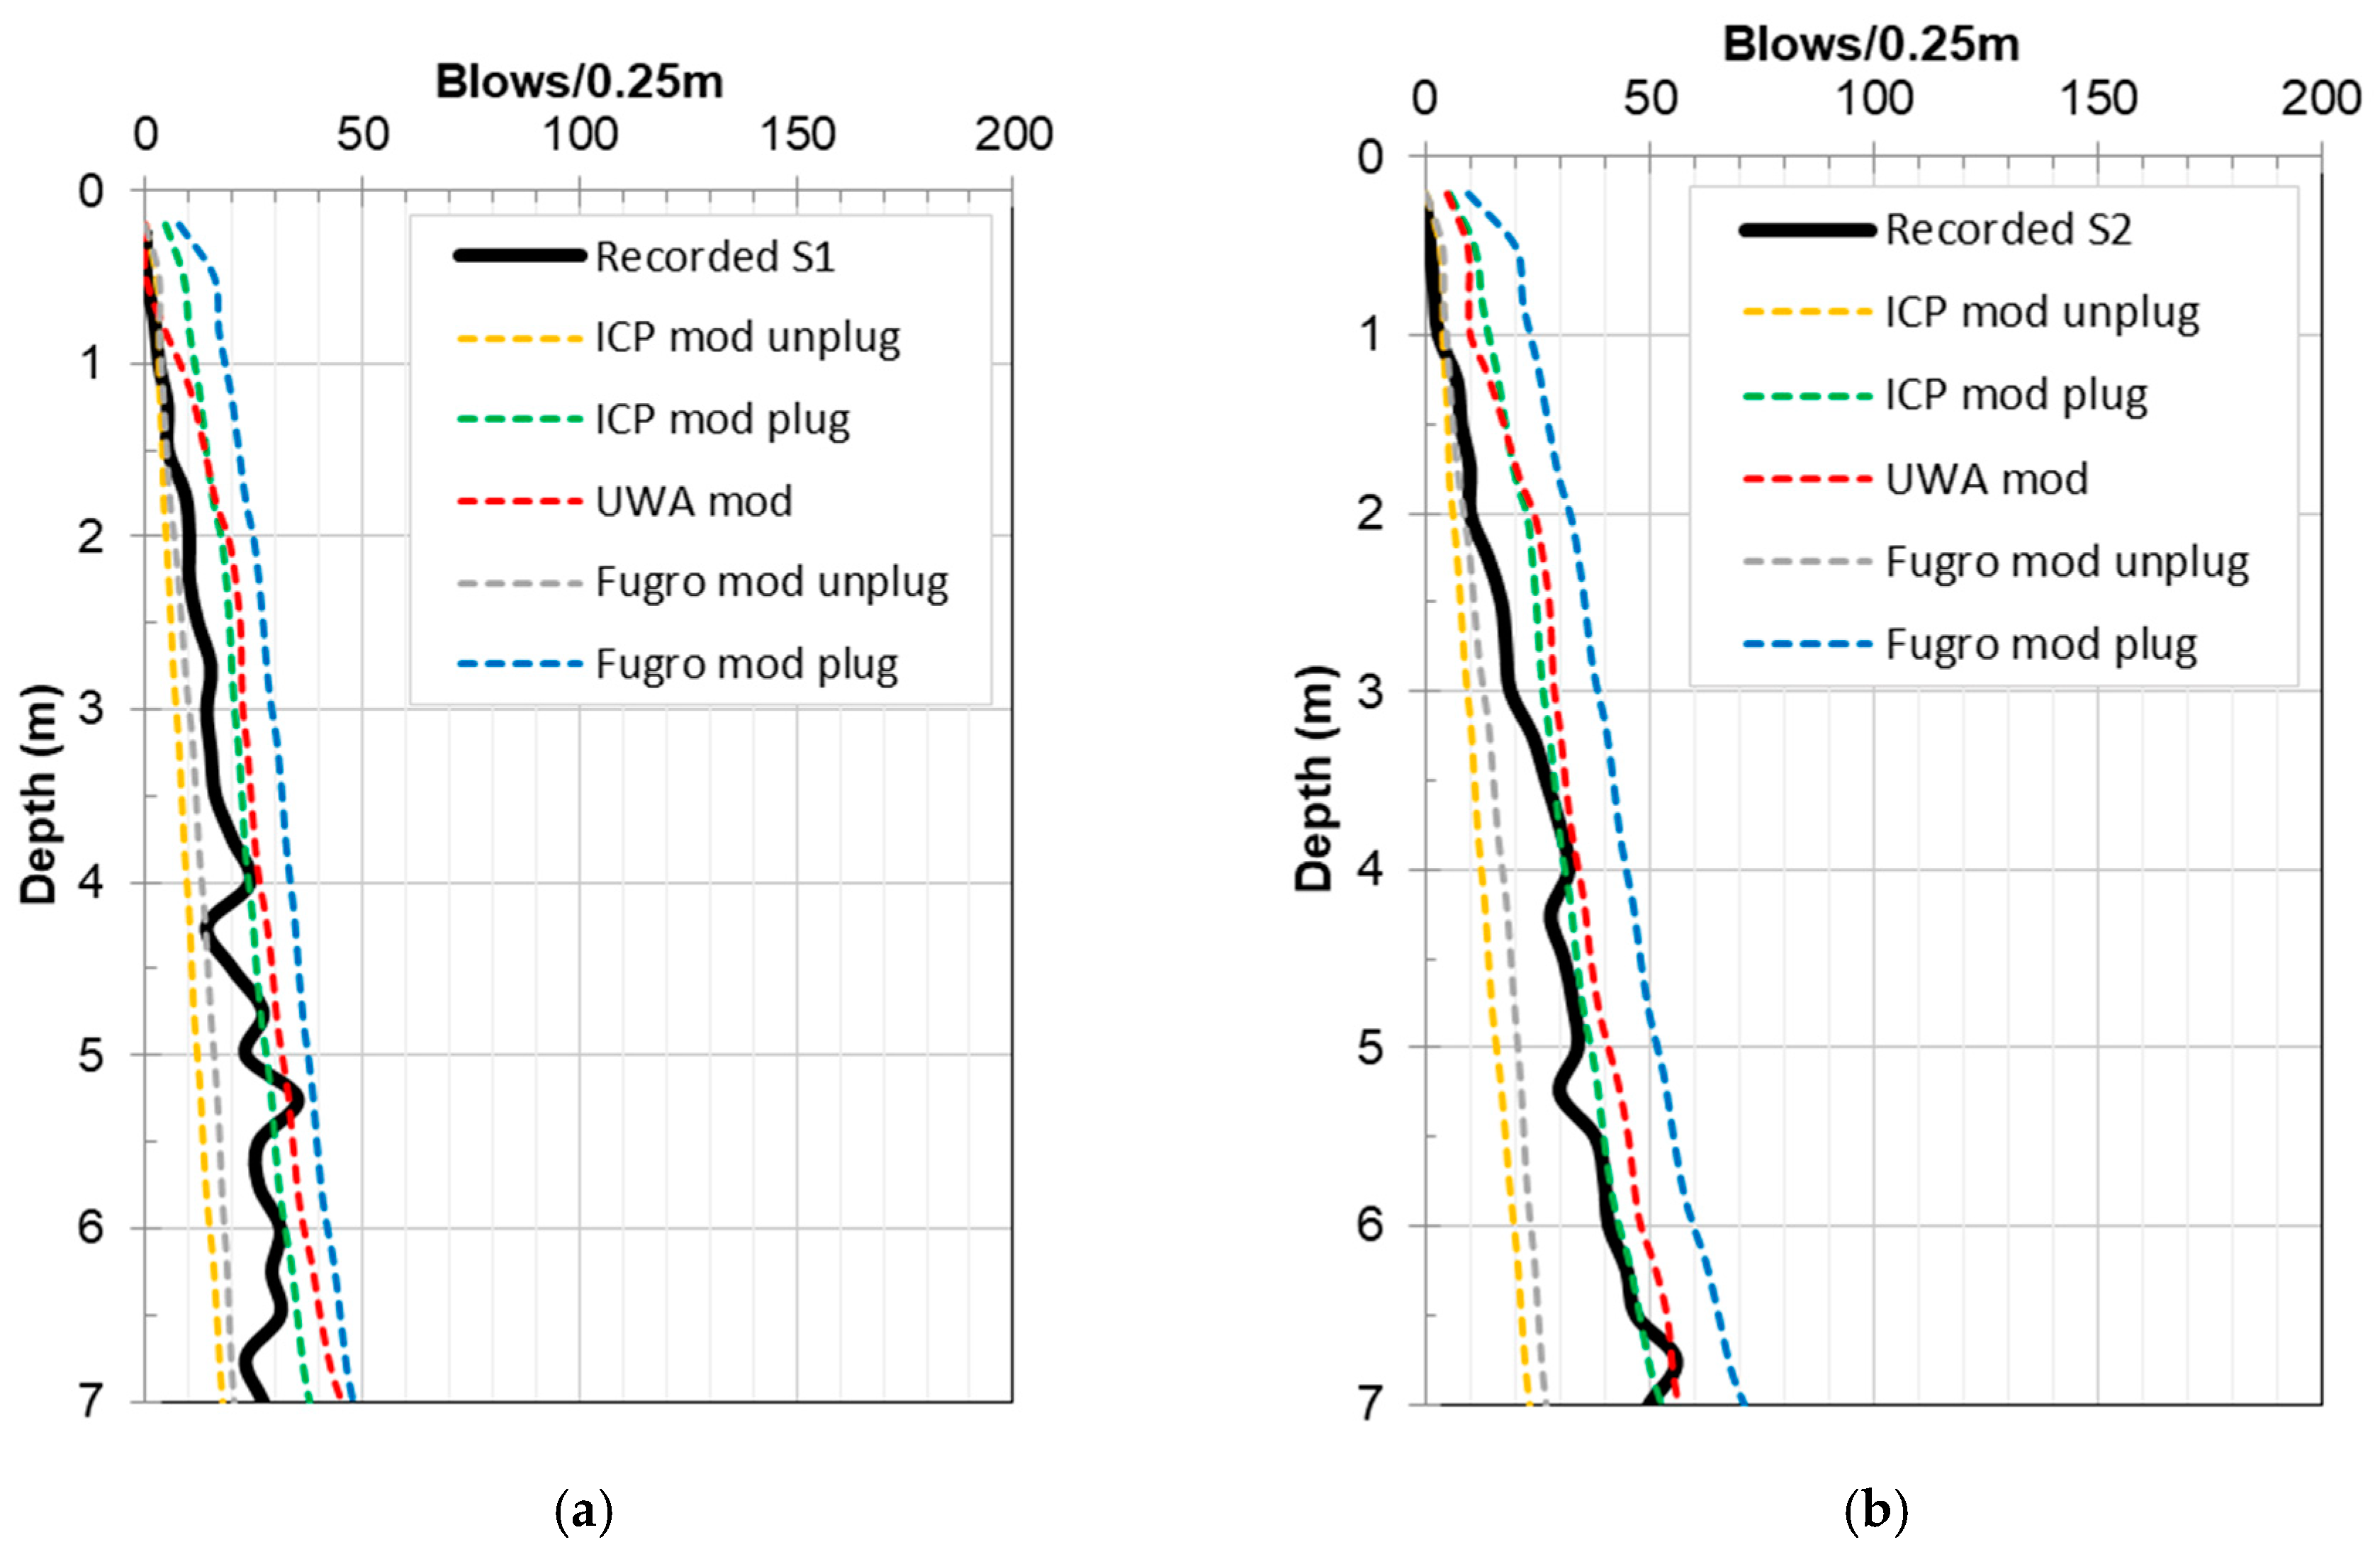
3.2. Comparison of Unmodified CPT-Based Approaches Piles S1 and S2
In this section, the driveability data for piles S1 and S2 are compared to predictions using unmodified CPT-based axial capacity approaches. The approaches are detailed in
Section 2.3. The IC-05, UWA-05 and Fugro-05 methods are applied in their unmodified forms to derive SRD profiles for shaft and toe resistance using the average CPT profile from the site, which are subsequently input into the wave equation analysis software. The friction fatigue effect is incorporated using the pseudo-average shaft friction as detailed in
Section 2.2. For the IC-05 and Fugro-05 approaches, both unplugged and plugged models are used to derive the base resistance since it is not possible to account for partial plugging using these approaches (as experienced by the real piles). Analysing fully plugged or unplugged represents the extreme cases that can be considered. The hammer properties and stroke heights used on the real piles are modelled as closely as possible within the wave equation analysis to ensure a fair prediction in each case. The results are shown in
Figure 6a,b for pile S1 and S2, respectively. These results suggest that the IC-05 and Fugro-05 unplugged models provide a reasonable prediction (though slight under-prediction) whereas the IC-05 plugged model provides a slight over-prediction in estimated blow counts, for both S1 and S2. The UWA-05 and Fugro-05 plugged models appear to over-predict the blow counts required to install the piles. It should be noted that an over-prediction is desireable as it is considered conservative in respect of pile driving. Even though the CPT profiles are relatively uniform across the site, since the average profile is used in the driveability predictions, this is a potential source of some of the disparity evident.
3.3. Comparison of Modified CPT-Based Approaches Piles S1 and S2
In this section, the static capacity approaches from
Section 2.3 are modified to account for the actual base resistance experienced during driving and the influence of pile ageing on the shaft resistance.
Section 2.4 details the modifications adopted. The base resistance estimate for the UWA-05 method is updated by applying a base resistance-settlement model [
16] as discussed in
Section 2.4.2. During pile driving, the pile tip displacement experienced during each blow will be lower than the failure criterion typically adopted by the UWA-05 approach, 0.1D. It is therefore necessary to reduce the estimate of the acting resistance mobilized under each blow. In the present study, the actual displacements for each hammer blow are back-calculated from the blow counts recorded at Blessington. The residual base stresses are initially assumed to be zero. The results of applying the base-settlement model are shown in
Figure 7 for Pile S1 and
Figure 8 for Pile S2.
Figure 7 and
Figure 8 show the base resistance-settlement curves at various depths of the penetration of piles S1 and S2, respectively. Both piles exhibit similar behavior. The initial linear portion of each curve is governed by
Equation (16), which is modelled using the small-strain stiffness properties (
E0) of the deposit. The base resistance value from the UWA-05 approach (
) is used as the limiting resistance when w
b exceeds the failure criterion of 0.1D. The pile tip displacement per blow (averaged into 0.5 m layers) and normalized by the pile diameter (
wb/D) during pile driving is shown as the red dot for each layer of penetration. Almost all normalized displacements per blow in each layer (
wb/D) occur at the second linearized stage of the base settlement-resistance model for both piles.
wb/D values decreased as the blow counts increased at deeper pile penetrations for both piles. The displacement experienced during driving is less than the failure criterion of 0.1D except over the first 1.5 m for pile S1, and 1 m for pile S2, when the piles are fully coring (IFR = 1). The resistance mobilized exceeds the estimate due to the initial soft response (low blow counts) experienced upon initial installation.
In addition to modifying the base resistance to account for the actual mobilized resistance, the influence of pile ageing on the shaft resistance is also incorporated. Based on normalized ageing curves derived from ageing studies, the shaft capacity as derived by each method is reduced to 69% of its value to account for the fact that ageing would have occurred and each of the design approaches was developed based on load tests conducted 10–30 days after installation, see
Section 2.4.1. The driveability results using the modified axial static capacity approaches are shown in
Figure 9a,b for pile S1 and S2, respectively. The IC-05 and Fugro-05 unplugged models both under-predict the blow-counts required to install the piles. In their unmodified form, they provided a closer estimate, as observed in
Figure 6 (though still an under-prediction). The IC-05 plugged models provide a better estimate in their modified form (
Figure 9) than in their unmodified form (
Figure 6). In
Figure 6, the UWA-05 and Fugro-05 plugged models significantly over-predicted the blow-counts, however in their modified form in
Figure 9, they provide a closer prediction. The UWA-05 model in particular provides a much closer estimate, as a result of altering the base resistance to account for the actual mobilized resistance. It is noteworthy that the modified UWA-05 approach slightly over-predicts the blow counts in this paper, whereas when applied to monopiles with larger diameters in Byrne et al. [
1], an under-prediction was observed for the cases considered. As mentioned previously, an over-prediction is considered desirable. Once more, since the SRD were derived from the average CPT profile across the site, this may account for some of the variability in the predictions.
3.4. Incorporation of Residual Base Stresses
The presence of residual base stresses could influence the predicted blow counts required to install piles by changing the proportion of the resistance acting at the base relative to the shaft in the subsequent driveability analyses. The base resistance-settlement model in
Figure 2 allows the incorporation of these potential residual stresses, which are present as a result of the unloading caused between hammer blows. These residual stresses must be overcome under the action of subsequent hammer blows prior to inducing any net downward movement. In this paper, the base resistance-settlement model was applied to the UWA-05 approach to estimate the likely mobilised base resistance under hammer driving. In this section, this estimate is further modified to account for potential residual stresses.
Estimating the amount of residual stress potentially contributing to the resistance is complicated. In this study, the procedure used in Byrne et al. [
1] is adopted, whereby residual stresses were specified as percentages of the CPT
qc value at various depths. Residual base stresses varying from 1% q
c to 10%
qc that are in keeping with values measured during the installation of Pile S6 were added to the toe resistance estimated by the modified UWA-05 approach. The results are shown in
Figure 10a,b for piles S1 and S2, respectively.
For increasing amounts of residual base stress added to the piles, the estimated blow counts required to install the piles increases. Unlike in the study of Byrne et al. [
1], which considered larger diameter monopiles mostly with diameters of 4.2 m, the addition of residual base stresses causes the UWA-05 prediction to deviate away from the measured blow count response. This highlights the uncertainty in the estimation of the influence of residual stresses on the response to driving. It is possible that residual stresses have a greater impact on larger diameter piles, such as those studied in Byrne et al. [
1], than on the pile geometries in the present study. This requires further research to investigate the underlying mechanisms.
4. Parameter Study
In this section, a parameter study is undertaken to highlight the relative importance of the parameters adopted in the wave equation analyses on the resulting predictions. The purpose of this section is to highlight the importance of accurate information to ensure that predictions are as fair as possible for proposed installations of piles.
4.1. Influence of Damping
In a driveability analysis, dynamic forces and viscous rate effects are represented by damping values. These values vary depending on soil type and in general standard values are adopted. However, this parameter can have a relatively large influence on the predicted blow counts, as demonstrated herein. For the UWA-05 method, the prescribed damping values for sand are 0.25 s/m and 0.5 s/m, respectively for skin and toe damping.
Figure 11 shows the results of varying the damping values adopted for the prediction of blow counts for pile S2.
Figure 11a shows the sensitivity of the prediction to variations in skin damping and
Figure 11b shows the sensitivity for variations in toe damping. In both plots, the red lines represent the standard values adopted and is the same data as that presented in
Figure 6b. Changes in toe damping result in a prediction of greater blows than changes in skin damping, highlighting that the dissipation of energy at the base results in a significant increase in the required blows to install a pile. This is not surprising, as the base resistance tends to govern the pile driveability as observed in the previous analyses. The effect of changing the damping parameter is not constant as the pile is driven but leads to increased predicted blow counts for deeper depths. At the final penetration (7 m), an increase of 50% in the skin and toe damping values relative to their nominal specified values (marked as UWA on the plot legends) increases the predicted blow counts by 16% and 22%, respectively. Generally, the blow counts and damping value are positively correlated. Soil damping in the wave equation analysis represents the energy loss within the soil at the pile-soil interface during pile driving, hence it is sensible that higher damping values lead to an increased number of blows to install a pile. This brief study highlights the sensitivity of this parameter to obtaining accurate predictions.
4.2. Influence of Quake
Quake is the term used to describe the displacement required to achieve yield, and standard values for this parameter have been put forward for different soil types [
2,
5,
8,
29]. Increasing the quake value is equivalent to extending the soil elastic displacement range prior to yield. The quake value suggested by the UWA-05 method is 2.5 mm both for the skin and toe.
Figure 12 investigates how quake values influence the predicted blow counts from the wave equation analysis. The data corresponding to unmodified UWA-05 approach applied to pile S2 is used in this analysis, similar to
Section 4.1. Changes in toe quake,
Figure 12b, have a lesser influence on the response than changes in the skin quake,
Figure 12a. Increasing the skin and toe quake by 50% relative to their standard values as prescribed by UWA-05 results in an increase in predicted blow counts for 7 m penetration of 41.5% and 30.5% respectively.
The results of this analysis and that of changing the damping parameters in the previous section suggest that these parameters should really be obtainable based on measurable soil data, and the use of standard values is potentially misleading. Given the large change in prediction caused by changing the damping and quake, this is a potential source of significant disparity between actual pile driving records and predictions made using standard values.
4.3. Influence of Stroke Height and Hammer Efficiency
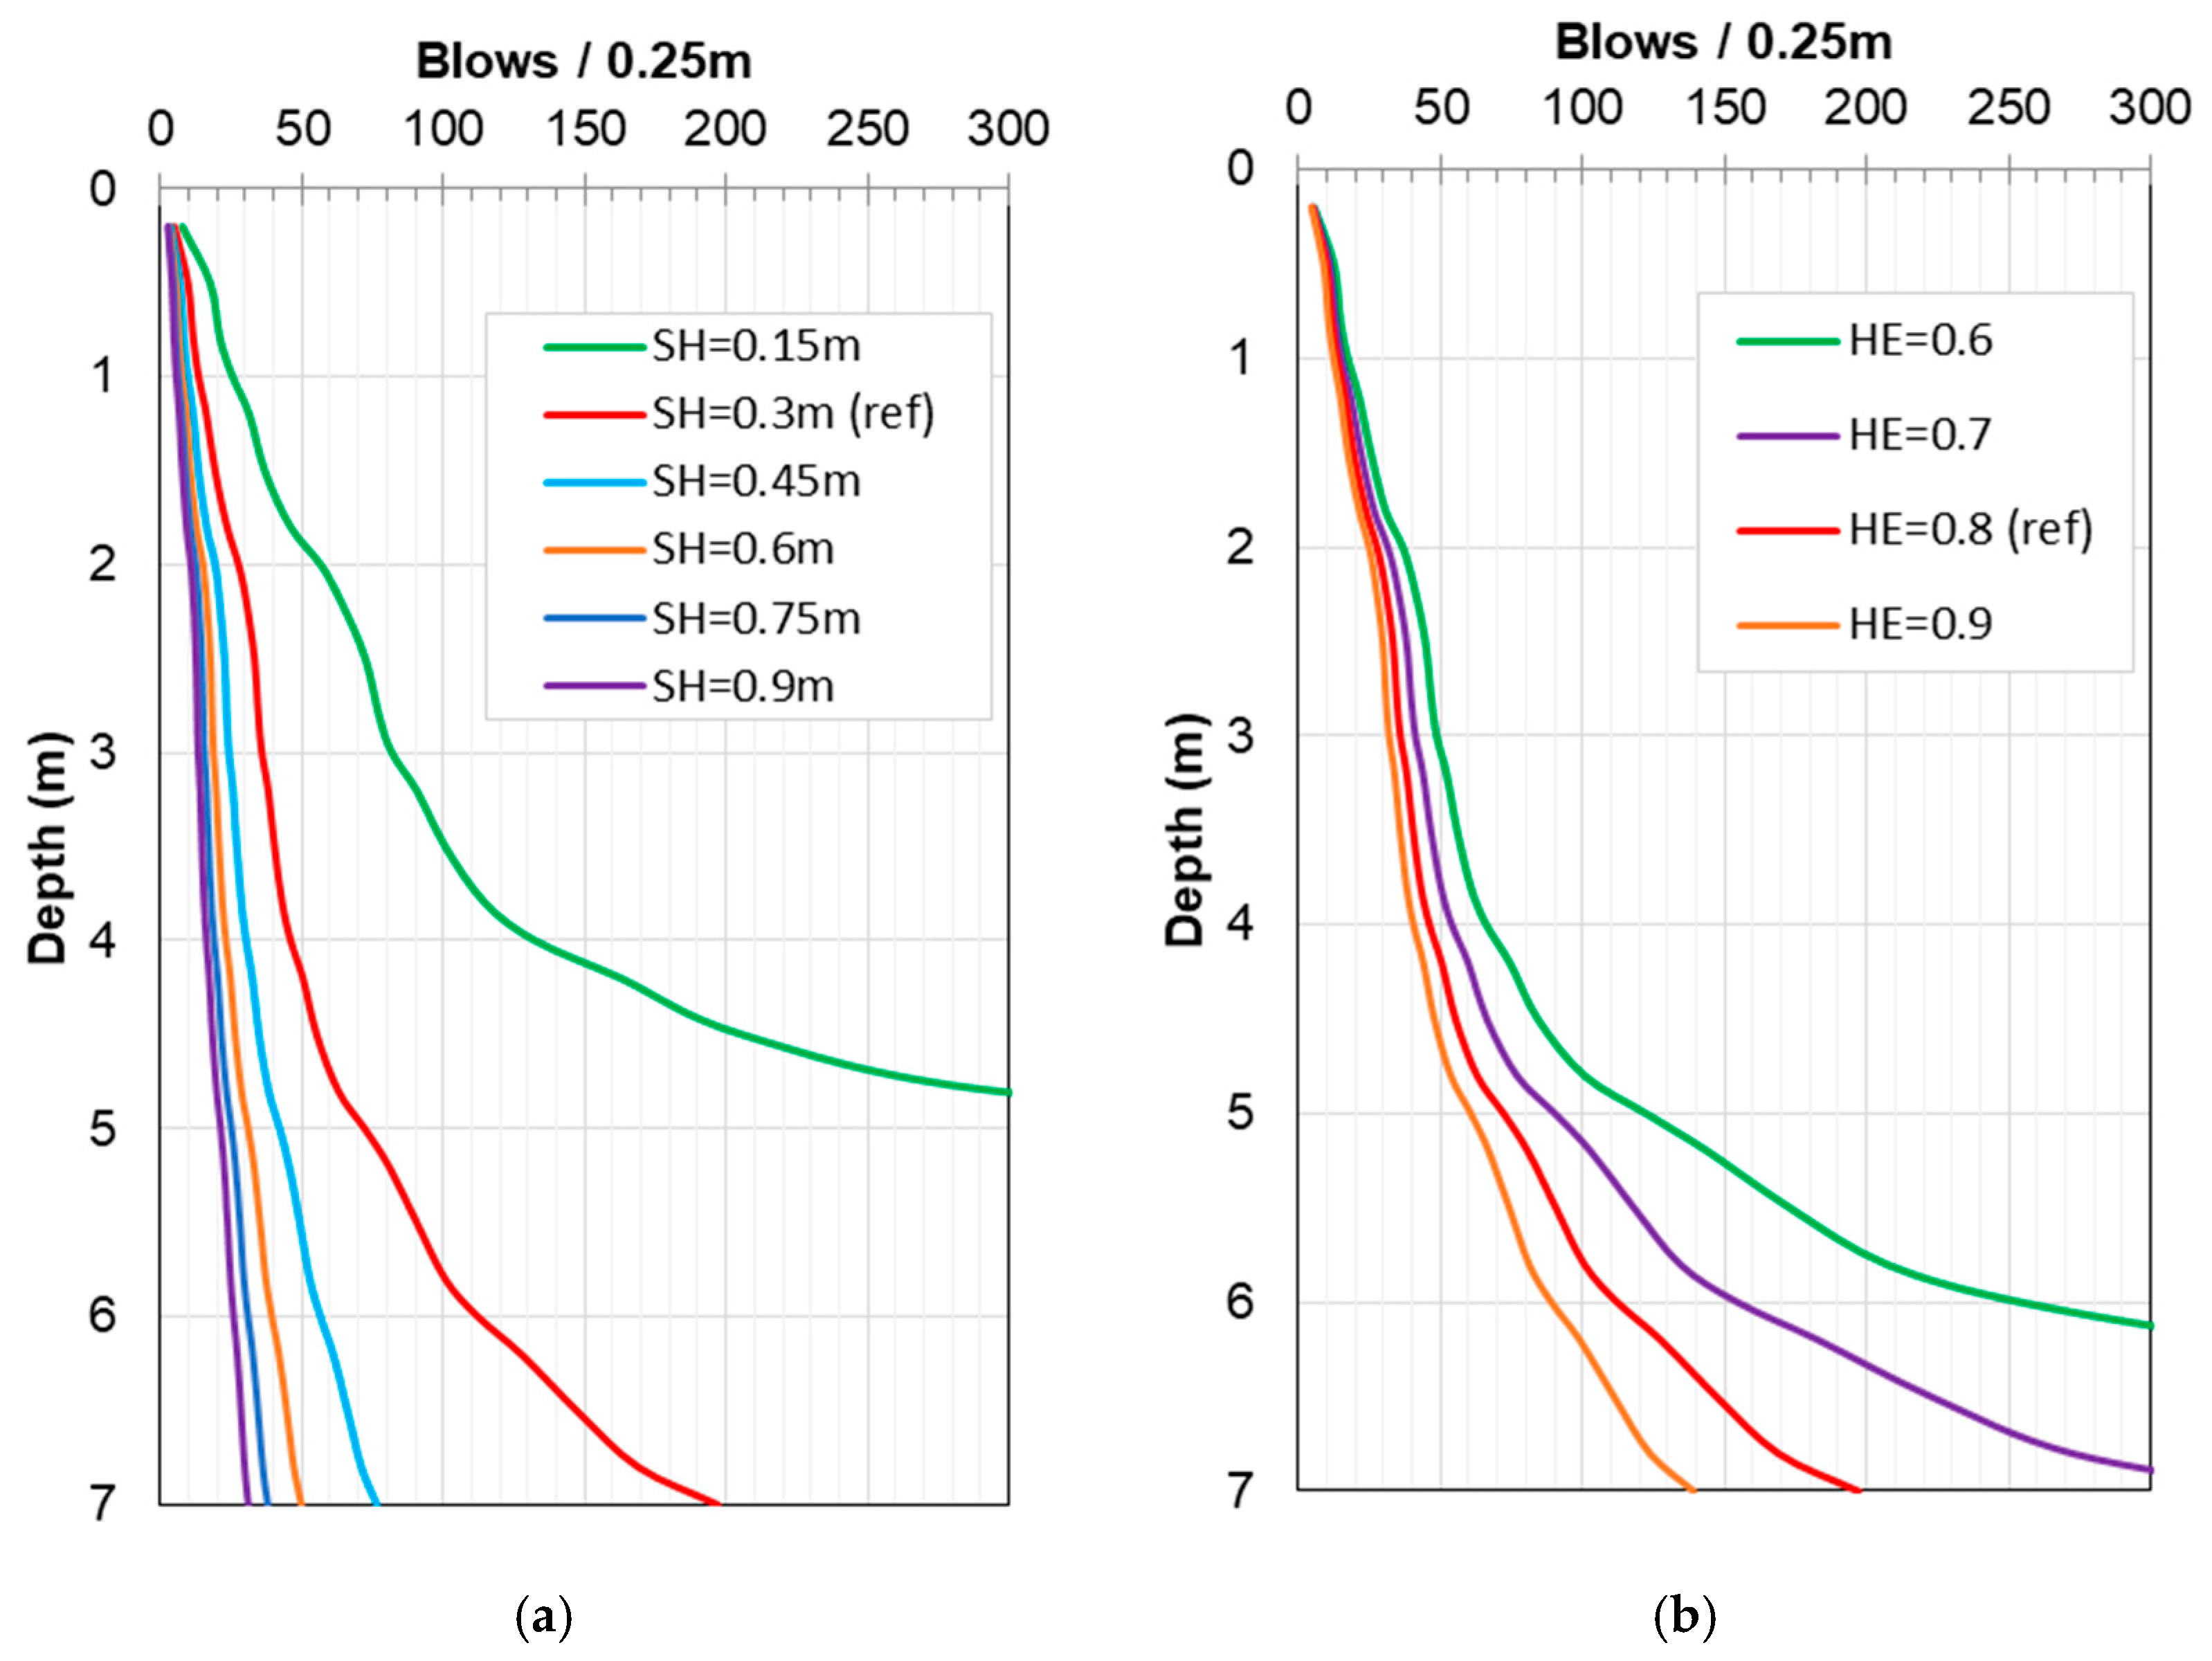
The height of hammer stroke influences the energy applied to drive a pile, and therefore has an impact on predicted blow counts required to drive a pile.
Figure 13 shows the blow counts/0.25 m resulting from varying the hammer stroke height for the analysis using the unmodified UWA-05 approach applied to pile S2. Increasing the stroke height decreases the predicted blows required to install the pile. The estimated blow counts at the final pile penetration decreases by 61% when the hammer stroke height is increased from the value used (0.3 m) by 50% to 0.45 m. This suggests a significant sensitivity to the stroke height used and highlights the importance of accurately measuring this parameter on site to ensure the predictions made are sensible and reasonable. Other changes in stroke height and their influence on the predicted results can be seen in
Figure 13a. It is important to note that installing a pile with excessive energy can lead to pile damage, whereas driving a pile using a low stroke height can lead to premature refusal. Pile stresses should be explicitly analyzed when proposing changes to hammer stroke height.
Hammer efficiency accounts for the energy losses that cannot be calculated directly during the pile driving process. The standard value of the hammer efficiency depends on the type of hammer adopted. The installation of pile S2 at the Blessington site used a hydraulic impact hammer, which has an efficiency value of 0.8 according to the recommendations of the pile driveability analysis software manual [
18].
Figure 13b shows that increasing hammer efficiency results in lower predicted blow counts required to install a pile. This mainly influences the predicted blow counts at depth where differences in efficiency have a larger influence on the predicted results overall. A 10% reduction in efficiency (from 80% to 70%) results in a 76% increase in the predicted blow counts required at a penetration depth of 7 m. Changes in hammer efficiently have the largest influence on the results out of the various parameters investigated in this section, highlighting the paramount importance of accurately estimating this parameter.
5. Conclusions
In this paper, an investigation of the applicability of CPT-based axial static capacity approaches for piles to estimating pile driveability is conducted. Specifically, the study investigates various factors that can influence the prediction of pile driveability, and how these factors affect the prediction of the blow counts required to install a pile. The results of field tests on open ended steel piles driven at Blessington, Ireland) are used to appraise the methods postulated.
Three CPT-based axial capacity methods are investigated, namely the IC-05, UWA-05 and Fugro-05 approaches. The methods are applied in their unmodified form and with appropriate modifications to match deviations in the expected behavior during driving as opposed to under static loading. Modifications include changing the base resistance estimate proposed in the UWA-05 approach, incorporating the influence of ageing (capacity increases over time), which require a reduction in shaft capacity to account for the lower shaft resistance mobilized during installation, and assessing the influence of residual base stresses. Installation-related data (blow counts) measured from two field piles installed at Blessington are used. For the unmodified approaches, the IC-05 and Fugro-05 unplugged models provide a reasonable prediction of the blow counts with some under-prediction, whereas the IC-05 plugged model slightly over-predicts the blow counts. For the modified approaches, the IC-05 and Fugro-05 unplugged models further under-predict the blow counts than their unmodified counterparts. The IC-05 plugged model, on the other hand, provides a better estimate in its modified form than its unmodified form. The modified UWA-05 approach provides a substantially closer estimate in its modified form than unmodified, as a result of altering the base resistance to be more in keeping with the actual expected mobilization under hammer impacts. However, it leads to a slight over-prediction in the blow counts for both piles, which contradicts the findings of a previous study (albeit this previous study was on larger diameter piles). Furthermore, the incorporation of residual base stresses with the modified UWA-05 approach cause a further deviation in the predicted response, suggesting these might not be so critical for smaller diameter piles than evident in studies on larger diameter piles conducted previously.
Finally, a parametric study is conducted where the parameters used in the wave equation analysis are varied to assess their relative influence on predicted blow counts. The data from the unmodified UWA-05 prediction for pile S2 are used and the quake, damping, stroke height and hammer efficiency parameters are varied. Results suggest that hammer efficiency has the largest influence on the predicted results highlighting the importance of accurate characterization of this information for use in driveability analyses.
The present study has investigated the various acting components contributing to pile driveability analyses, and has highlighted the complex and inter-related nature of the various parameters governing the predicted response. The eventual goal could be to derive a pile driveability approach based directly on an empirical correction to CPT data, without the requirement for estimating residual stresses, damping and quake data, or even without the need to undertake a wave equation analysis. It is anticipated that this would be a significant challenge, however it would solve the issue that, at present, there are potentially too many variables contributing to the response. The ability to obtain a fair estimate of pile driveability remains a challenge.
Author Contributions
Conceptualization, K.G.; methodology, L.J.P.; software, P.G.; validation, P.G., K.G. and L.J.P.; formal analysis, P.G.; investigation, P.G., K.G. and L.J.P.; resources, K.G.; data curation, K.G.; writing—original draft preparation, L.J.P. and P.G.; writing—review and editing, K.G.; visualization, P.G.; supervision, L.J.P. and K.G.; project administration, K.G.; funding acquisition, K.G. All authors have read and agreed to the published version of the manuscript.
Funding
This research received no external funding.
Acknowledgments
Gandina’s work is a development of the earlier work by Tiernan Byrne whose contribution is acknowledged together with members of the Geotechnical Research Group formerly at University College Dublin for testing, data acquisition, software and organization. The first author wishes to acknowledge the Faculty of Engineering, University of Nottingham, for travel funding to enable this collaboration.
Conflicts of Interest
The authors declare no conflict of interest.
References
- Byrne, T.; Gavin, K.; Prendergast, L.J.; Cachim, P.; Doherty, P.; Pulukul, S.C. Performance of CPT-based methods to assess monopile driveability in North Sea sands. Ocean Eng. 2018, 166, 76–91. [Google Scholar] [CrossRef]
- Schneider, J.; Harmon, I. Analyzing drivability of open ended piles in very dense sands. J. Deep. Found. Inst. 2010, 4, 32–44. [Google Scholar] [CrossRef]
- Wu, W.H.; Prendergast, L.J.; Gavin, K. An iterative method to infer distributed mass and stiffness profiles for use in reference dynamic beam-Winkler models of foundation piles from frequency response functions. J. Sound Vib. 2018, 431, 1–19. [Google Scholar] [CrossRef]
- Prendergast, L.J.; Wu, W.H.; Gavin, K. Experimental application of FRF-based model updating approach to estimate soil mass and stiffness mobilised under pile impact tests. Soil Dyn. Earthq. Eng. 2019, 123, 1–15. [Google Scholar] [CrossRef]
- Stevens, R.; Wiltsie, E.; Turton, T. Evaluating drivability for hard clay, very dense sand, and rock. In Proceedings of the Offshore Technology Conference, Houston, TX, USA, 3–6 May 1982. [Google Scholar]
- Toolan, F.E.; Fox, D.A. Geotechnical planning of piled foundations for offshore platforms. Proc. Inst. Civ. Eng. 1977, 62, 221–244. [Google Scholar] [CrossRef]
- Semple, R.; Gemeinhardt, J. Stress history approach to analysis of soil resistance to pile driving. In Proceedings of the Offshore Technology Conference, Houston, TX, USA, 4–7 May 1981. [Google Scholar]
- Alm, T.; Hamre, L. Soil model for pile driveability predictions based on CPT interpretations. In Proceedings of the International Conference on Soil Mechanics and Geotechnical Engineering, Istanbul, Turkey, 27–31 August 2001; pp. 1297–1302. [Google Scholar]
- Jardine, R.J.; Chow, F.C.; Overy, R.F.; Standing, J. ICP Design Methods for Driven Piles in Sands and Clays; Institution of Civil Engineering (ICE): London, UK, 2005. [Google Scholar]
- Lehane, B.; Schneider, J.; Xu, X. The UWA-05 method for prediction of axial capacity of driven piles in sand. In Proceedings of the International Symposium on Frontiers in Offshore Geotechnics, Perth, Australia, 19 September 2005. [Google Scholar]
- Jardine, R.; Standing, J.; Chow, F. Some observations of the effects of time on the capacity of piles driven in sand. Geotechnique 2006, 55, 227–244. [Google Scholar] [CrossRef]
- Gavin, K.; Kirwan, L.; Igoe, D. The effect of ageing on the axial capacity of piles in sand. Proc. Inst. Civ. Eng. Geotech. Eng. 2013, 166, 122–130. [Google Scholar] [CrossRef]
- Karlsrud, K.; Jensen, T.G.; Lied, E.K.W.; Nowacki, F.; Simonsen, A.S. Significant ageing effects for axially loaded piles in sand and clay verified by new field load tests. In Proceedings of the Offshore Technology Conference, Houston, Texas, USA, 5–8 May 2014. [Google Scholar]
- Kirwan, L. Investigation into Ageing Mechanisms for Axially Loaded Piles in Sand. Ph.D. Thesis, University College Dublin, Dublin, Ireland, 2015. [Google Scholar]
- Gavin, K.; Jardine, R.J.; Karlsrud, K.; Lehane, B.M. The effects of pile ageing on the shaft capacity of offshore piles in sand. In Proceedings of the International Symposium Frontiers in Offshore Geotechnics (ISFOG), Oslo, Norway, 10–12 June 2015. [Google Scholar]
- Gavin, K.; Lehane, B. Base load–displacement response of piles in sand. Can. Geotech. J. 2007, 44, 1053–1063. [Google Scholar] [CrossRef]
- Xu, X. Investigation of the End Bearing Performance of Displacement Piles in Sand. Ph.D. Thesis, The University of Western Australia, Perth, Western Australia, Australia, 2007. [Google Scholar]
- Pile Dynamics GRLWEAP Software Brochure. 2010. Available online: http://www.pile.com/wp-content/uploads/2020/05/PDI-GRLWEAP-Brochure.pdf (accessed on 1 June 2020).
- Kolk, H.J.; Baaijens, A.E.; Senders, M. Design criteria for pipe piles in silica sands. In Proceedings of the First International Symposium on Frontiers in Offshore Geotechnics, Perth, Australia, 19 September 2005. [Google Scholar]
- Lehane, B.M.; Lim, J.K.; Carotenuto, P.; Nadim, F.; Lacasse, S.; Jardine, R.; van Dijk, B.F.J. Characteristics of Unified Databases for Driven piles. In Proceedings of the 8th International Conference of Offshore Site Investigation and Geotechnics OSIG, London, UK, 12–14 September 2017. [Google Scholar]
- Gavin, K.; Igoe, D. A field investigation into the mechanisms of pile ageing in sand. Geotechnique 2019. [Google Scholar] [CrossRef]
- Donohue, S.; Long, M.; Gavin, K.; O’Connor, P. Shear wave stiffness of Irish glacial till. In Proceedings of the International Conference of Site Characterisation ISC-2, Porto, Portugal, 19–22 September 2004; pp. 459–466. [Google Scholar]
- Prendergast, L.J.; Hester, D.; Gavin, K.; O’Sullivan, J.J. An investigation of the changes in the natural frequency of a pile affected by scour. J. Sound Vib. 2013, 332, 6685–6702. [Google Scholar] [CrossRef]
- Robertson, P. Soil classification using the cone penetration test. Can. Geotech. J. 1990, 27, 151–158. [Google Scholar] [CrossRef]
- Schnaid, F.; Lehane, B.M.; Fahey, M. In situ test characterisation of unusual geomaterials. In Proceedings of the International Conference of Site Characterisation, Porto, Portugal, 19–22 September 2004; pp. 49–73. [Google Scholar]
- Paik, K.; Salgado, R.; Lee, J.; Kim, B. Behavior of open- and closed-ended piles driven into sands. J. Geotech. Geoenviron. Eng. 2003, 296–306. [Google Scholar] [CrossRef]
- Alawneh, A.S.; Malkawi, A.I.H. Estimation of post-driving residual stresses along driven piles in sand. Geotech. Test. J. 2000, 23, 313–326. [Google Scholar]
- Lunne, T.; Robertson, P.K.; Powell, J.J.M. Cone Penetration Testing in Geotechnical Practice; Blackie Academic and Professional: London, UK, 1997. [Google Scholar]
- Hirsch, T.J.; Carr, L.; Lowery, L.L. Pile driving analysis-wave equation user manual. In TTI Programme -Final Report; Federal Highway Administration (FHWA): Washington, DC, USA, 1976; Volume I–IV. [Google Scholar]
© 2020 by the authors. Licensee MDPI, Basel, Switzerland. This article is an open access article distributed under the terms and conditions of the Creative Commons Attribution (CC BY) license (http://creativecommons.org/licenses/by/4.0/).


