Article

Revisiting Electricity Network Tariffs in a Context of Decarbonization, Digitalization, and Decentralization

by
Nicolás Morell Dameto
*,
José Pablo Chaves-Ávila
and
Tomás Gómez San Román
Institute for Research in Technology (IIT), ICAI School of Engineering, Comillas Pontifical University, 28015 Madrid, Spain
*
Author to whom correspondence should be addressed.
Energies 2020, 13(12), 3111; https://doi.org/10.3390/en13123111
Submission received: 30 April 2020 / Revised: 10 June 2020 / Accepted: 11 June 2020 / Published: 16 June 2020
(This article belongs to the Section C: Energy Economics and Policy)

Abstract

:
The electricity system is evolving due to three driven forces: decarbonization, digitalization, and decentralization (3 Ds). Should these three forces occur, electricity network tariffs must be revisited. In most countries, actual network charges incentivize inefficient network usage when volumetric or low granular (temporal and locational) charges are applied. This paper analyses the effect of 3 Ds on tariff design principles and proposes an efficient methodology for network tariff design that promotes efficient usage of the network as well as an equitable share of the costs for network users. The proposed network tariff consists of two components: a peak-coincident and a fixed charge. The peak-coincident forward-looking charge considers the cost of future network reinforcements required, calculated element-by-element, and assigned to customers during the peak utilization hours of each network element. Fixed charges allocate the residual part of the total network costs following equity principles. A simplified network model is used to compare the charges faced by consumers through three tariff structures: (1) a volumetric tariff, (2) a simplified version of the Spanish tariff, and (3) the proposed efficient tariff. This case study highlights the economic benefits of applying a highly granular and peak-coincident tariff structure.

Graphical Abstract

1. Introduction

Traditionally, electricity tariffs have evolved in parallel with the organization and regulation of electricity systems. This ranges from integral tariffs based on bundled services and costs under the paradigm of vertically integrated utilities, regulated as monopolies, to deregulation and markets, with a separation between energy as a commodity traded in competition and regulated tariffs to allocate transmission and distribution costs from monopolistic activities and other regulated costs [1]. Nowadays, electricity systems are facing new evolutions derived from three major drivers—digitalization, decarbonization, and decentralization—that again are bringing a need to rethink electricity system regulation, together with organizational and business models. These changes, in the following referred to as 3 Ds, are also challenging traditional electricity tariffs that need to be revised with the aim of continuing to promote technical and economic efficiency for the system and achieving a fair and equitable share of costs and charges allocated to customers.
In this context, this paper is focused on revisiting the design of network charges and how this design is affected by the 3 Ds transformation. Another relevant discussion is how the allocation of other regulated charges and the overall market design under 3 Ds should be rethought, but this issue is out of the scope of this paper.
Before the liberalization of the electricity sector, initiated in the European Union in 1996, the allocation of bundled system costs corresponding to each vertically integrated utility was made according to simple rules that shared these costs among different customer categories based mainly on their energy consumption. Electricity was generated by centralized producers, transported by unidirectional flows through the grid, and consumed by the end users. For such system configurations, flat and volumetric tariffs were the easiest way to recover regulated costs. The higher your consumption was, the higher your contribution to system costs and payments was [2].
However, under the new 3 Ds paradigm, the proportionality between energy consumption and system cost contribution is no longer valid, and tariff design principles and practices are a key issue that needs to be revisited.
Decentralization is putting consumers at the center of this energy system transformation. New technologies are available directly at the premises of end users for changing the way they consume, self-produce, or store their energy requirements. These technologies are among others, (1) thermostatically controlled loads, (2) distributed renewable generation, (3) energy storage, (4) electric vehicles (EVs), and (5) smart meters, together with ICT. Decentralization allows end users to become active participants in the electricity market. Current electricity tariff designs are not updated to cope with these changes, provoking distorting effects in the efficiency of the system and distributional and non-equitable effects on some categories of end users. For example, volumetric tariffs currently applied to recover network costs are over-incentivizing end users to install distributed generation (DER) netting their energy consumption. While this effect reduces network fees paid by DER owners, network system costs are not equally reduced. Thus, regulators have to increase, in the next tariff review, network volumetric charges to fully recover network costs. Those users who did not install DERs then face higher rates for the same electricity consumption, so they are further encouraged to invest in DER. According to several authors, this reality makes the redesign of tariff structures indispensable [3,4,5].
Decentralization and digitalization are driving this transformation. The deployment of smart meters in some EU countries with 100% penetration, including for small residential consumers, in combination with new communication technologies, enables consumers to respond to electricity prices and regulated tariffs with higher temporal and spatial granularity. If these economic signals are cost-reflective, this will create savings for the consumers and for the whole system. The tariff redesign should take into account the new opportunities for efficient customer behavior offered by digitalization [4]. Digitalization implies a large-scale deployment of not only metering but also actuators and controllers, at a low voltage level. In addition, digitalization allows the emergence of new business models for aggregators where joining the response of thousands of consumers can provide system services, i.e., through flexibility markets, allowing the participation of small consumers in providing flexibility services to transmission and distribution system operators [6,7].
In parallel to the aforementioned innovative technologies, climate change is one of the most important global challenges for this century and will drastically change the way we produce and consume electricity. Efforts to limit the global temperature rise, as agreed internationally with the Paris agreement in 2015 [8], translate into rigid CO2 emission reduction targets in the European Union. By 2030, 32% of all energy consumption within the EU shall be from renewable sources [9]. Electricity tariff design is affected by those environmental and energy policies that may involve additional costs that would be allocated to, among others, electricity consumers; i.e., renewable subsidies in many EU countries account today for a major share of the policy costs in electricity bills [10]. Another important issue, which is not discussed in this paper, is how to allocate costs derived from these political decisions among users.
This paper first presents a literature review on previous work that has addressed the need for revisiting some of the aspects of electricity tariff design due to the new challenges presented by the 3 Ds transformation. Second, it presents a comprehensive proposal on how the principles of economic efficiency, equity, and transparency should be applied in the new context. Third, it presents a methodology for tariff design consisting of three sequential steps: (1) cost segmentation and identification of cost drivers, (2) definition of categories of network users and charging variables, and (3) fixing the locational and temporal granularity of charges. This methodology is applied to design network tariffs, but it can also be applied to policy charges, which need specific development.
The implications of this paper’s findings are highly relevant for all stakeholders in electricity systems. This work can serve academia, distribution system operators, regulators and policy makers as input for designing electricity tariffs ensuring an economically efficient and equitable cost allocation.
The main contributions of this paper are (1) a discussion and recommendations of principles that should be followed in designing network tariffs in this new 3 Ds context, with active consumers responding to price signals and potentially playing in the market providing services to the system; (2) a new methodology for the allocation of network costs, which divides network costs into incremental and residual costs (for the allocation of incremental network costs, highly granular (both temporal and locational) charges are applied), and (3) a newly developed mathematical model that demonstrates the benefits of this network cost allocation methodology by comparing it with other often-used tariff structures.
In Section 2, a critical review highlights the principles of electricity tariff design and evaluates how they are affected by the 3 Ds. Section 3 presents a methodology for tariff design derived from revisited principles, implemented for the allocation of network costs, resulting in a tariff structure proposal. Section 4 presents a practical case study to illustrate the proposed tariff design. Concluding remarks are presented in Section 5.

2. Principles for Tariff Design

Generally speaking, cost recovery is the main principle guiding any tariff design. However, the aim of tariff design is not only to ensure cost recovery but also to lead the system to a higher technical and economic efficiency in the short and the long term, promoting customers’ efficient usage of the network. In addition, charges should be fair and equitable among customer categories and non-discriminatory between customers that use the service in the same way. A general consensus exists in the literature on the regulatory principles that electricity rates should follow: economic efficiency, equity, and transparency [11,12,13].
Beyond principles definition, some authors identify measurable objectives to quantify how these principles are explicitly formulated or can be fulfilled. In the following, these objectives are identified and discussed for each one of the aforementioned principles:
Economic efficiency: goods or services should be consumed by whoever benefits most from them [1]. The aim of this principle is the maximization of social welfare, and the main objective derived from this principle is the total system cost minimization. Not only short-term but also long-term system costs should be minimized. One way to incentivize system cost minimization, in terms of network costs, is by sending efficient economic signals to network users that encourage their response to produce efficient network usage [14].
Behind the principle of economic efficiency, several objectives in tariff design can be derived:
  • Cost reflectivity: electricity tariffs reflect the costs of delivering the service, recognizing that electricity costs may vary by time, location, and supplied quality [15]. Additional objectives related to economic efficiency and, in some sense, ingredients for cost reflectivity are the following:
    Cost additivity: tariffs are formed by aggregating different cost categories or items up to reflect the total system costs.
    Symmetry: costs that depend on consumption and injection of energy or power are charged/rewarded following the same methodology within the chosen locational and time granularity.
    Robustness against consumer aggregation: costs that do not change depending on whether consumption is aggregated or individualized per consumer should not be charged differently to the aggregation of consumers than to individual consumers.
  • Predictability: in the short term, how precisely consumers can estimate ex-ante the amount they will be charged. In the long term, predictability of tariffs and their methods of calculation provides regulatory certainty to users.
  • Technology neutral: tariffs should be agnostic to the particular activities for which electricity is used by network users or to the technology used to withdraw or inject energy into the grid [1].
  • Minimization of cross-subsidies: one consumer’s actions should not negatively impact other consumers’ charges.
Equity: the equity principle has many interpretations. This principle can be split into specific subprinciples [13], defined as allocative equity, distributional equity, and transitional equity.
  • Allocative equity: identical network usages are charged equally. Identical network usage refers to comparable location and consumption patterns, regardless of payer nature, energy final usage, or appliances behind the meter [1,13].
  • Although allocative equity is a consideration of the equity principle, its implications are completely aligned with the economic efficiency principle. For example, as explained in [13], one of the main implications of allocative equity is that marginal consumption/production should be charged/paid according to the marginal cost/value it creates. This can be assumed as cost reflectivity and, therefore, would conduce to a more efficient system.
  • Distributional equity: charges should be proportional to the economic capability of each user. This is critical when allocating residual costs to vulnerable consumers [13,16]. Residual costs are those costs that have no cost driver, and cannot be recovered following economically efficient signals, as further defined in Section 3. This implication directly grapples with economic efficiency principles.
  • Transitional equity: a transition from an old to a new tariff scheme should be gradually implemented.
Transparency and simplicity: the publication and explanation of the tariff design methodology is the only mechanism available to verify whether and to what degree the other principles and objectives are being fulfilled [13].
Related to transparency, simplicity implies that tariffs are easy to understand for the vast majority of the population in order to facilitate comprehension and acceptance among system users [17].
There is a consensus that simultaneously meeting all principles and objectives in one specific tariff design is a difficult task, as principles generate conflicts among themselves. For example, the equity principle sometimes limits economic efficiency [1,14]. Some authors, like Schittekatte [18], provide a quantitative model to compare different tariffs in terms of economic efficiency and equity. This model aims to identify the most balanced network tariff designs in terms of fulfilling the different principles.

2.1. Revisiting Principles of Tariff Design under the 3 Ds

As has been commented, the 3 Ds impose the need of revisiting how the explained principles are fulfilled by traditional tariff designs and how these designs should be adapted to the new situation.

2.1.1. Digitalization

Since digital measurements, computing power, and data transfer have been enormously enhanced, there exists the opportunity to define more cost-reflective granular tariff categories with higher locational and temporal discrimination. The outcome would be, in general, a more complex multi-part tariff structure. Note that multi-part tariffs contain more than one term: for instance, a charge per energy (€/kWh), a charge per demand (€/kW month), and a charge per connection (€/customer). Regarding retail markets, retailers are responsible for translating regulated tariffs together with the commodity cost and retail margins into final prices. Retailers would find value in creating simplified final prices that can be easily understood by residential or small consumers with little capacity for becoming active consumers. In addition, retailers will opt for offering more sophisticated final prices where they find a value in getting the flexibility from active consumers.
In addition, digitalization brings opportunities for increasing traceability and transparency of information signaling, where the different charges come from following the application of transparent methodologies for cost allocation.
For instance, through the development of apps displaying market prices and signaling system operation conditions, active consumers (or customer aggregators) will respond by modifying their consumption patterns, creating a higher system efficiency.
A deeper knowledge of customer consumption patterns—provided by smart meter data—and its relationship with income variables enables better customer segmentation and granularity, allowing the design of more equitable tariffs.

2.1.2. Decarbonization

Recent studies [19] foresee that ambitious decarbonization policies imposing higher penetration targets for renewable generation in the electricity system will need some sort of additional price support, over the market price, to ensure investment recovery to RES promoters. Depending on the market designs, the extra cost of support mechanisms for RES can be allocated to final customers as a regulated cost to be recovered through the tariff.
Increasing the burden of supporting renewables or other environmental policies in the tariff could have an effect on cross-subsidies among consumers, especially when volumetric charges are applied to recover those costs [20].
Additionally, decarbonization of the energy system also includes the electrification of other vectors, like gas for cooling/heating appliances and transportation through electric vehicles [21]. Electricity tariffs may also support or at least not be an obstacle to these objectives, always preserving the main principles of economic efficiency and equity.
In addition, with ambitious RES targets, a higher locational granularity applied to network charges and connection charges—a one-off charge for a new grid connection that at least includes the cost of extension of the existing grid—is needed to provide cost reflectivity and efficiency for the connection of new renewable sources to the system.

2.1.3. Decentralization

Experience demonstrates that net-metering volumetric tariffs incentivize customers to install distributed renewable generation behind the meter, mainly as solar photovoltaics (PV). As a consequence, active consumers—customers installing PV—avoid paying a portion of regulated costs, while the rest of consumers bear these costs [16]. New tariff designs should avoid non-cost-reflective inefficient economic signals for the installation of self-generation technologies, such as PV, that provide more benefits for the owner than for the electricity system at the expense of a cross-subsidization effect by the rest of the consumers.
The side effect of providing hidden incentives, through tariff design, to decentralized technology solutions, may impose cost recovery difficulties, and consequent rises in the following period in electric tariffs, affecting the principles of stability and predictability [17].
Furthermore, a level playing field should be built for both centralized and decentralized energy resources. In other words, tariffs should send efficient economic signals to invest in the most beneficial technology for the system, regardless of its technology or use [21].
Research projects and literature refer to active customers—with PV, demand response, batteries, and/or EV—as flexibility providers to the grid, improving grid efficiency [4,22,23]. At the same time, distributed generation is able to improve system reliability since system failures can be compensated with local resources. These implications could lead to new approaches to grid services valuation, including some charges for the reliability of services or promoting new markets such as local flexibility markets [22]. In this context, the tariff design should not become an obstacle for active consumers to provide the aforementioned system services.
An extreme case of decentralization occurs when a consumer decides to completely defect from the grid and self-provide her energy needs through alternative sources. This effect is known as grid defection. In this case, the electricity system or the rest of the consumers should not bear the fixed costs that were covered by the defecting consumer and that remain in the system, for instance, network costs or policy costs. This issue opens a discussion about the potential application of exit fees or alternative tariff designs to recover these stranded costs when defections occur [13,24].

3. Methodology

3.1. Introduction

A tariff structure is composed of a set of charges allocated to the different customer categories designed to collect the allowed regulated network costs.
As an example, Table 1 shows the Spanish low-voltage tariff structure in 2019, in which customers with contracted capacity (i.e., maximum peak demand) below 10 kW are divided into three categories (2.0A, 2.0DHA, and 2.0DHS). In this case, two different types of charges are applied: an energy term (ET) in €/kWh that charges the amount of energy consumed in the billing period and a capacity term (CT) in €/kW that charges the maximum kW consumption in the billing period. Tariffs 2.0DHA and 2.0DHS include time discrimination, depending on the hours of the day when the energy is consumed (peak and off-peak periods). For group 2.0 DHS, periods 1, 2 and 3 correspond to peak, shoulder and off-peak periods, respectively.
Designing a tariff structure according to the aforementioned principles of efficiency, equity and transparency should follow the methodology proposed in Figure 1. In the following, the three main steps of the proposed methodology are introduced.

3.1.1. Cost Segmentation and Cost Drivers

Network costs mainly include investment and operation and maintenance of network assets. Cost drivers are the magnitudes related to network users that contribute to increasing the amount of costs, for instance, the peak consumption, the energy consumed or injected in the network, or the new connection of a network user.

3.1.2. Network Users and Type of Charges

Once cost drivers are defined for each cost segment, these costs must be allocated to network users through specific charges to network users.
Network users are divided into two main groups: power-generating facilities and customers, including the concept of prosumers. Power-generating facilities (or generators) are defined according to European Union regulations as those facilities that convert primary energy into electrical energy connected to the network [26]. Customers are defined as those users who purchase electricity for their own use (final customer) or for the purpose of resale electricity inside or outside the system where they are established (wholesale customers). Under the EU point of view, the so-called prosumers are included in the final customers group, in a subgroup called active customers [27]. Large batteries acting as pump-hydro storage plants are wholesale customers, while small batteries are included as assets owned by active customers.
Cost allocation among users is limited by the available type of charges, which are energy-based charges (€/kWh), capacity-based charges (€/kW), and fixed charges per customer (€/customer).

3.1.3. Granularity

Figure 1 shows the latter step of the tariff structure methodology to select a level of adequate locational and temporal granularity to be applied to the previously selected type of charges. For accomplishing this task, a good balance between the principles of economic efficiency and equity while maintaining transparency is needed. The most economically efficient solution would drive us to design almost-individual (depending on the point of connection to the grid) dynamic charges with very high temporal and locational granularity, where every user pays for withdrawing power at each network connection at every instant. However, this solution would be almost impossible to apply in practice and it would be difficult for consumers to accept due to its high level of complexity. Furthermore, equity issues could arise among rural and urban users since rural users would pay significantly higher charges than urban users because of lower load density and higher customer dispersion in rural areas.
In the following, we describe in detail the three steps of the methodology applied to allocate network costs. A similar methodology could be also applied to other cost categories, such as policy costs derived from the support to renewables, social costs, or other policy-related costs included in the electricity tariffs, but that is out of the scope of this paper.

3.2. Methodology for Allocation of Network Costs

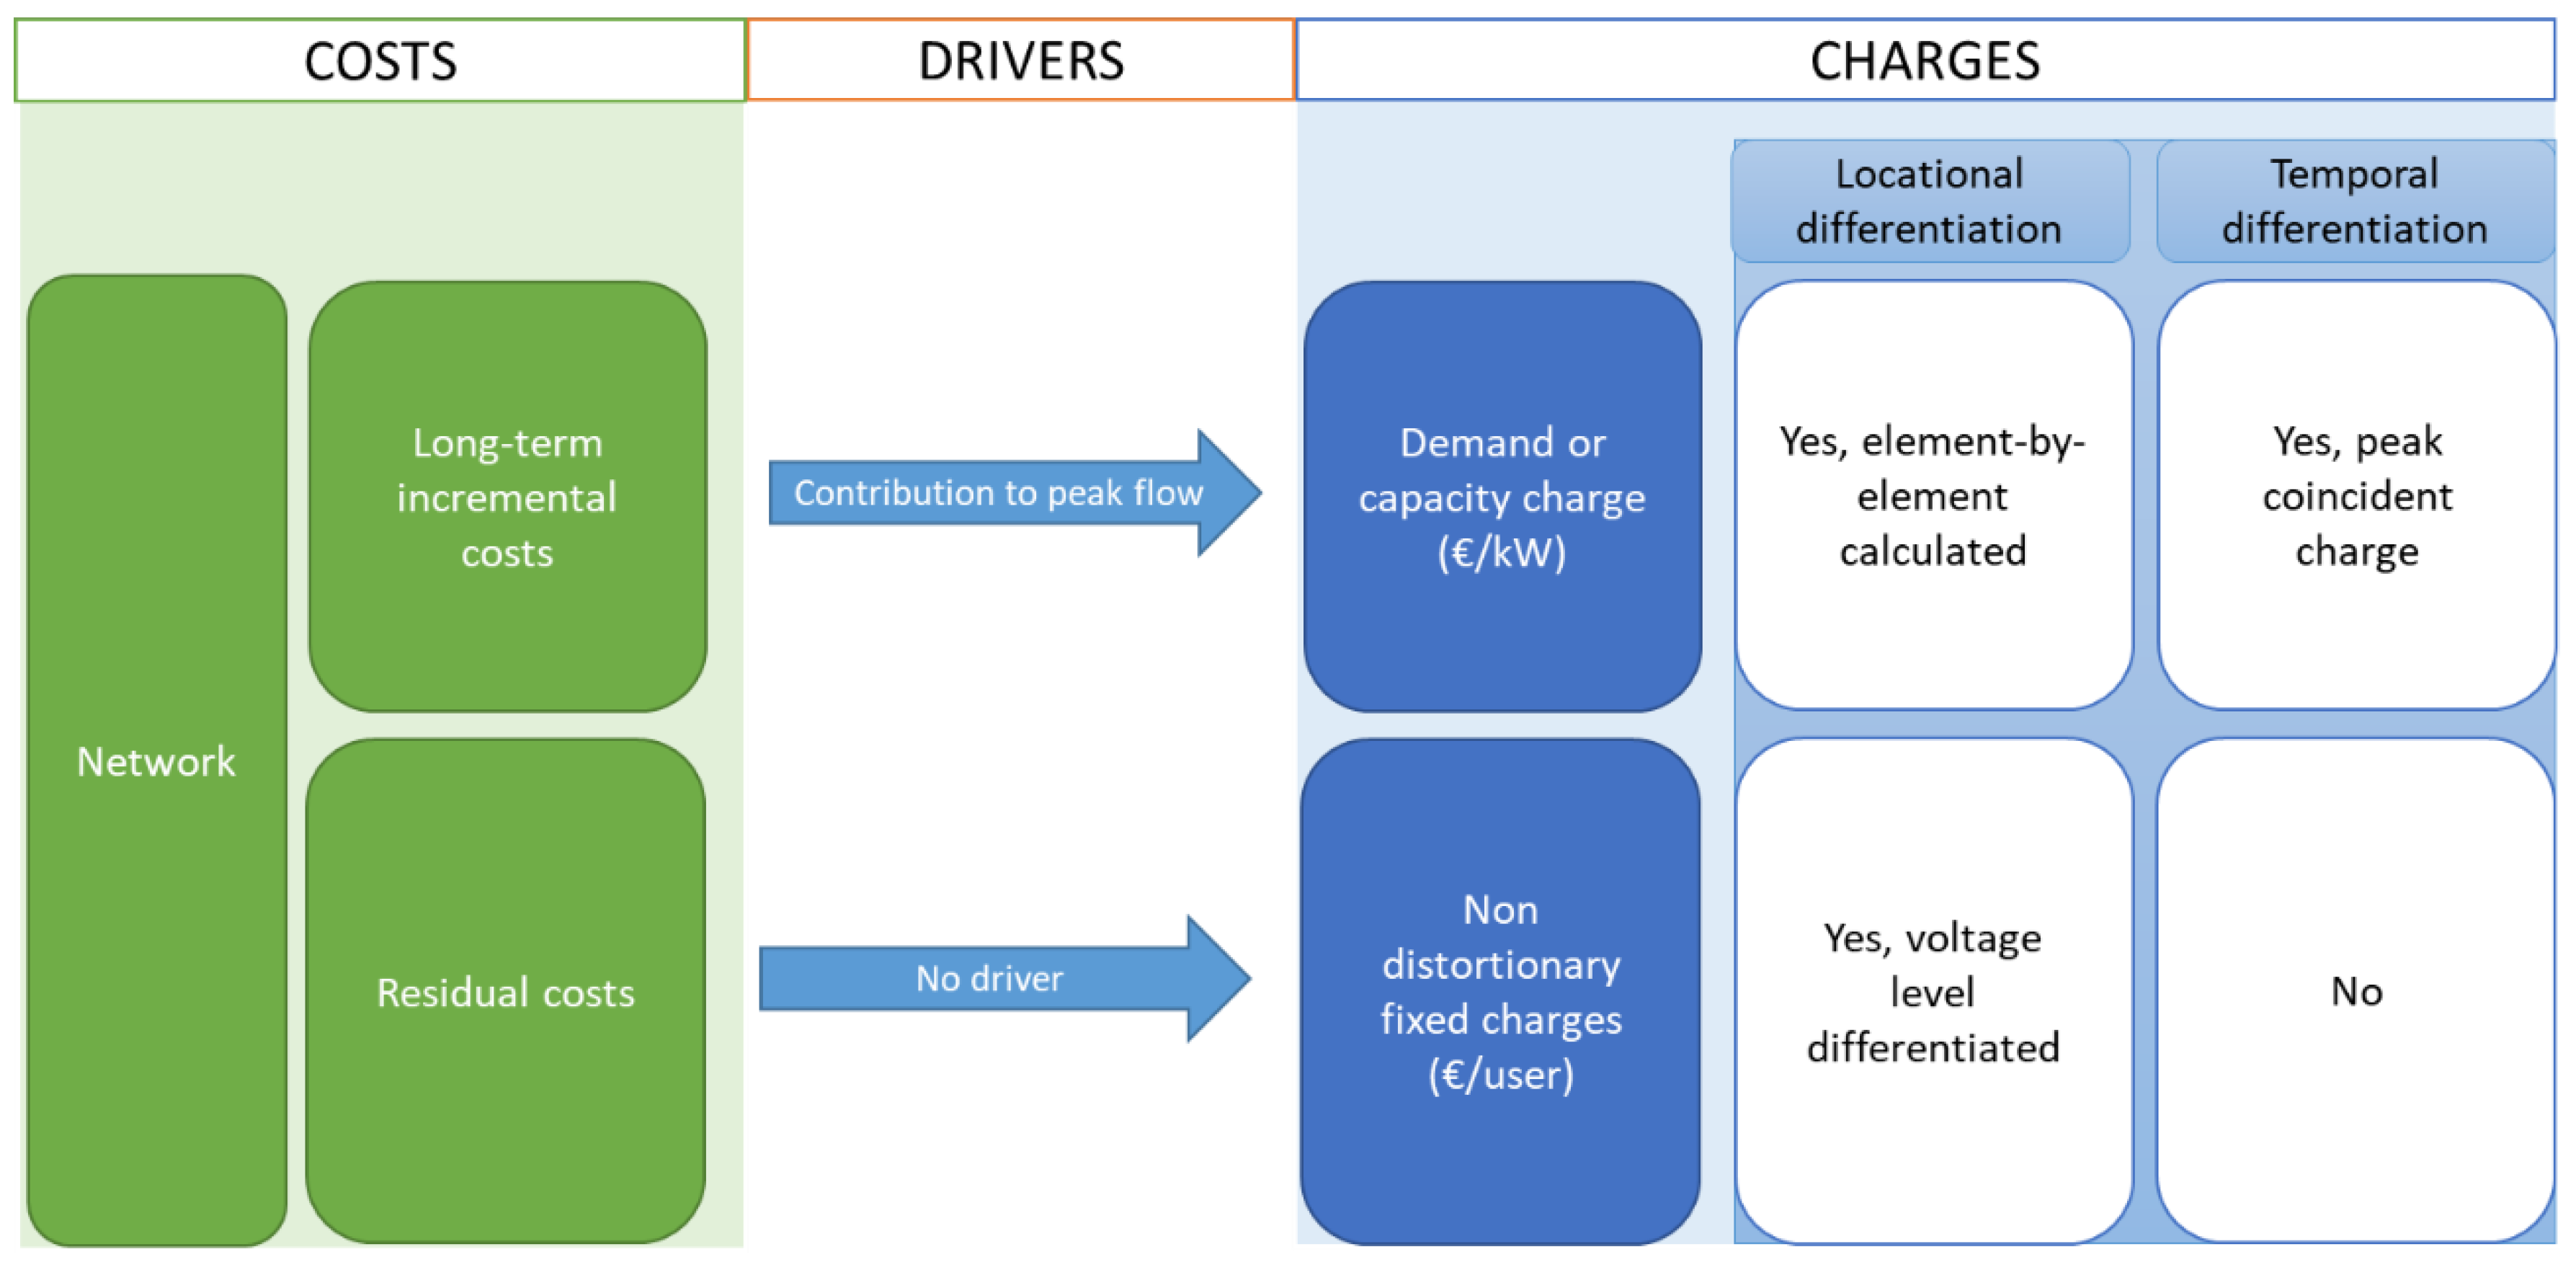
In this section, we apply the previously defined methodology to the network costs to finally come up with the tariff structure shown in Figure 2. In addition, as stated earlier, for residual costs, equity criteria consideration may also affect the cost allocation among customer groups.

3.2.1. Cost Recognition and Segmentation

The electricity network is a capital-intensive business. Network costs are fundamentally formed by past investments with long depreciation periods (CAPEX) and operation and maintenance costs (OPEX) that are mostly independent from network usage. Energy losses and quality of service operating costs are also included in OPEX.
Cost minimization objectives lead to design tariffs that mainly are addressed to minimize long-term network expansion costs, as explained in Section 2. For this purpose, some authors, like [4], agree that network costs should be segmented between long-term and residual costs. Long-term costs are associated with future needed reinforcements and investments if the network usage continues to grow in the maximum demand periods [28]. Long-term network costs should be recovered through peak-coincident charges, while residual costs are the proportion of the total network costs that are not recovered through the previously defined peak-coincident charges. It is important to note that long-term costs and residual costs depend on both the current grid and the foreseen grid usage.
Since network tariffs pursue long-term network cost minimization, a methodology for its calculation must be developed. For this aim, using a generation-demand network expansion model, taking into account different scenarios to characterize the evolution patterns of network users, is required. The incremental cost can be obtained as the network expansion cost from the current situation to the long-term considered futures. This approach is similar to the one expected to be developed by OFGEM in the UK under the Forward-Looking Charging reform [29]. The charges allocated to network users would be based on the annualized cost of the network expansion plans.
Cost Drivers
Cost drivers should be selected for each defined cost segment, i.e., long-term and residual network costs.
The main trigger for future network investments is the maximum peak usage of each network element, i.e., the maximum amount of energy that flows through the element due to the aggregation of all the generation and demand. Therefore, for long-term incremental costs, the main cost driver is the maximum network flow in each network component [22].
For the residual costs, there is no driver, as this cost is calculated as the remaining part of the total recognized regulated cost.

3.2.2. Network Users and Types of Charges

After identifying cost segments and cost drivers, costs should be allocated among system users, i.e., generators and customers, through the available charging variables.
According to the economic efficiency principle and the cost reflectivity and symmetry criteria to allocate long-term network costs, generators and customers should be treated equally. Furthermore, active customers highlight the need for this symmetry because, additionally to consuming power from the grid, they can also inject power in other periods.
On the other hand, regarding the allocation of residual network costs, the problem of charging generation plants with these costs, which are not cost-reflective, would be that generators will translate this cost in their sales to the market, passing them to the customers. Therefore, residual charges should be solely allocated to customers.
Types of Charges
The main problem in selecting the types of charges to allocate costs derives from the difficulty of simultaneously meeting both efficiency and equity principles. Traditionally, regulators have assumed that low-income customers consume less energy than the richer ones. For this reason, volumetric tariffs (energy-based) have been and currently are widely used to allocate network costs among network users, so the former ended paying less network costs than the latter. However, new developments, mainly PV panels, break this assumption since richer customers are able to avoid high-energy charges by reducing their consumption through PV adoption. These avoided charges are reallocated to the rest of the customers through higher volumetric charges, further incentivizing PV installation. Several authors refer to this problem [4,18,30,31,32,33] as the death spiral (direct feedback between volumetric tariffs and DER deployment). Furthermore, theoretically, only energy losses and some of the quality of service costs according to the principle of economic efficiency and cost reflectivity should be charged through volumetric energy charges, as stated at [34].
A practical solution for the death spiral problem or the equity issues among customers installing or not installing PV panels consists of introducing contracted capacity or demand charges (€/kW) to allocate part of the total network costs, while the remaining part continues to be recovered by volumetric energy charges. These capacity charges are based on a customer’s maximum demand (kW) during a certain period. It can only be measured ex-post, i.e., after the end of the period. For the application of ex-ante capacity-based charges, some countries apply what is called the “contracted capacity” charge. In this case, users establish a threshold for their maximum capacity at each period. If the tariff’s objective is to send economic signals to customers, and an ex-post approach is not able to send them, an ex-ante approach is recommended. Capacity charges also increase the cost reflectivity of the tariffs since, as has been commented, the main driver of network costs is the peak energy flow, which determines the necessary network installed capacity [7,35]. The application of a higher capacity or demand charges would also incentivize, in the future, the implementation of storage technologies, as several papers foresee [36,37,38,39]; customers will also be incentivized to move part of their consumption from peak hours to off-peak ones [13,30].
Following the economic efficiency principle, the best approach for collecting long-term network costs would be to implement peak-coincident forward-looking charges (€/kW) that measure the contributions of network users to the peak network flows in the periods of maximum utilization. This economic signal would incentivize user responses to reduce network peak flows and delay future grid investments.
Finally, for recovering residual network costs, it is recommended to select fixed charges per customer (€/customer) without impacting other efficient price signals, so network users would not be able to avoid this payment by modifying their consumption patterns. In addition, fixed charges allow addressing equity issues depending on how they are applied to the different customer categories. The British regulator is moving in this direction. In the UK, there is a proposal to recover residual network costs through a fixed charge for domestic customers depending on the aggregated net consumption of the customer category where they are classified—equal payment for customers classified under the same category [40]. There are other alternatives to allocate residual costs through fixed charges among all the customers following equity principles [41,42].

3.2.3. Granularity

Time Granularity
Following the economic efficiency principle and designing cost-reflective charges, peak-coincident network charges should vary with time since they anticipate investment costs, which would only be necessary at certain times of the year. For example, if a line is congested, or close to being congested in the near future, those network users who contribute to this congestion should be signaled to shift their consumption because, if they continue or increase their peak consumption at these hours, new investments will be triggered.
Smart-metering developments enable new billing alternatives with higher time discrimination that allow signaling peak energy flows, such as peak-coincident network charges [4,22,43], where users are charged proportionally to their network usage when the grid is congested.
An Illustrative Example for Determining Time Granularity
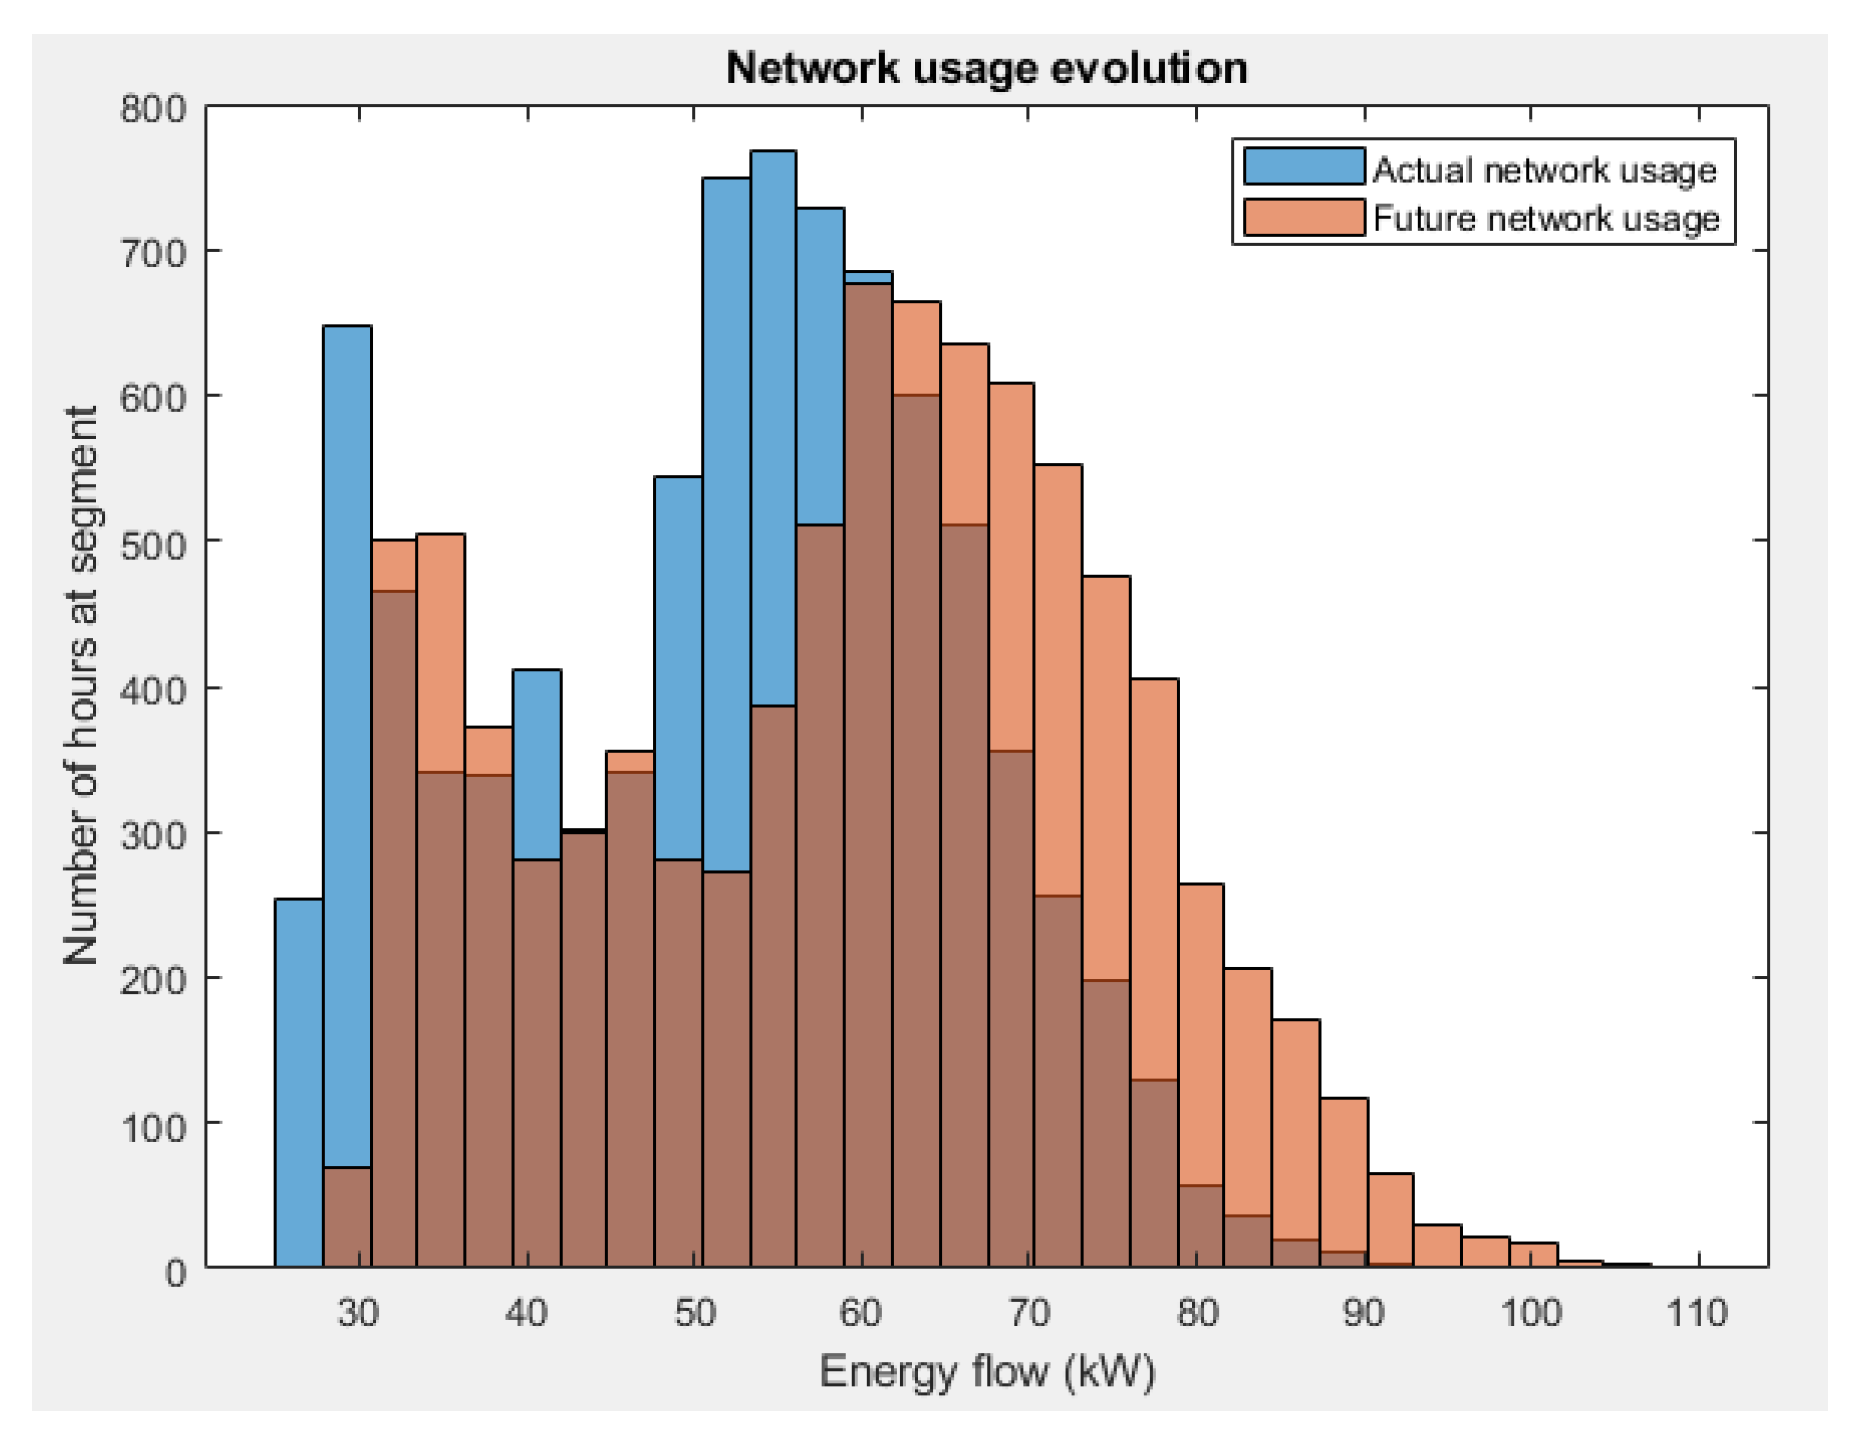
We assume a low-voltage feeder that supplies 425 real consumers and is connected through a 100-kW distribution transformer to the rest of the distribution network. The actual usage of this transformer is shown in Figure 3 as the blue histogram. Note that this usage is, in all hours, below the transformer capacity (100 kW). In addition, we assume a demand growth for this group of users of 1.15 over the next 40 years. Network usage would increase as the orange histogram shows. This increasing demand would trigger a new investment in the network, since the transformer will be overloaded in specific hours when the network usage is above 100 kW.
Following efficient economic signals, the users should respond to peak-coincident charges through load shifting or load reductions and, in this way, delay network investments if the cost of such actions is a more efficient than the network reinforcement alternative, i.e., total lower costs.
A key decision is to identify the periods of time that should be signaled by the cost-reflective charge. A straightforward decision would be to select those hours in which the future network usage is above the rated network capacity. However, if only those hours are chosen, the intrinsic uncertainty related to demand forecast may, in the end, lead to congestion in hours close to the selected period where the charges would be much smaller. Therefore, it is recommended not to narrow too much the periods when peak-coincident charges are applied [22]. In practice, a lower boundary or security margin should be defined to determine the periods where peak-coincident charges are applied, e.g., those hours when the energy flow exceeds 60% of the rated capacity. This is an important topic for further research.
Locational Granularity
Again, the principle of economic efficiency would lead us to design peak-coincident network charges with a high level of locational granularity to incentivize efficient network user responses depending on the particular network components that are expected to be congested. However, equity concerns would advocate for allocating the same charges to a large proportion of customers categorized under the same segment regardless of their location in the network [4,44].
Some countries have developed intermediate alternatives. For example, the Spanish law does not permit differentiation among consumers’ locations to recover network costs, but charges are differentiated depending on the voltage connection [45].
Following a cost-causality principle, peak-coincident network charges should be calculated for each network user depending on its point of connection to the grid. The considered network should be divided into as many elements as it is composed of, e.g., lines, transformers, substations, etc. Then, for each element, the number of hours in which its expected peak flows exceed the threshold according to the security margin selected are considered, as shown in the illustrative example. All network users contributing to these peak flows are charged proportionally to their contribution to potential future investment or incremental cost associated with the expansion of this network component.
On the other hand, the residual cost, calculated as the remaining cost that is not allocated through peak-coincident charges, is allocated following equity principles. For instance, allocative equity criteria could lead us to differentiate customer categories depending on the different voltage levels where they are connected.

3.2.4. Proposed Network Charges: Summary

Long-term network costs could be signaled through element-by-element peak-coincident network charges that minimize network usage in peak periods, as well as boost flexible resources, from either generation or demand. These charges would be time-dependent capacity-based charges and dependent on the location of each consumer in the network.
In the same way, residual network costs can be allocated among consumers through charges that do not distort the efficient price signals associated with the aforementioned peak-coincident network charges or energy market prices. Therefore, residual costs should be allocated to network users through a fixed charge, which consumers would not be able to avoid through any modifications of energy injection or withdrawal patterns. By modification of consumption patterns, we understand load shedding, load shifting and defection from the grid. Special attention is required to grid defection, since a significant amount of foreseeable recovered costs will not be recovered, causing a future increment in the electricity charges for the rest of consumers. If the network used to deliver electricity to the defected consumer is not already depreciated and the rest of consumers will not use it, the defected consumer should bear with the depreciated network investment cost via an exit fee; however, at the same time, its implementation may be challenging due to legal and practical considerations.

4. Case Study

The case study presented in this article compares the effects of the application of three types of network tariffs (a volumetric tariff, a representation of the current tariff applied in Spain, and the proposed efficient tariff) in a simplified network model. For simplicity, these tariffs are calculated and applied for one representative day (24 h). Note that this case study does not analyze the end-consumer tariff, but only the network tariffs, so generation and other regulated costs are not included.

4.1. Network Model Description

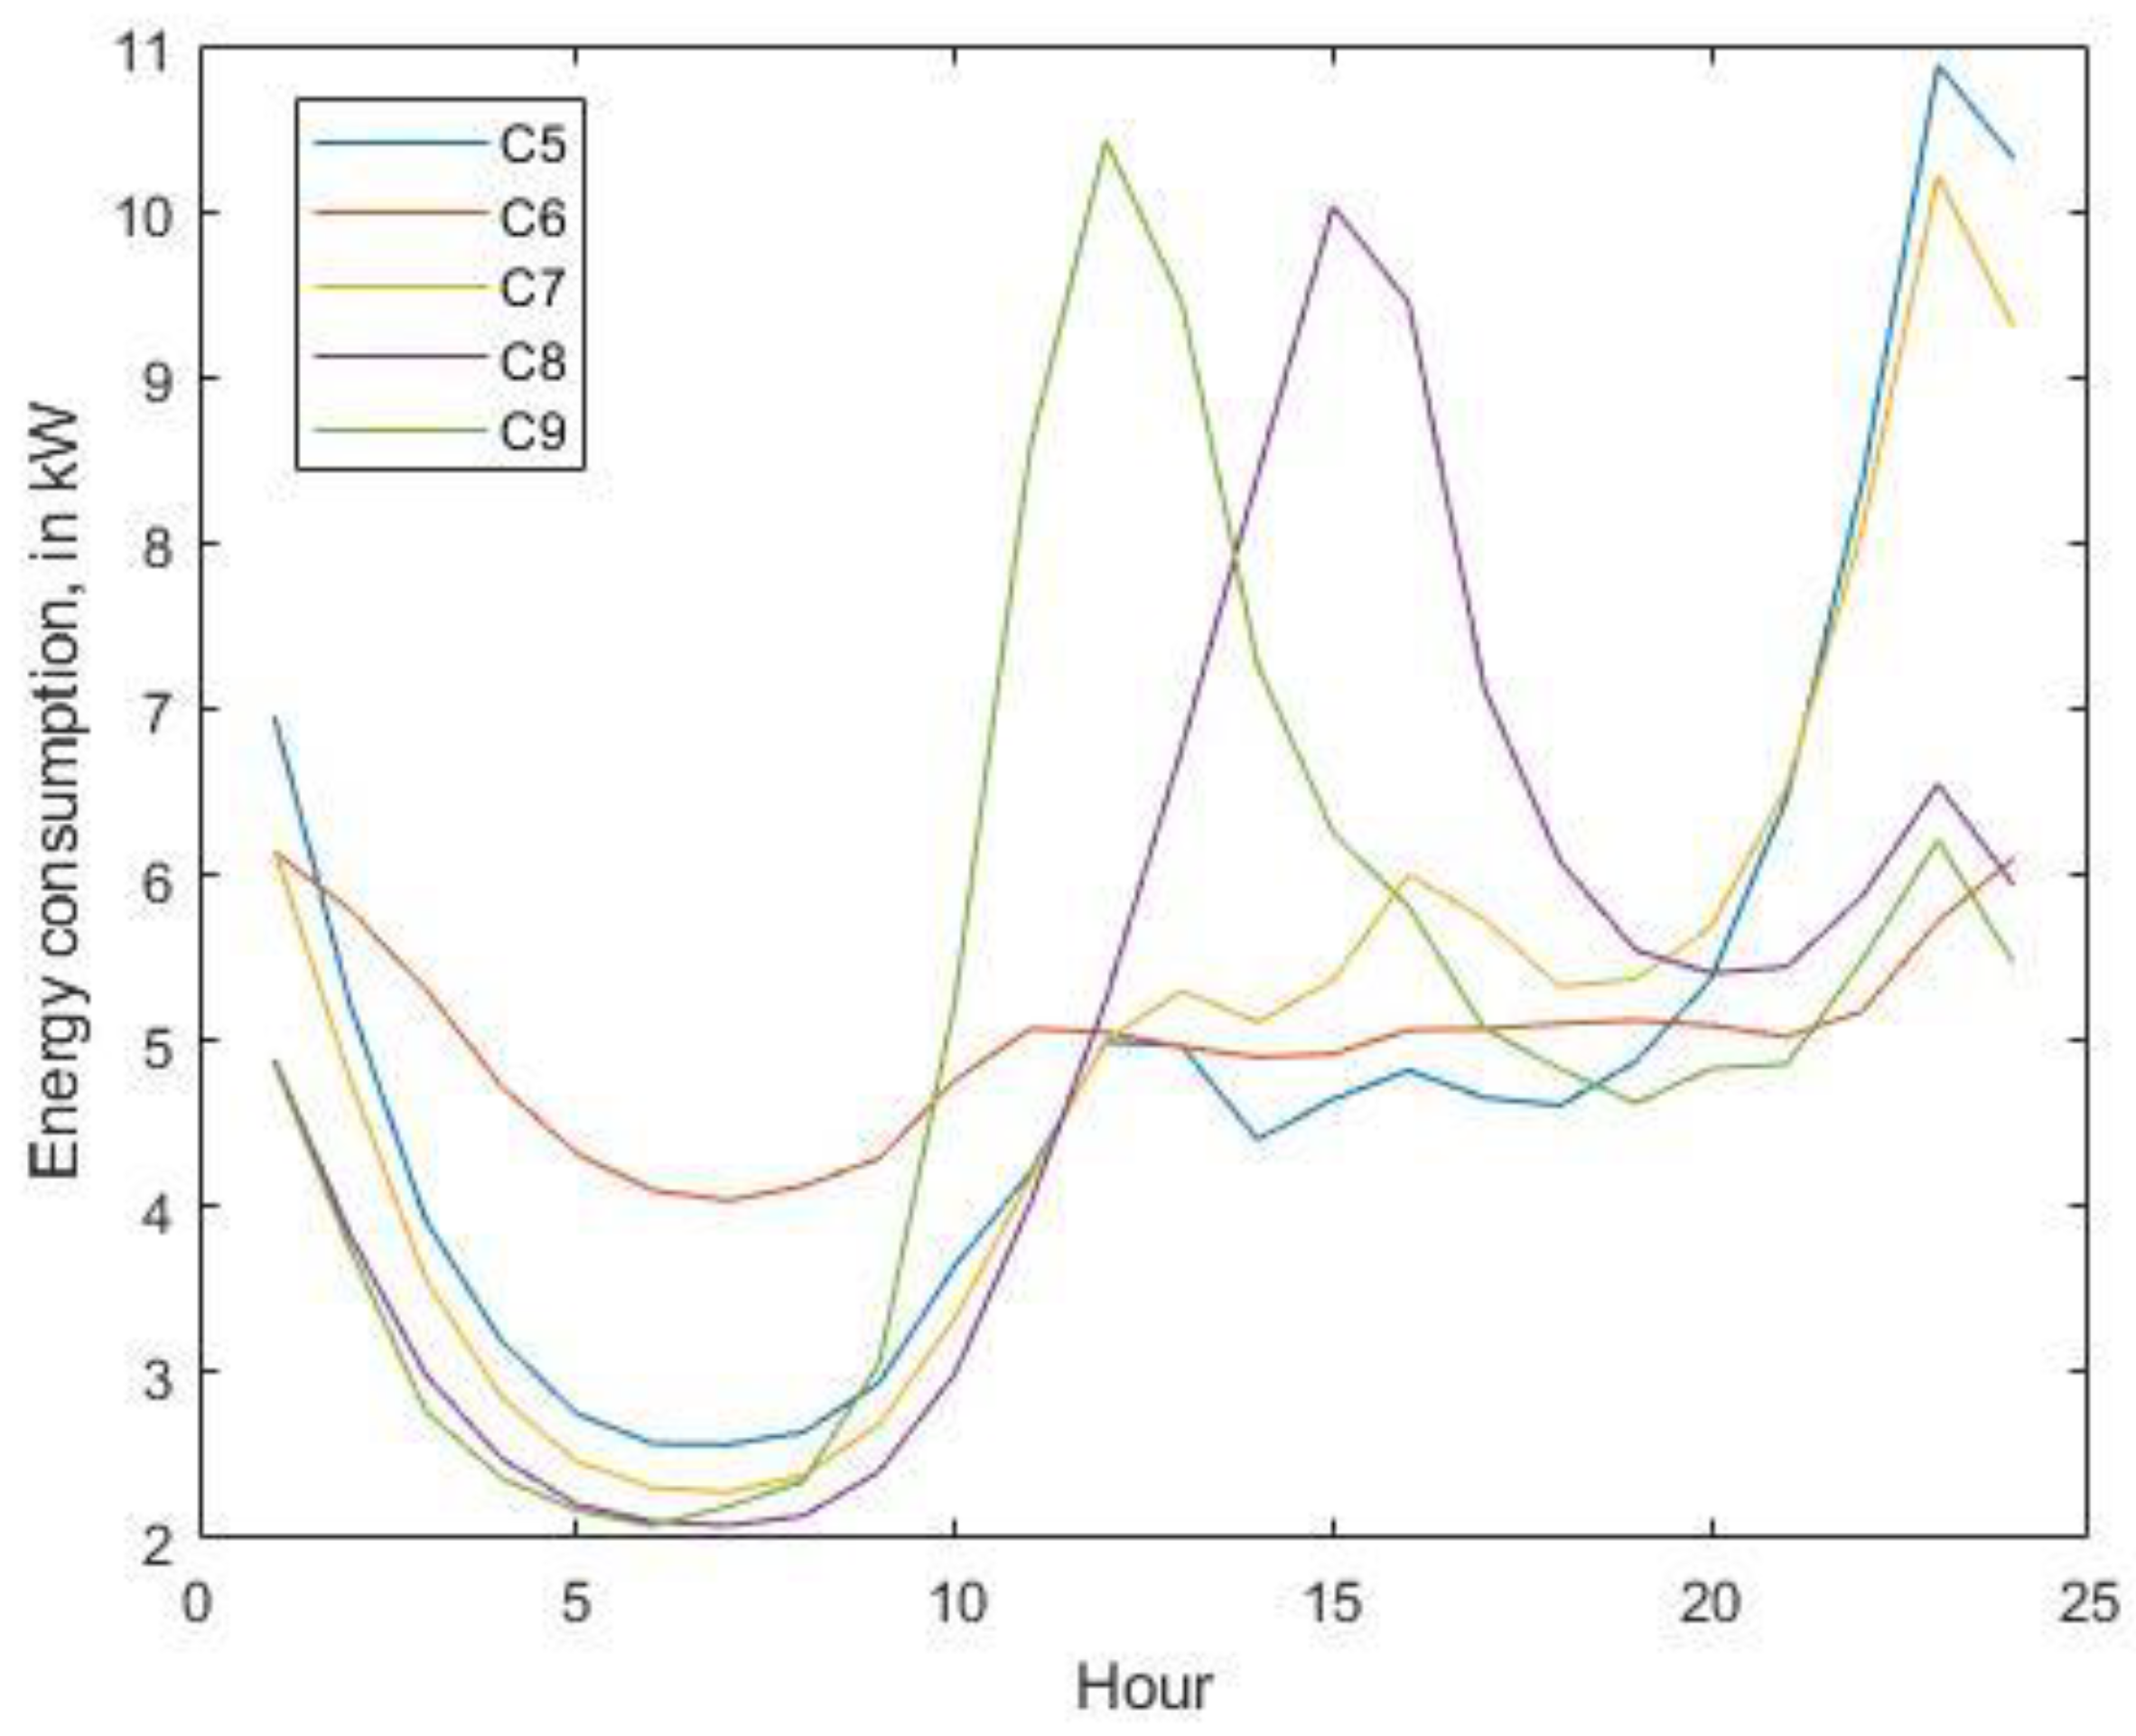
The simplified network consists of three voltage levels (HV, MV, LV) with transformers connecting different voltage levels. There are two generators (one in the HV network, which is the slack bus, and another in the MV network) and nine consumers (2 in HV, 2 in MV, and 5 in LV), as shown in Figure 4. Consumer load curves are shown in Figure 5.
The annual maintenance costs and the annualized investment costs to be recovered through the tariffs are known for each network element.

4.2. Network Tariff Description

The three tariffs analyzed are volumetric, Spanish and efficient as described below. The power flow and the tariff computations are implemented in Matlab software.

4.2.1. Volumetric Tariff

This charge simply consists of a flat volumetric charge for all hours. To make the three tariffs comparable, the distribution of costs at each network voltage level is allocated among the users connected at the same level and the users connected at lower levels according to the cascade model explained in the Spanish tariff. In practice, the volumetric tariffs may not differentiate costs among voltage levels. Figure 6 shows the calculations followed to compute the volumetric tariff.
Where:
  • i , j , k = voltage levels 1 (low voltage), 2 (medium voltage) and 3 (high voltage);
  • C i = network costs per voltage level i;
  • C i j = costs of voltage level i that will be allocated to users of voltage level j;
  • α e j i = cost sharing factor based on the electricity flow from voltage level i to voltage level j;
  • T i E = volumetric network tariff (€/kWh) for consumers connected at voltage level i;
  • E i = aggregated consumption (kWh) at voltage level i.

4.2.2. Spanish Tariff

The current Spanish tariff consists of two charges: (1) a contracted capacity charge in €/kW-year, and (2) a volumetric charge in €/kWh. Both charges are different by voltage levels and have temporal differentiation by periods that vary according to peak consumption hours at each voltage level. In this paper, the time differentiation for this tariff has been simplified to three periods for all consumers (peak, shoulder, and off-peak), and the differentiation by voltage levels has been maintained. Hours belonging to each period are: P1: h9 to h13 and h18 to h21; P2: h8, h14 to h17 and h22 to h24; and P3: h1 to h7.
The calculation process is the following:
  • The acknowledged regulated costs for each network voltage level are determined. Costs are allocated to two types of charges so that the capacity charge is responsible for recovering 100% of the high-voltage (HV) network costs and 75% of the medium-voltage (MV) and low-voltage (LV) costs, while the energy charge is collecting 25% of MV and 25% of LV costs.
  • The costs from a voltage level are allocated to the different periods according to the proportion of peak hours found at each period. For example, if period 1 contains 50% of the total peak hours, 50% of costs will be allocated to that period. In this case study, it has been considered that the peak hours are the 8 h of highest consumption at each voltage level.
  • The cascading model is applied, following the assumption that those responsible for the costs of a voltage level are the users connected at that voltage level and the users connected at lower voltage levels [46]. For computing the capacity charge, the peak demand power balance is used to calculate how the cost of a voltage level and period is divided among responsible users at the same and other voltage levels. The power flow between voltage levels is the flow in the transformers at the previously determined peak hours. Knowing these flows, the costs of a voltage level are allocated among the different voltage levels proportionally to the maximum flow of each period. This calculation is made for each voltage level, for each hourly period and for each type of charge (volumetric or capacity). In the case of computing volumetric charges, the aggregated energy consumed in each period and each voltage level is used instead of the peak demand.
Figure 7 shows the calculations followed to compute the Spanish tariff.
Where:
  • p = time periods from 1 (peak period) to 3 (off-peak period);
  • i , j , k = voltage levels 1 (low voltage), 2 (medium voltage) and 3 (high voltage);
  • C i C = network costs of voltage level i to be recovered by capacity charges;
  • C i , p C = part of network costs of voltage level i allocated to time period p, to be recovered by capacity charges;
  • H = number of hours with maximum energy flows;
  • h i , p = number of hours of time period p included in the H for voltage level i;
  • C i , p C , j = costs of voltage level i that will be allocated to users of voltage level j, at time period p, to be recovered by capacity charges;
  • α j , p i = cost sharing factor based on the electricity flow from voltage level i to voltage level j, for the time period p, applied to costs recovered by capacity charges;
  • T i , p C = network capacity charge (€/kW) for consumers connected to voltage level i, for time period p;
  • D i , p = aggregated maximum capacity (kW) at voltage level i and time period p;
  • C i E = network costs per voltage level i to be recovered by energy charges;
  • C i , p E = part of network costs of voltage level i allocated to time period p, to be recovered by energy charges;
  • C i , p E , j = costs of voltage level i that will be allocated to users of voltage level j, at time period p, to be recovered by energy charges;
  • α e j , p i = cost sharing factor based on the electricity flow from voltage level i to voltage level j, for the time period p, applied to costs recovered by energy charges;
  • T i , p E = network energy charge (€/kW) for consumers connected to voltage level i, for time period p;
  • E i , p = aggregated consumption (kWh) at voltage level i and time period p.

4.2.3. Efficient Tariff

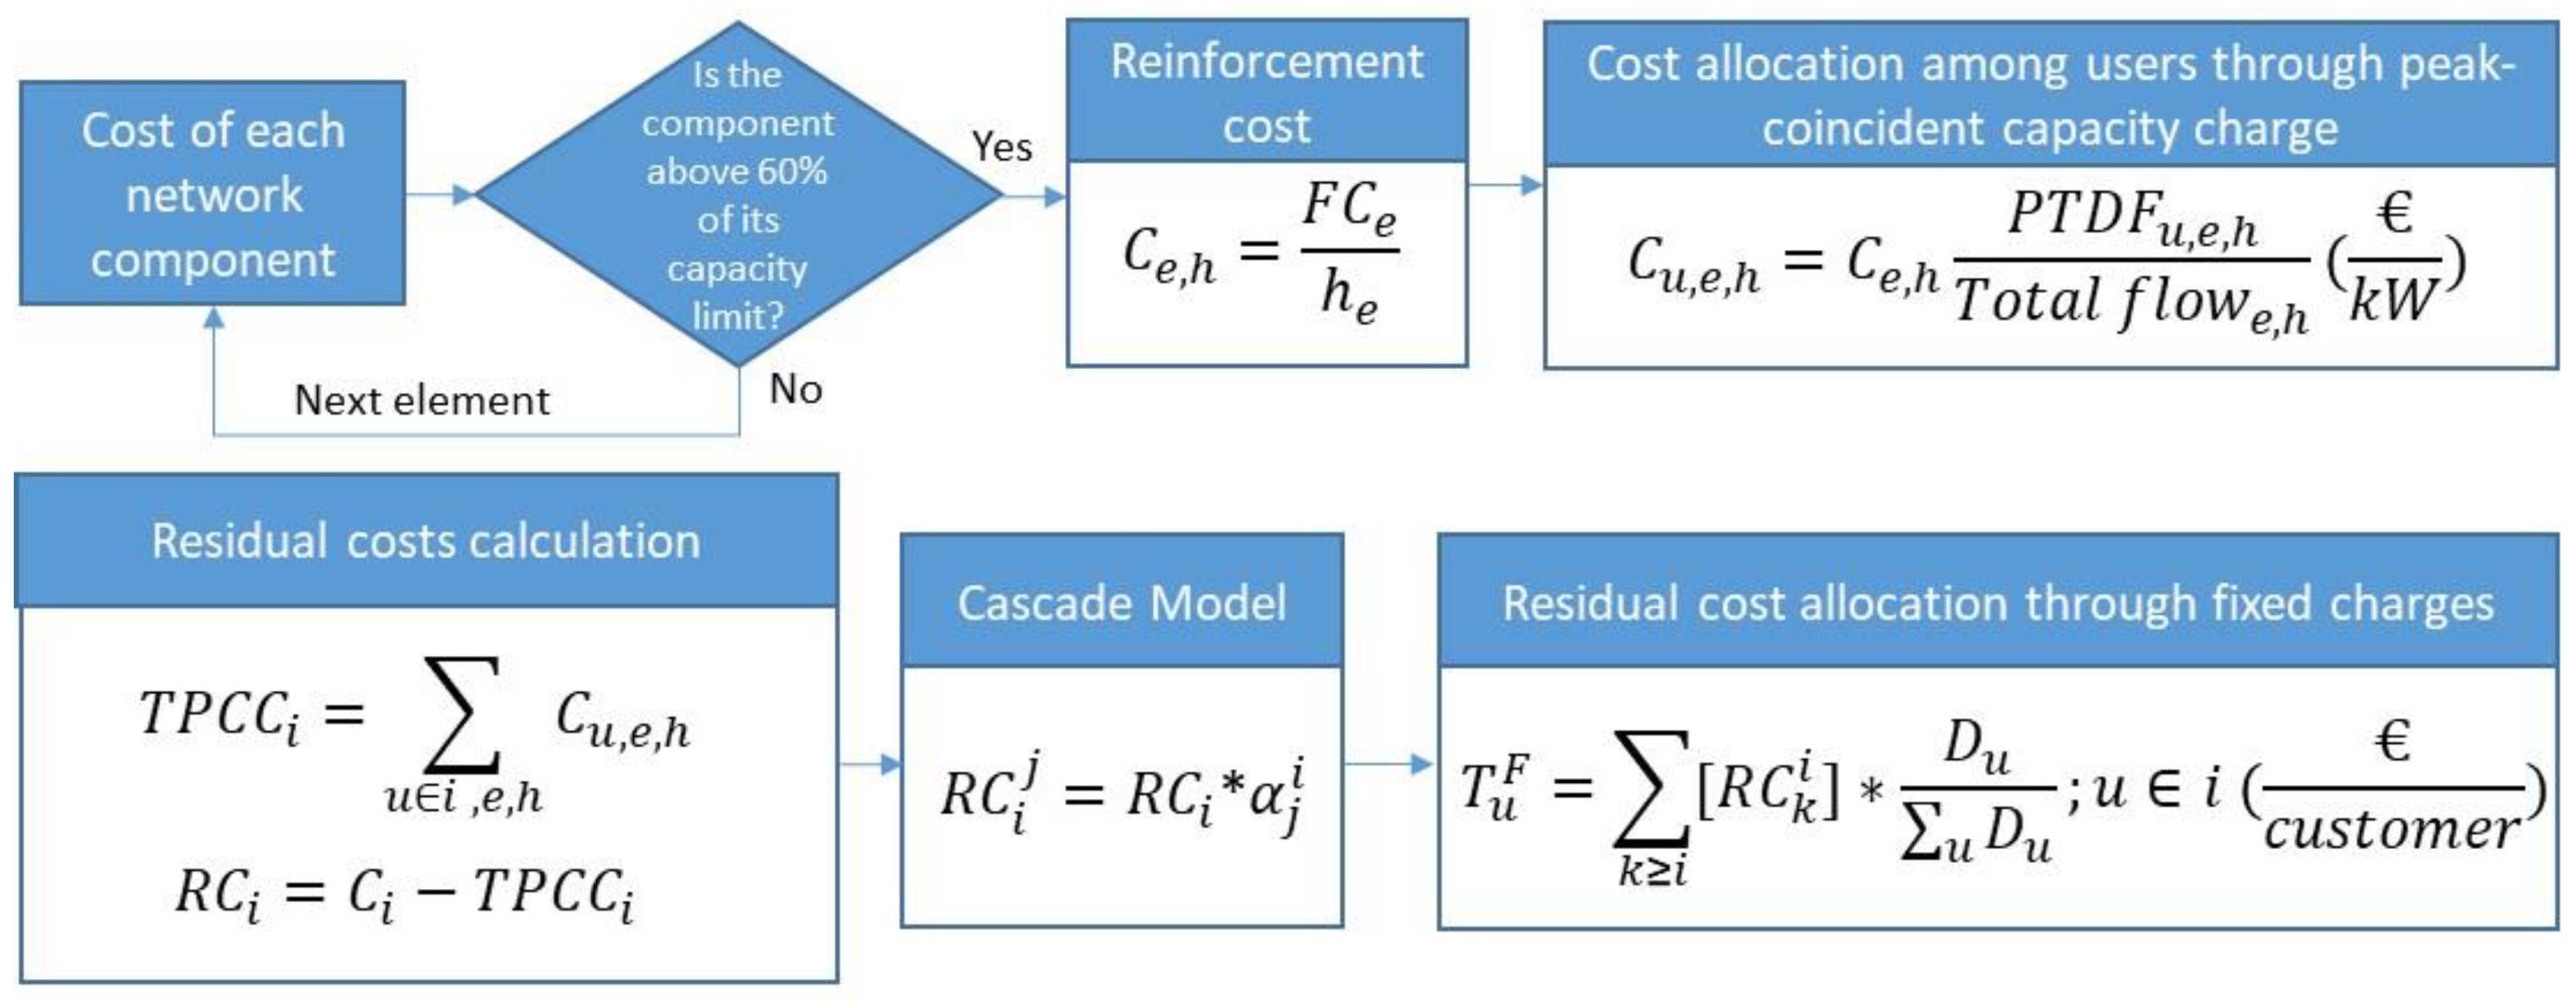
The efficient tariff corresponds to a simplified version of the tariff proposed in Section 3. It consists of two terms: (1) a peak-coincident capacity charge applied on an hourly and user-to-user basis and (2) a fixed residual charge. The purpose of the peak-coincident charge is to send an economic signal to network users who contribute to the flow of network elements that can be potentially congested in the future (for example, an element loaded to more than 60% of its capacity). The contribution of each user to the power flow of each element is calculated proportionally to the Power Transfer Distribution Factor [47], so that both generation and demand are charged equally but in the opposite direction. On the other hand, the residual fix charge by customer is intended to recover the remaining network costs after the application of peak-coincident charges. Following the allocative equity principle, residual charges are allocated among the different voltage levels, so that the consumers are responsible for the residual costs of their voltage level and the levels above, based on the previously mentioned cascade criterion. Besides, following the distributional equity principle, the applicable charges within each voltage level are allocated among consumers depending on their maximum demand on peak or shoulder hours. This is a proxy to charge consumers according to their size, but we recognize that, in this way, further incentives are provided to reduce consumption in peak and shoulder hours. However, consumption at off-peak hours, i.e., electric vehicle charging, is not penalized. Figure 8 shows the calculations followed to compute the efficient tariff.
Where:
  • i , j , k = voltage levels 1 (low voltage), 2 (medium voltage) and 3 (high voltage);
  • e = network component (line, transformer);
  • u = network user (consumer or generator);
  • C e , h = cost of element e allocated to hour h;
  • F C e = annualized future reinforcement cost of element e;
  • h e = number of hours in which component e is above 60% of its capacity limit;
  • C u , e , h = cost of element e allocated to user u at hour h;
  • P T D F u , e , h = network flow of component e caused by user u at hour h;
  • T o t a l   f l o w e , h = flow along component e at hour h;
  • T P C C i = total peak-coincident charges at voltage level i;
  • C i = total network costs of voltage level i;
  • R C i = residual network costs of voltage level i;
  • R C i j = residual costs of voltage level i that will be allocated to users of voltage level j;
  • α j i = cost sharing factor based on the electricity flow from voltage level i to voltage level j;
  • T u F = fixed charge for consumer u (€/consumer);
  • D u = maximum demand at peak or shoulder periods of consumer u.

4.2.4. First Case

The objective of this first case study is to show the differences that appear in the charges faced by network users with the three tariffs when part of the network exceeds the selected operational security margin (60%). In this case, the LV transformer usage is above 60% of its capacity in h1 and from h10 to h24, and the line 12 usage is above 60% of its capacity from h11 to h14. Instead, if congestions were not expected, all three tariffs would send similar charges to all network users.
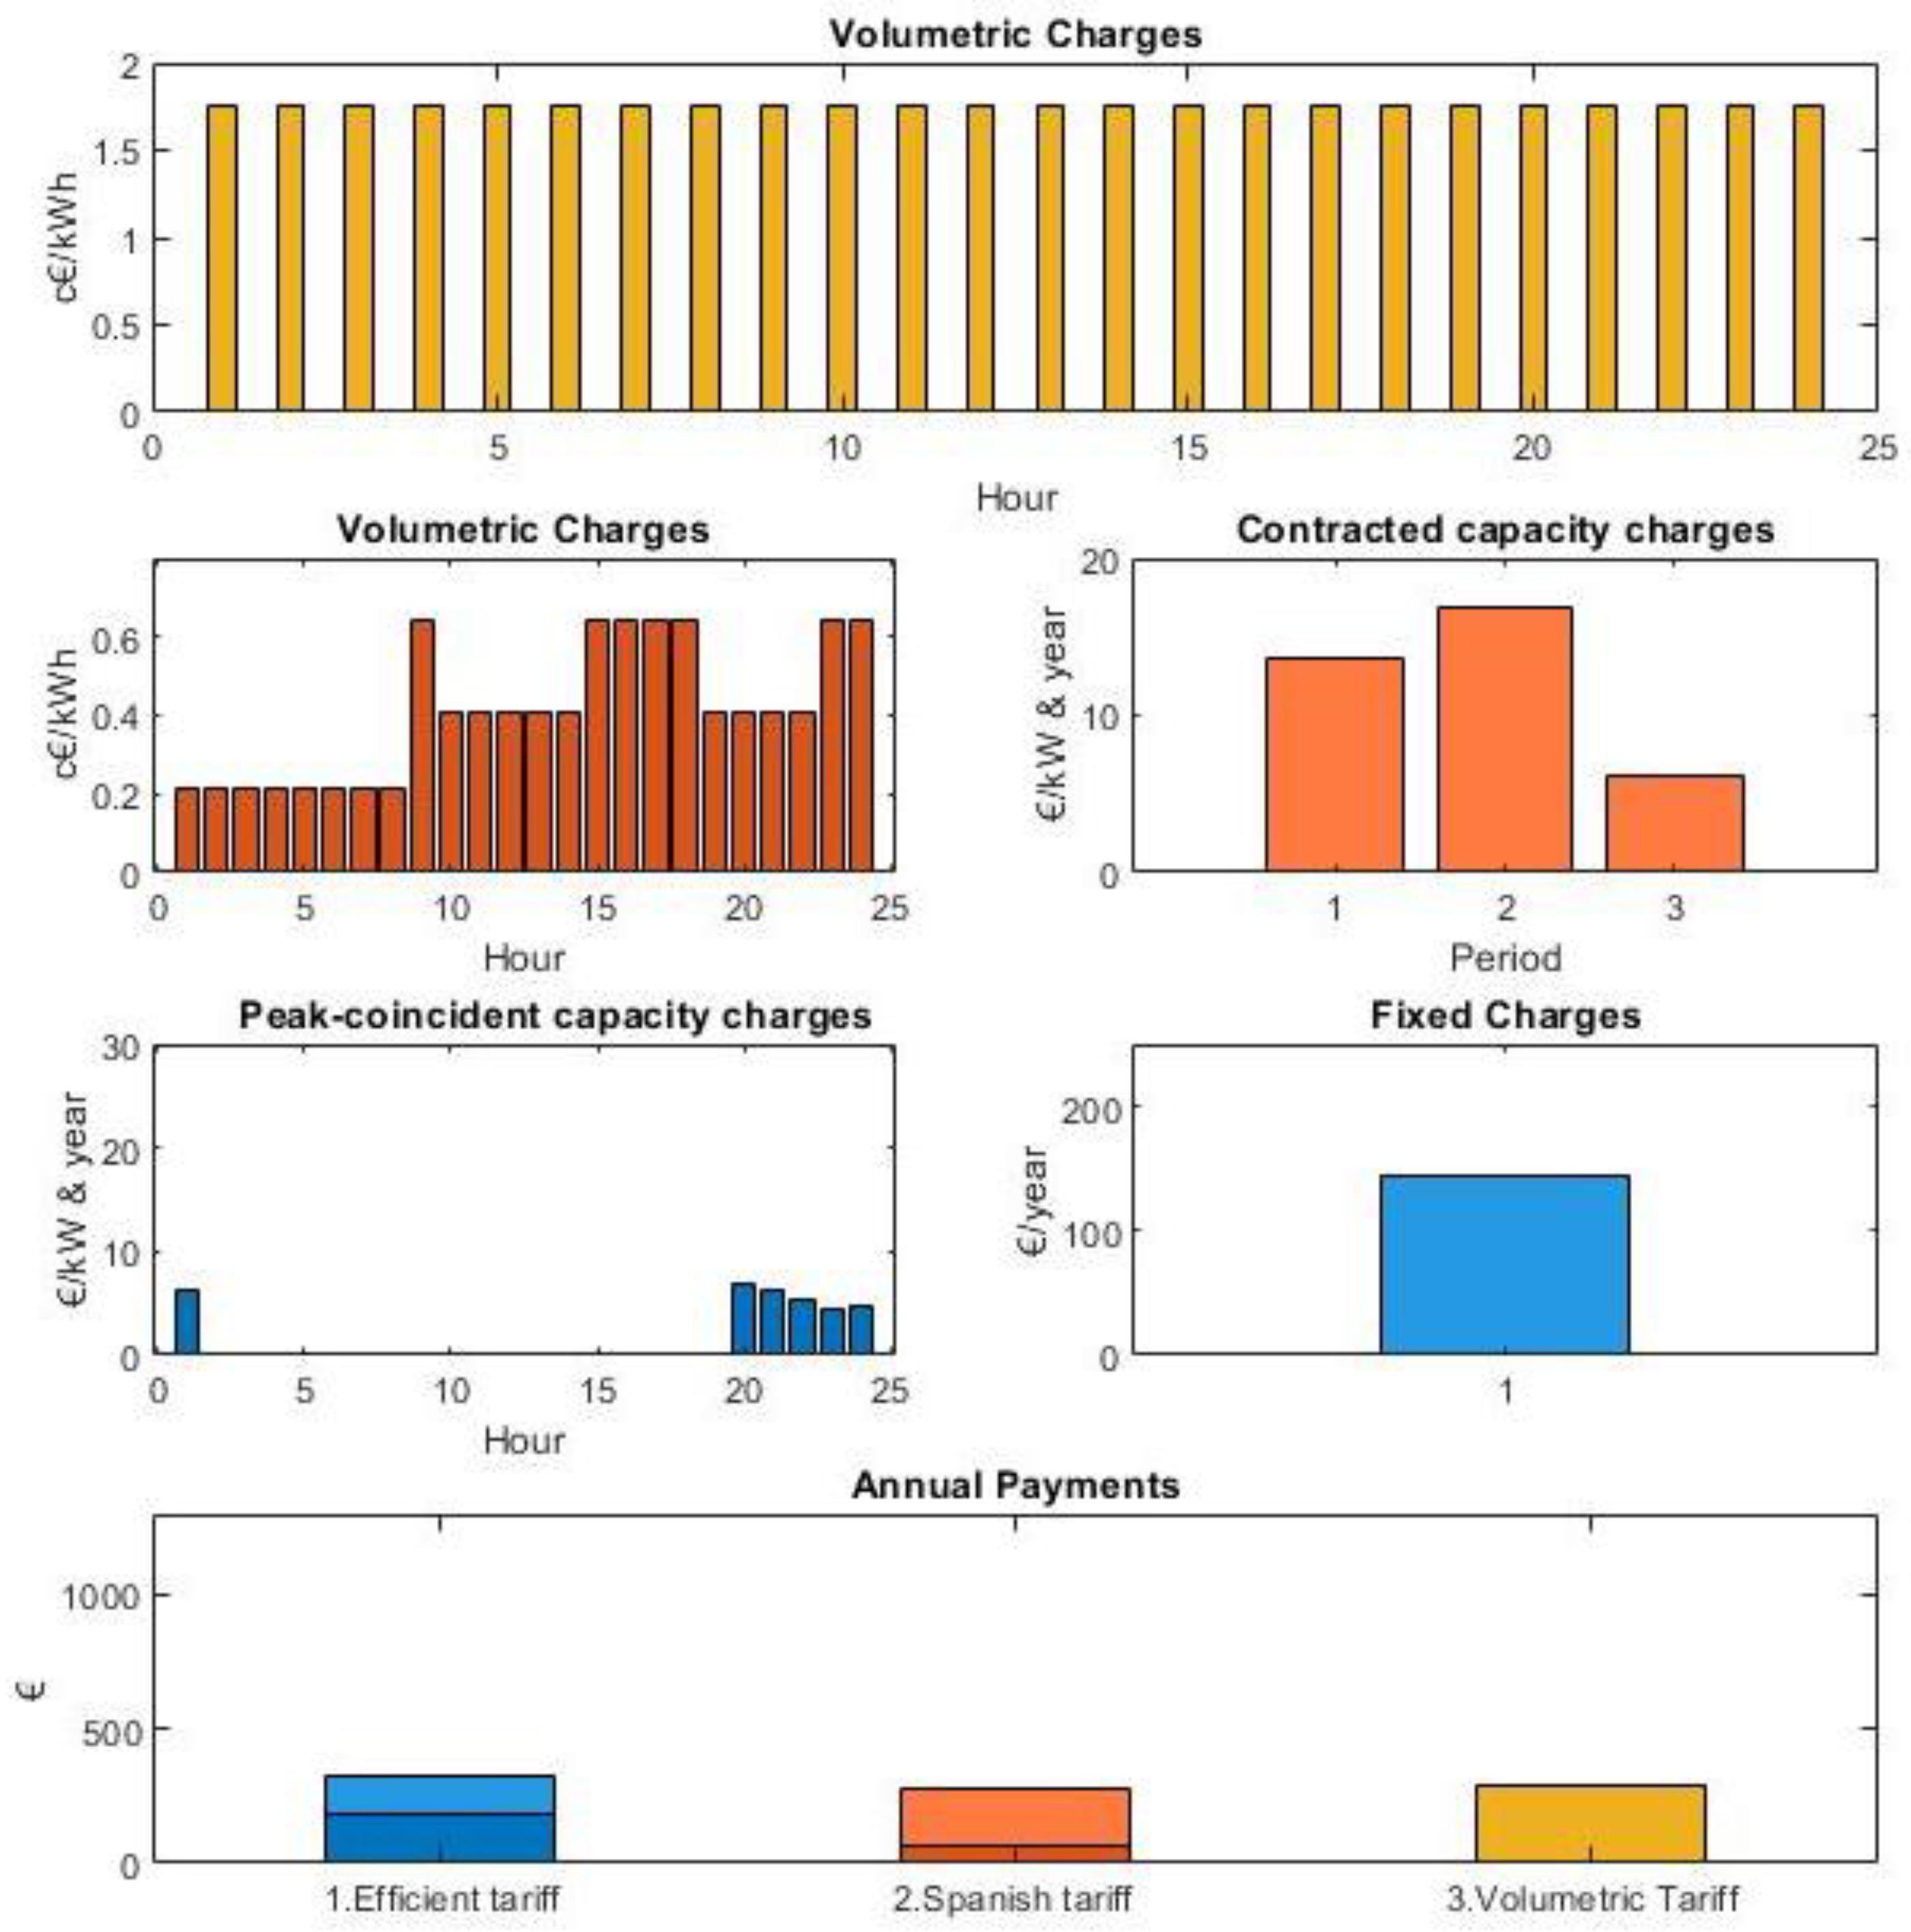
Charges faced by two differently located consumers under the three tariff structures are shown in Figure 9 to analyze the effect of line 12 exceeding the specified usage threshold. Figure 9a shows the charges applied to consumer 6, who would not use line 12, while Figure 9b shows the charges applied to consumer 9, who would need line 12 for her electricity supply. The volumetric tariff (yellow) consists of a flat energy charge equally applied to all LV consumers. The Spanish tariff (orange) consists of a volumetric charge and a contracted capacity charge, the same for both consumers. Finally, the efficient tariff (blue) consists of a peak-coincident capacity charge and a fixed charge; in this case, both are different for consumers 6 and 9. This difference is based on the fact that consumer 9 is the only one responsible for line 12 peak flow. Therefore, consumer 9 would face higher peak-coincident capacity charges than consumer 6. If consumer 9 were able to change her consumption pattern, for instance by installing a PV panel, reducing demand during line 12 peak flow hours, she would face lower rates and the need for future network reinforcements would be reduced. On the other hand, consumer 6 is not able to relieve the line 12 peak flow by changing her consumption pattern and she does not receive peak-coincident charges for this reason. Similarly, the peak-coincident charges observed for consumer 6, and some part of peak-coincident charges for consumer 9, are due to their contribution to the peak flow of the LV transformer.
Notice that peak-coincident network charges could result in negative payments, which means incomes for network users that contribute to reducing peak flows. For instance, this would be the case for consumers increasing demand in areas with high generation where the peak flows in the network are due to exporting power to upstream voltage levels

4.2.5. Second Case

The second case presents the effect of one LV consumer installing PV panels for self-generation on each tariff structure. It is assumed that consumer 6 is installing a 5-kW PV panel installation, reducing the net demand from the grid. In this second case, charges are calculated for a new tariff period, i.e., several years later, so long-term effects are highlighted. Note that, in this case study, one LV consumer installing PV technology means that 20% of LV consumers are adopting this technology (a realistic situation for many countries).
Figure 10 shows the charges applied in the next tariff period, after including in the tariff calculation the effect produced by the new net demand pattern of consumer 6, once this consumer has installed the PV generation.
By comparing Figure 9a and Figure 10, economic incentives received by consumer 6 are highlighted. Volumetric tariffs are slightly increased for all consumers because of the net demand reduction due to the PV installation. In the case of the Spanish tariff, volumetric and contracted capacity charge periods are modified, since, in this new tariff period, off-peak hours are now counted in the first 8 h of maximum utilization of the LV network. Likewise, as in the volumetric tariff, the overall charges are slightly increased because of the net demand reduction. Regarding the efficient tariff, peak-coincident charges are allocated to those hours in which the transformer usage is above 60%. Peak-coincident charges are higher in this second case because transformer reinforcement costs must be divided by a lower number of close-to-congestion hours. On the other hand, residual charges are not modified.
We can conclude that by applying the Spanish tariff, or the volumetric tariff, consumers receive incentives to install distributed generation technologies, such as PV panels, by obtaining reduced network payments that in reality do not correspond to actual or future network cost savings. Looking at the annual payments, consumer 6 would obtain different savings from the PV installation depending on which tariff is applied: the volumetric tariff (105 €/year), Spanish tariff (13 €/year) or efficient tariff (3 €/year).
The obtained results show that volumetric tariffs are particularly harmful in this situation since consumers are highly incentivized to self-generate. This means that the rest of the consumers will have to bear the burden of the costs avoided by this consumer. This situation is both inefficient and inequitable.

5. Conclusions

Electricity tariffs are being reviewed all over the world. The deployment of smart meters and other digital technologies, electrification of transport and building end uses, and decentralized DER massively connected to distribution networks make it indispensable to change the allocation of electricity system costs among users.
This paper revised the principles in which tariffs should be grounded: economic efficiency, equity, and transparency. Together with these principles, we proposed several design objectives that can serve as a benchmark to compare the performance of different network tariff structures.
A new methodology for the allocation of network costs is proposed following the discussed principles and recent tariff proposals. This methodology segregates total network costs into incremental and residual costs. On the one hand, once costs are disaggregated, charges are computed either considering capacity at maximum network utilization times (peak-coincident charges) or fixed (residual charges). The peak-coincident charges are designed to ensure network users receive signals that reflect the costs of their network usage and encourage them to behave in a way that means future network reinforcements and their associated costs are reduced. On the other hand, residual charges are designed to recover all the system costs once peak-coincident charges have been levied. Residual charges should not send any economic signal that would distort efficient consumer responses to cost-reflective charges and energy prices.
Peak-coincident network charges with high locational and time granularity provide efficient signals to incentive price-responsive customers, but, in many jurisdictions, there are legal impediments for the implementation of locational tariffs. Socialization of tariffs between different geographical areas or regions is a current practice in those jurisdictions. While, for residual network charges, several options are discussed in the literature, fixed charges following equity principles discriminating between users by size, wealth, or other similar proxies are the preferred options. The segmentation of users by applying equity principles together with practical implementation issues regarding required data availability to design fixed charges remains an open issue for discussion in future developments.
Finally, the case study provides evidence of the benefits of applying the proposed methodology in comparison to other current practical tariff designs. Volumetric and currently applied tariffs in Spain provide additional incentives to net demand with self-generation and do not signal the parts of the network and the periods of the year where likely future investment would be needed. Therefore, traditional tariffs, as opposed to the efficient tariff proposed in this paper, do not incentivize efficient operational and investment decisions potentially made by responsive customers.

Author Contributions

Conceptualization, J.P.C.-Á. and T.G.S.R.; methodology, N.M.D.; software, N.M.D.; validation, N.M.D.; investigation, N.M.D.; data curation, N.M.D.; writing—original draft preparation, N.M.D.; writing—review and editing, J.P.C.-Á. and T.G.S.R.; visualization, N.M.D.; supervision, J.P.C.-Á. and T.G.S.R.; project administration, J.P.C.-Á. and T.G.S.R. All authors have read and agreed to the published version of the manuscript.

Funding

This research has received funding from the Fundación Iberdrola España through the “Ayudas a la investigación 2019” program.

Conflicts of Interest

The authors declare no conflict of interest.

References

  1. Pérez-Arriaga, I.J. Chapter 8. Electricity tariffs. In Regulation of the Power Sector; Power Systems; Springer: London, UK, 2013; ISBN 978-1-4471-5033-6. [Google Scholar]
  2. Schittekatte, T.; Meeus, L. Limits of Traditional Distribution Network Tariff Design and Options to Move Beyond; Robert Schuman Centre for Advanced Studies Policy Briefs; Florence School of Regulation: Florence, Italy, 2018; ISBN 978-92-9084-613-0. [Google Scholar]
  3. Siano, P. Demand response and smart grids—A survey. Renew. Sustain. Energy Rev. 2014, 30, 461–478. [Google Scholar] [CrossRef]
  4. Pérez-Arriaga, I.J. Utility of the Future. An MIT Energy Initiative Response to an Industry in Transition. Available online: http://energy.mit.edu/wp-content/uploads/2016/12/Utility-of-the-Future-Full-Report.pdf (accessed on 7 March 2019).
  5. Brown, D.P.; Sappington, D.E.M. On the role of maximum demand charges in the presence of distributed generation resources. Energy Econ. 2018, 69, 237–249. [Google Scholar] [CrossRef] [Green Version]
  6. Glachant, J.-M.; Rossetto, N. The Digital World Knocks at Electricity’s Door: Six Building Blocks to Understand Why. Available online: http://cadmus.eui.eu//handle/1814/59044 (accessed on 29 September 2019).
  7. Distribution System Operators Observatory. Overview of the Electricity Distribution System in Europe; Joint Research Centre: Brussels, Belgium, 2018; Available online: http://publications.jrc.ec.europa.eu/repository/bitstream/JRC113926/jrc113926_kjna29615enn_newer.pdf (accessed on 9 July 2019).
  8. United Nations. Paris Agreement. Available online: https://unfccc.int/sites/default/files/english_paris_agreement.pdf (accessed on 24 June 2019).
  9. Directive (EU) 2018/2001 of the European Parliament and of the Council of 11 December 2018 on the Promotion of the Use of Energy from Renewable Sources. Available online: http://data.europa.eu/eli/dir/2018/2001/oj/eng (accessed on 24 June 2019).
  10. ACER Market Monitoring Report 2017—Electricity and Gas Retail Markets Volume. Available online: https://www.acer.europa.eu/Official_documents/Acts_of_the_Agency/Publication/ACER%20Market%20Monitoring%20Report%202017%20-%20Electricity%20and%20Gas%20Retail%20Markets%20Volume.pdf (accessed on 24 June 2019).
  11. Regulatory Policy and Governance: Supporting Economic Growth and Serving the Public Interest; OECD: Paris, France, 2011; ISBN 978-92-64-11656-6.
  12. Rodríguez Ortega, M.P.; Pérez-Arriaga, J.I.; Abbad, J.R.; González, J.P. Distribution network tariffs: A closed question? Energy Policy 2008, 36, 1712–1725. [Google Scholar] [CrossRef]
  13. Burger, S.; Schneider, I.; Botterud, A.; Pérez-Arriaga, I. Chapter 8—Fair, Equitable, and Efficient Tariffs in the Presence of Distributed Energy Resources. In Consumer, Prosumer, Prosumager; Sioshansi, F., Ed.; Academic Press: Cambridge, MA, USA, 2019; pp. 155–188. ISBN 978-0-12-816835-6. [Google Scholar]
  14. Batlle, C. A method for allocating renewable energy source subsidies among final energy consumers. Energy Policy 2011, 39, 2586–2595. [Google Scholar] [CrossRef]
  15. Pollitt, M.G. Electricity Network Charging in the Presence of Distributed Energy Resources: Principles, Problems and Solutions. EEEP 2018, 7. [Google Scholar] [CrossRef]
  16. Strielkowski, W.; Štreimikienė, D.; Bilan, Y. Network charging and residential tariffs: A case of household photovoltaics in the United Kingdom. Renew. Sustain. Energy Rev. 2017, 77, 461–473. [Google Scholar] [CrossRef]
  17. Nijhuis, M.; Gibescu, M.; Cobben, J.F.G. Analysis of reflectivity & predictability of electricity network tariff structures for household consumers. Energy Policy 2017, 109, 631–641. [Google Scholar] [CrossRef]
  18. Schittekatte, T.; Meeus, L. How Future-Proof Is Your Distribution Grid Tariff Design? Policy Briefs 2017/03; Florence School of Regulation: Florence, Italy, 2017. [Google Scholar] [CrossRef]
  19. Gerres, T.; Chaves, J.P.; Martín, F.; Rivier, M.; Gómez, T. The role of nuclear power plants in electricity systems with high RES share. In Proceedings of the IEEE Milan PowerTech, Milan, Italy, 23–27 June 2019. [Google Scholar] [CrossRef]
  20. Mastropietro, P. Who should pay to support renewable electricity? Exploring regressive impacts, energy poverty and tariff equity. Energy Res. Soc. Sci. 2019, 56, 101222. [Google Scholar] [CrossRef]
  21. Barrera, F. Peajes Eléctricos: Una Barrera para la Transición Energética; Frontier Economics: Berlin, Germany, 2019; Available online: https://www.frontier-economics.com/media/3346/frontier-peajes-el%C3%A9ctricos-junio-2019.pdf (accessed on 1 July 2019).
  22. Abdelmotteleb, I.; Gómez, T.; Chaves Ávila, J.P.; Reneses, J. Designing efficient distribution network charges in the context of active customers. Appl. Energy 2018, 210, 815–826. [Google Scholar] [CrossRef]
  23. Bergaentzlé, C.; Jensen, I.G.; Skytte, K.; Olsen, O.J. Electricity grid tariffs as a tool for flexible energy systems: A Danish case study. Energy Policy 2019, 126, 12–21. [Google Scholar] [CrossRef]
  24. Haapaniemi, J.; Haakana, J.; Räisänen, O.; Lassila, J.; Partanen, J. DSO tariff driven customer grid defections—Techno-economical risks for DSO? In Proceedings of the 25th International Conference on Electricity Distribution (CIRED 2019), Madrid, Spain, 3–6 June 2019. [Google Scholar] [CrossRef]
  25. EDP. Tabla Peajes Eléctricos 01–19. Available online: https://www.edpenergia.es/recursos/doc/portal-clientes/20130827/precios/tarifas-electricas-para-empresas.pdf? (accessed on 26 August 2019).
  26. Regulation (EU) 2019/943. Volume 158. Available online: http://data.europa.eu/eli/reg/2019/943/oj/eng (accessed on 15 July 2019).
  27. Directive (EU) 2019/944. Volume 158. Available online: https://eur-lex.europa.eu/eli/dir/2019/944/oj (accessed on 15 July 2019).
  28. Bonbright, J.C. Principles of Public Utility Rates. Available online: http://media.terry.uga.edu/documents/exec_ed/bonbright/principles_of_public_utility_rates.pdf (accessed on 3 July 2019).
  29. Ofgem Introduction on Access and Forward-Looking Charges Significant Code Review. Available online: https://www.ofgem.gov.uk/system/files/docs/2019/09/111_-_working_paper_-_summer_2019_-_intro_note_final.pdf (accessed on 12 December 2019).
  30. Simshauser, P. Distribution network prices and solar PV: Resolving rate instability and wealth transfers through demand tariffs. Energy Econ. 2016, 54, 108–122. [Google Scholar] [CrossRef]
  31. Hoarau, Q.; Perez, Y. Network tariff design with prosumers and electromobility: Who wins, who loses? Energy Econ. 2019. [Google Scholar] [CrossRef]
  32. Borenstein, S. Private Net Benefits of Residential Solar PV: The Role of Electricity Tariffs, Tax Incentives, and Rebates. J. Assoc. Environ. Resour. Econ. 2017, 4, S85–S122. [Google Scholar] [CrossRef] [Green Version]
  33. Trabish, H.K. How Storage Can Help Solve the Distributed Energy ‘Death Spiral’: A New Navigant Paper Lays out Three Examples of How Storage Can Facilitate the Transition to a More Distributed Grid. Available online: https://www.utilitydive.com/news/how-storage-can-help-solve-the-distributed-energy-death-spiral/421160/ (accessed on 9 July 2019).
  34. González, A. (Spanish): Implicaciones de la Continuidad de Suministro en el Diseño de la Tarifa de Red de Distribución. Ph.D. Thesis, Universidad Pontificia de Comillas, Madrid, Spain, November 2014. [Google Scholar]
  35. Van Langen, V. Network Tariffs in Electricity and Gas. Available online: https://www.energy-community.org/dam/jcr:57a0a8a5-e7e8-4a6f-95f4-0c970f04250f/REG102019_ACM.pdf (accessed on 29 March 2019).
  36. Eero, V. Battery Storage Costs and Impact on PV Competitiveness. Available online: http://www.iea-pvps.org/fileadmin/dam/intranet/ExCo/51st_Malaysia/Vartiainen_Battery_Storage_Costs_and_Impact_on_PV_Competitiveness_20180924.pdf (accessed on 9 July 2019).
  37. Ioannis, T.; Tarvydas, D.; Lebedeva, N. Li-ion Batteries for Mobility and Stationary Storage Applications. Available online: https://publications.jrc.ec.europa.eu/repository/bitstream/JRC113360/kjna29440enn.pdf (accessed on 9 July 2019).
  38. BP Energy Outlook 2019. Available online: https://www.bp.com/content/dam/bp/business-sites/en/global/corporate/pdfs/energy-economics/energy-outlook/bp-energy-outlook-2019.pdf (accessed on 9 July 2019).
  39. Hayward, J.A.; Graham, P.W. Electricity Generation Technology Cost Projections: 2017–2050. Available online: https://publications.csiro.au/rpr/download?pid=csiro:EP178771&dsid=DS2 (accessed on 9 July 2019).
  40. Ofgem Targeted Charging Review: Decision and Impact Assessment. Available online: https://www.ofgem.gov.uk/system/files/docs/2019/12/full_decision_doc_formatted_updated9.pdf (accessed on 26 November 2019).
  41. Batlle, C.; Mastropietro, P.; Rodilla, P. Redesigning residual cost allocation in electricity tariffs: A proposal to balance efficiency, equity and cost recovery. Renew. Energy 2020, 155, 257–266. [Google Scholar] [CrossRef]
  42. Borenstein, S. The economics of fixed cost recovery by utilities. Electr. J. 2016, 29, 5–12. [Google Scholar] [CrossRef] [Green Version]
  43. Passey, R.; Haghdadi, N.; Bruce, A.; MacGill, I. Designing more cost reflective electricity network tariffs with demand charges. Energy Policy 2017, 109, 642–649. [Google Scholar] [CrossRef]
  44. Schittekatte, T.; Meeus, L. Introduction to Network Tariffs and Network Codes for Consumers, Prosumers, and Energy Communities; Florence School of Regulation: Florence, Italy, 2018. [Google Scholar] [CrossRef]
  45. CNMC. Propuesta por la que se Establece la Metodología para el Cálculo de los Peajes de Transporte y Distribución de Electricidad. Available online: https://www.cnmc.es/sites/default/files/editor_contenidos/Energia/Consulta%20Publica/01%20Propuesta%20_CIR_DE_002_19_peajes_el%C3%A9ctricos.pdf (accessed on 27 August 2019).
  46. Reneses, J.; Gómez, T.; Rivier, J.; Angarita, J.L. Electricity tariff design for transition economies: Application to the Libyan power system. Energy Econ. 2011, 33, 33–43. [Google Scholar] [CrossRef]
  47. Sauer, P.W. On the Formulation of Power Distribution Factors for Linear Load Flow Methods. IEEE Trans. Power Appar. Syst. 1981, 100, 764–770. [Google Scholar] [CrossRef]
Figure 1. Diagram of the proposed methodology for cost allocation.
Energies 13 03111 g001
Figure 2. Proposed methodology for network cost allocation.
Energies 13 03111 g002
Figure 3. Network usage evolution. Actual network usage in blue and future network usage in orange.
Energies 13 03111 g003
Figure 4. Simplified network model. Gs and Cs represent generators and consumers’ locations, respectively, and red numbers signal the lines.
Energies 13 03111 g004
Figure 5. Load curves of low-voltage consumers in kW.
Energies 13 03111 g005
Figure 6. Diagram of volumetric tariff calculation.
Energies 13 03111 g006
Figure 7. Diagram of Spanish tariff calculation.
Energies 13 03111 g007
Figure 8. Diagram of efficient tariff calculation.
Energies 13 03111 g008
Figure 9. (a) Charges applied to consumer 6. (b) Charges applied to consumer 9. Volumetric tariff in yellow, Spanish tariff in orange, and efficient tariff in blue.
Energies 13 03111 g009
Figure 10. Charges applied to consumer 6 in the next tariff period. Volumetric tariff in yellow, Spanish tariff in orange, and efficient tariff in blue.
Energies 13 03111 g010
Table 1. Low-voltage tariff structure for Spain in 2019. CT (capacity term), ET (energy term), [25].
TariffPeriod 1Period 2Period 3
2.0ACT (€/kW year)38.043426--
ET (€/kWh)0.044027--
2.0DHACT (€/kW year)38.043426--
ET (€/kWh)0.0620120.002215-
2.0DHSCT (€/kW year)38.043426--
ET (€/kWh)0.0620120.0028790.000886