Abstract
Oil price has played a prominent role in oil exporter economies and may also affect energy depletion in oil-dependent countries. Considering asymmetry, the relationship between oil price (OP) and energy depletion has been investigated in the Gulf Cooperation Council (GCC) region from 1970 to 2017. We find asymmetrical positive effects of OP on the energy depletion in the panel of the GCC region. To avoid aggregation biasness in the panel estimates, we also conduct a time-series analysis on each GCC country. We find a positive impact of increasing OP on the energy depletion in six GCC countries, and this effect is found to be elastic in the case of all countries except for Kuwait. Positive effects of decreasing OP on the depletion are also found in all the GCC countries, and these effects are found to be elastic or unit elastic in the case of all countries except Saudi Arabia. Asymmetry in the relationship of oil price and energy depletion is established for Bahrain, Kuwait, and Saudi Arabia in terms of the different magnitude of effects.
1. Introduction
Oil is a primary need of the global economy as a significant energy source for households, industries, and transportation segments. Oil supports macroeconomic performance of oil-dependent countries. Further, oil price (OP) movements affect both oil importer and exporter economies, as increasing oil prices negatively affect the income of the importers by raising the cost of production, and could support the income of oil exporters as well. Mainly, OP changes directly affect the oil-exporting economies because any movement in oil price could have a major effect on the income of oil exporter countries. The literature has corroborated the positive impact of OP on the income and production of the oil-exporting countries and the negative impact on the oil-importing countries [1,2,3,4,5,6,7,8,9,10]. In addition, Saari et al. [11] discussed that rising OP would have an adverse effect on the income distribution of the oil-importing economy.
Moreover, Bodenstein [12] claimed that increasing OP would transfer the wealth from oil importer to exporter economies. Increasing OP could appreciate the currencies of oil exporters. To stabilize the foreign value of currency, traders from oil-importing countries would keep some reserves in the oil exporter countries. In this way, OP may also affect the external balance of exporter and importer countries. A vast literature has probed the impact of OP on the trade and external balance of exporter and importer countries [12,13,14,15,16,17,18,19,20,21,22]. Moreover, the effect of OP has also been investigated on employment and unemployment issues [23,24,25,26,27,28].
The relationship between OP and stock markets is also well explored in the literature [29,30,31,32,33,34,35,36,37,38,39,40,41,42,43]. Like the growth effect, the increasing OP is beneficial for oil exporter economies and may positively affect the stock market, and vice versa. Conversely, increasing oil price can have negative impacts on an oil importer economy by negatively affecting the stock market [29]. Oil price would affect price levels of countries as it is a major part of the cost of production. Inflation may also be affected due to a change in income, which is affected by OP. Hence, the literature explored the impact of OP on the interest rate and inflation [44,45,46,47]. Moreover, OP may affect the energy use and pollution of the countries. Some literature has examined the role of OP on the energy demand and pollution variables [48,49,50,51,52,53,54,55,56,57,58,59].
The impact of OP on energy depletion is a very relevant phenomenon as increasing OP may increase oil rents and would become a reason for over-extraction and depletion of this natural resource. Limited literature investigated the OP and natural resource depletion relationship [60,61,62,63,64]. Othman and Jafari [60] probed the role of OP on oil reserve depletion in Malaysia. They found that, during rising world oil prices (2001–2005), the oil reserves declined sharply. Ellison and Scott [61] argued that the oil market was captured by few suppliers who could develop a depletion plan based on the sensitivity of OP and supply, and changing perception in this regard would change the depletion plan. Guseo et al. [62] discussed the impact of OP on the world oil depletion rate. They found that oil depletion was found high in the 1970 oil shocks, after the Second World War, and in 2007. Campbell [63] claimed that about half of the oil reserve was in five Middle-Eastern countries, and oil shocks motivated these economies to raise the share of their oil supply, which were responsible for increasing depletion rate. Curtis [64] argued that the oil peak in the world resulted in peak globalization in the world. The climate mitigation policies were adopted very late, which led to oil depletion.
In the particular case of the Gulf Cooperation Council (GCC) region, an extensive literature has studied the OP and stock market relationships [29,30,31,32,33,34,35,36,37]. Further, the literature has examined the impact of OP on the income of GCC countries [1], on employment [24], external balance [13], pollution [52], military expenditure [65], personal consumption [66], foreign direct investment [67], government spending [68], fiscal policy [69], the exchange rate [70], remittance outflows [71], and oil demand and energy consumption [72]. No single study investigated the impact of OP on the energy depletion in GCC countries. The literature has substantiated an asymmetrical impact of OP on macroeconomic performance [2,3,4,5]. Hence, OP can also have an asymmetric effect on energy depletion as well. Using Shin et al. [73], this present research investigates the asymmetrical impact of OP on the energy depletion in six GCC countries utilizing a maximum available period of 1970–2017.
2. Methods
We isolate the impact of OP on the energy depletion in the model of the GCC region. Some literature has corroborated the asymmetric effect of OP on different macroeconomic indicators [2,3,4,5,15,16,17,20,29]. Hence, we are taking into account the possible asymmetric relationship between OP and energy depletion in the following way:
EDit is the natural log of energy depletion, which is defined as the value of energy resources divided by reserve lifetime [74]. OPit is the natural log of Organization of the Petroleum Exporting Countries (OPEC) Basket oil price US $ per barrel. The OPPt and OPNt are the partial sum of positive and negative changes in OPt, respectively. The OPPt and OPNt are calculated using Shin et al.’s [73] methodology. i indicates the six GCC countries and t is the maximum available annual time period of 1970–2017. Data on energy depletion are sourced from the World Bank [74] and oil price is sourced from the Government of Saudi Arabia [75]. Equation (1) is targeted to estimate as a panel of six GCC countries altogether to determine the overall impact of OP on energy depletion of the GCC region. Further, Equation (1) is regressed separately for each country to determine the individual impact of OP on the energy depletion of each country separately. Following Shin et al. [73], the time series OPt is converted into OPPt and OPNt as follows:
The OPPt and OPNt are the partial sum of positive and negative changes in OPt. After defining the variables, we apply the Dickey–Fuller generalized least square (DF-GLS) of Elliott et al. [76] to test the unit root problem in the following way:
Equation (4) follows the de-trending procedure () with a null hypothesis (H0) of the non-stationary. After that, we apply the autoregressive distributed lag (ARDL) of Pesaran et al. [77] on Equation (1):
The H0, , can be tested on Equation (5), and its rejection can corroborate the cointegration. The negative from Equation (6) can corroborate the short-run relationship. Then, long-run impacts from Equation (5) and short-run effects from Equation (6) can be estimated. After time series’ analyses, we test the impact of OP on the energy depletion of the whole panel of the GCC region. At first, we test the Fisher-Augmented Dickey and Fuller (ADF) test based on Dickey and Fuller [78] and the Fisher-Phillips and Perron (PP) test based on Phillips and Perron [79] to verify the stationarity in the panel series. ADF and PP equations are as follows:
Equations (7) and (8) show the ADF and PP specification, respectively, which can be applied on the individual time series of each GCC country. Then, estimated probability values from each GCC country’s Equations (7) and (8) can be put in Equation (9) to combine the p-value, with H0: Non-stationary series, as per the methodology of Maddala and Wu [80]. After the panel unit root, we apply the Kao [81] panel cointegration as follows:
We apply the fixed effect model as per Equation (10), and then the stationarity of the residual from Equation (10) can be tested in Equation (11). The stationarity of the residual can be considered for a cointegration in the panel model of Equation (10). Then, the Fisher–Johansen methodology of Maddala and Wu [80] based on Johansen [82] can be applied to verify the panel cointegration, as follows:
The probability values from Trace and Maximum–Eigen tests can be estimated for each GCC country using Equations (12) and (13), respectively, and the combined probability can be estimated using Equation (14) for the GCC panel. Afterward, the Pedroni [83] panel cointegration can also be applied to verify the cointegration from the previous two techniques discussed above, in the following way:
After cointegration tests, we proceeded to calculate the impact of OP on the energy depletion. At first, we utilized the methodology of Pesaran [84] as follows:
Equation (22) is the pooled mean group (PMG) estimation. The impact of OP on energy depletion can be estimated from normalized coefficients . Afterward, we apply the fully modified ordinary least squares (FMOLS) of Pedroni [85], as follows:
The heterogeneous Equation (23) can be regressed. Then, the coefficients can be modified using Equation (24). The long-run effects from PMG and FMOLS can be verified from the dynamic ordinary least squares (DOLS) of Kao and Chiang [86], in the following way:
Equation (25) can be estimated, introducing lead and lag variables of independent variables, and Equation (26) can be used to modify the long-run effects.
3. Results and Discussions
Figure 1 shows the trends of the natural log of oil price and energy depletion of six GCC countries. The energy depletion is found highest in Saudi Arabia and lowest in Bahrain. The energy depletion of UAE, Kuwait, Qatar, and Oman is close to each other during 2005–2017. In 1991, a very sharp decline in energy depletion in Kuwait is observed, which recalled the event of Iraq–Kuwait tension. Iraqi military fired on about 700 oil wells in Kuwait, which was responsible for the low oil production and depletion in 1991. The sharp rises in oil price during 1970–1974 coincide with the sharp rises in energy depletion in all GCC countries. On the other hand, the sharp declines in oil price are also matched with the sharp declines in oil depletion during the 1985–1986, 2009, and 2014–2016 oil price crises. In the oil price crisis of 2009, the oil depletion declines of Saudi Arabia, UAE, and Kuwait are found significantly greater than those of the other GCC countries. It shows the impact of OPEC agreements on the oil production cuts of the OPEC members’ GCC countries. On the other hand, the proportional oil depletion declines are found approximately equal in all GCC countries during the 1985–1986 and 2014–2016 oil price crises. Overall, increasing and decreasing oil price movements coincide with increasing and decreasing energy depletion in most of the years during 1970–2017. In the sample period of 48 years, co-movements of oil price and energy depletion are found in the same direction for 43 years in Saudi Arabia, 45 years in UAE, 40 years in Bahrain, 38 years in Kuwait, 41 years in Oman, and 43 years in Qatar. The co-movements of oil price and energy depletion also show a flexible reserve capacity of oil production in all GCC countries.
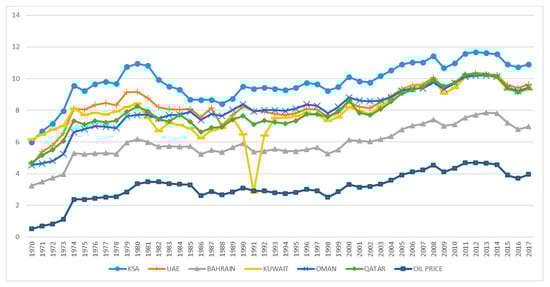
Figure 1.
Trend of oil price and energy depletion.
Table 1 shows the DF-GLS test to verify the order of integration. The OPPt and OPNt variables are the same for all the GCC countries; thus, it is tested once. However, the energy depletion variable is different for each GCC country, so it is tested separately for each country. The results show that all series are nonstationary at the level and stationary at the first difference.

Table 1.
Dickey–Fuller generalized least square (DF-GLS) test.
Table 2 shows the bound test’s F-values estimated from the individual country’s model using Equation (5). To verify cointegration, we use the efficient critical F-values from Kripfganz and Schneider [87]. The estimated F-values show the cointegration in the models of Bahrain, Kuwait, and Qatar at the 10% level of significance and in the models of Saudi Arabia and UAE at 1%. The bound could not corroborate the cointegration in Oman’s model, which is alternately verified through the negative parameter of ECTt−1 [77], reported in Table 3. Hence, we may claim cointegration in all the estimated models of GCC countries. The p-values from diagnostic tests are more than 0.1. Hence, models are econometrically reliable.
Table 2.
Bound test.
Table 3.
Long- and short-run effects.
Table 3 shows that increasing OP has a positive impact on energy depletion in all GCC countries in the long run. Moreover, elasticity is greater than one in the case of all countries except Kuwait. This means that 1% increasing oil price depletes energy more than 1%. Hence, energy depletion is found to be more sensitive to the increasing OP. The decreasing OP also has a positive effect on the energy depletion in all the GCC countries. This means that decreasing OP helps to reduce the energy depletion in the GCC countries. Moreover, this effect is found to be elastic for Bahrain, Kuwait, and UAE, and elasticity is near-unity for Oman and Qatar. This elasticity in the Saudi Arabia model is found to be the least among other GCC countries. This may be due to the reason that the Saudi oil exports’ dependency is highest compared to other GCC countries.
In Qatar’s model, the estimated oil price elasticity of energy depletion indicates the fact that Qatar’s energy export is dominated by liquefied natural gas (LNG) sales. A significant portion of LNG is used to sell with the long-term contracts, which makes the supply and demand less responsive to the global oil price. Additionally, LNG is hard to store, which prevents Qatar’s supply to respond to the oil price. Natural gas and oil markets conceivably have different elasticity, so the country’s energy mix reflects the estimated elasticity. The estimated effect of increasing oil price is found to be elastic on the energy depletion in all GCC countries except Kuwait. The estimated elasticity is found greater in OPEC member GCC countries except Kuwait compared to non-member countries. The elastic effect of increasing oil price may be claimed due to the reason that increasing oil price supports the overall macroeconomic performance of oil-dependent GCC economies. Therefore, these countries are expected to increase the oil production to enjoy more oil rents in the oil price rises’ periods. It also shows a great oil production reserve capacity of these countries, which enable them to increase the oil production in response to oil price rises. However, a low elasticity in the case of Kuwait shows the low capacity of this country to increase the production in response of increasing oil price.
The estimated elasticity of decreasing oil price is found to be less than that of increasing oil price in all GCC countries except Kuwait. Moreover, the elasticity of decreasing oil price is found to be more in the OPEC member GCC countries, except Saudi Arabia, than that of non-member countries. It shows the effect of OPEC production cuts’ agreements among the OPEC member GCC countries in the periods of oil price declines. A low elasticity of oil price decline in Saudi Arabia realizes its heavy dependence on the oil production to sustain the macroeconomic performance of economy. For example, more than 40% of Saudi income and more than 90% of government revenues depend on the oil revenues. Hence, decreasing oil price is a big challenge for the sustainability of the domestic economy. Consequently, heavy oil production cuts in the times of oil price crises are not expected in Saudi Arabia. On the other hand, Saudi Arabia needs to cut the oil production as per OPEC agreements to increase the oil price in the times of oil price declines. Here, perception of a high elasticity is expected in the oil price decline periods. Contrarily, in the 2008 production dispute, poor OPEC countries were asked to cut the oil production in 2008 to increase the oil price but Saudi Arabia walked out on this session. Moreover, in the recent prolonged oil price crisis, it was very hard for the Saudi economy to make larger cuts in oil production to protect the economy from the budget and external account deficits.
After discussions of the elasticity of the effects, we apply the Wald test to test the H0 of symmetry. The estimated chi-square (p-value) is 4.8754 (0.0272), 103.0008 (0.0000), and 3.3028 (0.0768) for Bahrain, Kuwait, and Saudi Arabia, respectively, and H0 is rejected. Hence, the increasing and decreasing OP have an asymmetrical impact on the depletion in Bahrain, Kuwait, and Saudi Arabia. The signs of the coefficient are the same in these countries, but the magnitude of effects is different. The impact of the increasing OP is more than the impact of decreasing OP in Bahrain and Saudi Arabia. However, the coefficient of decreasing OP is more than the coefficient of increasing OP in Kuwait. The estimated chi-square (p-value) is 1.1055 (0.2992), 0.6407 (0.4234), and 0.8798 (0.3483) for Oman, Qatar, and UAE, respectively, and the symmetry is proven for these countries.
In the short-run analyses, negative coefficients of ECTt−1 corroborated the short-run relationships in the models of all investigated countries. The increasing OP has a positive effect on energy depletion in all the GCC countries except Saudi Arabia. Moreover, the price elasticity estimate is found to be unity for Oman and less than one for the rest of the countries. The decreasing OP has a positive effect on energy depletion in Bahrain and Oman and has insignificant effects on the rest of countries. The asymmetric relationship of OP and energy depletion is claimed in all countries except Bahrain and Oman due to the insignificance of any one of the effects. We apply the Wald test, and the estimated chi-square (p-value) is 2.6572 (0.1111) and 7.7008 (0.0055) for Bahrain and Oman, respectively. Hence, the relationship between OP and energy depletion is established to be symmetric in the case of Bahrain and asymmetric in the case of Oman.
After the time series analyses, we carry out the panel analyses to test the overall impact of OP on the energy depletion in the GCC region. At first, we conduct panel unit root analyses using Fisher-ADF and Fisher-PP tests, and the results are reported in Table 4. Both tests confirm that all variables are stationary at the first difference, and we may move to cointegration analyses.
Table 4.
Panel unit root tests.
The Pedroni test, in Table 5, proves the existence of strong cointegration with three within-dimension and three between-dimension statistics. The Kao test also shows the stationary residual series; hence, cointegration is proved. Lastly, the Fisher–Johansen test shows the one and one cointegration vector in each Trace and Max–Eigen tests. Hence, the cointegration is confirmed through all the tests in the relationship between OP and energy depletion in the GCC region.
Table 5.
Panel cointegration tests.
Table 6 shows the impact of OP on the energy depletion in the GCC panel. Both increasing and decreasing OP have a positive impact on energy depletion. Then, we apply the Wald test on the coefficients of OPPit and OPNit. The estimated chi-square (p-value) is 0.2142 (0.8917), 12.4757 (0.0004), and 9.4115 (0.0022) in the estimations of PMG, FMOLS, and DOLS, respectively. Hence, the symmetry is corroborated in the PMG estimates, and asymmetry is proved in the estimates of FMOLS and DOLS. Mixed evidence of symmetry and asymmetry is found in the investigated relationship. First, this may be due to aggregation biasness in the panel estimates. Further, we may conclude the asymmetry in the panel results due to the reason that we find more evidence of asymmetry in the time series analyses as well.
Table 6.
Long-run panel estimates.
4. Conclusions
OP may have a great role in the economies of oil exporters’ countries. Further, it may be responsible for the depletion of energy resources in the world due to the over-extraction of energy to exploit the oil rents. This present research explores the impact of OP on the energy depletion of GCC countries from 1970 to 2017. We corroborate the cointegration in the time and panel data estimates. In the panel estimates, increasing and decreasing OP have a positive effect on energy depletion. The asymmetry is also corroborated with different magnitudes of impacts. The increasing OP has a greater energy depletion effect than the decreasing OP. The panel estimates may carry the aggregation biasness. Hence, we conduct time series analyses for each GCC country separately, to gain more insights into the results.
In the long-run time-series analyses, we discover that increasing OP has a positive impact on the energy depletion in all the GCC countries, with an estimated elasticity more than one in the case of all GCC countries except Kuwait. Therefore, 1% increasing oil price is found responsible for depleting more than 1% energy resources. The decreasing OP also has a positive effect on the energy depletion of all GCC countries with an elasticity more than unity or near to one in the case of all countries except Saudi Arabia. This means that decreasing oil price helps in reducing energy depletion. Saudi Arabia is a more oil-dependent economy compared to other GCC countries. Therefore, decreasing oil price could reduce the energy depletion less than proportionately in Saudi Arabia. The impact of OP on the energy depletion is found to be asymmetrical in terms of the different magnitude of effects in Bahrain, Kuwait, and Saudi Arabia. Further, the impact of increasing OP is found to be more than the impact of decreasing OP in Bahrain and Saudi Arabia. Moreover, symmetry is corroborated in Oman, Qatar, and UAE. Increasing OP has a positive impact on energy depletion in all the GCC countries except Saudi Arabia in the short run and decreasing OP has positive effects on energy depletion in Bahrain and Oman. Further, the short-run relationship asymmetry is found in all GCC countries except Bahrain.
Author Contributions
Conceptualization, H.M. and T.T.Y.A.; methodology, H.M. and T.T.Y.A.; software, H.M. and T.T.Y.A.; validation, T.T.Y.A.; formal analysis, H.M.; investigation, T.T.Y.A.; data collection, H.M.; writing—original draft preparation, H.M. and T.T.Y.A.; writing—review and editing, H.M. and T.T.Y.A.; supervision, T.T.Y.A. All authors have read and agreed to the published version of the manuscript.
Funding
This project was supported by Deanship of Scientific Research at Prince Sattam bin Abdulaziz University Alkharj under the project No. 2020/02/16618.
Conflicts of Interest
The authors declare no conflict of interest.
References
- Nusair, S.A. The effects of oil price shocks on the economies of the Gulf Co-operation Council countries: Nonlinear analysis. Energy Policy 2016, 91, 256–267. [Google Scholar] [CrossRef]
- Lardic, S.; Mignon, V. The impact of oil prices on GDP in European Countries: An empirical investigation based on asymmetric cointegration. Energy Policy 2006, 34, 3910–3915. [Google Scholar] [CrossRef]
- Killian, L.; Vigfusson, R.J. Are the responses of the US economy asymmetric in energy price increases and decreases? Quant. Econ. 2011, 2, 419–453. [Google Scholar] [CrossRef]
- Herrera, A.M.; Lagalo, L.G.; Wada, T. Asymmetries in the response of economic activity to oil price increases and decreases? J. Int. Money Financ. 2015, 50, 108–133. [Google Scholar] [CrossRef]
- Huang, B.N.; Hwang, M.J.; Peng, H.P. The asymmetry of the impact of oil price shocks on economic activity: An application of the multivariate threshold model. Energy Econ. 2005, 27, 455–476. [Google Scholar] [CrossRef]
- Cunado, J.; de Garcia, F.P. Oil prices, economic activity and inflation: Evidence for some asian countries. Q. Rev. Econ. Financ. 2005, 45, 65–83. [Google Scholar] [CrossRef]
- Jimenez-Rodriguez, R.; Sanchez, M. Oil price shocks and real GDP growth: Empirical evidence for some OECD countries. Appl. Econ. 2005, 37, 201–228. [Google Scholar] [CrossRef]
- Jones, D.W.; Leiby, P.N.; Paik, I.K. Oil price shocks and the macroeconomy: What has been learned since 1996. Energy J. 2004, 25, 1–32. [Google Scholar] [CrossRef]
- Kim, S.; Willett, T. Is the negative correlation between inflation and growth real? An analysis of the effects of the oil supply shocks. Appl. Econ. Lett. 2000, 7, 141–147. [Google Scholar] [CrossRef]
- Burbidge, J.; Harrison, A. Testing for the Effects of Oil-Price Rises Using Vector Autoregressions. Int. Econ. Rev. 1984, 25, 459–484. [Google Scholar] [CrossRef]
- Saari, M.Y.; Dietzenbacher, E.; Los, B. The impacts of petroleum price fluctuations on income distribution across ethnic groups in Malaysia. Ecol. Econ. 2016, 130, 25–36. [Google Scholar] [CrossRef]
- Bodenstein, M.; Erceg, C.J.; Guerrieri, L. Oil shocks and external adjustment. J. Int. Econ. 2011, 83, 168–184. [Google Scholar] [CrossRef]
- Metwally, M.M. The effect of the downturn in oil prices on the external surpluses of the GCC countries. Int. J. Energy Res. 1993, 17, 173–182. [Google Scholar] [CrossRef]
- Nanovsky, S. The impact of oil prices on trade. Rev. Int. Econ. 2019, 27, 431–447. [Google Scholar] [CrossRef]
- Ahad, M.; Anwer, Z. Asymmetrical relationship between oil price shocks and trade deficit: Evidence from Pakistan. J. Int. Trade Econ. Dev. 2020, 29, 163–180. [Google Scholar] [CrossRef]
- Baek, J.; Ikponmwosa, M.J.; Choi, Y.J. Crude oil prices and the balance of trade: Asymmetric evidence from selected OPEC member countries. J. Int. Trade Econ. Dev. 2019, 28, 533–547. [Google Scholar] [CrossRef]
- Jibril, H.; Chaudhuri, K.; Mohaddes, K. Asymmetric oil prices and trade imbalances: Does the source of the oil shock matter? Energy Policy 2020, 137, 111100. [Google Scholar] [CrossRef]
- Korhonen, I.; Ledyaeva, S. Trade linkages and macroeconomic effects of the price of oil. Energy Econ. 2010, 32, 848–856. [Google Scholar] [CrossRef]
- Svensson, L. Oil prices, welfare, and the trade balance. Q. J. Econ. 1984, 99, 649–672. [Google Scholar] [CrossRef]
- Rafiq, S.; Sgro, P.; Apergis, N. Asymmetric oil shocks and external balances of major oil exporting and importing countries. Energy Econ. 2016, 56, 42–50. [Google Scholar] [CrossRef]
- Le, T.H.; Chang, Y. Oil Price Shocks and Trade Imbalances. Energy Econ. 2013, 36, 78–96. [Google Scholar] [CrossRef]
- Kilian, L.; Rebucci, A.; Spatafora, N. Oil Shocks and External Balances. J. Int. Econ. 2009, 77, 181–194. [Google Scholar] [CrossRef]
- Keane, M.P.; Prasad, E.P. The employment and wage effects of oil price changes: A sectoral analysis. Rev. Econ. Stat. 1996, 78, 389–400. [Google Scholar] [CrossRef]
- Alkhateeb, T.T.Y.; Mahmood, H.; Sultan, Z.A.; Ahmad, N. Oil price and employment nexus in Saudi Arabia. Int. J. Energy Econ. Policy 2017, 7, 277–281. [Google Scholar]
- Karaki, M.B. Oil Prices and state unemployment. Energy J. 2018, 39, 25–49. [Google Scholar] [CrossRef]
- Altay, B.; Topcu, M.; Erdogan, M. Oil price, output and employment in Turkey: Evidence from vector error correction model. Int. J. Energy Econ. Policy 2013, 3, 7–13. [Google Scholar]
- Michieka, N.M.; Gearhat, R.S. Oil price dynamics and sectoral employment in the US. Econ. Anal. Policy 2019, 62, 140–149. [Google Scholar] [CrossRef]
- Uri, N.D.; Boyd, R. A reexamination of the crude oil price-unemployment relationship in the United States. Energy Sources 1996, 18, 307–321. [Google Scholar] [CrossRef]
- Siddiqui, A.; Mahmood, H.; Margaritis, D. Oil prices and stock markets during the 2014–2016 oil price slump: Asymmetries and speed of adjustment in GCC and oil importing countries. Emerg. Mark. Financ. Trade 2019. [Google Scholar] [CrossRef]
- Nusair, S.A.; Al-Khasawneh, J.A. Oil price shocks and stock market returns of the GCC countries: Empirical evidence from quantile regression analysis. Econ. Chang. Restruct. 2018, 51, 339–372. [Google Scholar] [CrossRef]
- Mokni, K.; Youssef, M. Measuring persistence of dependence between crude oil prices and GCC stock markets: A copula approach. Q. Rev. Econ. Financ. 2019, 72, 14–33. [Google Scholar] [CrossRef]
- Arouri, M.E.H.; Lahiani, A.; Bellalah, M. Oil price shocks and stock market returns in oil-exporting countries: The case of GCC countries. Int. J. Econ. Financ. 2010, 2, 132–139. [Google Scholar] [CrossRef]
- Arouri, M.E.H.; Rault, C. Oil prices and stock markets in GCC countries: Empirical evidence from panel analysis. Int. J. Financ. Econ. 2011, 17, 242–253. [Google Scholar] [CrossRef]
- Arouri, M.E.H.; Lahiani, A.; Nguyen, D.K. Return and volatility transmission between world oil prices and stock markets of the GCC countries. Econ. Model. 2011, 28, 1815–1825. [Google Scholar] [CrossRef]
- Fayyad, A.; Daly, K. The impact of oil price shocks on stock market returns: Comparing GCC countries with the UK and USA. Emerg. Mark. Rev. 2011, 12, 61–78. [Google Scholar] [CrossRef]
- Louis, R.J.; Balli, F. Oil price and stock market synchronization in gulf cooperation council countries. Emerg. Mark. Financ. Trade 2014, 50, 22–51. [Google Scholar] [CrossRef]
- Akoum, I.; Graham, M.; Kivihaho, J.; Nikkinen, J.; Omran, M. Co-movement of oil and stock prices in the GCC region: A wavelet analysis. Q. Rev. Econ. Financ. 2012, 52, 385–394. [Google Scholar] [CrossRef]
- Diaz, E.M.; Molero, J.C.; de Garcia, F.P. Oil price volatility and stock returns in the G7 economies. Energy Econ. 2016, 54, 417–430. [Google Scholar] [CrossRef]
- Basher, S.A.; Haug, A.A.; Sadorsky, P. Oil prices, exchange rates and emerging stock markets. Energy Econ. 2012, 34, 227–240. [Google Scholar] [CrossRef]
- Papapetrou, E. Oil price shocks, stock market, economic activity and employment in Greece. Energy Econ. 2001, 23, 511–532. [Google Scholar] [CrossRef]
- El-Sharif, I.; Brown, D.; Burton, B.; Nixon, B.; Russell, A. Evidence on the nature and extent of the relationship between oil prices and equity values in the UK. Energy Econ. 2005, 27, 819–830. [Google Scholar] [CrossRef]
- Sadorsky, P. Oil price shocks and stock market activity. Energy Econ. 1999, 21, 449–469. [Google Scholar] [CrossRef]
- Faff, R.W.; Brailsford, T.J. Oil price risk and the Australian stock market. J. Energy Financ. Dev. 1999, 4, 69–87. [Google Scholar] [CrossRef]
- Cologni, A.; Manera, M. Oil prices, inflation and interest rates in a structural Cointegrated VAR model for the G-7 countries. Energy Econ. 2008, 30, 856–888. [Google Scholar] [CrossRef]
- Sek, S.K.; Teo, X.Q.; Wong, Y.N. A comparative study on the effects of oil price changes on inflation. Procedia Econ. Financ. 2015, 26, 630–636. [Google Scholar] [CrossRef]
- Misati, R.N.; Nyamongo, E.M.; Mwangi, I. Commodity price shocks and inflation in a net oil-importing economy. OPEC Energy Rev. 2013, 37, 125–148. [Google Scholar] [CrossRef]
- Sultan, Z.A.; Alkhateeb, T.T.Y.; Fawaz, M.M. Empirical investigation of relationship between oil price and inflation: The case of India. Int. J. Energy Econ. Policy 2020, 10, 90–94. [Google Scholar] [CrossRef]
- Apergis, N.; Gangopadhyay, P. The asymmetric relationships between pollution, energy use and oil prices in Vietnam: Some behavioural implications for energy policy-making. Energy Policy 2020, 140, 111430. [Google Scholar] [CrossRef]
- Cheng, C.; Ren, X.; Wang, Z.; Shi, Y. The impacts of non-fossil energy, economic growth, energy consumption, and oil price on carbon intensity: Evidence from a panel quantile regression analysis of EU 28. Sustainability 2018, 10, 4067. [Google Scholar] [CrossRef]
- Eregha, P.B.; Mesagan, E.P. Energy consumption. Oil price and macroeconomic performance in energy dependent African Countries. Appl. Econom. 2017, 46, 74–89. [Google Scholar]
- Balaguer, J.; Cantavella, M. Estimating the environmental Kuznets curve for Spain by considering fuel oil prices (1874–2011). Ecol. Indic. 2016, 60, 853–859. [Google Scholar] [CrossRef]
- Mahmood, H.; Alkhateeb, T.T.Y.; Al-Qahtani, M.M.Z.; Allam, Z.; Ahmad, N.; Furqan, M. Urbanization, oil price and pollution in Saudi Arabia. Int. J. Energy Econ. Policy 2020, 10, 477–482. [Google Scholar] [CrossRef]
- Agbanike, T.F.; Nwani, C.; Uwazie, U.I.; Anochiwa, L.I.; Onoja, T.-G.C.; Ogbonnaya, I.O. Oil price, energy consumption and carbon dioxide (CO2) emissions: Insight into sustainability challenges in Venezuela. Latin Am. Econ. Rev. 2019, 28, 8. [Google Scholar] [CrossRef]
- Mensah, I.A.; Sun, M.; Gao, C.; Omari-Sasu, A.Y.; Zhu, D.; Ampimah, B.C.; Quarcoo, A. Analysis on the nexus of economic growth, fossil fuel energy consumption, CO2 emissions and oil price in Africa based on a PMG panel ARDL approach. J. Clean. Prod. 2019, 228, 161–174. [Google Scholar] [CrossRef]
- Wang, X.; Bai, M.; Xie, C. Investigating CO2 mitigation potentials and the impact of oil price distortion in China’s transport sector. Energy Policy 2019, 130, 320–327. [Google Scholar] [CrossRef]
- Gbatu, A.P.; Wang, Z.; Wesseh, P.K.; Sesay, V.A. How do energy consumption, output, energy price, and population growth correlate with CO2 emissions in Liberia? Int. J. Glob. Environ. Issues 2019, 18, 209–235. [Google Scholar] [CrossRef]
- Raghoo, P.; Surroop, D. Price and income elasticities of oil demand in Mauritius: An empirical analysis using cointegration method. Energy Policy 2020, 140, 111400. [Google Scholar] [CrossRef]
- Chai, J.; Jin, Y. The dynamic impacts of oil price on China’s natural gas consumption under the change of global oil market patterns: An analysis from the perspective of total consumption and structure. Energies 2020, 13, 867. [Google Scholar] [CrossRef]
- Chai, J.; Shi, H.; Zhou, X.; Wang, S. The price elasticity of natural gas demand in China: A meta-regression analysis. Energies 2018, 11, 3255. [Google Scholar] [CrossRef]
- Othman, J.; Jafari, Y. Accounting for depletion of oil and gas resources in Malaysia. Nat. Resour. Res. 2012, 21, 483–494. [Google Scholar] [CrossRef][Green Version]
- Ellison, M.; Scott, A. Learning and price volatility in duopoly models of resource depletion. J. Monet. Econ. 2013, 60, 806–820. [Google Scholar] [CrossRef]
- Guseo, R.; Dalla Valle, A.; Guidolin, M. World Oil Depletion Models: Price effects compared with strategic or technological interventions. Technol. Forecast. Soc. Chang. 2007, 74, 452–469. [Google Scholar] [CrossRef]
- Campbell, C.J. The next oil price shock—The worlds remaining oil and its depletion. Energy Explor. Exploit. 1995, 13, 19–46. [Google Scholar] [CrossRef]
- Curtis, F. Peak globalization: Climate change, oil depletion and global trade. Ecol. Econ. 2009, 69, 427–434. [Google Scholar] [CrossRef]
- Erdogan, S.; Cevik, E.I.; Gedikli, A. Relationship between oil price volatility and military expenditures in GCC countries. Environ. Sci. Pollut. Res. 2020, 27, 17072–17084. [Google Scholar] [CrossRef]
- Mahmood, H.; Zamil, A.M.A. Oil price and slumps effects on personal consumption in Saudi Arabia. Int. J. Energy Econ. Policy 2019, 9, 12–15. [Google Scholar] [CrossRef]
- Mahmood, H.; Alkhateeb, T.T.Y. Foreign Direct Investment, Domestic Investment and Oil Price Nexus in Saudi Arabia. Int. J. Energy Econ. Policy 2018, 8, 147–151. [Google Scholar]
- Metwally, M.M.; Perera, N. The effect of the downturn in oil prices on the relative efficiency of government expenditure in the GCC countries. Int. J. Energy Res. 1995, 19, 639–643. [Google Scholar] [CrossRef]
- El Mahmah, A.; Kandil, M. Fiscal sustainability challenges in the new normal of low oil prices: Empirical evidence from GCC countries. Int. J. Dev. Issues 2019, 18, 109–134. [Google Scholar] [CrossRef]
- Al Rasasi, M. Oil prices and GCC exchange rates. Energy Sources Part. B Econ. Plan. Policy 2017, 12, 344–350. [Google Scholar] [CrossRef]
- De, S.; Quayyum, S.; Schuettler, K.; Yousefi, S.R. Oil prices, growth, and remittance outflows from the Gulf Cooperation Council. Econ. Notes 2019, 48, e12144. [Google Scholar] [CrossRef]
- Alam, M.Q.; Alam, M.S.; Jamil, S.A. Oil demand and price elasticity of energy consumption in the GCC countries: A panel cointegration analysis. Bus. Econ. Horiz. 2016, 12, 63–74. [Google Scholar]
- Shin, Y.; Yu, B.; Greenwood-Nimmo, M. Modelling asymmetric cointegration and dynamic multiplier in an ARDL framework. In Festschrift in Honor of Peter Schmidt: Econometric Methods and Applications; Horrace, W.C., Sickles, R.C., Eds.; Springer Science and Business Media: New York, NY, USA, 2014; pp. 281–314. ISBN 1489980075. [Google Scholar]
- World Bank. World Dev. Indicators; The World Bank: Washington, DC, USA, 2019. [Google Scholar]
- Government of Saudi Arabia. Saudi Arabian Monetary Agency, Annual Statistics 2019; Saudi Arabian Monetary Agency: Riyadh, Saudi Arabia, 2019.
- Elliott, G.; Rothenberg, T.J.; Stock, J.H. Efficient tests for an autoregressive unit root. Econometrica 1996, 64, 813–836. [Google Scholar] [CrossRef]
- Pesaran, M.H.; Shin, Y.; Smith, R.J. Structural analysis of vector error correction models with exogenous I(1) variables. J. Econ. 2001, 97, 293–343. [Google Scholar] [CrossRef]
- Dickey, D.A.; Fuller, W.A. Likelihood ratio statistics for autoregressive time series with a unit root. Econometrica 1981, 49, 1057–1072. [Google Scholar] [CrossRef]
- Phillips, P.C.B.; Perron, P. Testing for a unit root in time series regression. Biometrika 1988, 75, 335–346. [Google Scholar] [CrossRef]
- Maddala, G.S.; Wu, S. A comparative study of unit root tests with panel data and a new simple test. Oxf. Bull. Econ. Stat. 1999, 61, 631–652. [Google Scholar] [CrossRef]
- Kao, C. Spurious regression and residual-based tests for cointegration in panel data. J. Econ. 1999, 90, 1–44. [Google Scholar] [CrossRef]
- Johansen, S. Statistical analysis of Cointegration Vectors. J. Econ. Control. 1988, 12, 231–254. [Google Scholar] [CrossRef]
- Pedroni, P. Panel cointegration: Asymptotic and finite sample properties of pooled time series tests with an application to the PPP hypothesis. Econom. Theory 2004, 20, 579–625. [Google Scholar] [CrossRef]
- Pesaran, M.H.; Shin, Y.; Smith, R. Pooled mean group estimator of dynamic heterogeneous panels. J. Am. Stat. Assoc. 1999, 94, 621–634. [Google Scholar] [CrossRef]
- Pedroni, P. Fully modified OLS for heterogeneous cointegrated panels. Adv. Econom. 2000, 15, 93–130. [Google Scholar]
- Kao, C.; Chiang, M.H. On the estimation and inference of a co-integrated regression in panel data. Adv. Econom. 2000, 15, 179–222. [Google Scholar]
- Kripfganz, S.; Schneider, D.C. Response Surface Regressions for Critical Value Bounds and Approximate p-Values in Equilibrium Correction Models; Economics Department Discussion Papers Series, Paper number 19/01; University of Exeter: Exeter, UK, 2019; Available online: http://people.exeter.ac.uk/RePEc/dpapers/DP1901.pdf (accessed on 12 December 2019).

© 2020 by the authors. Licensee MDPI, Basel, Switzerland. This article is an open access article distributed under the terms and conditions of the Creative Commons Attribution (CC BY) license (http://creativecommons.org/licenses/by/4.0/).