Abstract
Nowadays, electricity market paradigms are constantly changing. On the one hand, the deployment of non-dispatchable renewable energy sources is bringing out the necessity of representing hourly dynamics in medium-term fundamental models. On the other, the promotion of new interconnection capacity and the integration of markets (as is the case of the European market) makes necessary the simultaneous modeling of multiple electricity systems. Thus, the large size of power markets, together with the consideration of uncertainty in some inputs, make it computationally intractable to work rigorously on an hourly detailed time span. Temporal aggregation, integer programming relaxation or less accurate generation modeling are usually employed to obtain reasonable computation times. However, the application of these techniques often leads to infeasible or suboptimal operational outputs. This paper proposes a new soft-linking methodology to meet reliable results from medium-term models, such as hourly prices or aggregated productions, with a feasible and detailed representation of the thermal generation, considering technical constraints and risk aversion. The results of a fundamental model that represents the competitive behavior between market players in a multi-area power system are used as the starting point for the methodology. Then, a post-processing method is applied to optimize and make feasible the thermal portfolio of a market agent. The final output is a feasible hourly scheduling and an ample space for optimization, where the introduction of a strategic term represents the rational behavior of a player who tries to maximize its profit.
1. Introduction
The liberalization of electricity markets over the last decades has highlighted the importance for generation companies to optimize the production of their thermal units in order to maximize profits and be competitive. Power market models have traditionally been used as a supporting tool for this purpose and have proven their effectiveness. However, the accurate representation of current market trends in real size systems has become a great challenge. In particular, there are four main sources of the increasing complexity in electricity market modeling.
First, the maturity status of the onshore and offshore wind generation, together with the recent drop in the price of photovoltaic facilities, are leading to major changes in traditional power mixes. The variability of electricity supply will be accentuated in the near future with an increasing penetration of these renewable energy sources. This trend brings out the need to consider a more detailed time granularity in the horizons of energy models, as well as detailing the flexibility of thermal units [1]. This is especially crucial when trying to represent and assess the behavior of storage (pumping, batteries, etc.) facilities, which are highly influenced by time chronology.
Second, the current market paradigms do not only demand great modeling detail. The energy integration policies adopted in many regions have promoted a notable increase in the interconnection capacities between countries. Additionally, the diversification strategies in markets embraced by some players to cover risks have also contributed to enlarging the simulation dimensions, making it necessary to represent multi-area power systems in order to analyze an electricity market [2]. In particular, the European electricity market is becoming more and more integrated and is now cleared on a multi-country basis.
Third, the mentioned increase in intermittent renewable generation makes it necessary to properly address the technical constraints, costs, and flexibility of thermal units. The fast-ramping ability of gas-fired power plants makes them the best medium-term option to assure a reliable electricity service, covering demand peaks, plant falls and drastic variations in the renewable generation. This fact points out the importance of an accurate representation of the operation of flexible thermal units like combined cycle gas turbines (CCGTs) [3].
Finally, the competitive behavior of generation companies should also be included in energy models. This is relevant both regarding profit maximization and risk aversion. The continuous evolving of energy regulation, the ongoing generation switching, as well as the increasing deployment of intermittent energy resources, bring out the increasing importance of the uncertainty consideration [4]. This means that models have to be run using a number of scenarios of the different risk variables.
These changing market conditions can be represented accurately through the application of short-term methodologies, which allow a rigorous representation of large power systems using a short and detailed time horizon. However, generators, retailers and large consumers also need medium-term tools to optimize the operation of their assets and support the decision-making process, like fuel purchases, hydro-thermal management, emissions allowances trading or financial contracting [5]. In particular, the role of natural gas as a vector in the energy transition towards a renewable mix makes it essential for generation companies to know how to obtain the maximum return on these assets [6].
Despite the continuous computational improvements, the extension of the accurate short-term techniques to longer horizons is computationally intractable. For this reason, modeling simplification is necessary, and some assumptions are carried out in the literature in order to reduce the size of the considered problems. Nevertheless, the combination of high-detail modeling, multiple areas, hourly granularity, and uncertainty consideration at once, is increasingly desired. These aspects are analyzed in depth in Section 2.
This paper proposes a new soft-linking methodology to fill this gap, meeting reliable results from medium-term models, such as hourly prices or aggregated productions, with a feasible and detailed representation of the thermal generation, considering technical constraints and risk aversion.
2. Literature Review
The operation of power systems is a subject widely studied in the literature. The representation and optimization of the hydro-thermal generation has been deeply addressed in order to increase its profitability. For this purpose, several modeling techniques have been developed to reach an accurate performance of the simulation tools.
A suitable example for the rigorous representation of large power systems is the unit commitment (UC) problem. It provides the optimal dispatch of thermal units according to price and demand forecasts. Technical constraints, operating costs, and profit maximization can be easily modelled with this methodology and useful results are obtained in reasonable running times. In most cases of the literature, e.g., [7,8,9,10,11,12,13], UC considers one day to one week time spans in an hourly basis, performing a precise simulation of thermal generation that cannot be extended to longer time horizons.
The representation of the strategic behavior between players in competitive electricity markets is also a problem widely discussed in the literature. A great variety of methodologies have been proposed to address the Nash’s game theory [14] applied to electricity markets [15]. Diverse models, based on the mixed complementary problem [16,17], heuristic techniques [18] or dynamic programming [19] have successfully described competitive behavior in the medium term.
However, market equilibrium tends to be represented as an optimization problem. With this aim, behavior assumptions are made, such as perfect competition [20] or Cournot competition [21]. Both competitions are encompassed by conjectural-variation (CV) models, as well as a wide range of intermediate situations between these two extreme behaviors. Quite accurate simulations of oligopolistic markets can be performed through these models. In [22], a medium-term CV-based model is proposed, where the equivalence of this optimization problem to a market equilibrium problem is also mathematically demonstrated.
Medium-term equilibrium models experience a tight trade-off between modeling detail and run time. Despite the improvements in computational techniques, a completely hourly detail in real size cases with uncertainty consideration is still intractable. Nevertheless, renewable penetration and market integration developments bring out the necessity of a multi-area medium-term modeling in an hourly basis, in order to achieve an adequate representation of the importance of the greater supply variability and the interconnection capacity increase.
Generic formulations are frequently employed in many academic and commercial models for the medium- and long-term representation of energy systems [23,24,25,26,27,28,29,30,31,32,33,34,35,36,37]. These open presentations increase their flexibility and brings custom options to the users. Nonetheless, these formulations are not always followed by a case study to show the real scope of the model. Temporal horizons, thermal unit details or multi-area limitations are not usually fenced when a new model is presented.
Many of these methodologies offer a wide modeling catalogue to perform a meticulous simulation. High granularity in temporal representation, long-term horizons, multi-area representation, integer programming, even the inclusion of uncertainty, are often available in the same model. Nevertheless, it is computationally intractable to consider every technique at a once in a medium- or long-term representation of a real power system.
As an example, Table 1 shows the particularities for each model formulated in [23,24,25,26,27,28,29,30,31,32,33,34,35,36,37], where the difficulties of considering every single accurate modeling technique at once are exposed. It is demonstrated that simplifications are necessary when the time span exceeds short-term horizons.

Table 1.
Modeling simplifications of each case study. IP: Integer Programming.
The uncertainty representation in a detailed medium-term horizon frequently implies to renounce to integer programming and its accurate modeling of the power system operation [38,39]. In fact, integer variables are also relaxed if a high granularity along the whole time span is desired [40,41,42]. Otherwise, if a MIP performance is necessary, time aggregation techniques are usually implemented [30,35], either temporal decoupling [43] or a drastic reduction in the problem size [31]. Other representative examples of the trade-off between modeling detail and computational resolution of medium-term models are illustrated in [29,44,45].
As expected, energy market representations in the long term require the same modeling simplifications. The combination of integer programming with a complete hourly resolution can be hardly afforded even if a tiny power system is considered [46]. Integer variable relaxation and temporal aggregation techniques [37] or a low time granularity [32], are needed if the representation of real size electricity markets is desired. In conclusion, medium- and long-term models cannot afford the whole modeling details at once in an hourly basis.
These cases highlight the need to use temporal aggregation techniques for the representation of large electricity markets in the medium term if a high temporal granularity is desired. Load blocks [47] have been traditionally employed as clustering technique to reduce the consumption of computational resources in hourly time spans. These clusters represents the system through demand levels.
The variability introduced by the penetration of non-dispatchable renewable technologies can be modelled with a load duration curve that characterizes the net demand [48]. This formulation was overcome by the system states [49,50], which ushered the inclusion of multiple system features and introduced cluster-transition concepts to increase the accuracy of the model.
Nonetheless, the chronology between clusters was not taken into account until [51,52], where new constraints were formulated to keep the technical information in the transitions between clusters. In this way, chronological relationships are maintained using system states or enhanced representative periods. Regardless, as every single temporal aggregation method, they sacrifice some detail to gain in resolution time.
The application of these techniques to optimization models often leads to suitable results in the medium-term forecasting of power systems. The methodology proposed in [53] for a medium-term fundamental model based on conjectural variations represents uncertainty in risk variables such as demand, water incomes, wind generation, fuel costs, CO prices and unavailability of thermal units, reaching a great characterization of the hourly prices obtained for the Spanish electricity market as a case study. Nevertheless, it does not offer a feasible hourly scheduling.
The application of integer programming to cases of such a large size and detail as the previously mentioned is computationally intractable in hourly horizon representations. The inclusion of clustering techniques in the unit commitment problem [54,55,56], open the door to extend the time spans of models that work with integer variables, allowing to represent in detail the operation of large energy markets in the medium term.
Moreover, the use of temporary aggregation techniques complicates the representation of the start-ups, since its cost depends on the number of hours that the thermal unit has been offline. The representation of this cost as a single step [56] does not provide a great detail. However, the formulation of [54] seems to overcome this problem, but the representation by centroids will always result in a loss of the real variability existing between the elements that integrate the cluster.
In [57], a new methodology is proposed in order to preserve the variability between hours in the performance of a medium-term model that considers system states. The use of statistical techniques results in a notable improvement in the representation of the hourly prices of the electricity market. Nevertheless, their use cannot be extrapolated to the production outputs. In turn, it would not solve the problem of the hourly infeasibilities either, which appears when the problem size or the uncertainty consideration oblige to use relaxed variables if reasonable run times are sought.
Integer programming relaxation is widespread in medium-term models. The use of continuous variables provide differentiability, exploited by powerful current solvers to solve large LP and QC problems without the consuming too much time or computing resources. However, its utilization means a loss of fidelity of results because of its acceptance of fractional values as levels of decision variables like the commitment status or the start-ups and shut-downs of thermal units. For this reason, some outputs are far from the real behavior of the power system.
Continuous variables allow partial commitment status for thermal units, as well as non-integer internalization of the costs of start-ups and shut-down processes. This means that production results and hourly costs cannot always be extrapolated to reality. However, since a minor detail perspective such as a monthly vision, some outputs of these models like productions, incomes and costs are quite close to the real values for each player, being a useful information for generation companies.
According to the high usefulness of these results for companies and their approximation to real values, a novel post-processing method is proposed in this paper in order to obtain a feasible hourly scheduling for the thermal generation portfolio of a market player. The scope of this methodology is to overcome the mentioned gaps of the existing models in the literature, being flexible to be applied to several medium- or long-term simulation tools. The main contributions of this paper are:
- A new soft-linking methodology to meet the advantages of the accurate market representation of medium-term models, with the detailed and feasible schedules of the short-term modeling, is proposed. The market equilibrium of real-size multi-area power systems, where players have a competitive behavior, is represented under the consideration of uncertainty. In turn, the infeasible outputs from simplification techniques are rectified and hourly dynamics are properly captured.
- This methodology is opened to probabilistic considerations and risk management. The inclusion of these assumptions in the method returns valuable results for a market player, identifying the most profitable hours to place its production according to the technical constraints of its thermal units and the margins in which its sales are framed.
- The proposed methodology is flexible and allows the combination of the detailing considerations that the medium-term models cannot assume at once. In agreement with economic and technical constraints, this method can group low productions into thermal units with higher operation levels, beyond obtaining a feasible scheduling. This flexible processing scheme can reach the integrated optimization of a entire thermal portfolio if desired.
3. Methodology
3.1. Overview
As previously discussed, modeling simplifications are usually assumed in medium- and long-term models. Temporal aggregation, integer programming relaxation or less accurate modeling are used to achieve computational feasibility. Furthermore, risk representation notably increases the complexity of the problem. Considering uncertainty is more difficult the longer the horizon is, either by stochastic programming or Monte Carlo simulations.
This section proposes a methodology to harmonize the performance of a medium-term model, subject to modeling simplifications, with short-term techniques which bring a detailed representation of power markets operation.
3.1.1. Medium-Term Fundamental Model
The methodology takes as inputs the high-reliable outputs from a medium-term market model. To this end, a medium-term fundamental market model will be solved. This model looks for a detailed representation of the operation of an electricity market, considering its regulation framework and technical constraints. The main features of this kind of models are described below:
- As mentioned above, this paper considers a market based on a multi-area system. The model should include every single thermal unit, hydro reservoirs and non-dispatchable generation technologies, as well as energy storages.
- It is also desirable a properly representation of the interconnection facilities, both between the considered areas, and with the external regions adjacent to the studied systems.
- Furthermore, market agents must be considered, since it is necessary to simulate the competitive behavior of the players to reach an accurate performance of the operation in the power system.
- This rigorous modeling should be complemented with uncertainty representation to capture the risks associated with some generation technologies or supply contract compliance.
- Given the changing current market trends, where non-intermittent generation is rapidly increasing, a time representation as closely to hourly modeling would be desirable.
Generally, some simplifications are needed in order to make these models tractable from a computational point of view. First, integer programming relaxation is typically needed, and this relaxation collaborate in getting good price signals, since the use of integer programming only reflects the variable costs of the units that are committed, when the dual variables which represent the prices are obtained. Secondly, the application of time aggregation or selection techniques is also required, either by aggregating similar hours in time blocks (and consequently losing the chronology), or with the selection of prototypical days or weeks. Either simplification is able to obtain accurate aggregated results (such as weekly or monthly productions) but will fail obtaining feasible and realistic hourly operations. Finally, some simplifications are needed regarding thermal units, as detailed start-up costs depending on the time that the unit has been offline.
The proposed methodology will be tested with a particular medium-term model, but the formulation is open to the consideration of any medium- or long-term model, whose operation results are desired to be made feasible and optimal on an hourly basis.
3.1.2. Post-Processing Methodology
Once the results of the medium-term model are obtained, they are used as an input data by the post-processing method, which provides a detailed, accurate, and feasible thermal schedule. The methodology will be stated from the point of view of a thermal agent trying to obtain a feasible operation of its thermal portfolio. This feasibility process is formulated as an optimization problem, which responds to the rational behavior of a player that wishes to maximize its profit considering risk aversion. The methodology uses as input data the expected hourly prices and the expected productions of the thermal portfolio through a considered time span. It is important to note that these results respond to a rational infrastructure management, like hydro reservoirs, fuel storage, maximum number of start-ups, minimum annual operation hours etc. These expected productions are the aggregated values of each thermal unit included in the portfolio. The compliance of the production goals has a certain flexibility degree, according to a strategic term that could be adjusted by the market agent. Hence, the optimization process can only consider some clearance to the production targets to avoid infeasibilities, or it can have a more flexible character, in which a redistribution of productions between units is allowed. It will depend on the strategic term, that can be easily determined by the market player according to extra operational cost, logistics, opportunity costs and any other desired consideration.
The next section describes the mathematical formulation of the methodology. Its nomenclature is included in a glossary at the end of the document. Upper-case letters are used for denoting parameters and sets, while lower-case letters denote variables and indexes. Hourly intervals are considered for unit consistency.
3.2. Mathematical Formulation
The post-processing method is presented as an optimization problem in which a player wishes to maximize its profits, adjusting a given production of its thermal units. In addition to this input, an hourly price market forecast throughout the considered time span is also taken as an input. This time horizon is flexible, being able to cover days, weeks, or even months.
The objective function of the maximize optimization problem is shown below. It is subject to the restrictions formulated along this section:
3.2.1. Production Costs
The production cost of the thermal units are modelled as a quadratic function of the power output:
This formulation is more accurate than the simplified linear production costs which are taken in [9,12,56]. However, it is less detailed than the piecewise approximation of [7], where the use of binary variables allows the non-convex and non-differentiable variables costs of the thermal units to be segmented and adjusted with high accuracy.
The choice of a quadratic function is based in the power of the current solvers to work with MIQCPs and prevent the MILP problem from slowing down with a big number of binary variables, whose resolution requires a long run time. Besides, it constitutes a high-accurate approximation to the actual cost function.
3.2.2. Start-Up and Shut-Down Costs
The exponential nature of the start-up cost function, where cost increases with the amount of hours that the unit has been offline, is usually represented by a stairwise approximation, as Figure 1 illustrate, or simplified to a single step cost [9,56].
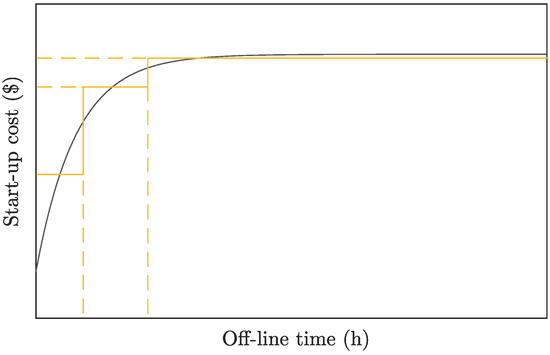
Figure 1.
Stairwise approximation of the non-linear start-up cost function.
According to the advantages of the formulation of [12] over those of [10], the equations of [12] are chosen to represent the behavior of the start-ups, consuming less computational resources:
Regarding shut-downs costs, its modeling is widely extended as a fixed cost:
3.2.3. Diverting Target Production Costs
Diverting costs are not a real cost, but the way to model the possible transfer of production targets between the thermal groups, as a result of making the problem feasible (moving production targets that are below the minimum power outputs) or optimizing profits (moving productions targets from a group that would start for a few hours to one that is committed).
Note that the definition of the diverting strategic term will affect the optimization behavior, from a high where the production targets of each unit are respected, to a equal to zero where only the total production target is respected. These events are detailed in Section 3.2.4 and analyzed in the case study proposed in Section 4.2.
3.2.4. Production Adjustment Equations
The post-processing method implements two balance equations in order to represent the strategic management of the expected production targets:
Equation (9) always respects the total aggregated production target, , of the set of thermal units considered in the post-processing problem.
Additionally, Equation (10) make it possible to overcome unfeasible data for the production targets of each thermal unit, , like production targets which are below the minimum power output as the result of using relaxed variables in the medium-term fundamental model. In turn, this equation also gives versatility to the profit optimization. The considered time span will depend on the reliability of the productions obtained with the medium-term model, frequently achieving solid values when the aggregation exceeds one week.
Variables and distribute production targets among the set of thermal units, to a greater or lesser extent depending on the value of , which penalizes transfers in the objective function. If high values are assigned to , the model will always try to respect the objective production of each unit , relocating productions with the sole purpose of avoiding infeasibilities. On the other hand, if is set to zero, transfers are free and the operation of the portfolio increases its flexibility. In this case, is ignored and the greatest possible profit, considering , is obtained after the optimization.
This parameter opens the door to the analysis of different situations and strategic behaviors in the management of a thermal portfolio belonging to a generation company. The allocation of moderate values would allow from transfer few MWh to avoid that a thermal unit stretches its production at some hours that are not so profitable, to the possibility of preventing a unit from starting to be working for only one hour or similar.
The introduction of this strategic term refers to the internalization of some operation, logistic and opportunity costs that can not be considered otherwise. In that way, the post-processing method will naturally avoid the inefficiencies mentioned above, as well as return a feasible thermal scheduling. All of these events are analyzed in the case studies proposed in Section 4.
3.2.5. Basic Operating Constraints
These equations determine the chronological relationship between the hourly periods, defining the logic between commitments and startups/shutdowns throughout the time span:
Note that it is not necessary to formulate as binary variable. Its behavior is defined by differences between binaries and the only values that can be taken are 0 or 1.
Finally, the operating constraints of the thermal units are included, limiting their hourly production between its minimum and maximum power outputs when they are committed.
4. Case Study and Results
In order to show the usefulness of the methodology presented in this paper, a real size case study of an agent that wishes to make a feasible scheduling and optimize the production of four CCGTs in a medium-term horizon is analyzed. Section 4.1 describes the case study, as well as the origin of the inputs needed in the post-processing method. Section 4.2 shows the results of the application of this methodology. This section also presents three cases where the value of the diverting penalty is analyzed, representing a combined profit optimization and feasible scheduling post-processing.
4.1. Presentation of the Case Study and Its Medium-Term Fundamental Model
In this case study, the production of four CCGTs belonging to a generation company operating in the Iberian electricity market (MIBEL) will be made feasible and optimized. In the first phase of the methodology, a medium-term model is run. This model follows the mathematical formulation proposed in [22], representing the equilibrium between markets players through conjectural variations. Its validity to determine the market equilibrium as an optimization problem is also proved in [22], where it is demonstrated that if the cost function is convex and there are non-negative conjectures, the optimization problem is equivalent to an equilibrium problem.
This formulation was summarized in [53] as follows. The competitive behavior in the market is represented as an oligopoly, where the conjectured-price, , of each market player i is considered as known. The function that relate the production cost for each player and area a, , with its electricity generation, , during the period p, is linear or quadratic. The electricity price, , is determined as the dual variable of the power balance constraint, which matches the total energy output with the demand, . Finally, technical constraints, , are shorten in a generic formulation:
subject to:
The main technical constraints applied to the thermal units are those related to the commitment status, maximum and minimum power outputs, operational costs, start-up and shut-down costs, maximum number of start-ups within a period, unplanned unavailability and maintenance schedules. Regarding river basins, the turbine and pumping capacities are modelled, as well as efficiency, storage capacity, inflows, topology and the upper and lower water bounds to guarantee a safety operation.
This model is used in an accurate representation of the Spanish, Portuguese and French electricity markets and its interconnections. Every single thermal unit is considered, as well as hydro reservoirs and the non-dispatchable renewable energy sources. The horizon comprises three years on an hourly basis. After the market clearing determination, the model also checks technical issues (such as network constraints), affairs as the Transmission System Operator does, committing some thermal units to guarantee the stability of the grid, if required.
In order to obtain reasonable run times, integer programming relaxation is applied and the time aggregation technique of system states [49] is used. This clustering process take into account different conditions of the power system and aggregates hours according to its corresponding thermal gap. The transition between clusters is considered with this method, but the equations to keep chronology are not included. In this way, 940 time steps represent the whole time span of three years.
The combination of these modeling techniques leads to very acceptable run times. On the other hand, it presents the drawback of being possible to obtain technically infeasible results. Besides, the representation of detailed thermal costs (as it is the case of start-up costs) is simplified with respect to the proposed post-processing methodology. Table 2 shows a comparison between a three-year case of the described fundamental model, with the post-processing method proposed in Section 3, applied to a four thermal-unit case through a 31-day time span on an hourly basis. The cases analyzed in this paper have been run in a computer Intel Xeon CPU E5-2660 v3 @2.60 GHz with 40 logical processors and 144 GB of installed RAM memory running 64-bit Windows Server 2012 R2, solved with the commercial solver CPLEX 12.10 [58] under GAMS [59].
Table 2.
Problem sizes after the performance of CPLEX presolve.
Regarding the representation of uncertainty, a Monte Carlo simulation has been carried out. A total of 300 cases have been considered to represent different scenarios for the following risk factors: Power demand, hydro conditions, wind generation, solar generation, coal prices, natural gas prices, CO emissions allowance prices and unplanned unavailability of thermal units.
Given the great variety of risk variables considered in the simulation, the spatial interpolation technique proposed in [60] has been applied, making it possible to obtain a high accuracy in the results with only 300 cases evaluated. Furthermore, the determination of correlations between variables and the scenario creation has been carried out in collaboration with a major utility present in the Spanish electricity market.
This Monte Carlo simulation, carried out with the medium-term model described above, has been used to obtain the necessary input data for the proposed methodology. The corresponding results needed in the post-processing method are shown in Table 3 and Figure 2, which gather the expected thermal productions and the electricity prices, respectively, for the four CCGTs considered in this case study along the 31 day-hourly time span. However, the real scope of this Monte Carlo simulation is longer.
Table 3.
Expected production of the thermal units considered in the post-processing case study.
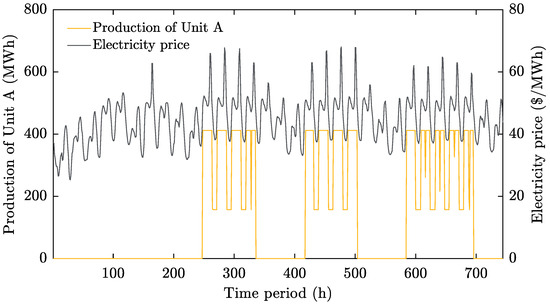
Figure 2.
Hourly matching prices of the Spanish market obtained with the fundamental model of Section 4.1 and response of Unit A to its production target with a strategic term of 500 $/MWh as used in Case 1.
It is also important to mention that these outputs correspond to the mean value of the distribution function. Nevertheless, either mean values or those results that belong to any of the contemplated centiles (P10, P50, P90, etc.) can be easily handled with the post-processing methodology proposed in this paper.
Technical data of the thermal units considered in the post-processing are shown in Table 4 and Table 5. Start-up costs of the thermal units are modelled with three steps, as mentioned in [1,3]. This representation improves the unique start-up cost of the medium-term model. In turn, the formulation described in Section 3.2.2, easily allows an increment of steps if a more accurate simulation is desired.
Table 4.
Technical data of the thermal units and status in the first hour of the considered time span.
Table 5.
Start-up parameters of the thermal units.
4.2. Analysis of Feasible Schedules Obtained with the Post-Processing Methodology
The application of the post-processing method after the performance of a medium-term model, like the one described in Section 4.1, offers many advantages. It achieves a feasible thermal scheduling, keeping reliable and quite valuable medium-term information, such as the hydraulic generation. In turn, it also improves the representation of the technical operational constraints, since the medium-term model only uses a single-step start-up cost. This phase is more computationally flexible, being possible to approach the start-up cost to a multi-step function, which provides a much more accurate modeling.
Additionally, it is possible to introduce a strategic term to consider hidden operation preferences, allowing a more realistic management of these assets by a market player. These operational priorities can be easily quantified in economic terms and give the chance of transferring some production targets between the thermal units of the portfolio. In this section, three case studies will be considered to analyze the impact of the strategic term, , on the thermal scheduling:
- The first case assigns a value of 500 $/MWh to . In this case, this number is high enough to avoid divertion of production targets between thermal units. Table 3 is respected without any flexibility. This situation would only allow non-zero values of and when there are infeasible production targets, like operations below the minimum power output.
- The second case applies a value of 100 $/MWh to . In this case, the strategic term avoids non- expected operational behaviors, such as the commitment of a thermal unit for operating during a single hour.
- The third case shows a global optimization of the total production target of the portfolio. The assignment of 0 $/MWh to allows the optimal distribution of in order to maximize the profit.
It is important to keep in mind that the strategic divertion term behavior will depend on the hourly price forecast, because its higher or lower levels would promote or damp the transfers in the objective function. This strategic term can be easily assigned by generation companies, which know in depth its operation, logistic, and opportunity costs. In turn, the company can also play with this value to analyze different situations and risk scenarios.
Table 6 shows the outputs of the performance of the three cases. The comparison is carried through the obtained profits. As expected, the post-processing method reaches a greater profit when there is a higher availability to transfer productions between units, moving them to the most profitable hours and avoiding useless start-ups and the imposition of quantities that are far from the optimum values for this case. The gap established for the three cases is 1%. This value is accurate enough, but it is important to note that there is a trade-off between the desired accuracy and the run time and computational resources. Thus, the higher the number of thermal units involved in the post-processing methodology is, the higher the run time to reach an integer solution will be.
Table 6.
Results of the evaluation of the three cases.
In Case 1, every single production target is respected according to the high value assigned to . On the contrary, the reduced production target of Unit D is quickly transferred to other units when is relaxed in Case 2. The optimum value is reached moving 190 MWh from Unit D to Unit A. Finally, the total optimization of Case 3 shows that the optimal solution of the problem is to use each thermal unit along its most profitable hours. In this case, 79,155 MWh and 44,258 MWh are yielded by Unit B and Unit C, being 5870 MWh assumed by Unit A and 117,543 MWh by Unit D.
All of these cases provide a real picture of the detailed operation of the thermal portfolio. As it was expected, its production responds to the electricity price peaks dynamics, considering an optimal management of start-ups and shut-downs to maximize profit. Figure 2 shows an example of feasible scheduling, where Unit A maximizes its benefit according to the expected production gathered in Table 3. The thermal schedule represented in this figure corresponds to the results of Case 1, where the strategic term is high enough to avoid transfers of production targets.
For the sake of simplicity, only one thermal unit has been included in Figure 2, allowing an easier interpretation of the operational behavior. Unit A, as well as the other thermal units, sets its production at its maximum power output during the most profitable hours. In addition, it usually reduces its production to the minimum output when prices drop, incurring in shut-downs if electricity peaks are too separated in time.
5. Conclusions
The changing reality of current electricity markets highlights the importance of a proper representation of power systems. The increasing variability of generation, due to the deployment of non-dispatchable RES, and the interconnection promotions between areas as a result of integration policies, points out the necessity of simulating multi-area power system on an hourly basis. Nowadays, electricity market models require a high level of detail and time granularity not only in the short term, but also in the medium term, especially in order to represent a real management of energy storage facilities. This fact, together with the uncertainty consideration in some input data, makes it imperative to simplify medium-term models to increase their computational tractability. However, these simplifications lead to infeasible and/or suboptimal operational outputs for thermal units.
A new soft-linking methodology to overcome these problems has been proposed in this paper. This method combines the advantages of medium-term models, selecting high reliable results from these tools, and using them in a post-processing phase. This step provides a feasible thermal scheduling for a well-detailed generation portfolio. In this way, the infeasible outputs obtained with the medium-term model as a consequence of the implemented simplifications, such as time aggregation, integer programming relaxation or less accurate modeling, are corrected.
In addition, the methodology allows the use of a strategic term, providing an alternative to jointly optimize the thermal generation portfolio of a market agent. This term improves the single representation of technical constraints, allowing the assignment of logistic and opportunity costs, as well as the inclusion of hidden flexibility possibilities in the operation of thermal units. The formulation of the post-processing phase as an optimization problem also contributes to recreating the competition in power markets, where each player tries to maximize its profit. The whole methodology has been tested with a realistic case study, showing its validity.
Author Contributions
Conceptualization, L.M., A.B. and J.R.; methodology, L.M., A.B. and J.R.; software, L.M.; validation, L.M., A.B. and J.R.; formal analysis, L.M.; investigation, L.M.; resources, L.M.; data curation, L.M.; writing—original draft preparation, L.M.; writing—review and editing, L.M., A.B. and J.R.; visualization, L.M.; supervision, A.B. and J.R. All authors have read and agreed to the published version of the manuscript.
Funding
This research received no external funding.
Conflicts of Interest
The authors declare no conflict of interest.
Abbreviations
The following abbreviations are used in this manuscript:
| CCGT | Combined Cycle Gas Turbine |
| CV | Conjectural Variation |
| IP | Integer Programming |
| MIBEL | Iberian Electricity Market |
| MILP | Mixed Integer Linear Programming |
| MIQCP | Mixed Integer Quadratically Constrained Programming |
| RES | Renewable Energy Sources |
| UC | Unit Commitment |
Nomenclature
Indexes & Sets
| Set of indexes of generating units | |
| Set of indexes of start-up segments | |
| Set of indexes of hourly periods of the time span |
Parameters
| Target production of an individual unit g throughout the time span T (MWh) | |
| Total target production of the portfolio G throughout the time span T (MWh) | |
| Strategic term for diverting target production between thermal units ($/MWh) | |
| Linear variable cost of unit g ($/MWh) | |
| Fixed cost of unit g ($/h) | |
| Quadratic variable cost of unit g ($/MWh) | |
| Shut-down cost of unit g ($) | |
| Start-up cost for the start-up type s of unit g ($) | |
| Price of energy in period t ($/MWh) | |
| Maximum power output of unit g (MW) | |
| Minimum power output of unit g (MW) | |
| Minimum time period that unit g must be offline for the start-up type s (h) | |
| Hourly periods that unit g has been offline in the first period t of the time span T (h) | |
| Commitment status of unit g in the first period t of the time span T |
Variables
| Diverting target production cost of unit g along the time span T ($) | |
| Production cost of unit g in period t ($) | |
| Shut-down cost of unit g in period t ($) | |
| Start-up cost of unit g in period t ($) | |
| Start-up type s of unit g in period t | |
| Increase in target production of unit g due to divertions along the time span T (MWh) | |
| Decrease in target production of unit g due to divertions along the time span T (MWh) | |
| Power output above the minimum output of unit g in period t (MW) | |
| Commitment decision of unit g in period t | |
| Start-up decision of unit g in period t | |
| Shut-down decision of unit g in period t |
References
- Gonzalez-Salazar, M.A.; Kirsten, T.; Prchlik, L. Review of the operational flexibility and emissions of gas-and coal-fired power plants in a future with growing renewables. Renew. Sustain. Energy Rev. 2018, 82, 1497–1513. [Google Scholar] [CrossRef]
- Ahmadi-Khatir, A.; Conejo, A.J.; Cherkaoui, R. Multi-area unit scheduling and reserve allocation under wind power uncertainty. IEEE Trans. Power Syst. 2013, 29, 1701–1710. [Google Scholar] [CrossRef]
- Prina, M.G.; Fanali, L.; Manzolini, G.; Moser, D.; Sparber, W. Incorporating combined cycle gas turbine flexibility constraints and additional costs into the EPLANopt model: The Italian case study. Energy 2018, 160, 33–43. [Google Scholar] [CrossRef]
- Peng, C.; Lei, S.; Hou, Y.; Wu, F. Uncertainty management in power system operation. CSEE J. Power Energy Syst. 2015, 1, 28–35. [Google Scholar] [CrossRef]
- Reneses, J. Analisis de la Operacion de los Mercados de Generacion de Energia Electrica a Medio Plazo. Ph.D. Thesis, Comillas Pontifical University, Madrid, Spain, 2004. [Google Scholar]
- Martinez, F.; Villar, J. Profitability Analysis of Spanish CCGTs under Future Scenarios of high RES and EV Penetration. In Proceedings of the 2019 16th International Conference on the European Energy Market (EEM), Ljubljana, Slovenia, 18–20 September 2019; pp. 1–5. [Google Scholar]
- Arroyo, J.M.; Conejo, A.J. Optimal response of a thermal unit to an electricity spot market. IEEE Trans. Power Syst. 2000, 15, 1098–1104. [Google Scholar] [CrossRef]
- Nowak, M.P.; Römisch, W. Stochastic Lagrangian relaxation applied to power scheduling in a hydro-thermal system under uncertainty. Ann. Oper. Res. 2000, 100, 251–272. [Google Scholar] [CrossRef]
- Arroyo, J.M.; Conejo, A.J. Modeling of start-up and shut-down power trajectories of thermal units. IEEE Trans. Power Syst. 2004, 19, 1562–1568. [Google Scholar] [CrossRef]
- Carrión, M.; Arroyo, J.M. A computationally efficient mixed-integer linear formulation for the thermal unit commitment problem. IEEE Trans. Power Syst. 2006, 21, 1371–1378. [Google Scholar] [CrossRef]
- Ostrowski, J.; Anjos, M.F.; Vannelli, A. Tight mixed integer linear programming formulations for the unit commitment problem. IEEE Trans. Power Syst. 2011, 27, 39–46. [Google Scholar] [CrossRef]
- Morales-España, G.; Latorre, J.M.; Ramos, A. Tight and compact MILP formulation for the thermal unit commitment problem. IEEE Trans. Power Syst. 2013, 28, 4897–4908. [Google Scholar] [CrossRef]
- Knueven, B.; Ostrowski, J.; Watson, J.P. A novel matching formulation for startup costs in unit commitment. Optim. Online 2017, 12, 225–248. [Google Scholar] [CrossRef]
- Nash, J.F. Equilibrium points in n-person games. Proc. Nat. Acad. Sci. USA 1950, 36, 48–49. [Google Scholar] [CrossRef]
- Ferrero, R.; Shahidehpour, S.; Ramesh, V. Transaction analysis in deregulated power systems using game theory. IEEE Trans. Power Syst. 1997, 12, 1340–1347. [Google Scholar] [CrossRef]
- Hobbs, B.F.; Helman, U. Complementarity-based equilibrium modeling for electric power markets. In Modeling Prices in Competitive Electricity Markets; Bunn, D.W., Ed.; Wiley: New York, NY, USA, 2004. [Google Scholar]
- Gabriel, S.A.; Siddiqui, S.A.; Conejo, A.J.; Ruiz, C. Solving discretely constrained Nash–Cournot games with an application to power markets. Netw. Spat. Econ. 2013, 13, 307–326. [Google Scholar] [CrossRef]
- Tesser, M.; Pages, A.; Nabona, N. An oligopoly model for medium-term power planning in a liberalized electricity market. IEEE Trans. Power Syst. 2008, 24, 67–77. [Google Scholar] [CrossRef]
- Scott, T.J.; Read, E.G. Modelling hydro reservoir operation in a deregulated electricity market. Int. Trans. Oper. Res. 1996, 3, 243–253. [Google Scholar] [CrossRef]
- Shrestha, G.; Pokharel, B.K.; Lie, T.T.; Fleten, S.E. Medium term power planning with bilateral contracts. IEEE Trans. Power Syst. 2005, 20, 627–633. [Google Scholar] [CrossRef]
- Barforoushi, T.; Moghaddam, M.P.; Javidi, M.; Sheik-El-Eslami, M. A new model considering uncertainties for power market. Iranian J. Elect. Electron. Eng. 2006, 2, 71–81. [Google Scholar]
- Barquin, J.; Centeno, E.; Reneses, J. Medium-term generation programming in competitive environments: A new optimisation approach for market equilibrium computing. IEE Proc. Gener. Transm. Distrib. 2004, 151, 119–126. [Google Scholar] [CrossRef]
- Helistö, N.; Kiviluoma, J.; Ikäheimo, J.; Rasku, T.; Rinne, E.; O’Dwyer, C.; Li, R.; Flynn, D. Backbone—An Adaptable Energy Systems Modelling Framework. Energies 2019, 12, 3388. [Google Scholar] [CrossRef]
- Ravn, H.F.; Munksgaard, J.; Ramskov, J.; Grohnheit, P.; Larsen, H. Balmorel: A Model for Analyses of the Electricity and CHP Markets in the Baltic Sea Region; Technical Report. Balmorel Project: Denmark, 2001. Available online: http://www.balmorel.com/index.php/balmorel-documentation (accessed on 17 March 2012).
- Calliope: A Multi-Scale Energy Systems (MUSES) Modeling Framework. Available online: https://calliope.readthedocs.io/en/v0.5.3/ (accessed on 17 March 2020).
- Hobbs, B.F.; Rijkers, F.A. Strategic generation with conjectured transmission price responses in a mixed transmission pricing system-Part I: Formulation. IEEE Trans. Power Syst. 2004, 19, 707–717. [Google Scholar] [CrossRef]
- Zerrahn, A.; Schill, W.P. Long-run power storage requirements for high shares of renewables: Review and a new model. Renew. Sustain. Energy Rev. 2017, 79, 1518–1534. [Google Scholar] [CrossRef]
- Hirth, L. The European Electricity Market Model EMMA Model Documentation. Available online: https://neon-energie.de/emma-documentation.pdf (accessed on 17 March 2020).
- Limpens, G.; Moret, S.; Jeanmart, H.; Maréchal, F. EnergyScope TD: A novel open-source model for regional energy systems. Appl. Energy 2019, 255, 113729. [Google Scholar] [CrossRef]
- Heuberger, C.F.; Rubin, E.S.; Staffell, I.; Shah, N.; Mac Dowell, N. Power capacity expansion planning considering endogenous technology cost learning. Appl. Energy 2017, 204, 831–845. [Google Scholar] [CrossRef]
- Atabay, D. An open-source model for optimal design and operation of industrial energy systems. Energy 2017, 121, 803–821. [Google Scholar] [CrossRef]
- Huppmann, D.; Egging, R. Market power, fuel substitution and infrastructure–A large-scale equilibrium model of global energy markets. Energy 2014, 75, 483–500. [Google Scholar] [CrossRef]
- Howells, M.; Rogner, H.; Strachan, N.; Heaps, C.; Huntington, H.; Kypreos, S.; Hughes, A.; Silveira, S.; DeCarolis, J.; Bazillian, M.; et al. OSeMOSYS: The open source energy modeling system: An introduction to its ethos, structure and development. Energy Policy 2011, 39, 5850–5870. [Google Scholar] [CrossRef]
- PLEXOS Market Simulation Software. Available online: https://energyexemplar.com/solutions/plexos/ (accessed on 17 March 2020).
- Nelson, J.; Johnston, J.; Mileva, A.; Fripp, M.; Hoffman, I.; Petros-Good, A.; Blanco, C.; Kammen, D.M. High-resolution modeling of the western North American power system demonstrates low-cost and low-carbon futures. Energy Policy 2012, 43, 436–447. [Google Scholar] [CrossRef]
- IEA-ETSAP Optimization Modeling Documentation. Available online: https://iea-etsap.org/index.php/documentation (accessed on 17 March 2020).
- Schaber, K.; Steinke, F.; Hamacher, T. Transmission grid extensions for the integration of variable renewable energies in Europe: Who benefits where? Energy Policy 2012, 43, 123–135. [Google Scholar] [CrossRef]
- Rasku, T.; Kiviluoma, J. A Comparison of Widespread Flexible Residential Electric Heating and Energy Efficiency in a Future Nordic Power System. Energies 2018, 12, 5. [Google Scholar] [CrossRef]
- Hirth, L. The benefits of flexibility: The value of wind energy with hydropower. Appl. Energy 2016, 181, 210–223. [Google Scholar] [CrossRef]
- Göransson, L.; Johnsson, F. Cost-optimized allocation of wind power investments: A Nordic–German perspective. Wind Energy 2013, 16, 587–604. [Google Scholar] [CrossRef]
- Schill, W.P.; Zerrahn, A. Long-run power storage requirements for high shares of renewables: Results and sensitivities. Renew. Sustain. Energy Rev. 2018, 83, 156–171. [Google Scholar] [CrossRef]
- Welsch, M.; Deane, P.; Howells, M.; Gallachóir, B.Ó.; Rogan, F.; Bazilian, M.; Rogner, H.H. Incorporating flexibility requirements into long-term energy system models–A case study on high levels of renewable electricity penetration in Ireland. Appl. Energy 2014, 135, 600–615. [Google Scholar] [CrossRef]
- Deane, J.; Driscoll, A.; Gallachóir, B.Ó. Quantifying the impacts of national renewable electricity ambitions using a North–West European electricity market model. Renew. Energy 2015, 80, 604–609. [Google Scholar] [CrossRef]
- Pfenninger, S.; Keirstead, J. Renewables, nuclear, or fossil fuels? Scenarios for Great Britain’s power system considering costs, emissions and energy security. Appl. Energy 2015, 152, 83–93. [Google Scholar] [CrossRef]
- Hobbs, B.F.; Rijkers, F.A.; Wals, A.F. Strategic generation with conjectured transmission price responses in a mixed transmission pricing system-part II: Application. IEEE Trans. Power Syst. 2004, 19, 872–879. [Google Scholar] [CrossRef]
- Pina, A.; Silva, C.; Ferrão, P. The impact of demand side management strategies in the penetration of renewable electricity. Energy 2012, 41, 128–137. [Google Scholar] [CrossRef]
- Boiteux, M. La tarification des demandes en pointe: Application de la théorie de la vente au coût marginal. Rev. Gen. Electr. 1949, 58, 321–340. [Google Scholar]
- Caramanis, M.C.; Tabors, R.D.; Nochur, K.S.; Schweppe, F.C. The introduction of nondiispatchable technologies a decision variables in long-term generation expansion models. IEEE Trans. Power App. Syst. 1982, PAS-101, 2658–2667. [Google Scholar] [CrossRef]
- Wogrin, S.; Dueñas, P.; Delgadillo, A.; Reneses, J. A new approach to model load levels in electric power systems with high renewable penetration. IEEE Trans. Power Syst. 2014, 29, 2210–2218. [Google Scholar] [CrossRef]
- Wogrin, S.; Galbally, D.; Reneses, J. Optimizing storage operations in medium-and long-term power system models. IEEE Trans. Power Syst. 2015, 31, 3129–3138. [Google Scholar] [CrossRef]
- Tejada-Arango, D.A.; Wogrin, S.; Centeno, E. Representation of storage operations in network-constrained optimization models for medium-and long-term operation. IEEE Trans. Power Syst. 2017, 33, 386–396. [Google Scholar] [CrossRef]
- Tejada-Arango, D.A.; Domeshek, M.; Wogrin, S.; Centeno, E. Enhanced representative days and system states modeling for energy storage investment analysis. IEEE Trans. Power Syst. 2018, 33, 6534–6544. [Google Scholar] [CrossRef]
- Bello, A.; Reneses, J.; Muñoz, A.; Delgadillo, A. Probabilistic forecasting of hourly electricity prices in the medium-term using spatial interpolation techniques. Int. J. Forecast. 2016, 32, 966–980. [Google Scholar] [CrossRef]
- Atakan, S.; Lulli, G.; Sen, S. A state transition MIP formulation for the unit commitment problem. IEEE Trans. Power Syst. 2017, 33, 736–748. [Google Scholar] [CrossRef]
- Morales-España, G.; Tejada-Arango, D.A. Modeling the hidden flexibility of clustered unit commitment. IEEE Trans. Power Syst. 2019, 34, 3294–3296. [Google Scholar] [CrossRef]
- Tejada Arango, D.A.; Lumbreras Sancho, S.; Sánchez Martín, P.; Ramos Galán, A. Which unit commitment formulation is best? A comparison framework. IEEE Trans. Power Syst. 2019. accepted for publication. [Google Scholar] [CrossRef]
- Bello, A.; Bunn, D.W.; Reneses, J.; Muñoz, A. Medium-term probabilistic forecasting of electricity prices: A hybrid approach. IEEE Trans. Power Syst. 2016, 32, 334–343. [Google Scholar] [CrossRef]
- IBM ILOG CPLEX Optimization Studio V12.10.0 Documentation. Available online: https://www.ibm.com/support/knowledgecenter/SSSA5P_12.10.0/COS_KC_home.html (accessed on 17 March 2020).
- GAMS User’s Guide. Available online: https://www.gams.com/latest/docs/UG_MAIN.html (accessed on 17 March 2020).
- Duenas, P.; Reneses, J.; Barquin, J. Dealing with multi-factor uncertainty in electricity markets by combining Monte Carlo simulation with spatial interpolation techniques. IET Gener. Transm. Distrib. 2011, 5, 323–331. [Google Scholar] [CrossRef]


© 2020 by the authors. Licensee MDPI, Basel, Switzerland. This article is an open access article distributed under the terms and conditions of the Creative Commons Attribution (CC BY) license (http://creativecommons.org/licenses/by/4.0/).