Article

Switched Reluctance Generator for Low Voltage DC Microgrid Operation: Experimental Validation

1
Group of Electrical Engineering of Paris, CNRS, CentraleSupelec, Universite Paris-Saclay, 3-11 Rue Joliot Curie, 91192 Gif Sur Yvette, France
2
Ecole Nationale Superieure d’Enseignement Technique et Professionnel, Universite Cheikh Anta Diop, Dakar 999066, Senegal
3
College of Logistics Engineering, Shanghai Maritime University, Shanghai 201306, China
*
Author to whom correspondence should be addressed.
Energies 2020, 13(12), 3032; https://doi.org/10.3390/en13123032
Submission received: 10 May 2020 / Revised: 31 May 2020 / Accepted: 8 June 2020 / Published: 12 June 2020
(This article belongs to the Section F: Electrical Engineering)

Abstract

:
This paper presents the control of a Switched Reluctance Generator (SRG) for low voltage DC grid with the objective of efficiency maximizing. Analysis of the energy conversion, including electrical machine losses (Joule, magnetic, mechanical) and power converter losses (switching and conduction), has shown that there is an optimal combination of control variables (turn-on and conduction angles, phase current reference), which maximizes the drive efficiency. The control variables are derived from a Finite Element Analysis and parametric optimization algorithm for all of the operating points in the torque-speed plane and stored in lookup tables. The performances are evaluated with intensive numerical simulations and experimental tests with a 8/6 SRG feeding a DC resistive load for different rotational speeds. The results show good performances of the output DC voltage control with low ripples, even in the presence of speed and load variations. Thanks to the optimization, simulation results show that beyond 1500 rpm, drive efficiency is higher than 60 % and almost reaches 70 % at nominal speed. The experimental results show that, for light loads and beyond rated speed, the drive efficiency lies in the range between 60 % and 80 % .

1. Introduction

A microgrid is defined as a set of energy sources (including power converters), energy storage devices, and loads. Microgrids can have different scales, ranging from individual dwellings to clusters of dwellings in rural or urban areas. Microgrids can be broadly classified as AC, DC, or AC-DC, depending on the nature of the current flowing through the power lines. Micro-grids can also be connected to the public grid or isolated. In the last decade, the DC microgrid [1] has emerged as a serious candidate for different reasons, among which: several renewable energy sources (photovoltaic, fuel cells) produce direct current, and several loads are of DC type. In this case, DC-AC conversion is not only no longer necessary, but will also degrade efficiency. In isolated areas (mountain shelter, rural villages, or islands), it is of particular interest to have high efficiency and a high level of energy availability. Therefore, all of the components in the power production system should be robust and resilient to faults or failures, as there may be no easy access to technical support. For the electrical generator, the Switched Reluctance Machine is a relevant candidate in these circumstances, as it is characterized by low manufacturing cost, rugged structure, simple geometrical construction, and robustness, due to the absence of permanent magnet and windings in the rotor. Moreover, it can have more than three phases, and its average back-emf is continuous, which makes it attractive for the DC microgrid.
Nevertheless, because of its high acoustic noise [2] and high torque ripples, conventional electrical machines (Interior Permanent Magnet or Wounded Rotor Synchronous Machines or Induction Machines) are still preferred. However, thanks to progress in machine design, power electronics, and control methods, SRM is becoming more trendy [3,4]. The Switched Reluctance Generator (SRG) is becoming increasingly popular, because it is considered as a good candidate for electrical energy production in harsh conditions (wind energy conversion systems) [5,6,7,8,9,10,11], electric or hybrid vehicles [12,13,14,15,16], in aeronautics [17,18,19], and flywheel energy storage system [20]. Besides the design of the electrical machine, the design of power converters [21,22,23,24] and control design are the other ways to achieve the required performances for the drive [25,26,27,28]. The optimization of the drive’ efficiency can be tackled with different approaches:
  • at first from the design, the electrical machine can be optimized, for example, to minimize the Joule or/and iron losses: the selection of ferromagnetic material, length of the core, height of the teeth, and section of the conductors;
  • the power converter can also be designed with a specific structure (interleaved or multilevel converters) or with specific power switches (silicon carbide, for example); and,
  • a control structure tuned to operate the drive at the maximum efficiency, whatever the operating point.
These approaches can, of course, be combined, depending on the application and the targets. In our study, the electrical machine is legacy equipment and the power converter has been designed as a classical asymmetric half bridge that is commonly associated with Switched Reluctance Machine. Accordingly, the challenge is to improve the efficiency while using only control parameters. As previously mentioned, the main issue for Switched Reluctance Machines control is to mitigate torque ripples (voltage ripples) and operate the drive at its higher efficiency [29] for all of the operating points in the torque-speed plane. The control variables or degrees of freedom that have been identified are the phase current reference, the commutation angles, and the excitation voltage. In [30,31], the authors have addressed the issue of torque ripples reduction through the appropriate design of controllers.
In [23], the authors have developed an interleaved DC/DC converter to boost and regulate the output voltage of a Switch Reluctance Generator-based wind energy conversion drive used for a DC micro-grid.
In [6], a Differential Evolution Strategy (DES) is introduced for optimizing the performance of an SRG for wind turbine applications. The authors have identified the triplet (turn-on angle, turn-off angle, and the excitation voltage) as control parameters to maximize the output power. In [32], the authors have shown that the electrical power produced by an SRG can be increased by introducing a freewheeling between the magnetizing and demagnetizing sequences. In [33], turn on and turn off angles and phase current are control parameters. Two control strategies have been adopted: at low and medium speed, constant angles and PWM duty cycle control are used, while constant PWM and control of angles are used at high speed. In [34], the authors have developed an excitation strategy for a high-speed SRG. Turn-on and conduction angles have been selected key elements for optimizing efficiency. The commutation angles leading to the minimum phase current to achieve the desired power are chosen as optimal excitation angles.
Paper contribution
In this paper, the experimental validation of an SRG for a low voltage DC microgrid is presented. A variable resistive load is used to emulate the loads connected to the DC bus. The main issue is to maximize the efficiency of the drive (including the electrical generator, the power converter, and the excitation source) for the whole torque-speed range. Particular attention is drawn to the SRG control parameters. In this work, phase reference current I r e f , turn on angle ψ , and conduction angle θ p are identified as key control parameters. They are determined while using Finite Element Analysis under the constraint of maximum efficiency and stored in lookup tables. The second issue is to regulate the output DC voltage despite the undesirable speed variations and load variations. To summarize, the main contributions are efficiency optimization, including all of the generator and power converter losses, a robust and straightforward PI controller for DC bus voltage regulation, an easy and less time-consuming implementation with optimal key control parameters stored in lookup tables.
The paper is organized, as follows: Section 2 presents the basic principles of the SRG and the key elements that influence the DC voltage and the output electrical power in open-loop operation. Section 3 presents the efficiency maximization algorithm. The closed-loop voltage control strategy of the SRG and the experimental results are presented in Section 4. A conclusion and discussions on future work close the paper.

2. Switched Reluctance Generator: Analysis of Open-Loop Operation

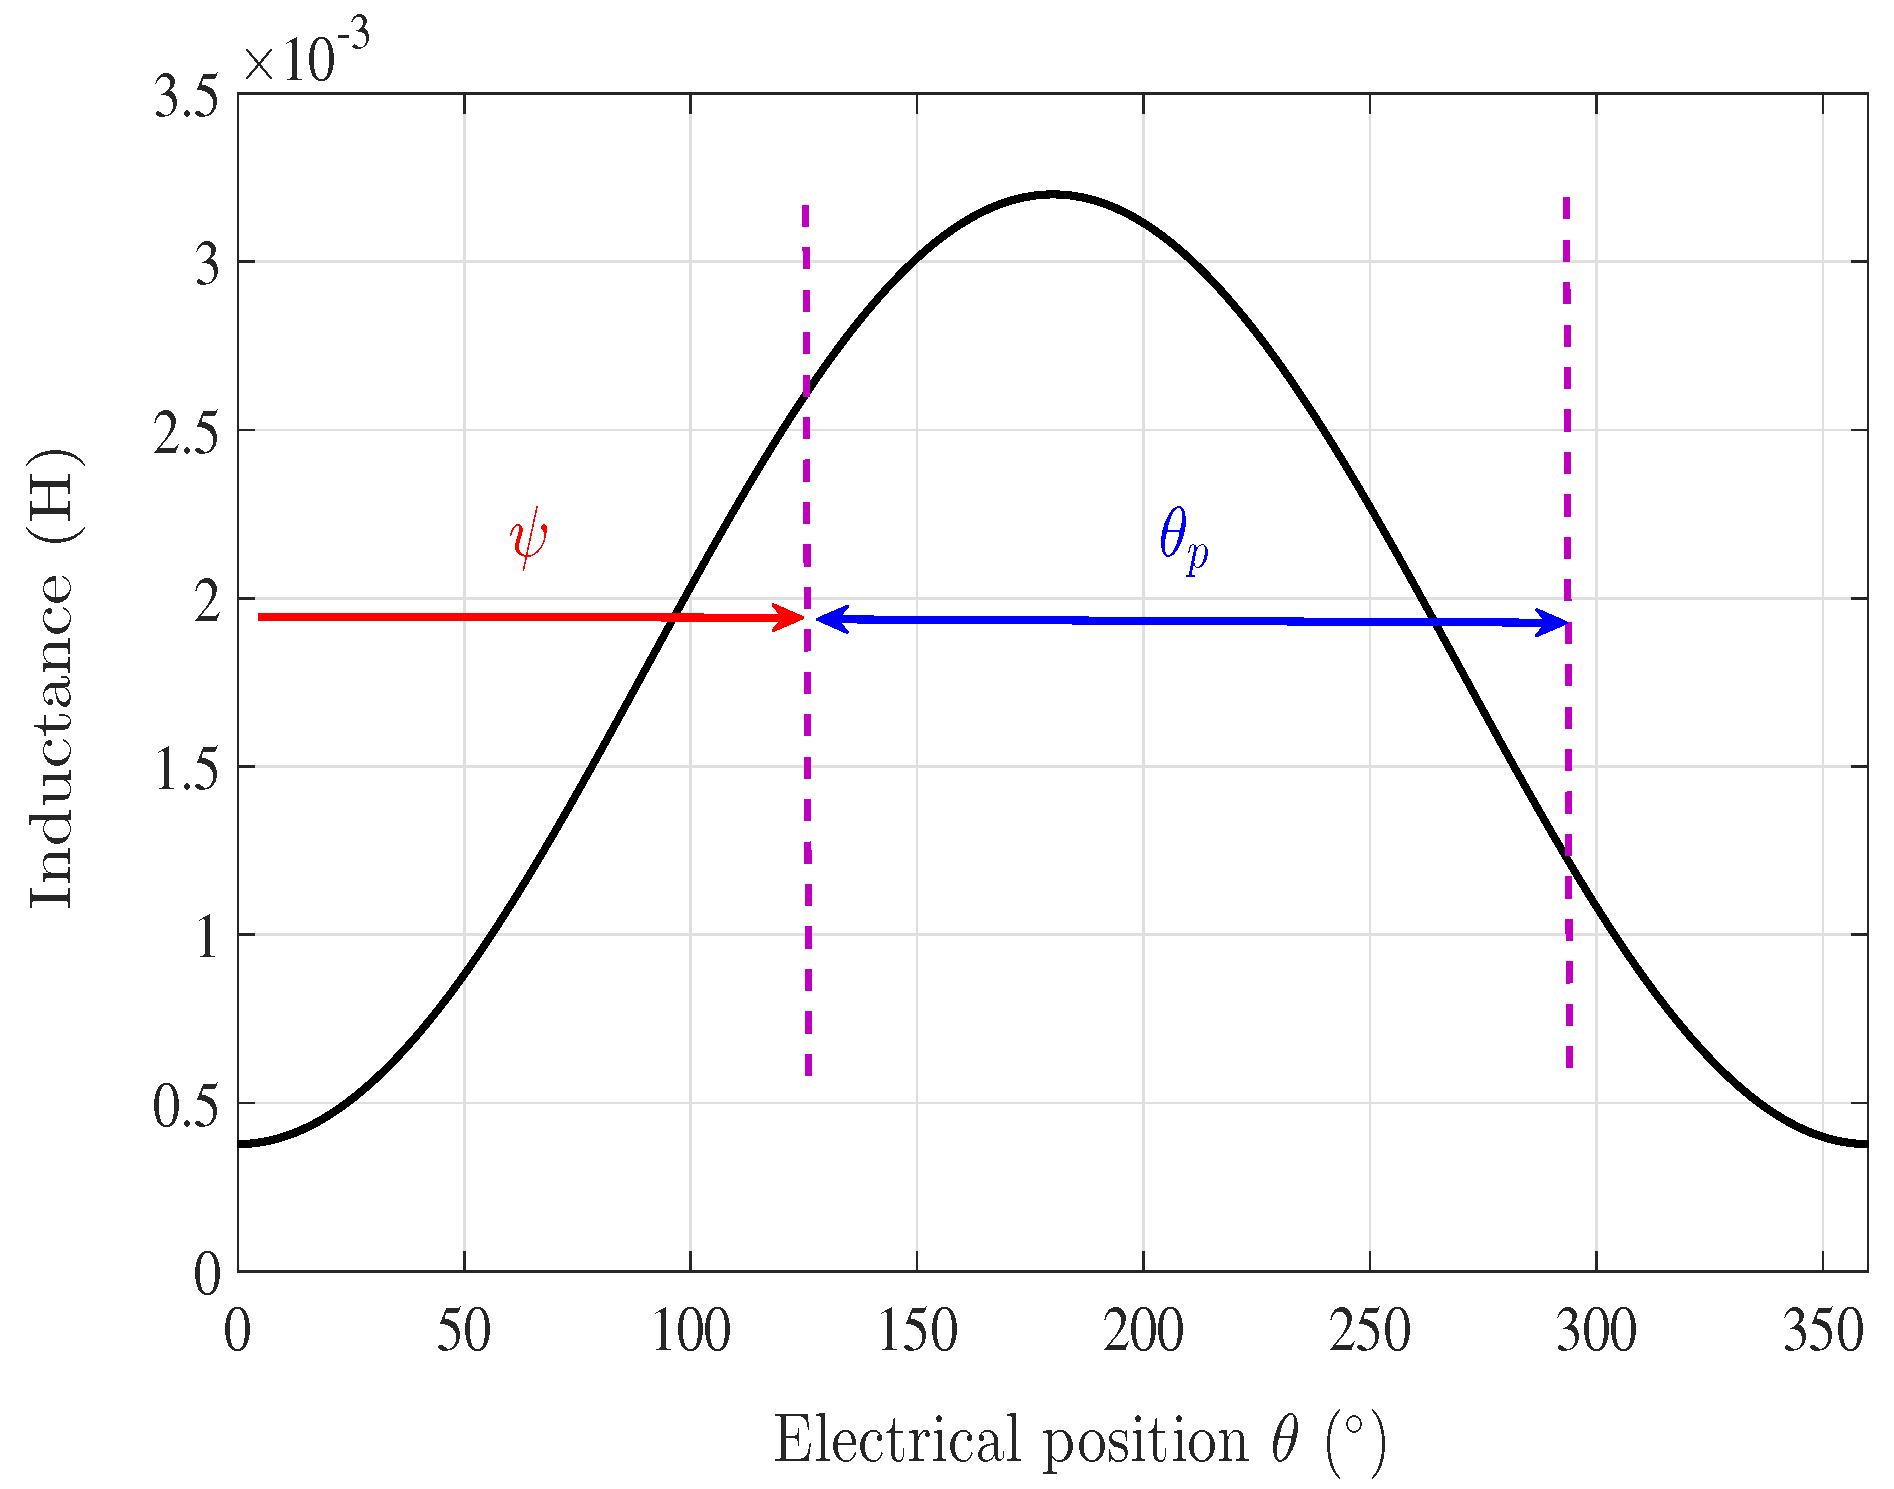
2.1. Basics of Switched Reluctance Generator

The Switched Reluctance Generator (SRG) is an electromechanical energy converter whose operation is based on maximizing the flux. When one phase is excited, the rotor moves to a position where the flux of the exciting phase is maximized. In this paper, a double salient four-phase SRG is considered, with the characteristics being listed in Table 1. The stator has N s = 8 salient poles with concentrated field coils. The rotor entirely composed of ferromagnetic material has N r = 6 passive salient poles with no coils or permanent magnets. The stator windings are fed through a four-phase Asymmetric Half-Bridge converter (AHBC). The maximum torque of the machine is 25 Nm. It can be reached up to the rated speed ω r = 1300 rpm. The nominal speed is the rotating speed of the machine when it delivers its nominal power. Beyond 1300 rpm, the back-emf exceeds the supply voltage; therefore, full wave control is adopted. A 1.2 kW power and 4.5 Nm nominal torque is used in this paper. The value of the nominal speed is 3000 rpm.
The main assumption for the study (machine-converter) is a total decoupling of the phases: no magnetic coupling (no mutual) or electrical coupling (no electrical connection between windings of two different phases). A comparative study between a classical SR Machine and a mutually coupled SR Machine is presented in [35]. The results have shown that, at low phase current, the average torque of both machines is similar: the mutual coupling is negligible. However, when the current increases, the average torque of the classical SRM becomes lower than the mutually coupled one. In the following, as stated in [27], mutual coupling between phases is normally zero or very small, and it is ignored. The SRG phase-j voltage u j can be expressed as (Equations (1) and (2)). Where i j is the phase-j current, r is the windings resistance, θ is the rotor position, L j ( θ , i j ) is the phase inductance, φ j ( θ , i j ) is the flux-linkage, ω is the rotor angular velocity, and e j represents the back-emf.
u j = r i j + d φ j θ , i j d t , j = { 1 , 2 , 3 , 4 }
u j = r i j + L j θ , i j d i j d t + e j , e j = i j ω d L j θ , i j d θ
The mechanical behavior of the SRG is described by (Equation (3)).
J d ω d t = T e ( θ , i 1 , i 2 , i 3 , i 4 ) T L F ω
where J is the inertia of the machine, F is the friction coefficient, and T L the load torque. T e ( θ , i 1 , i 2 , i 3 , i 4 ) is the global electromagnetic torque of the machine. Assuming that the four phases are independent, the electromagnetic torque is calculated as the sum of the four elementary torques T e ( θ , i j ) that are produced by each phase of the SRG.
T e ( θ , i 1 , i 2 , i 3 , i 4 ) = j = 1 4 T e ( θ , i j )
Under the assumptions of no magnetic saturation and no mutual coupling between the phases, the elementary torque can be expressed as:
T e ( θ , i j ) = 1 2 i j 2 d L j θ , i j d θ
We can see from Equation (5) that SRG torque production depends on the current amplitude and inductance variation with the rotor position. This equation also shows that torque sign only depends on the inductance slope. Therefore, to produce a negative torque, the phase winding should be excited when the inductance decreases. Figure 1 shows the relationship between the phase inductance and rotor electrical position. The two main control parameters for electrical output power management of SRG are displayed in this figure: ψ turn-on angle and θ p conduction angle. The turn-on angle is the rotor angle for which magnetization starts, and the conduction angle measures the magnetization. The optimization of these angles to maximize generator and converter global efficiency will be presented in Section 3.

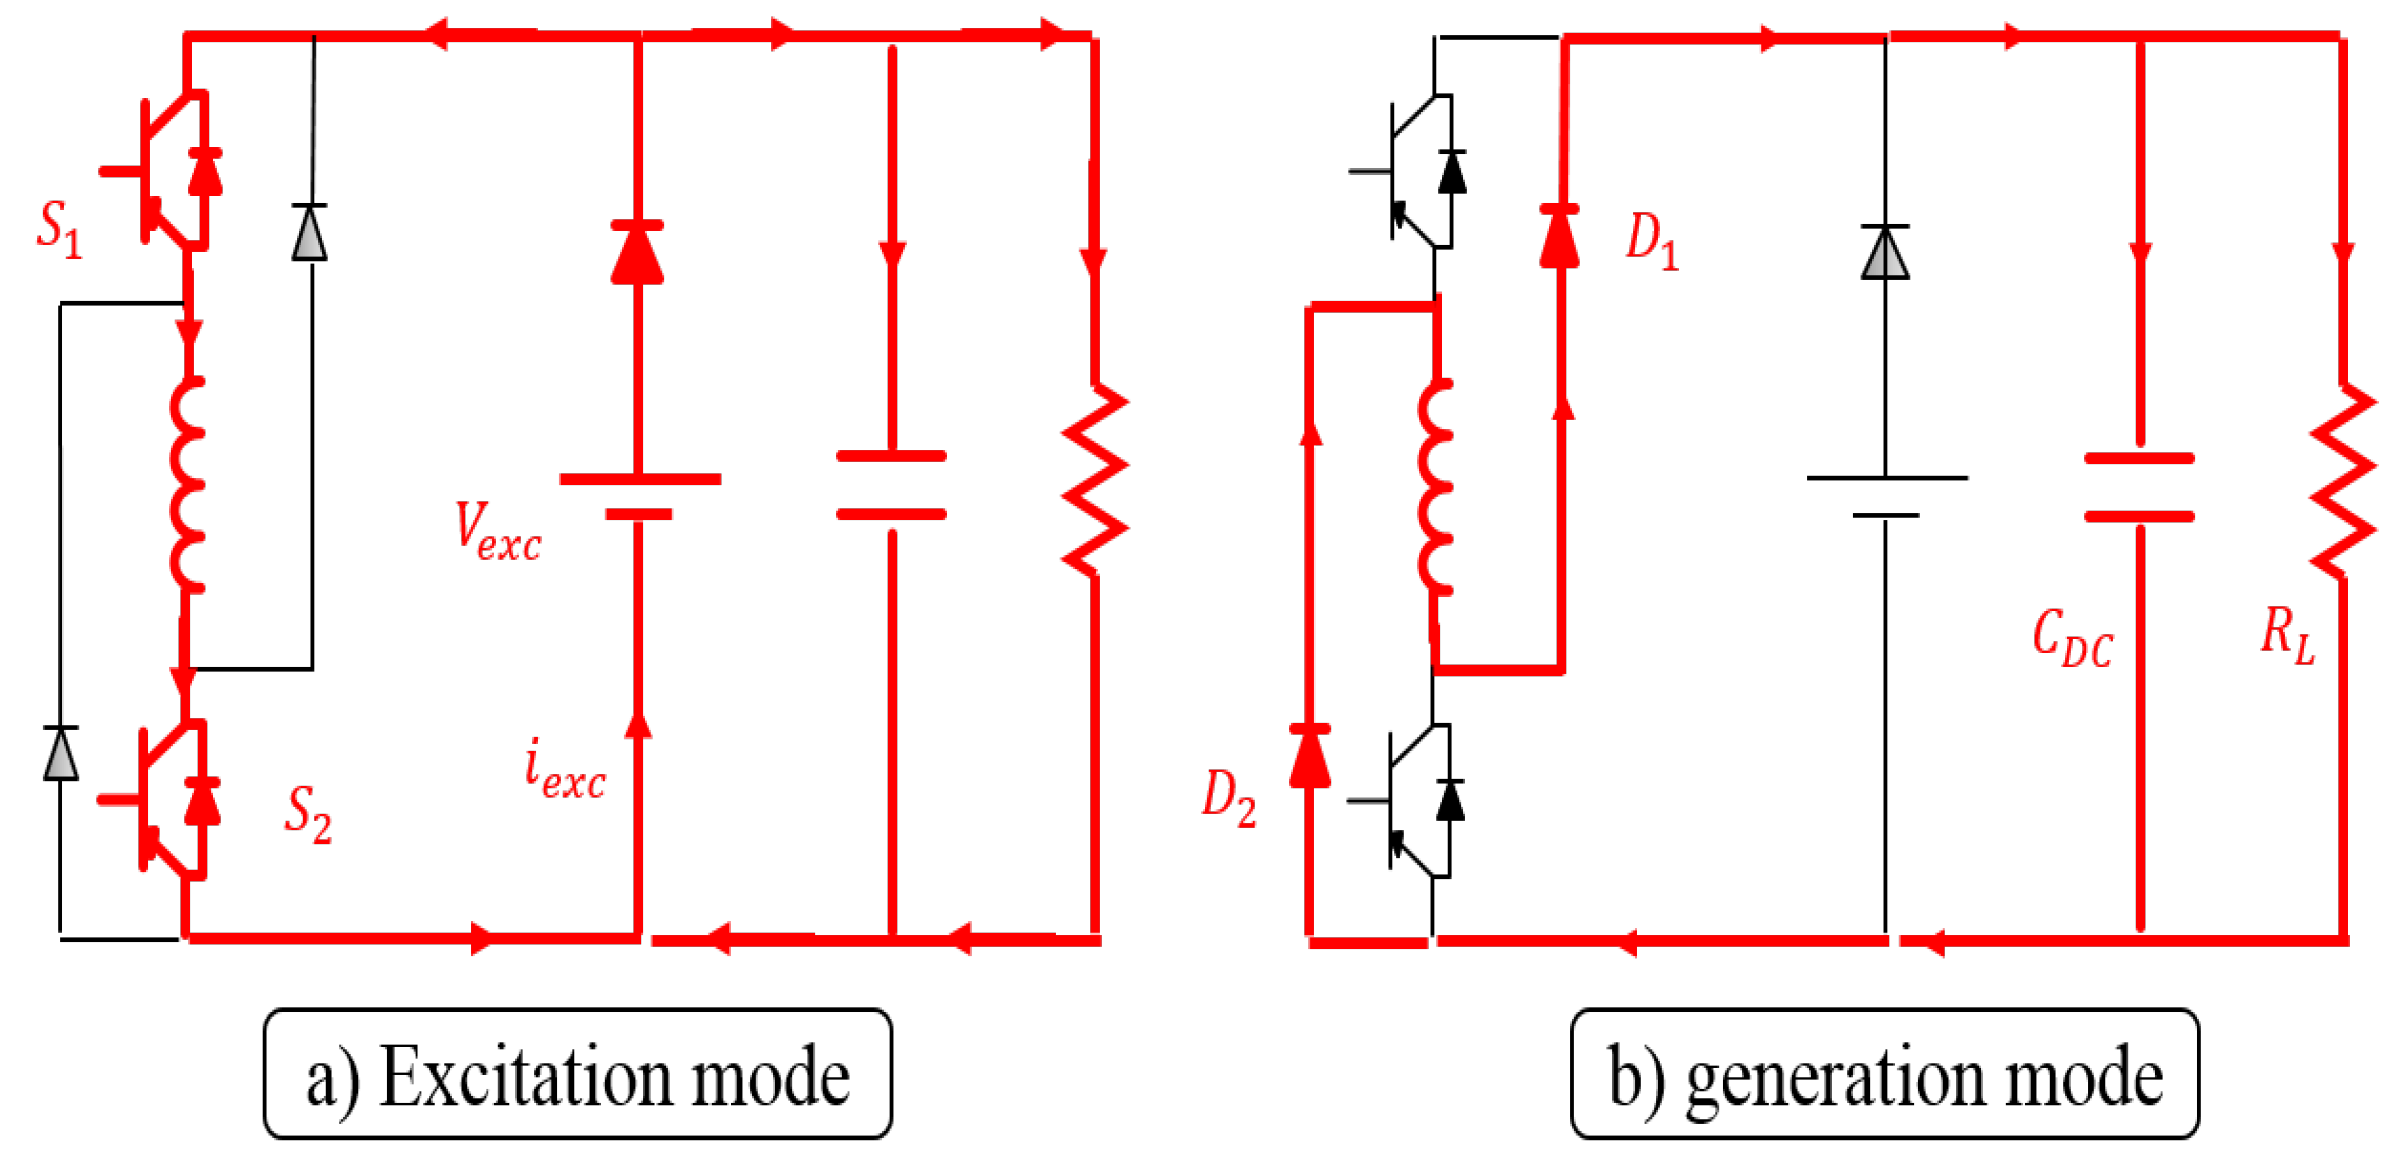
2.2. SRG Operating Modes

Figure 2 represents the electrical scheme of the switched reluctance generator system. The DC machine is used to produce the mechanical input power. The operation of a generator includes two steps:
Excitation mode: ψ < θ < ψ + θ p
When phase inductance decreases, switches S 1 and S 2 of the power converter (see in Figure 3a) are turned on. The battery feeds the stator windings and the SRG produces a negative torque. The input mechanical energy is transformed into magnetic energy and stored in stator windings. During this period, the current increases due to DC voltage and negative back-emf. If r is negligible, Equation (2) can be rewritten as Equation (6).
L j d i j d t u j e j > 0
Generation mode: ψ + θ p < θ < 2 ψ + θ p
After excitation mode, switches S 1 and S 2 are turned off and current flows towards the load (represented here by an equivalent resistance R L ) through diodes D 1 and D 2 , as it can be seen in Figure 3b. The magnetic energy that is stored during the excitation mode is transformed into electrical energy and transferred to the load. In this step, the current decreases due to the negative back-emf (see Equation (2)). During this period, Equation (2) can be rewritten as Equation (7). To control the generated current, condition u j > e j must be fulfilled. Otherwise, the generated current always increases and becomes uncontrollable.
L j d i j d t u j e j < 0

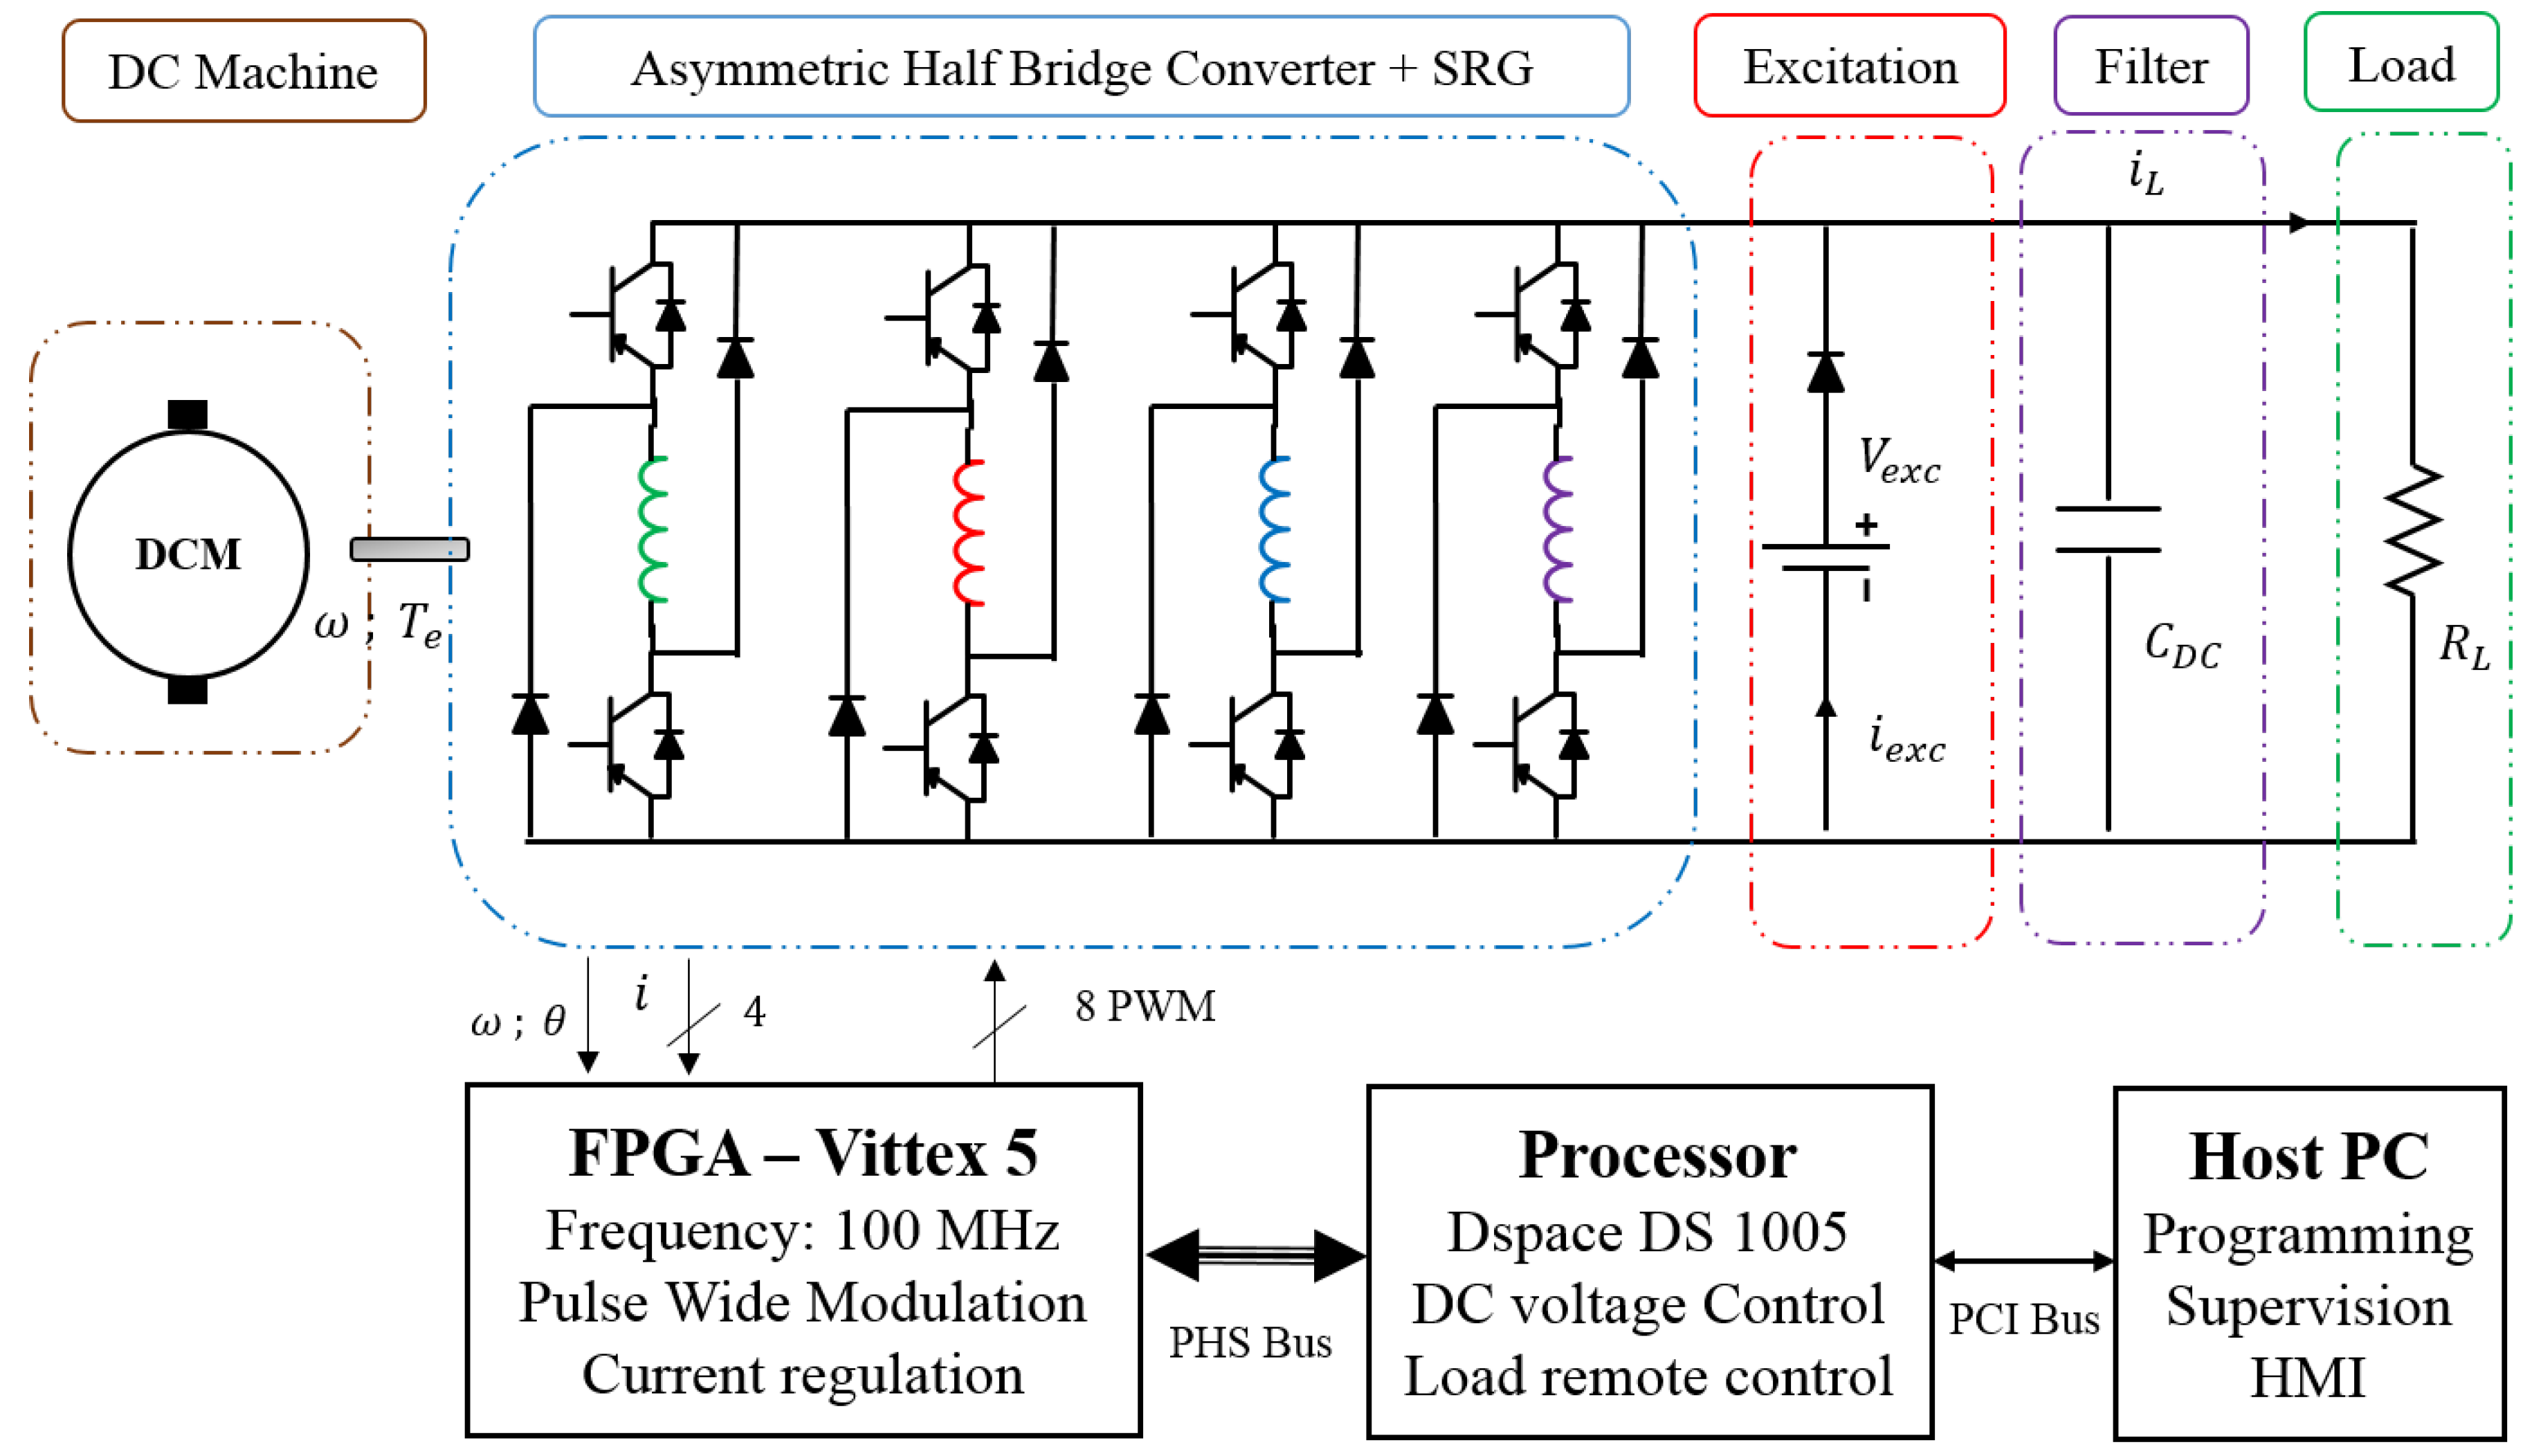
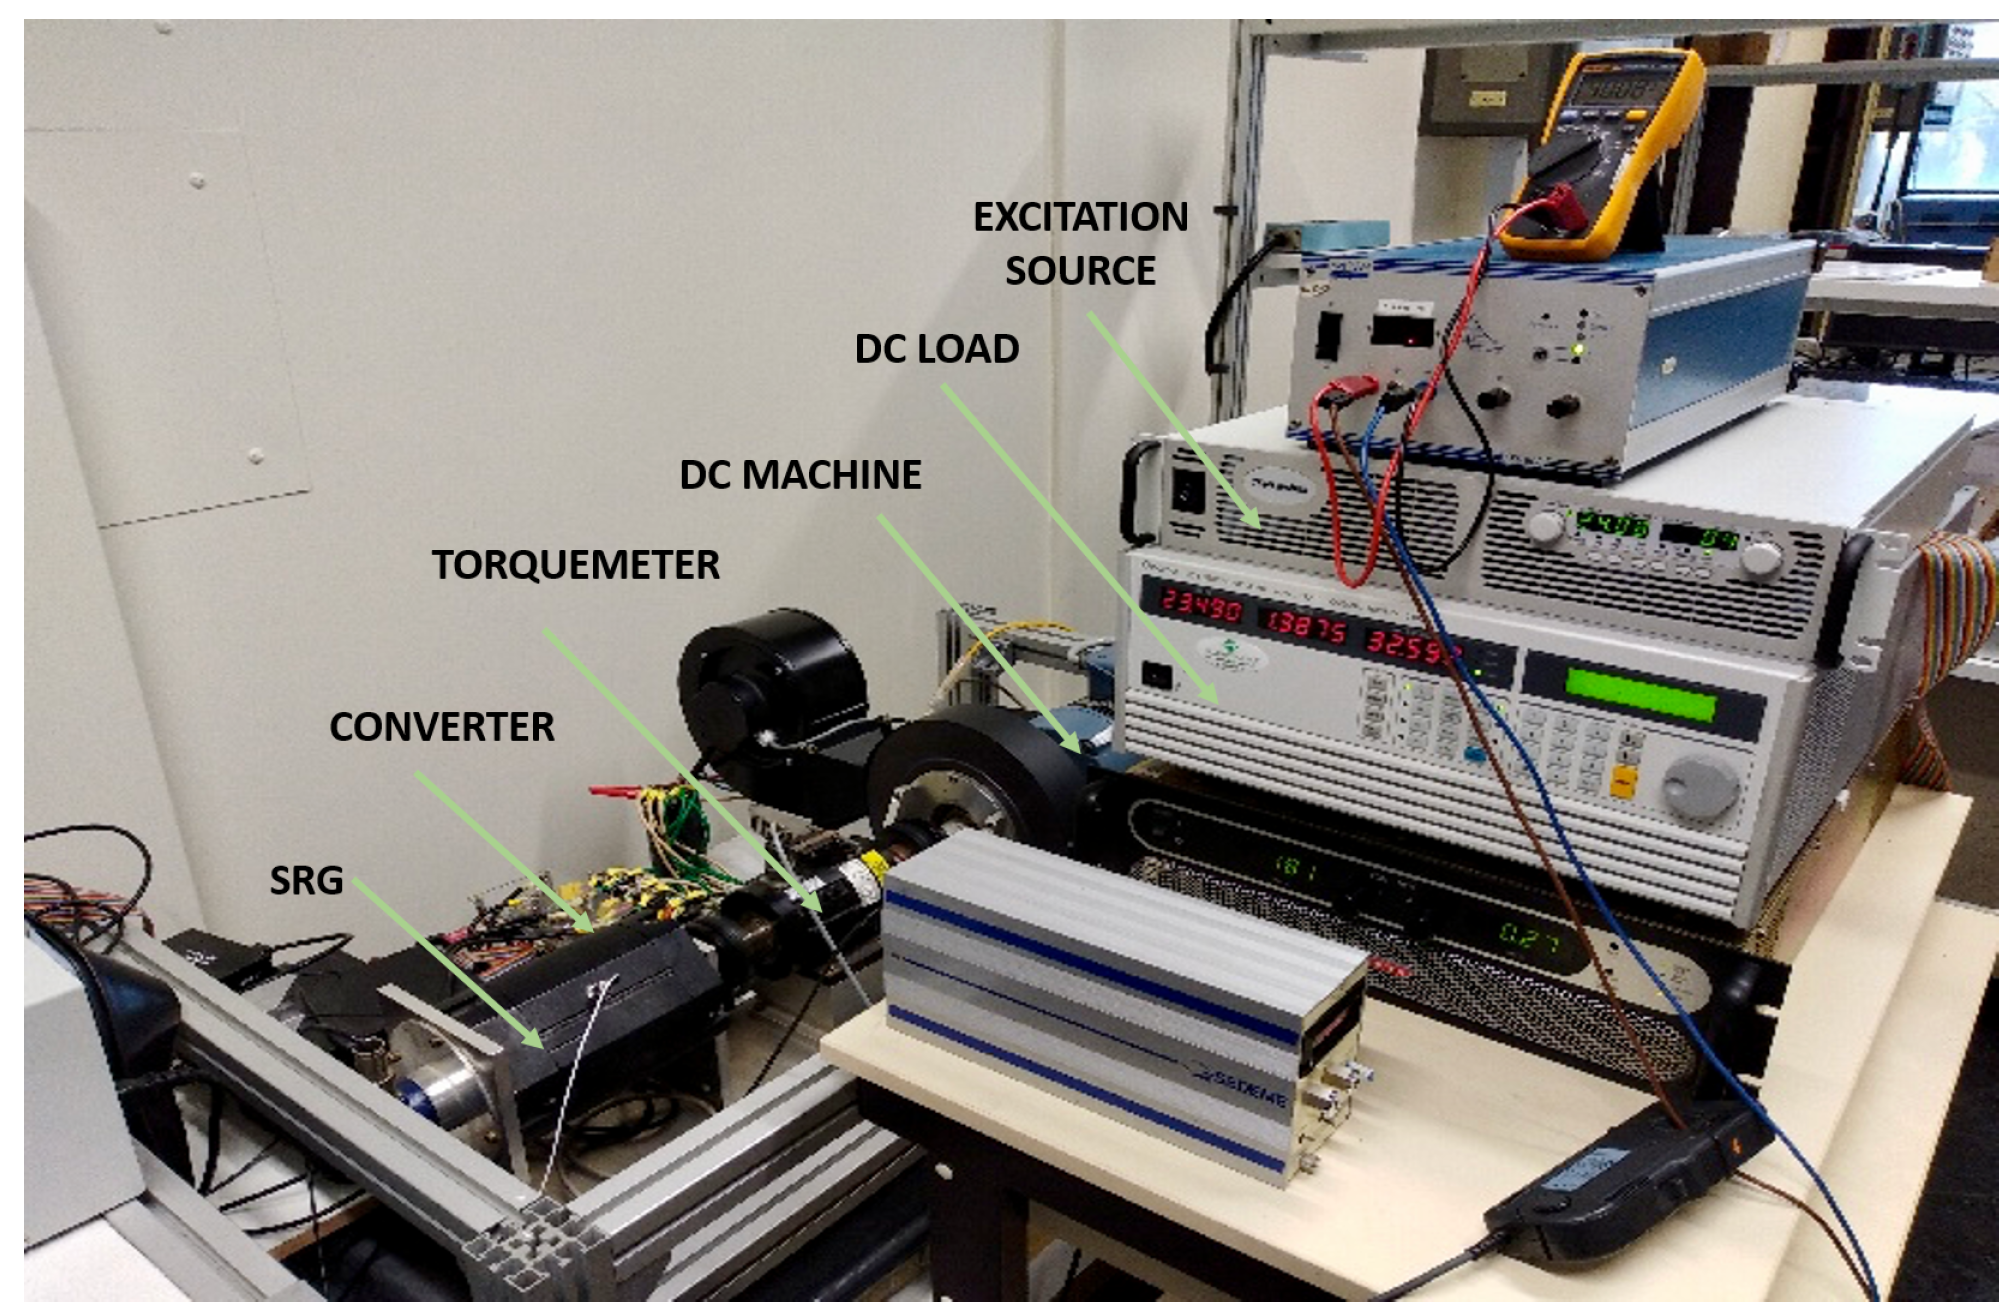
2.3. Experimental Setup

Figure 4 displays the experimental testbed. It includes a DC Machine emulating the primary energy source. The SRG with a 8/6 four-phase topology whose characteristics are given in Table 1 feeds the 24V DC bus. An Asymmetric Half-Bridge Converter (AHBC) is used to control the SRG operation. The AHBC is energized from the external excitation source during magnetization mode and provides power to the load (an equivalent resistance) through the DC bus during generation mode. Both the excitation source and load are connected to the same 24V DC bus. For higher tolerance, the DC bus can be split into one for excitation mode and another for generation mode. An incremental encoder is mounted on the rotor for rotor position and speed measurements. The control part includes a host PC for programming, supervision (Matlab-Simulink, Control-Desk), and data acquisition. The digital controller is composed of a Digital Signal Processor (DS1005) for DC voltage control loop and FPGA chip for current control.

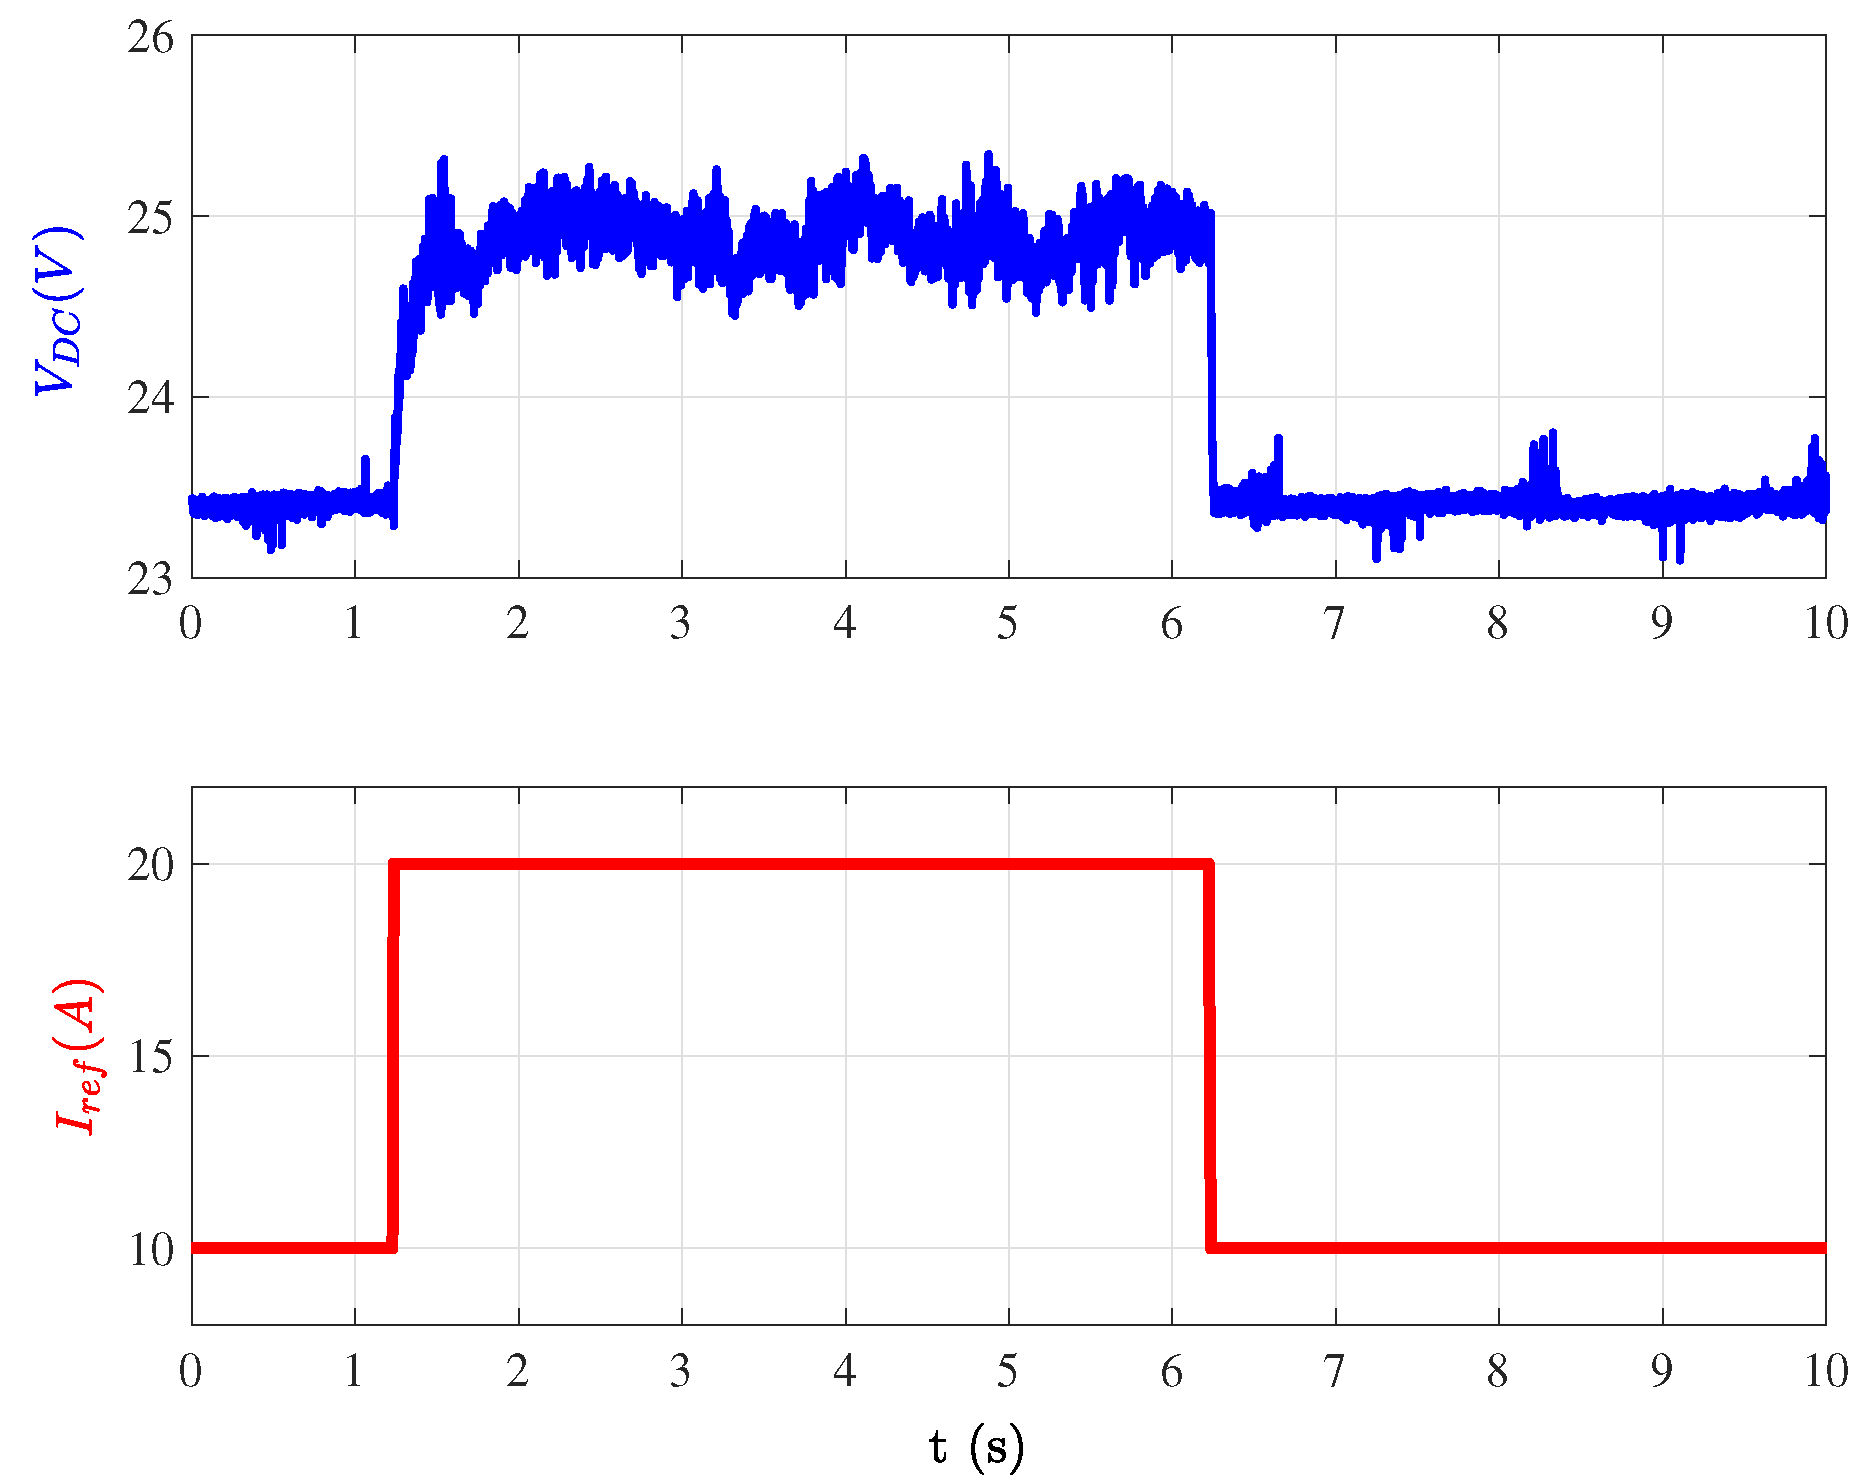
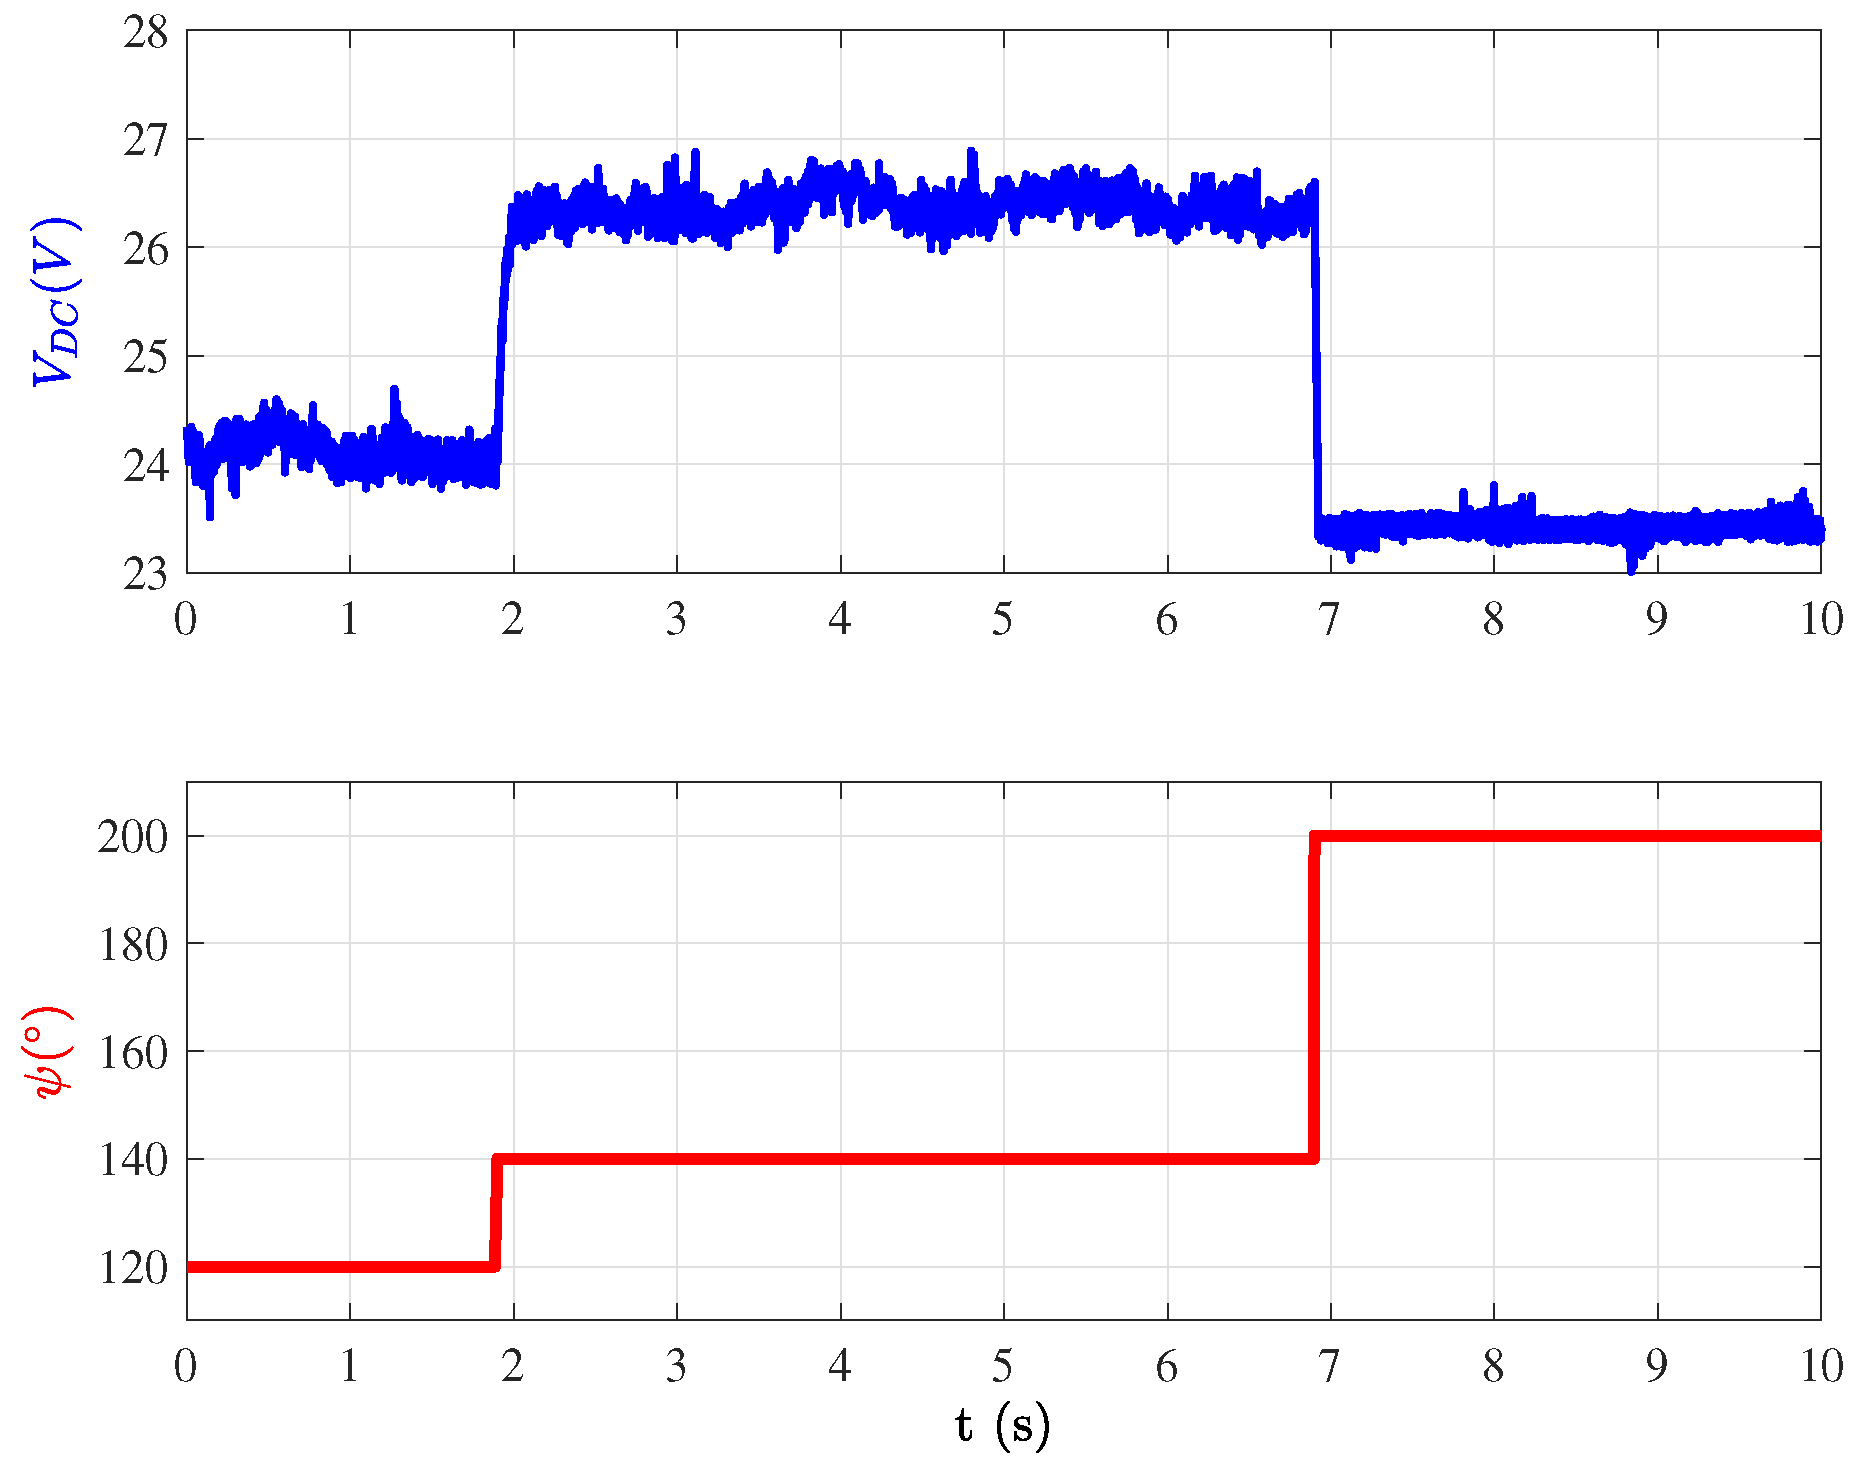
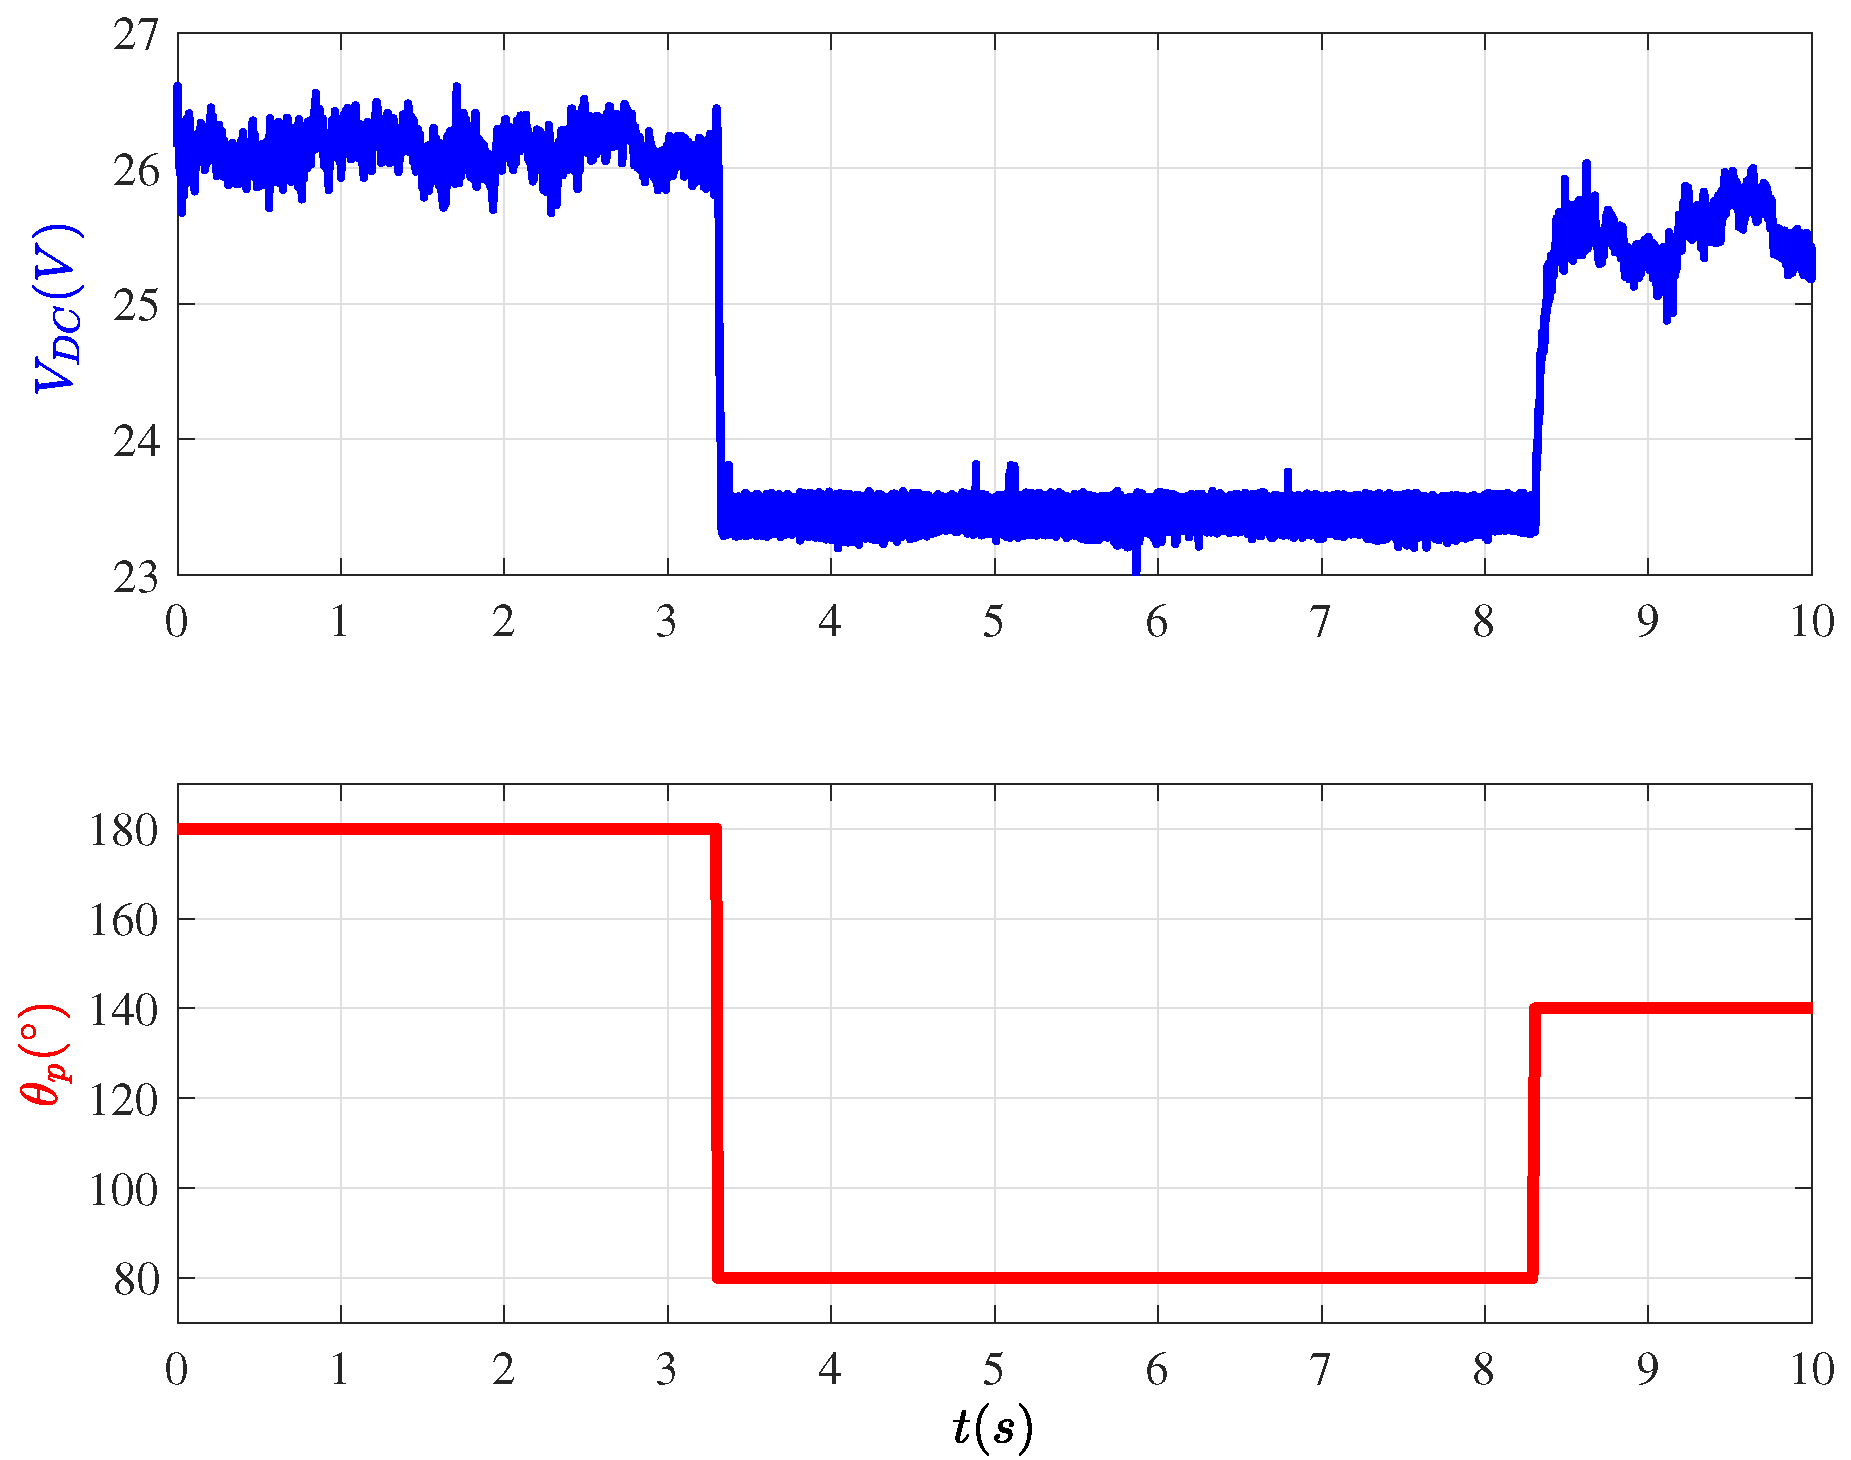
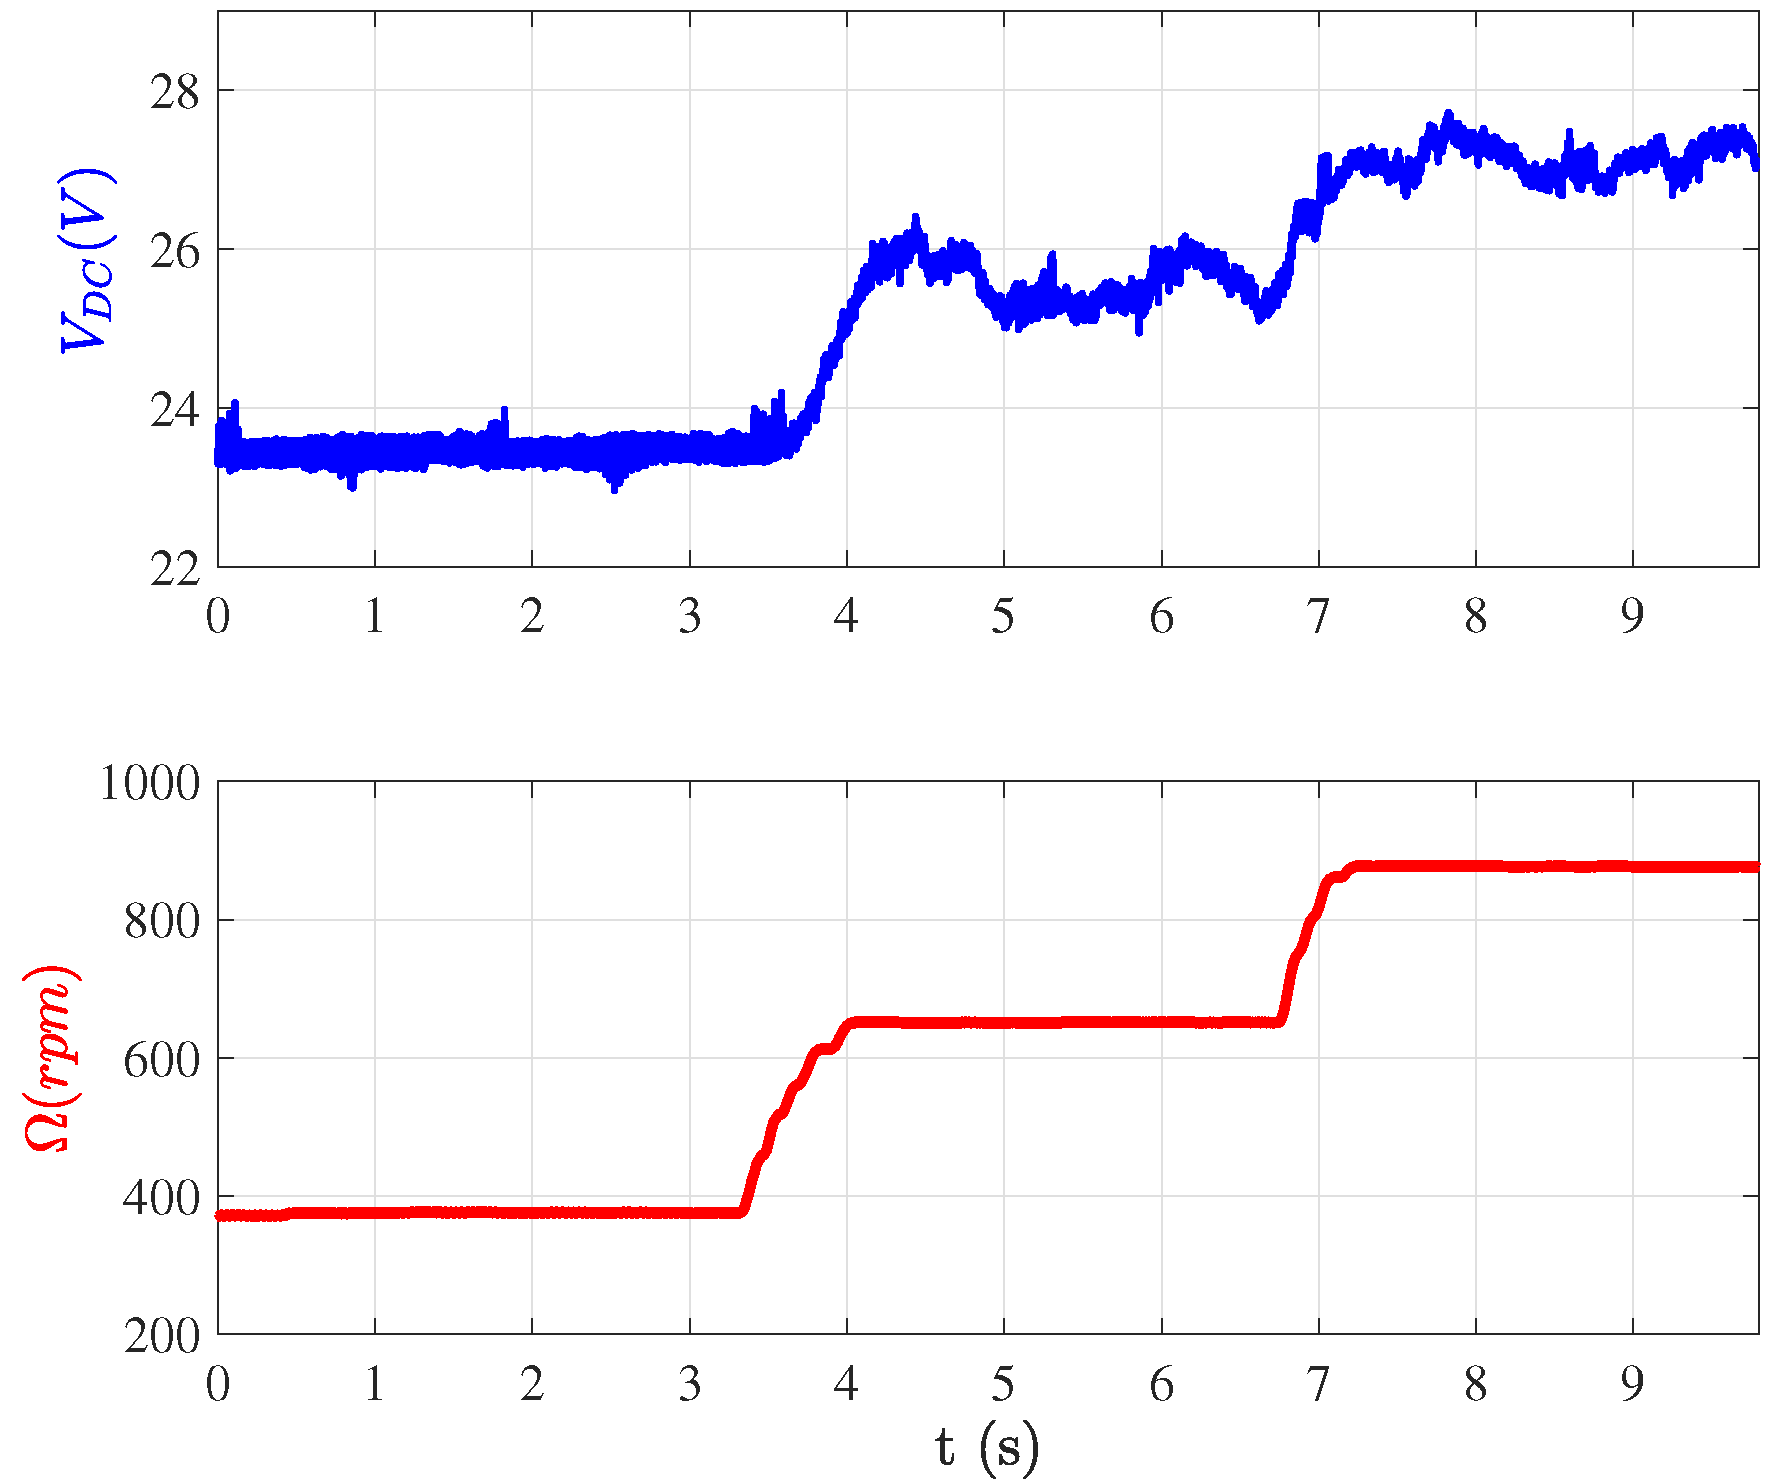
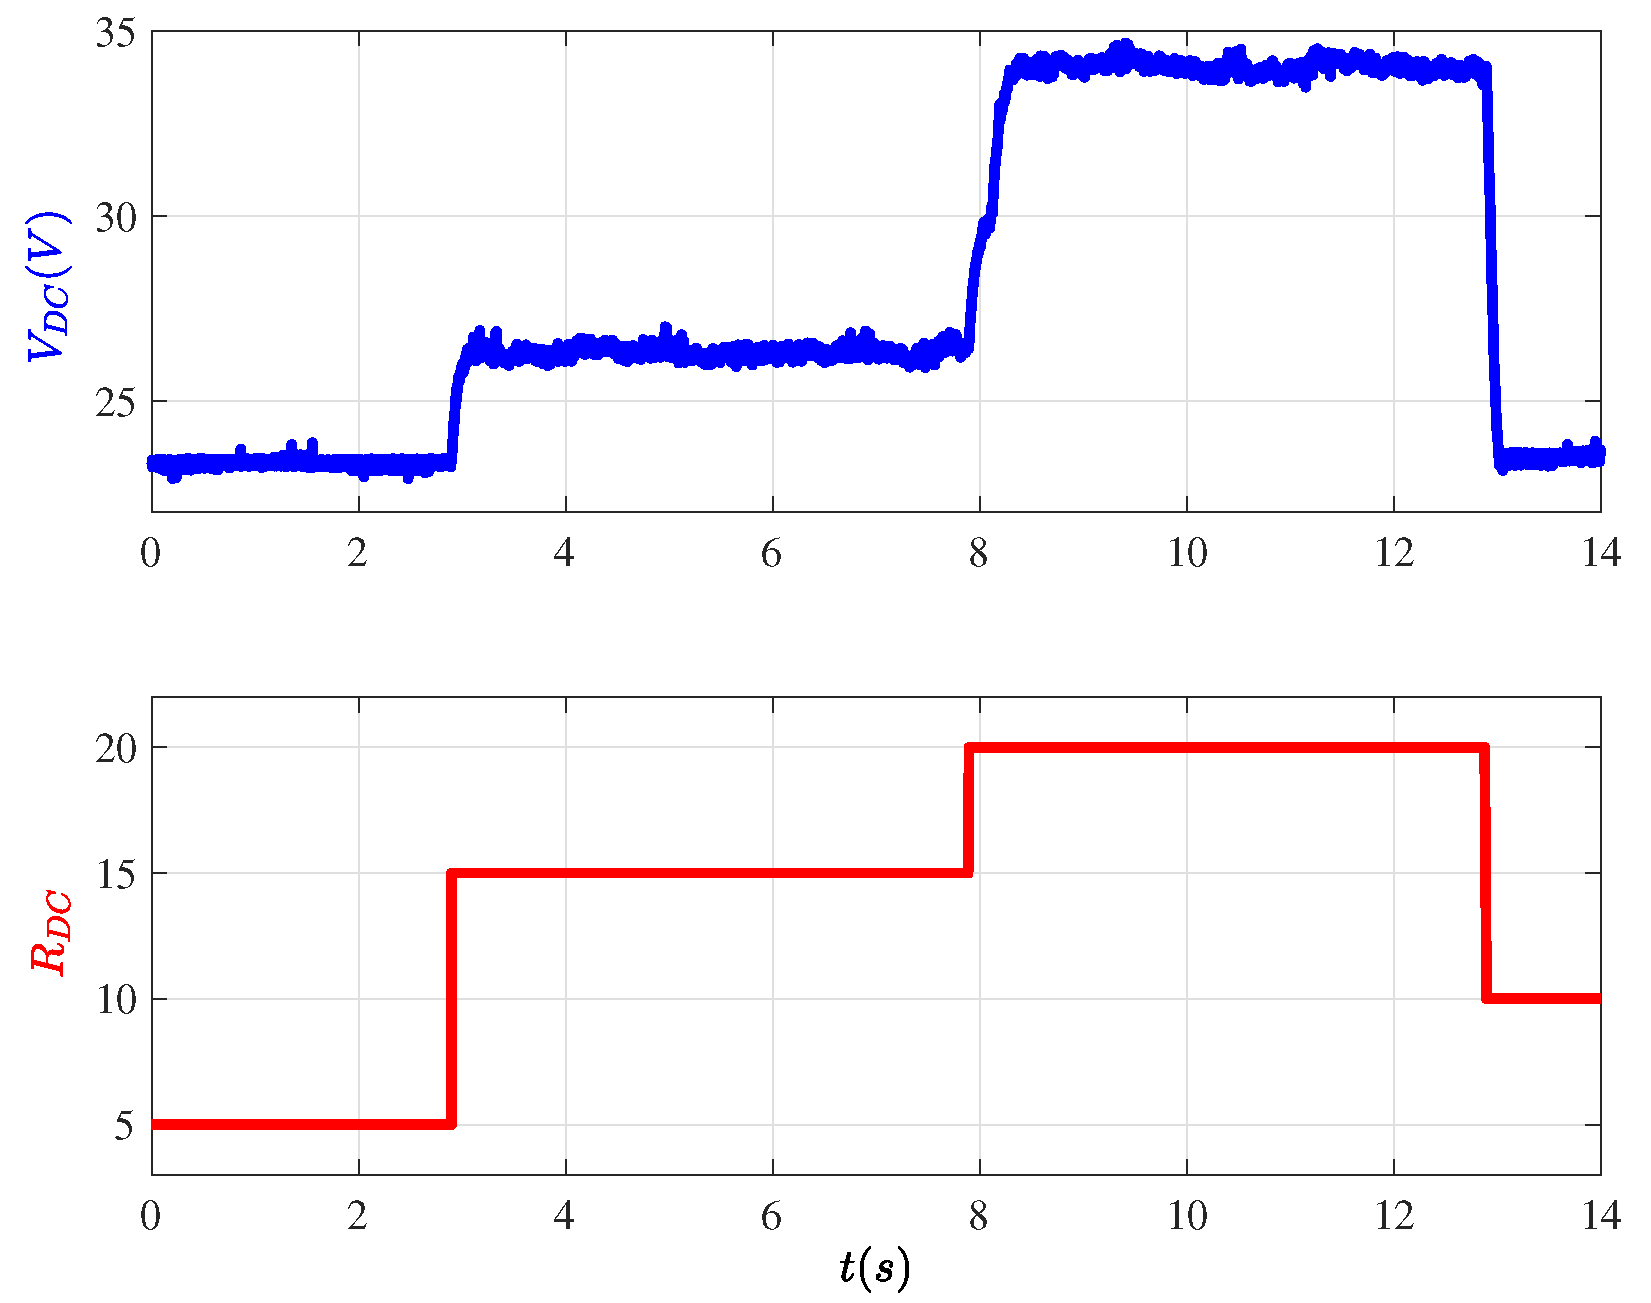
2.4. DC Bus Voltage Behavior under Open-Loop Operation

The generated DC voltage depends on several parameters, such as the turn on angle ψ , the conduction angle θ p , the phase current reference I r e f , the speed ω , and the load R L [9]. Preliminary experimental open-loop tests have been carried out to analyze the influence of these parameters on the DC bus voltage. Figure 5 shows the influence of the turn on angle when the other parameters are constant. When the turn on angle varies from 120 to 140 , the voltage varies from 24 V to 26.5 V, respectively. Figure 6 illustrates the behavior of the DC bus voltage under the conduction angle variation when the turn on angle is set at the unaligned position of the inductance ( 180 ) at 800 rpm. With different values of the conduction angle at: 80 , 140 and 180 , the DC bus voltage changes to different values: 23.5 V, 25.5 V and 26 V, respectively. To conclude, the SRG generated voltage increases when the conduction angle increases. From Figure 7, we can also see that phase current reference also has an important impact on the DC bus voltage. Figure 8 shows the DC bus response to a speed step change. As expected, the DC voltage increases with speed. Figure 9 shows the dynamic response of the DC voltage to step changes of the load. The DC voltage increases when load current decreases (the resistance is increased).
We can conclude from these preliminary experimental results that these five parameters have a significant impact on the generated voltage in open-loop operation: V D C = f ( I r e f , ψ , θ p , ω , R L ) . t has also been shown that electrical power generation and its efficiency depend on these independent parameters. Therefore, there should be an optimal combination to maximize efficiency and power production.

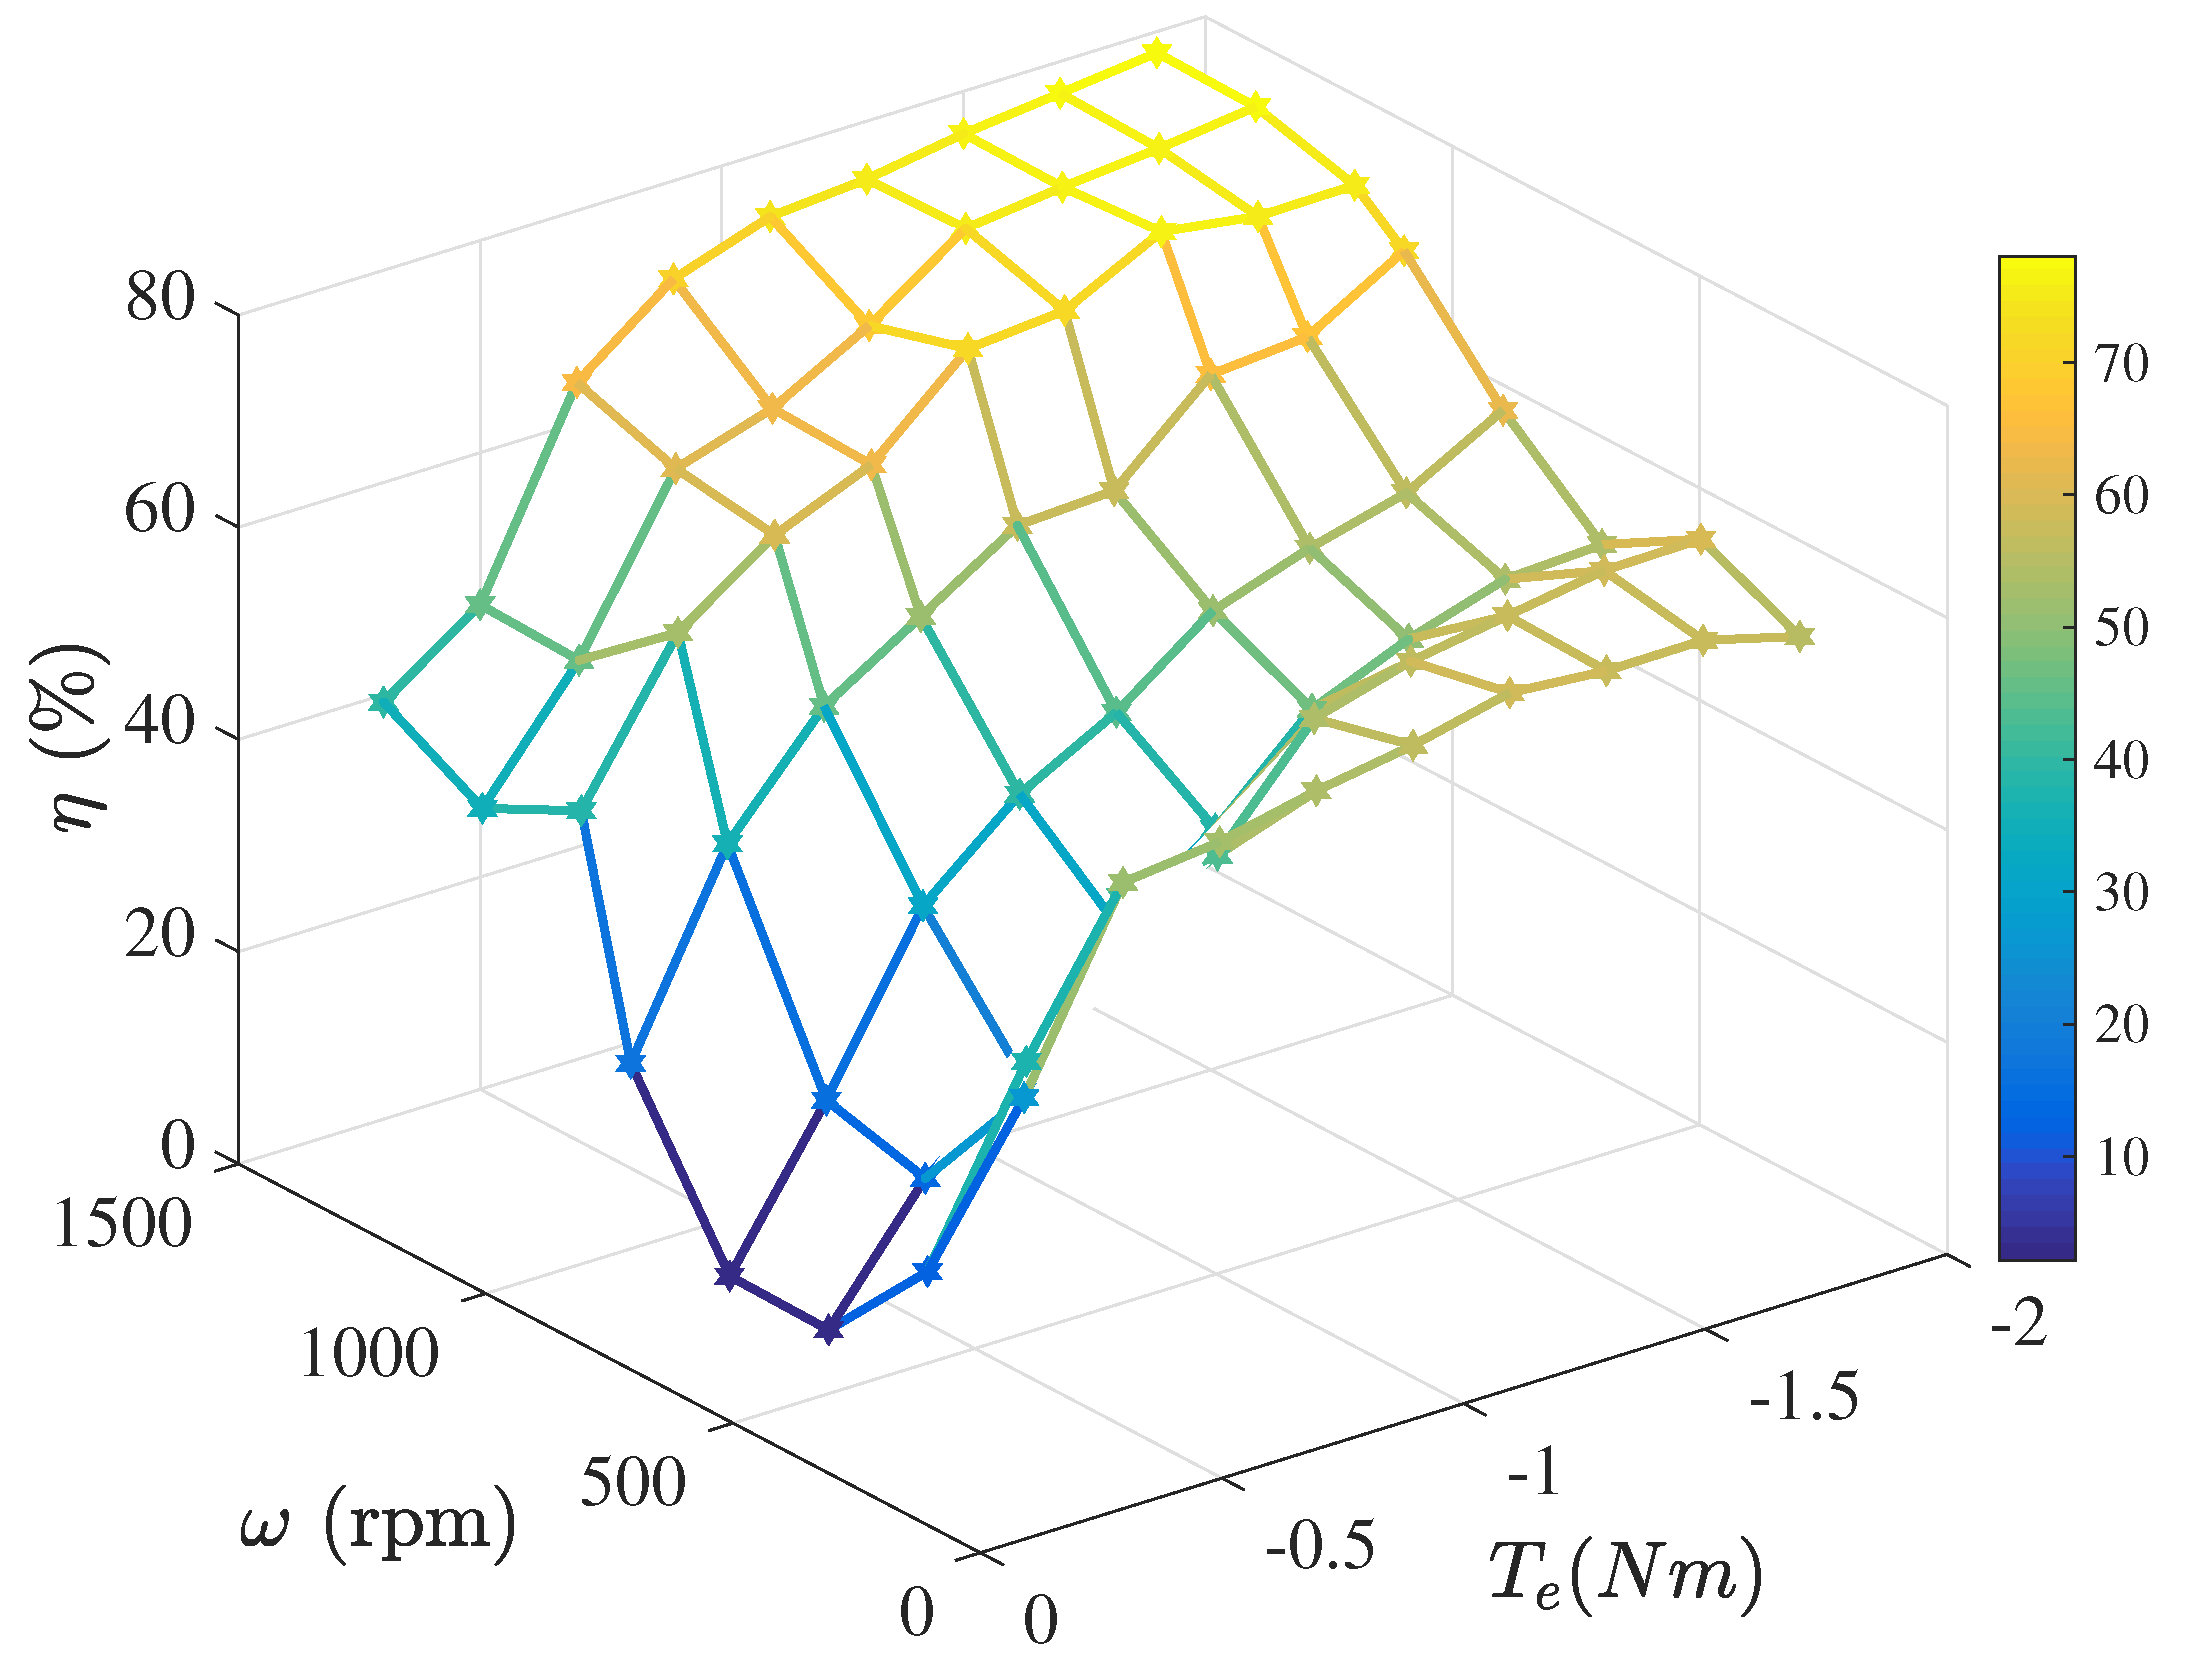
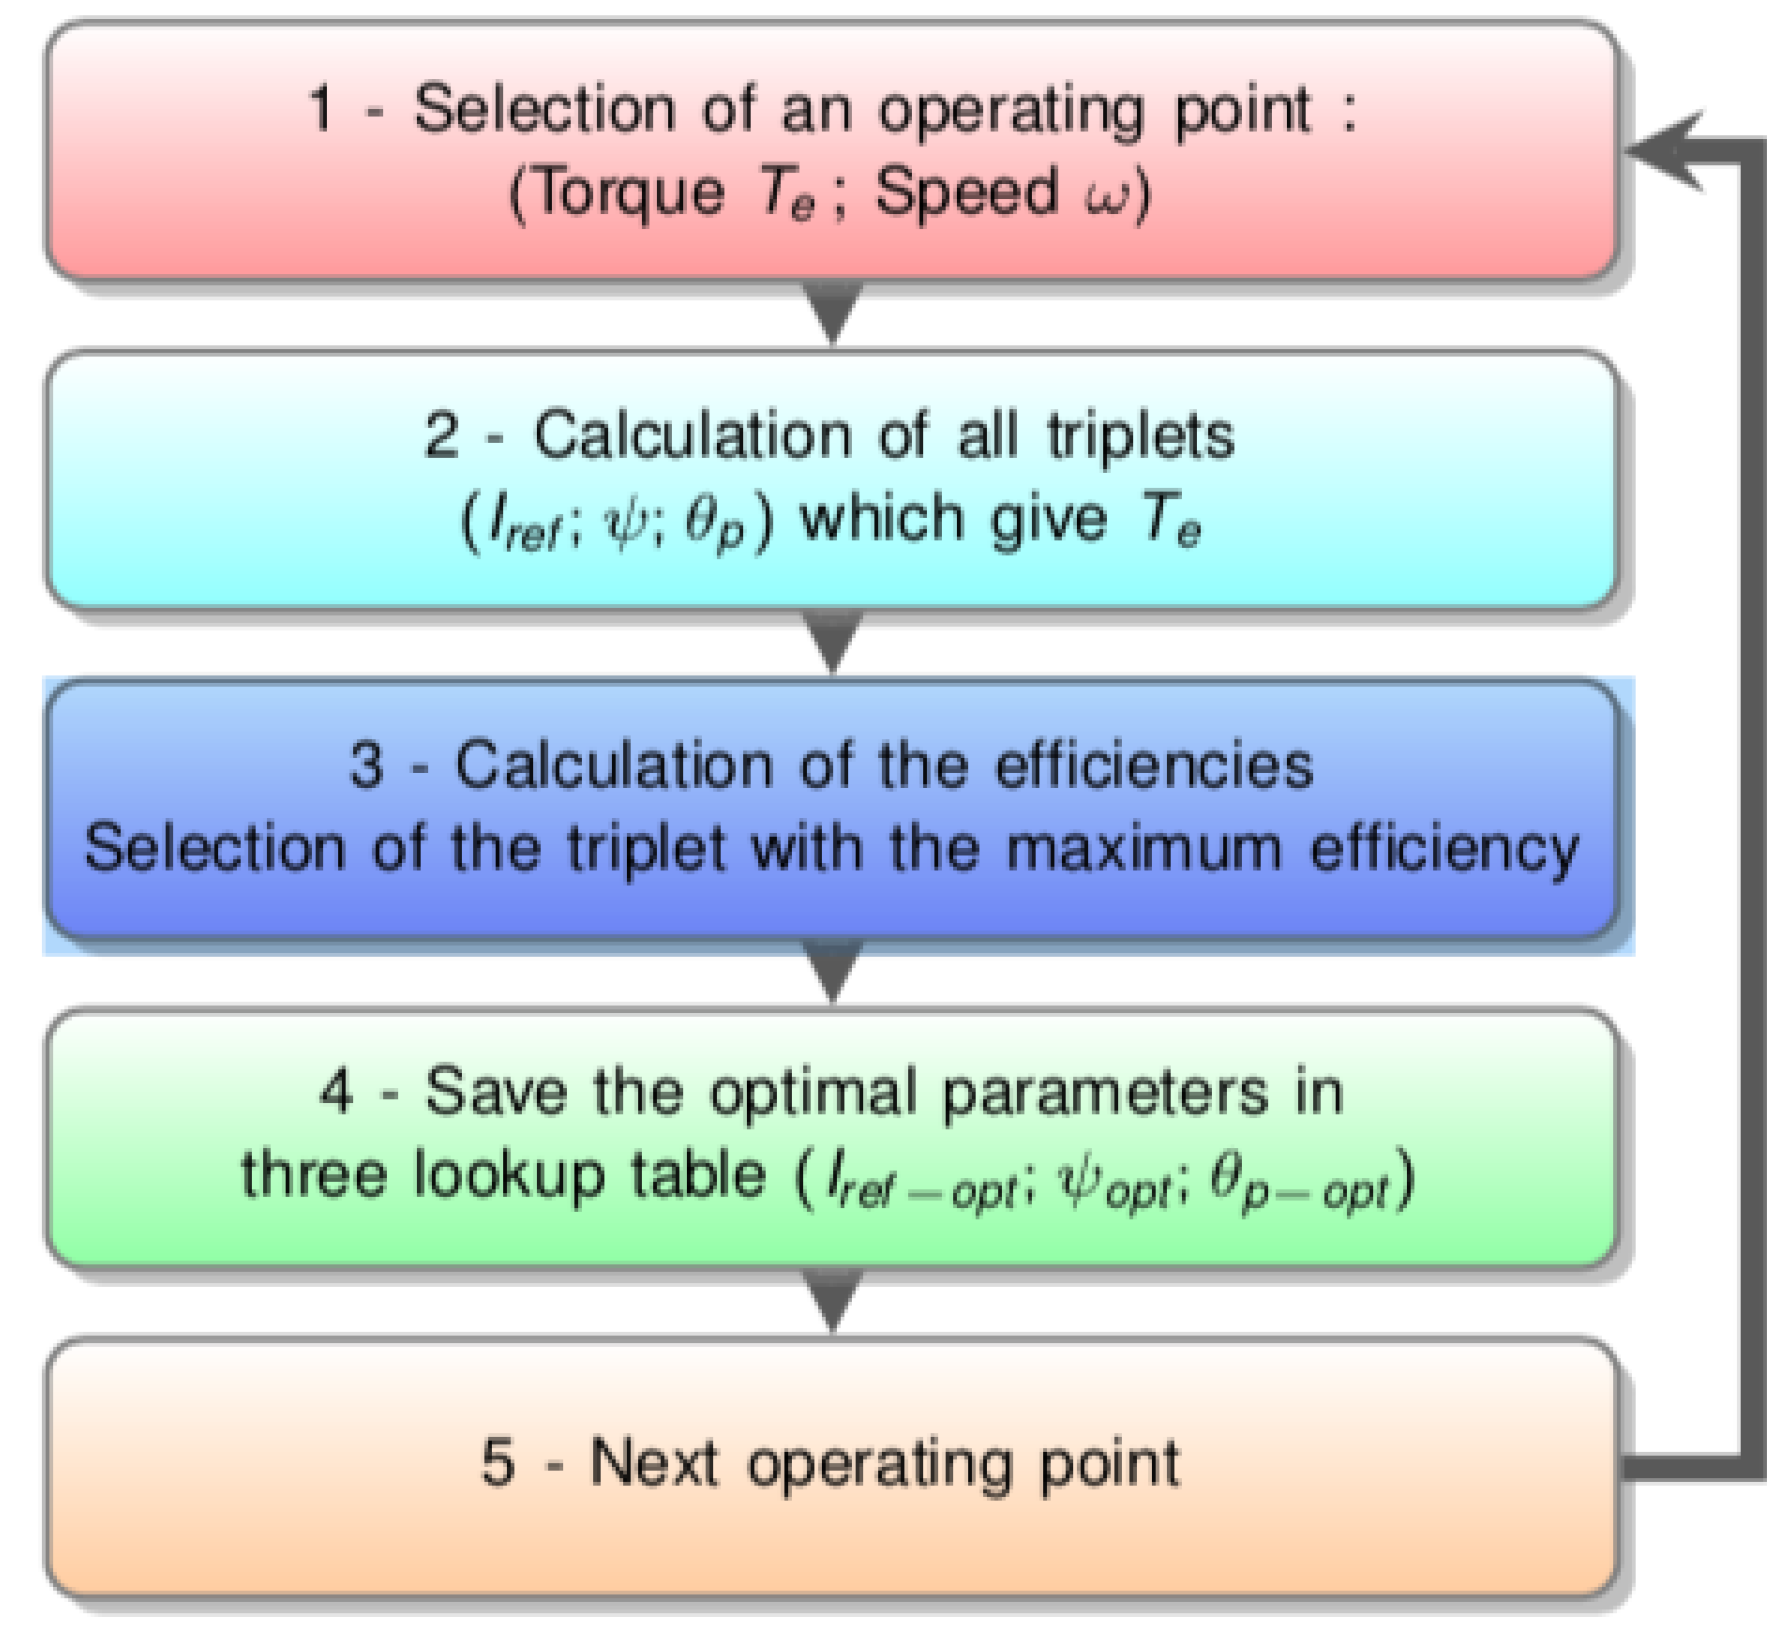
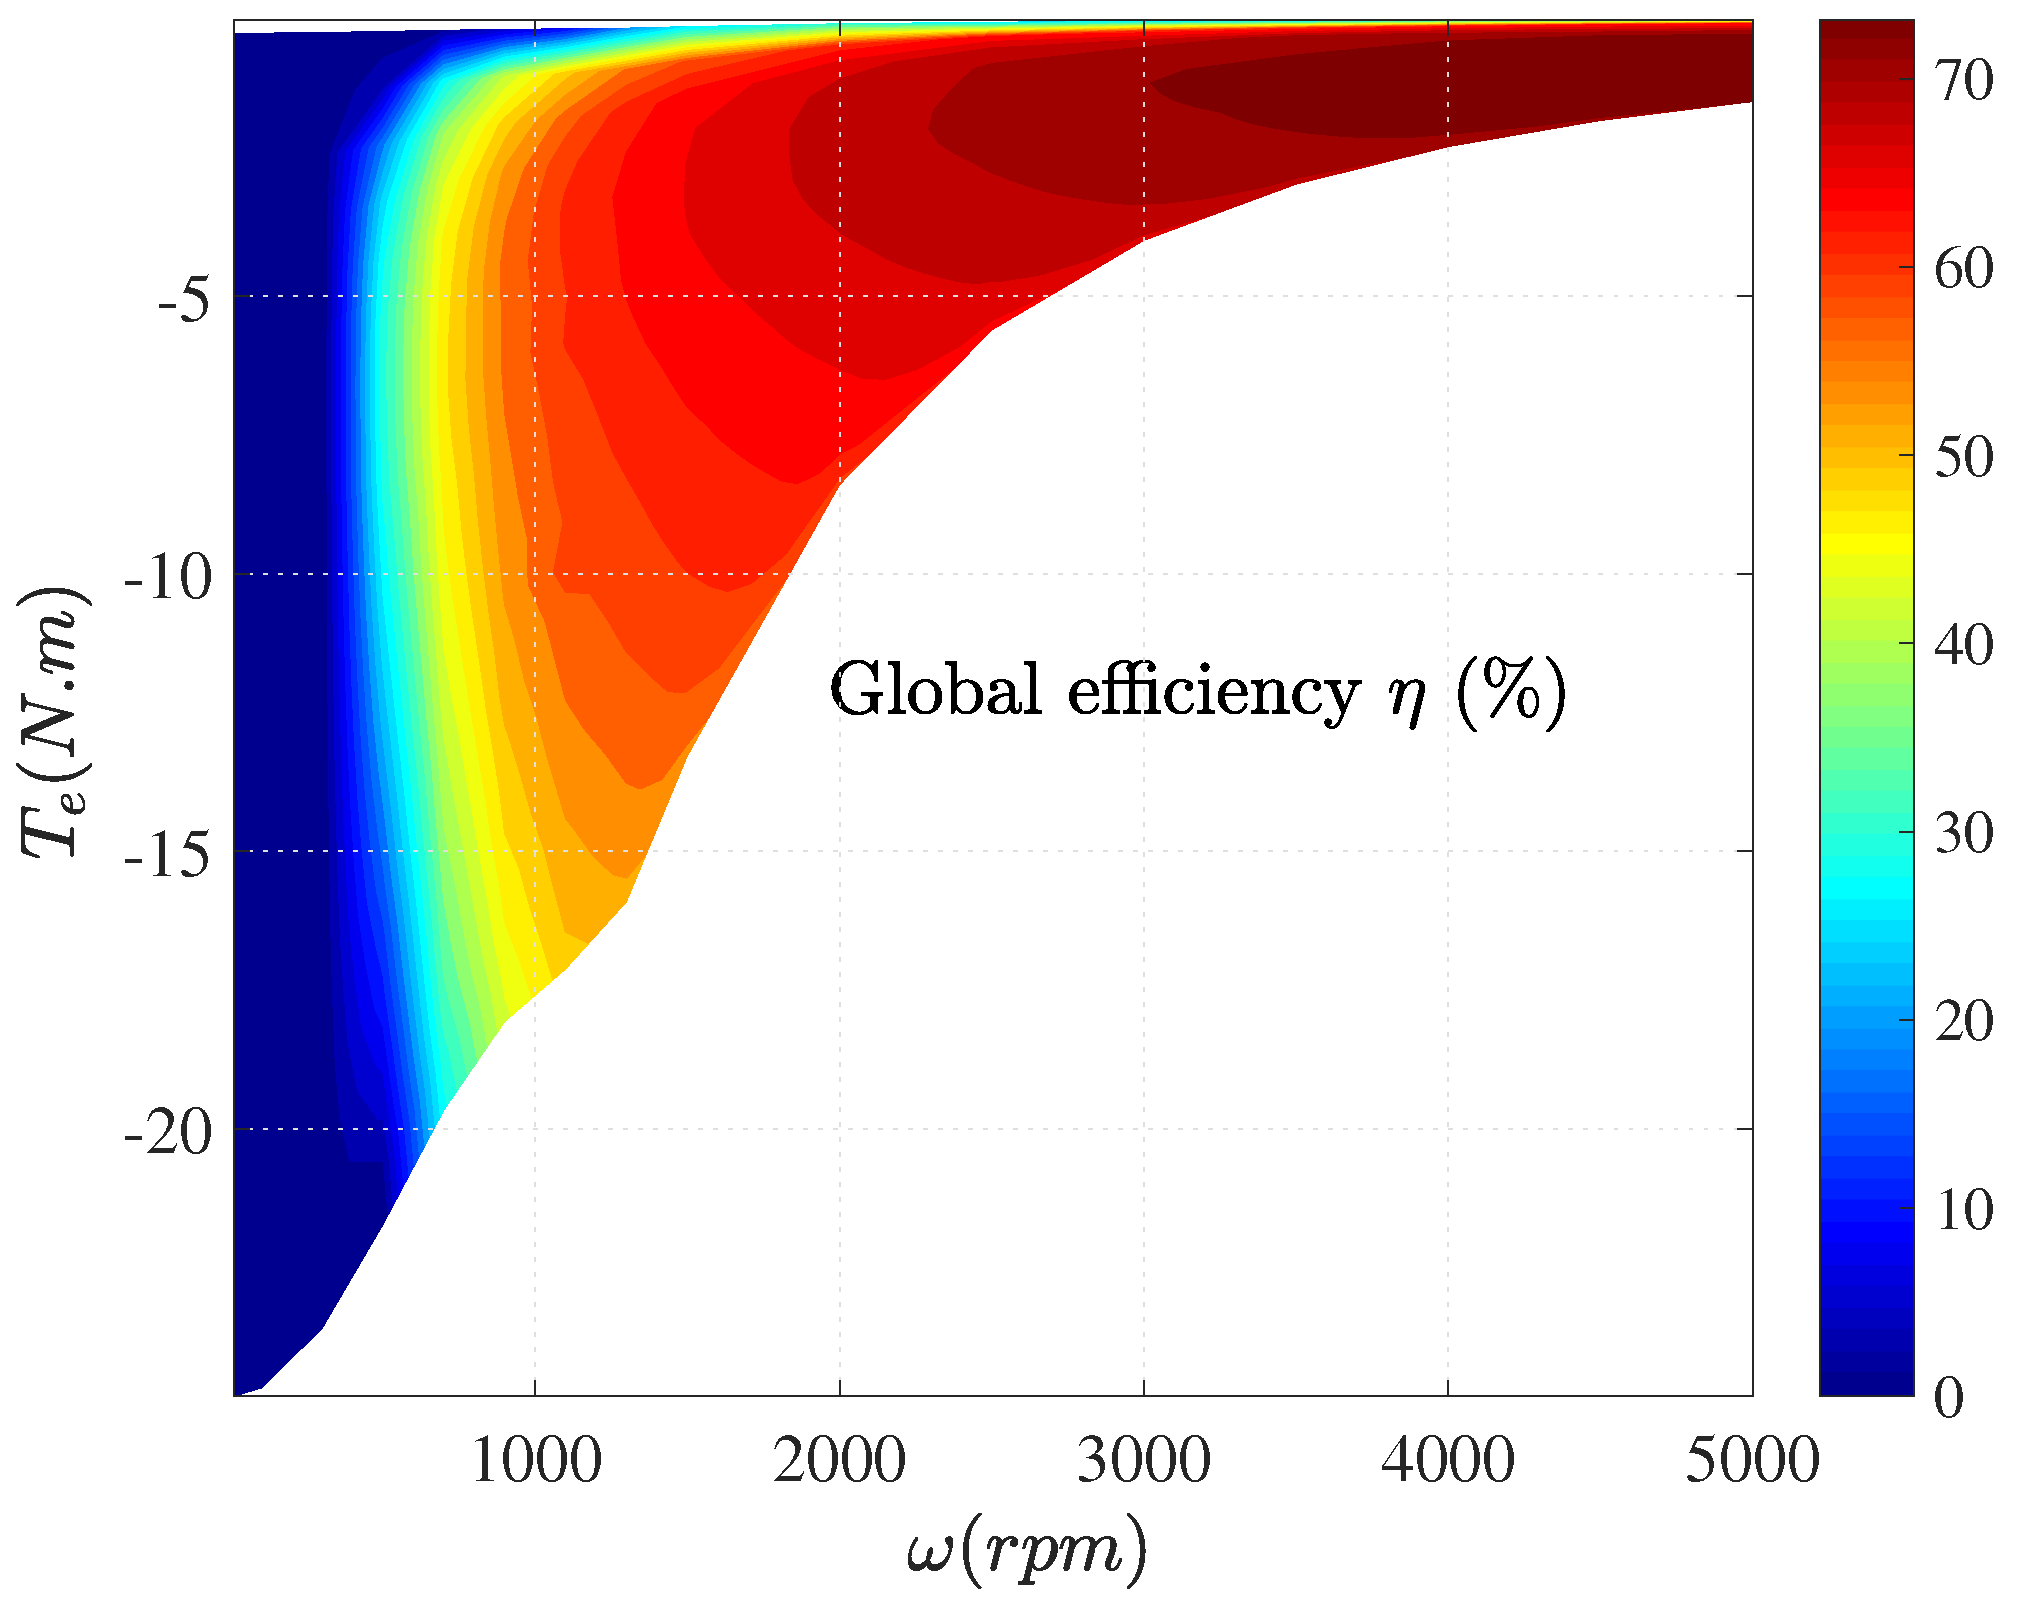
3. Drive Efficiency Optimization

The output DC voltage is sensitive to load and rotational speed variations. To keep constant the output DC voltage and still have the highest electromechanical conversion efficiency, an appropriate choice of the control parameters is essential for guaranteeing more efficient and effective use of the SRG for every operating point in the torque-speed plane. Optimal control parameters allow for a reduction of the torque ripples at low speed and an increase of the efficiency at high speed. In the following, the phase current reference I r e f and the excitation angles ( ψ and θ p ) are retained as generator variables. They are calculated through parametric optimization regarding maximum efficiency criterion. The determination of the efficiency requires the calculation of all losses in the generator: copper losses ( P J ) , magnetic losses ( P m a g ), mechanical losses ( P m e c a ) , and power converter switching and conduction losses ( P c o n v ) . A more detailed study of the SR Motor losses is presented in [31].
Ferromagnetic losses ( P m a g ) are due to variations of magnetic fields in iron and windings. In this calculation, we assume that magnetic losses in the windings are negligible. The ferromagnetic losses (hysteresis and eddy currents losses), thanks to the finite element analysis, are calculated in the different parts of the yoke and, in the stator and rotor teeth based on geometry of the machine, iron volume V i r o n , flux density B, frequency f, and K F and K H constant coefficients depending on the material. The hysteresis ( P H ) losses and eddy current losses ( P F ) are defined according to equation (8).
P F = V i r o n . ( K F ( d B d t ) 2 ) ; P H = V i r o n . ( K H . f . ( Δ B ) 2 )
Finite Elements Analysis software MRVSIM [36] computes the conduction and switching losses in the switches P c o n d and P c o m . The calculation of these losses depends on the control method, switching frequency, current reference waveform, and characteristics of power switches and diodes.
Only aerodynamic losses are evaluated in the calculation of mechanical losses in bearings. The pre-determination of aerodynamic losses in electrical machines is a serious issue because of poor quantification of surface texture. In the software MRVSIM, a correction parameter K a is set based on the comparison between measured and simulated aerodynamic losses at maximum speed.
The copper losses correspond to the Joule losses in SRG windings P J = 4 r I 2 , where I stands for RMS phase current. The minimization of copper losses implies the minimization of the RMS phase current.
The objective function to be maximized is the efficiency defined in Equation (9), where P e m is the electromagnetic power.
η = P e m P J P c o n v P e m + P m a g + P m e c a
The parametric optimization method is presented in the following flowchart (Figure 10). For a given speed ω , the desired torque T e can be obtained with different triplets ( I r e f , ψ , θ p ) . The triplet, which is selected and stored in lookup tables, is the one that satisfies the objective of maximal efficiency and respects the constraints of minimal torque ripples. This procedure is repeated for all of the operating points in the torque-speed plane. Pulse width modulation is no longer possible beyond base speed (1300 rpm). Therefore, the current reference is set as constant, and only the excitation angles (turn-on and conduction angles) are optimized.
The calculation is done for the following ranges:
  • 17 speed values, ω in the range [ 10 , 5000 ] rpm and
  • 91 Torque values, T e in the range [ 26 , 0 ] Nm
The search ranges for the control parameters are:
  • I r e f in the interval [ 5 , 100 ] A with a 5 A step;
  • ψ in the interval [ 60 , 240 ] with a 5 step; and,
  • θ p in the interval [ 120 , 180 ] with a 5 step.
Figure 11 displays the efficiency of the drive in the torque-speed plane: the results show that the highest efficiency of the drive is almost 70%.

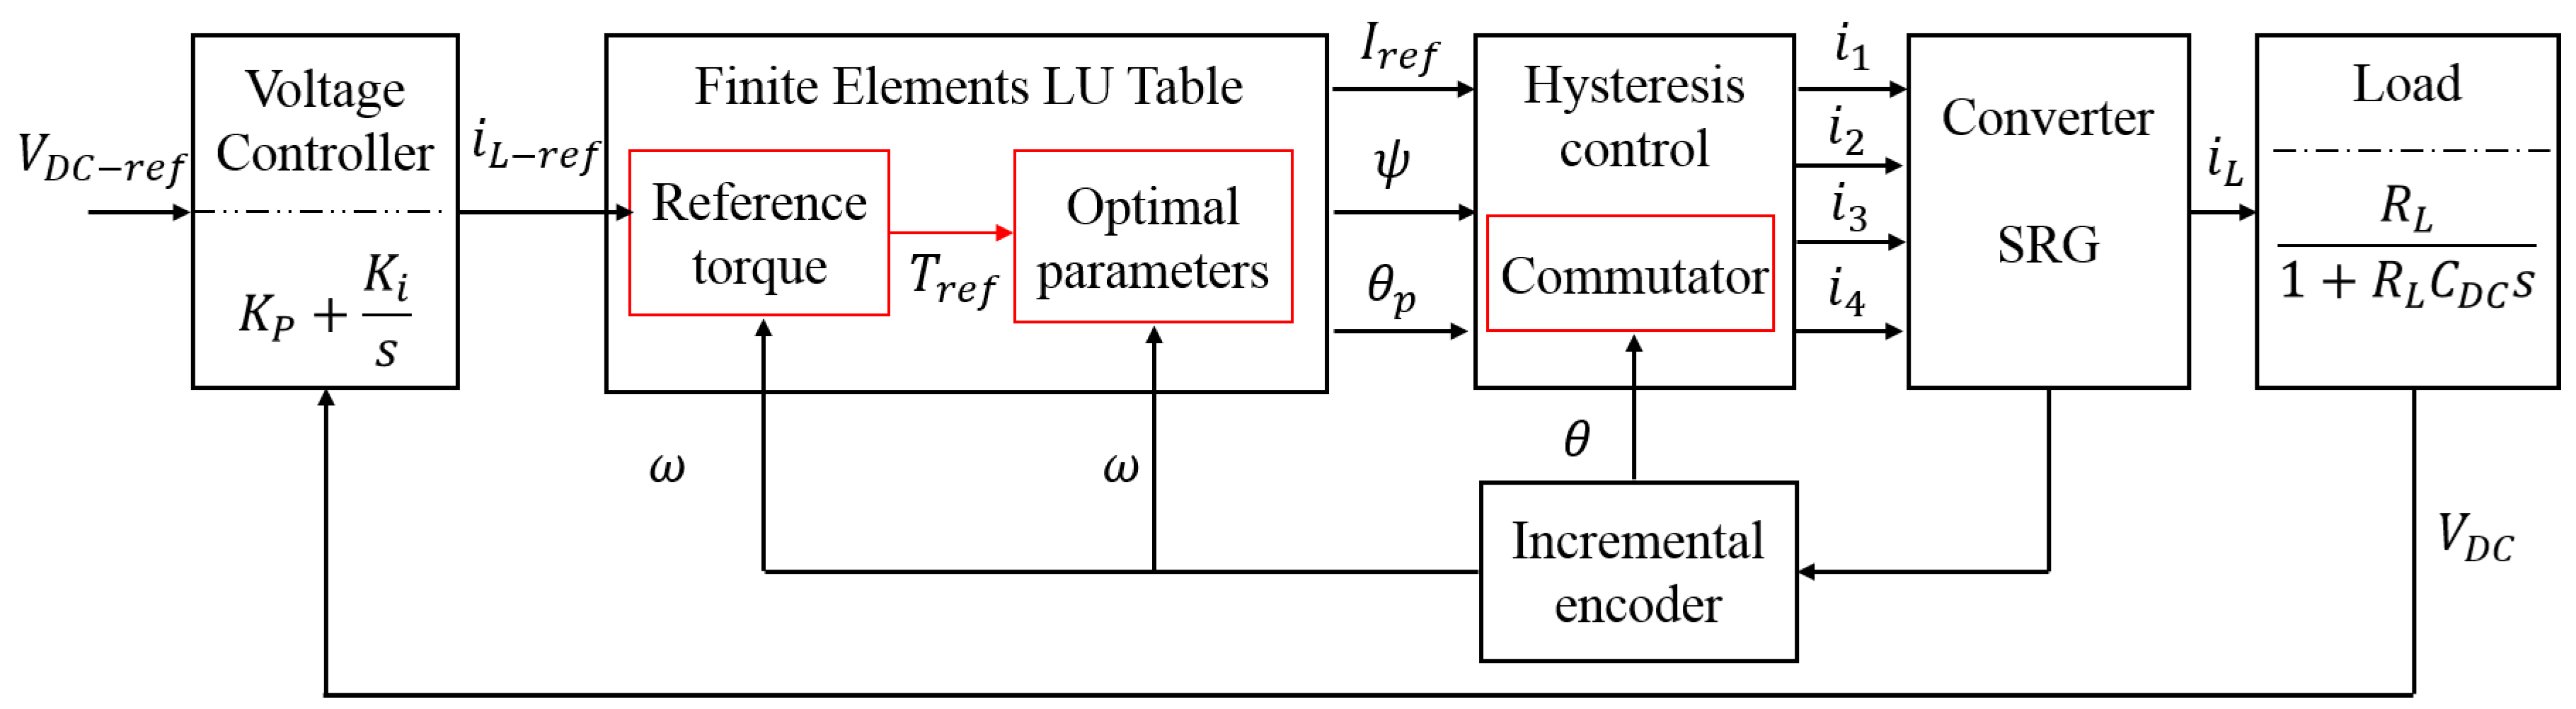
4. Closed Loop Control Strategy

4.1. Control Scheme

The output voltage of the SRG depends on rotor speed, load, phase current reference, and excitation angles. The goal of the control is to maintain the output DC voltage at a constant value V D C r e f = 24 V, despite load variation or any external disturbances. The control scheme of the SRG-based drive is shown in Figure 12. It includes two control loops: an outer loop with a Proportional-Integral (PI) controller to regulate the DC voltage and inner hysteresis current loop to regulate the phase currents. A critical part of this control is the determination of magnetization angles ( ψ , θ p ) and phase current reference in order to optimize the efficiency. This topic is presented in Section 3. The regulation of the DC bus voltage is achieved through a PI regulator that is synthesized through a pole placement method. The DC voltage is measured across the shunt capacitor. The output of the PI controller is the phase current reference.
The block diagram of the voltage control is represented in Figure 12. It consists of outer and inner control loops. The inner one that is devoted to current control is composed of: hysteresis controllers used to regulate the four phases’ currents, the power converter, and the lookup tables containing the optimal key parameters. This internal control loop has higher dynamics than the outer one, which is composed of the voltage regulator and the load. Therefore, it is assumed that in the time frame of the voltage dynamics, the inner current control loop is in steady-state. As a consequence, the current closed-loop transfer function is approximated by a unity function. Then the closed-loop transfer function can be calculated based only on the voltage controller and load transfer functions. The closed-loop transfer function of the DC bus voltage is:
H ( s ) = V D C V D C * = K i / C D C + ( K p / C D C ) . s s 2 + ( R L K p + 1 ) / ( R L C D C ) . s + K i / C D C
When time tends to infinity, the term “ ( K p / C D C ) . s ” vanishes, the closed-loop transfer function of the DC bus can be approximated by a second-order function Equation (11), where ω n is the natural frequency and ξ is the damping ratio.
H ( s ) = V D C V D C * = ω n 2 s 2 + 2 ξ ω n . s + ω n 2
The Pole placement method allows for us to calculate the controller gains K p and K i . To improve the dynamic performance of the DC voltage response, K p must be high enough. The choice of an appropriate bandwidth makes it possible. The bandwidth is set at 10 Hz and the damping at 0.707 . Resistive load is R L = 15 Ω and the capacitor is C D C = 29.4 mF. Compensator parameters are calculated by the equations given below:
K i = C D C ω n 2 , K i = 116
K p = 2 ξ ω n C D C 1 / R L , K p = 2.54

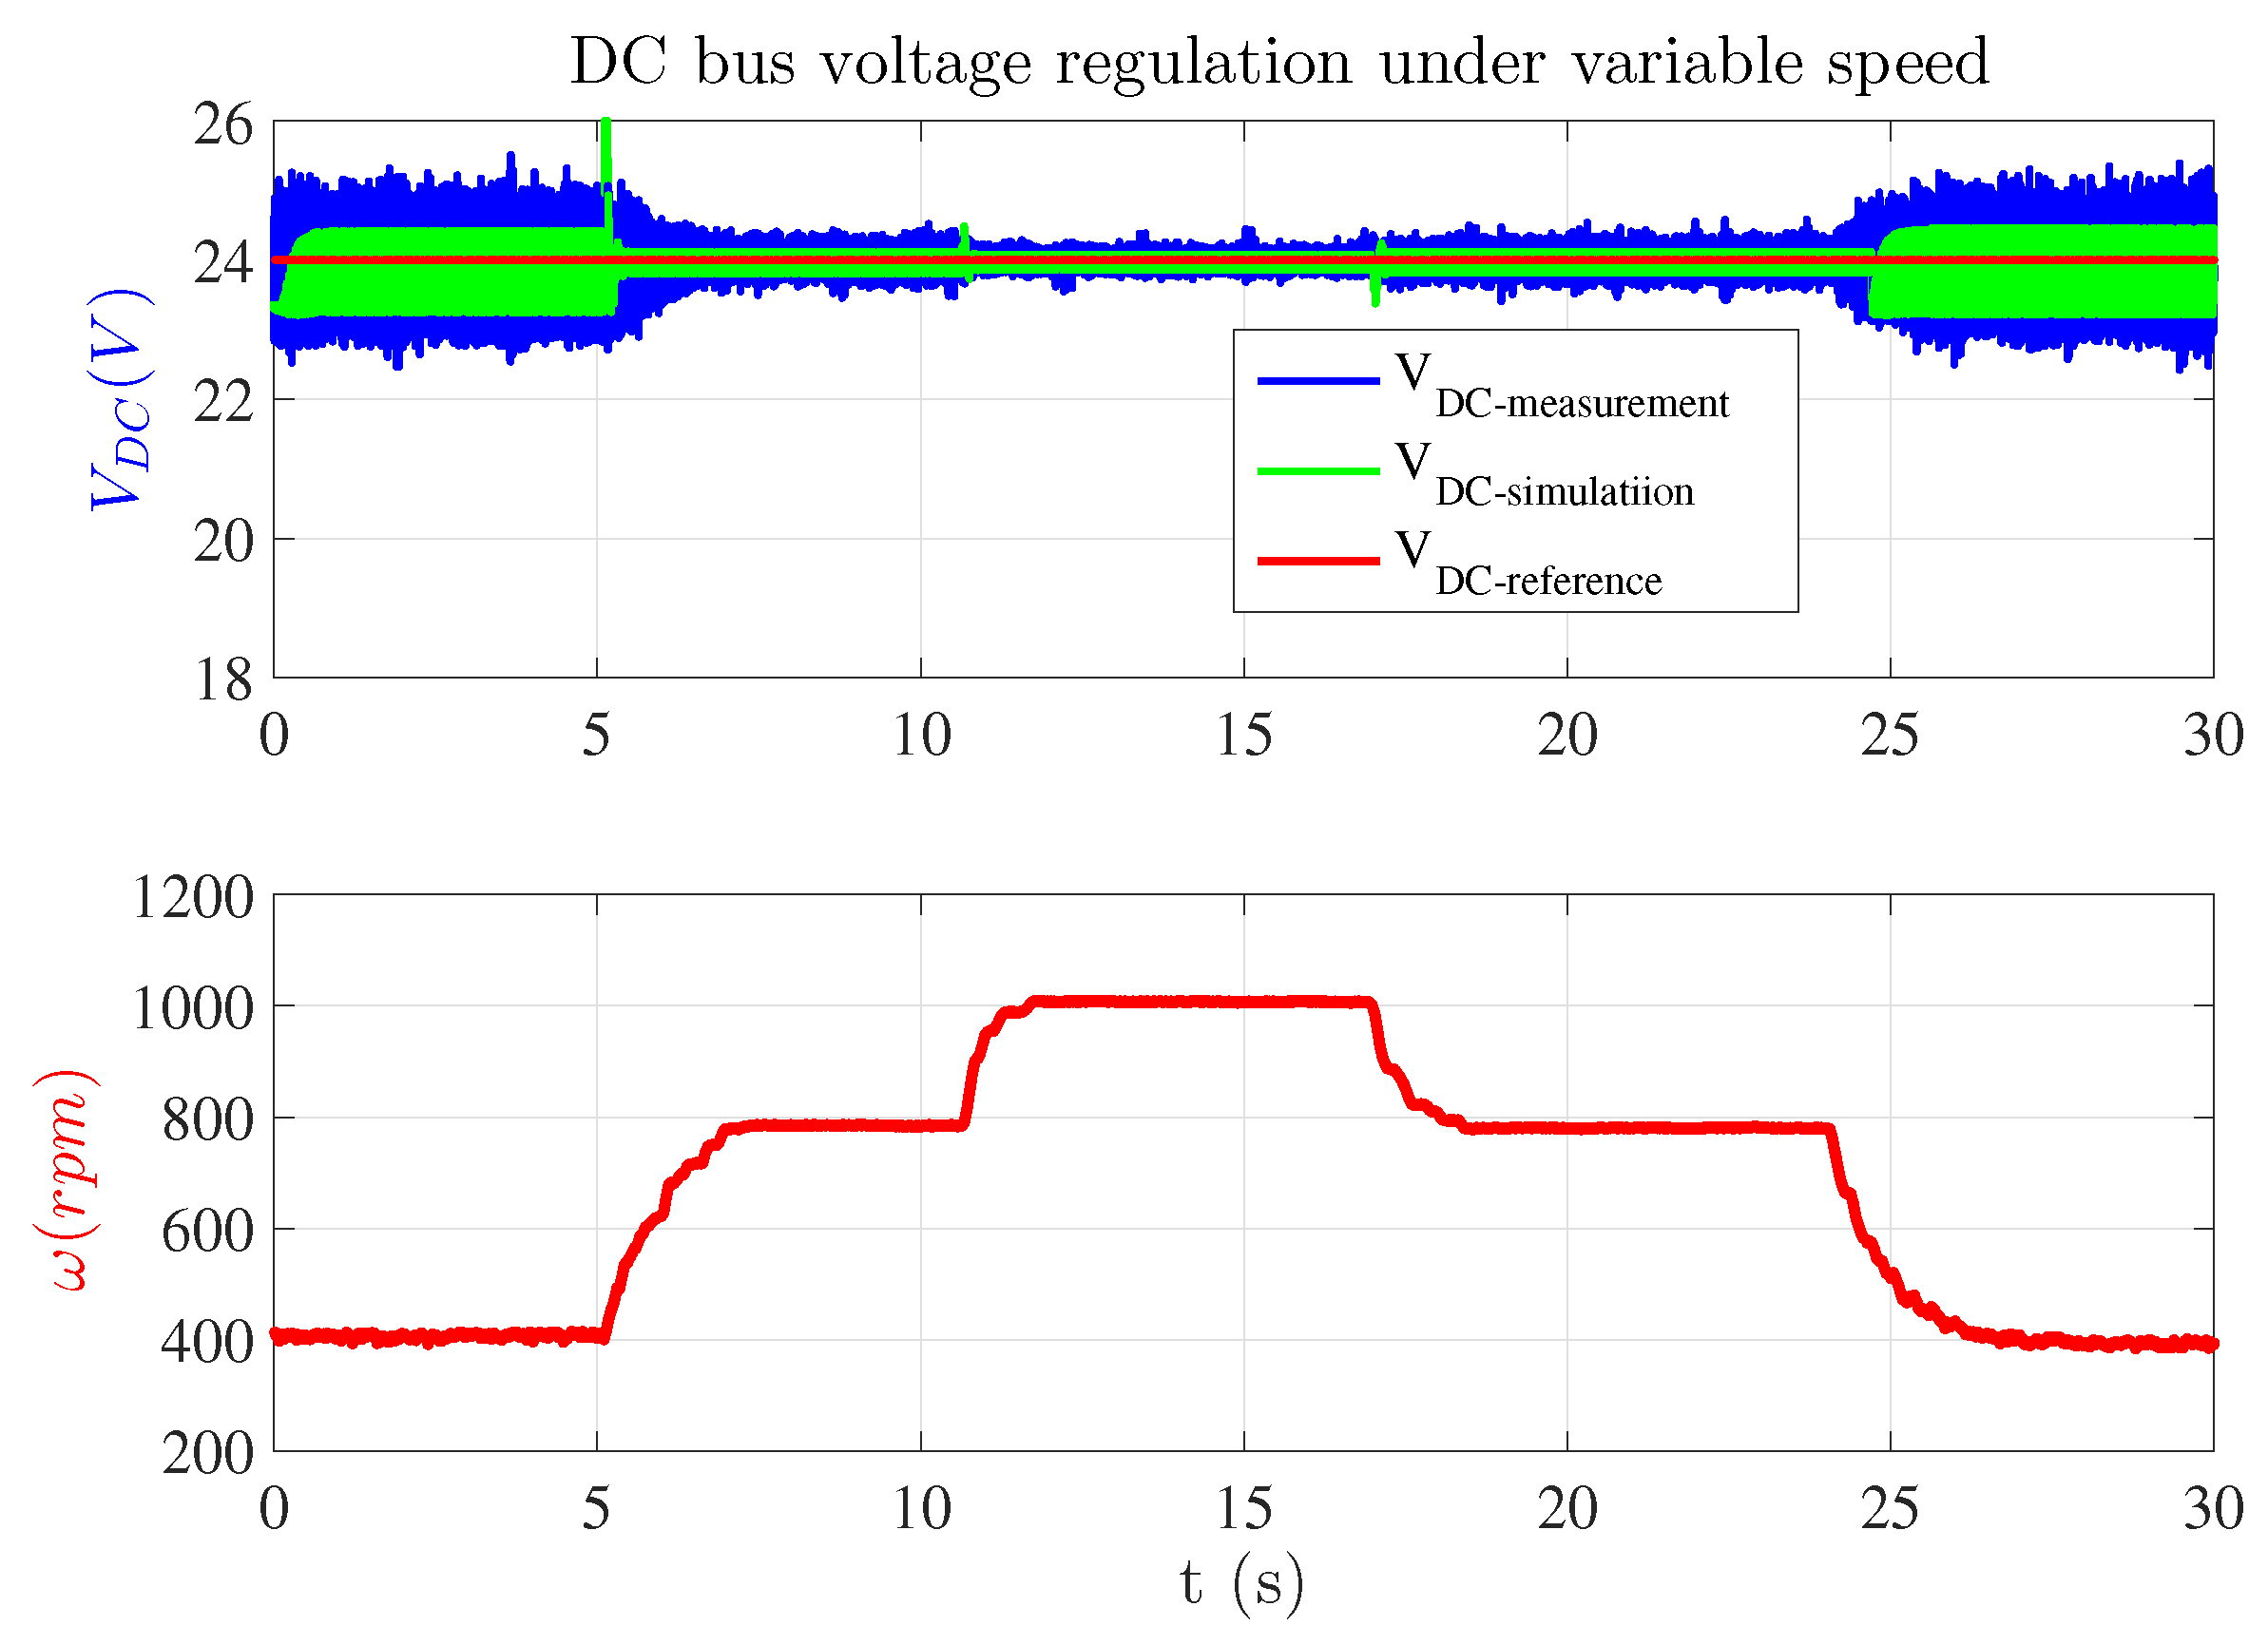
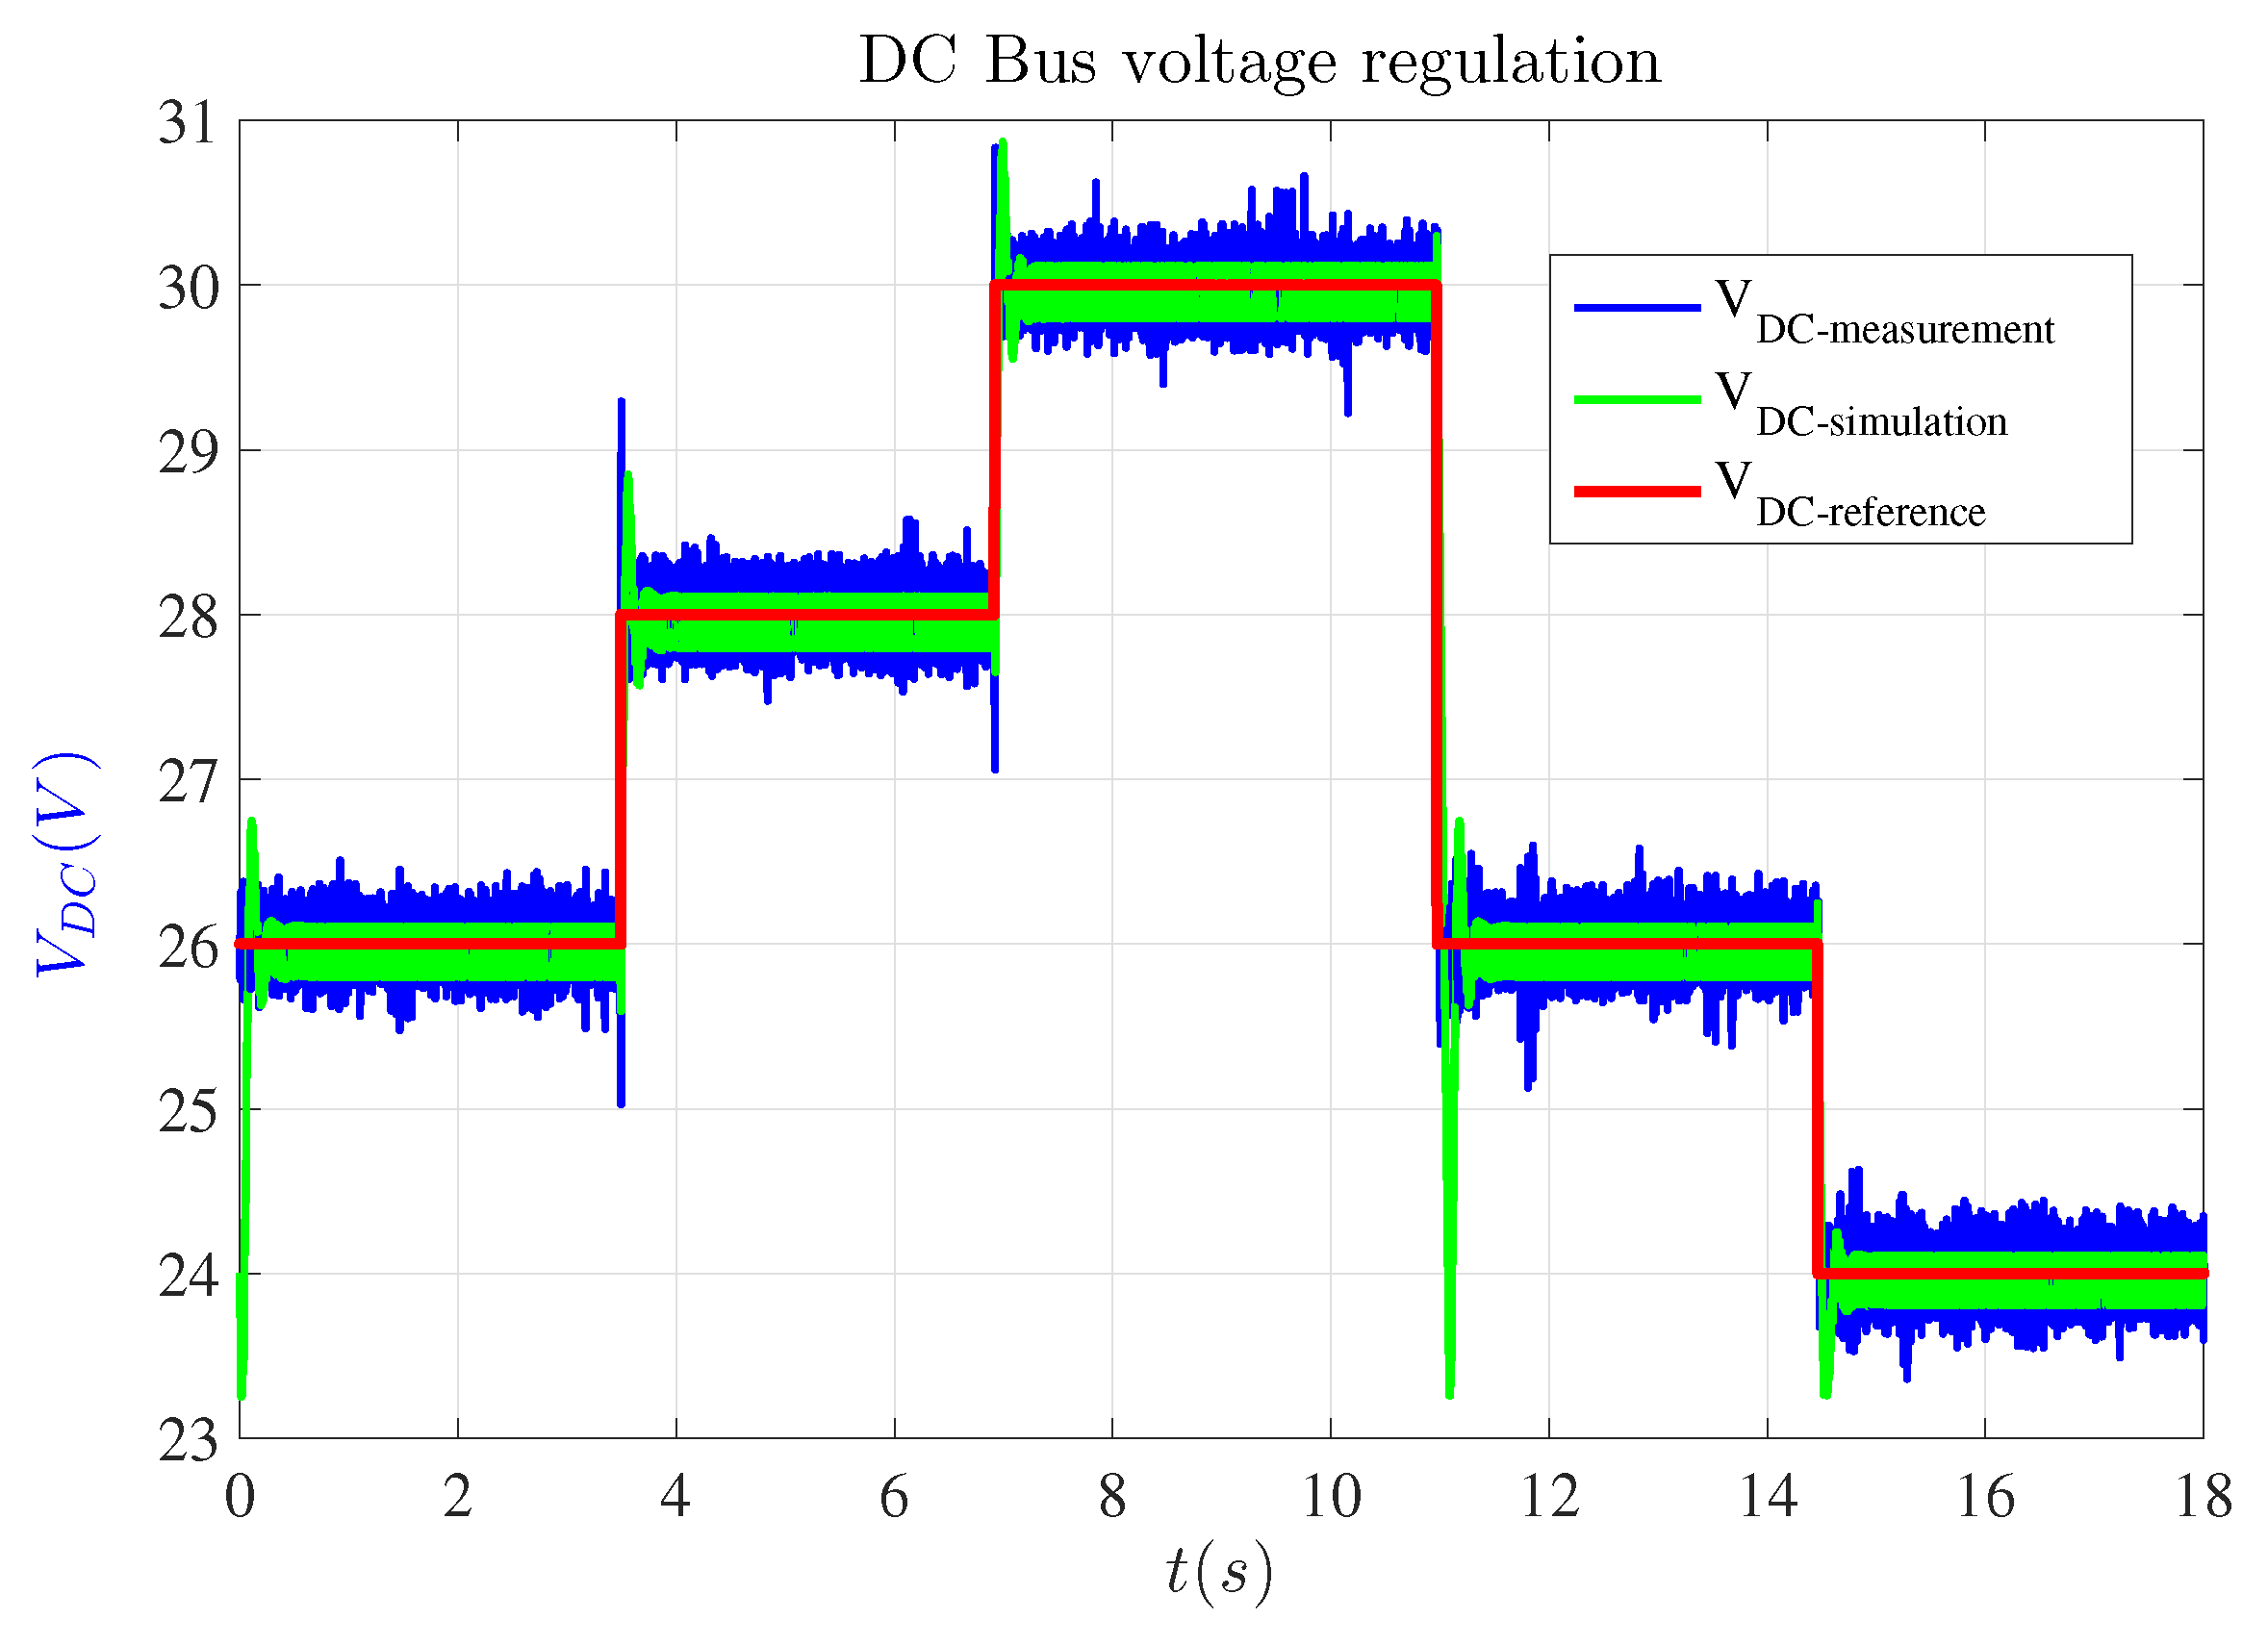
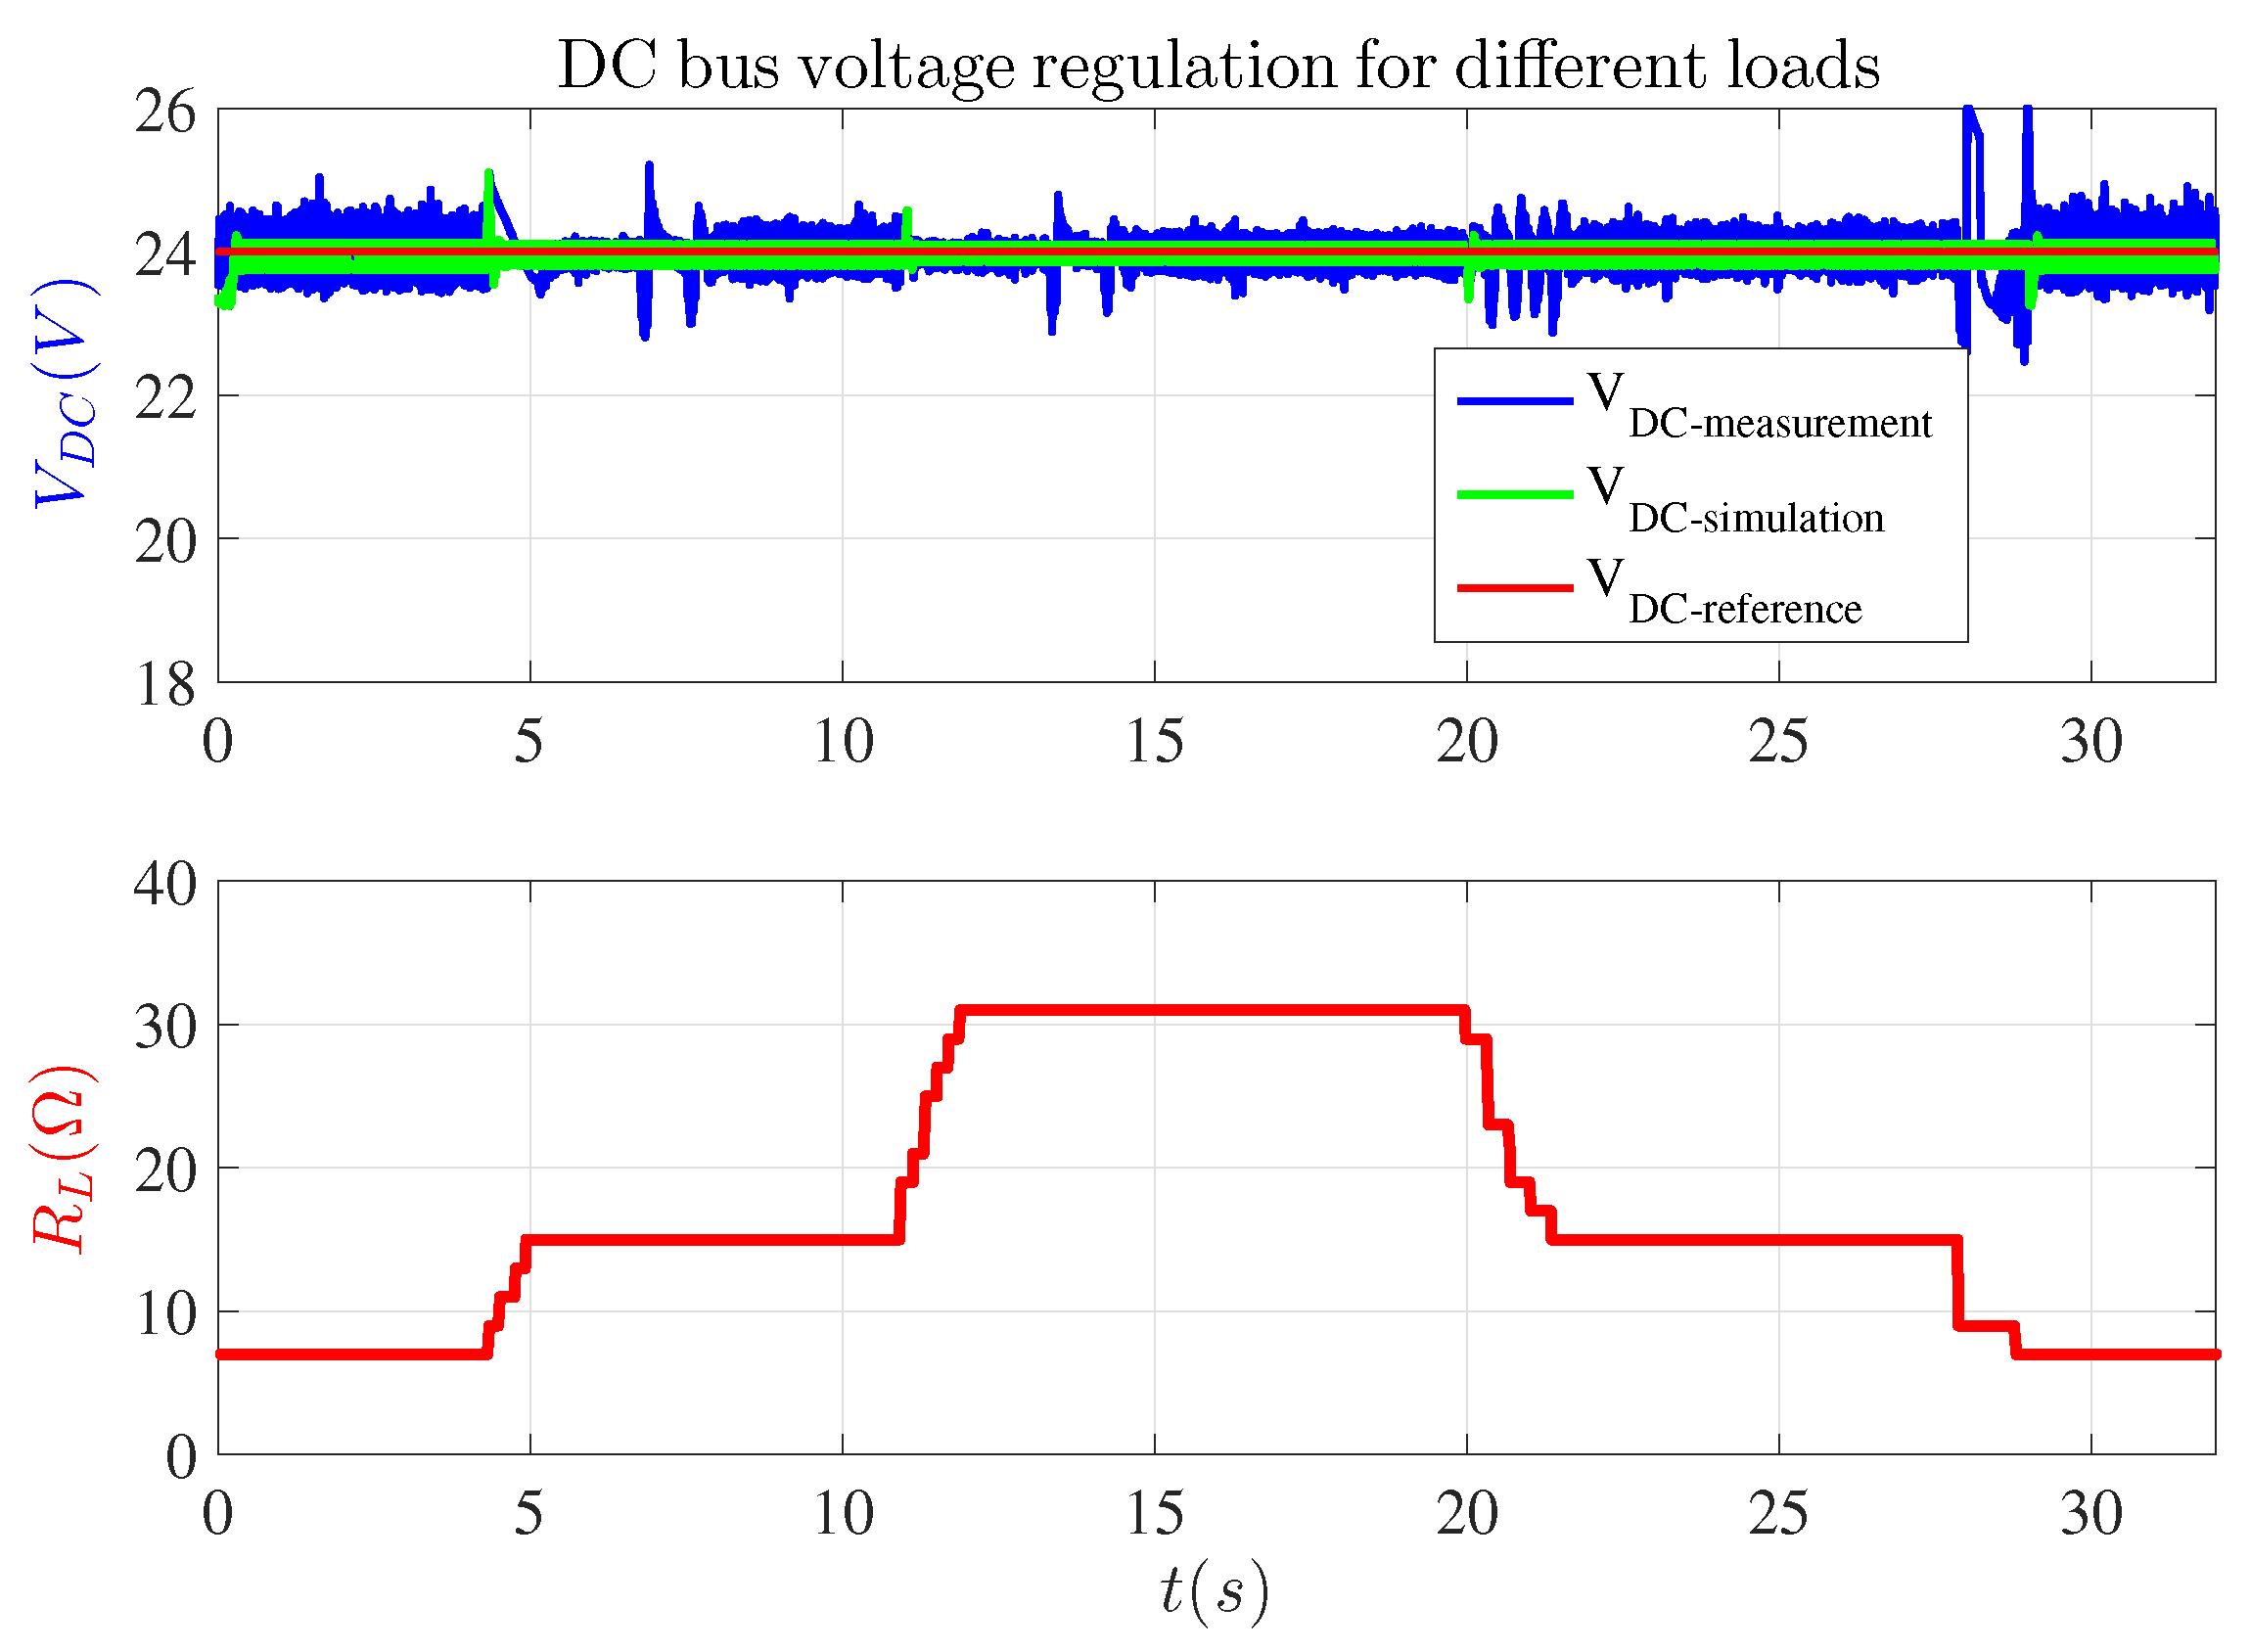
4.2. Simulation and Experimental Results

The proposed control strategy is first implemented in Matlab-Simulink for dynamic simulation in order to evaluate voltage regulation performances. The SRG operation requires mechanical power as an input. For simulation and experimental studies, a DC machine is used to emulate the mechanical power extracted from the wind. The load is emulated with variable resistance, and a shunt capacitor is used to smooth the DC bus voltage. The performance of the voltage controller is verified in Figure 13 through step-changes of the reference voltage when speed is set at 800 rpm and load at 15 Ω . The controller determines control parameters ( I r e f , ψ , θ p ) to set output voltage to the desired reference value. We can observe satisfactory DC voltage regulation performance; the voltage controller reacts very fast to track voltage reference, despite some ripples.
To evaluate the speed variation effect on DC bus control, simulations are conducted with the following conditions: DC bus voltage is regulated at V D C r e f = 24 V and load resistance is set at first to a constant value R L = 15 Ω . Figure 14 illustrates DC voltage waveforms under variable speed for 30 s. We can notice good DC voltage regulation performances in both simulation and test cases. This transient test shows the effectiveness of the proposed control strategy under fluctuated wind speed.
Figure 15 displays step response of the DC voltage loop under load variation at rated speed 800 rpm and voltage reference value set at 24 V. The results that are displayed in Figure 15 show that voltage regulation is effective for the different loads. The results show that the PI controller still tracks the DC voltage reference value.
The comparison of simulated and measured DC bus voltage ripples under different voltage references (Table 2), different speeds (Table 3), and different resistive loads (Table 4) is investigated. The DC voltage ripple ( K ) is defined, as below:
K = V D C M a x V D C M i n V D C A v
Where V D C M a x V D C M i n are maximum and minimum DC bus voltage and V D C A v is the average DC voltage. It can be seen in Figure 13 and Table 2 that the voltage reference value has limited influence on voltage ripples. However, it changes the average value of voltage and torque. The differences between simulation results and measured ones are due to the experimental conditions (disturbances in the measurement, digital-to-analog conversion errors). The influence of speed on voltage ripples is also evaluated in Figure 14 and Table 3. There is a significant reduction of ripples at high speed. Finally, as shown in Figure 15 and listed in Table 4, better performances in terms of voltage ripples are obtained for higher load resistance (low torque).

4.3. Power Conversion Characteristics and Efficiency Measurements: Experimental Validation

The electromechanical conversion efficiency is determined as: η = P o u t / P i n . The operation of SRG requires an external supply voltage to feed the phase windings, so, the input power P i n includes the mechanical power P m e c and the excitation power P e x c :
P i n = 1 T t t + T ω T e . d t + 1 T t t + T V e x c i e x c . d t
The output power P o u t is calculated by measuring the current i L flowing through the resistive load. The DC bus voltage is maintained constant at V D C = 24 V.
P o u t = 1 T t t + T R L i L 2 . d t = 1 T t t + T V D C 2 i L . d t
To illustrate the efficiency optimization issue, Figure 16 shows experimental efficiency measurement as a function of speed and torque. The generator is driven by a DC Machine (12,000 rpm, 2 Nm), and a 24 V external source is used to provide the excitation power at low speed. For higher speeds, the SRG is self-excited by the voltage feedback from the shunt capacitor. The measurement results reveal that SRG-based drive exhibits high efficiency over high speed and torque range. Due to limited load torque, the SRG could not be fully loaded, and all of the simulated operating points could not be reached. However, when looking at the experimental efficiency curve, we can observe the same trend as in the simulations. The drive efficiency increases along with speed and reaches almost 80 % in the constant power region.

5. Conclusions

In this paper, a control strategy of a Switched Reluctance Generator (SRG) for low voltage Dc micro-grid has been proposed. The first objective was to maximize the drive efficiency by taking into account the external excitation source, electrical machine, and power converter losses. The second objective was to regulate the DC bus voltage despite load variations or any external disturbance. The proposed closed-loop DC voltage regulation has proven its effectiveness for all of the speeds and different loads. After the description of the SRG principles, we have identified that the main parameters were the phase current reference, turn on, and conduction angles. Thanks to Finite Element Analysis (FEA) and parametric optimization procedure, optimal control parameters have been obtained and stored in lookup tables for all operating points in the torque-speed plane. The efficacy of the design has been evaluated with numerical simulations and experimental tests of an SRG-based drive feeding a DC variable load. Future works will be devoted to power injection into the grid.

Author Contributions

Conceptualization, A.S., I.B., D.D.; methodology, A.S., I.B., D.D.; software, A.S., E.B.; validation, A.S., E.B.; formal analysis, A.S., I.B., D.D.; investigation, A.S., I.B., D.D.; writing—original draft preparation, A.S., I.B., D.D., A.K.; writing—review and editing, A.S., I.B., D.D.; supervision I.B., D.D. All authors have read and agreed to the published version of the manuscript.

Funding

This research received no external funding.

Conflicts of Interest

The authors declare no conflict of interest.

References

  1. Sechilariu, M.; Locment, F. Urban DC Microgrid; Elsevier, Butterworth-Heinemann: Oxford, UK, 2016. [Google Scholar]
  2. Anwar, M.; Husain, I. Radial force calculation and acoustic noise prediction in switched reluctance machine. IEEE Trans. Ind. Appl. 2000, 36, 1586–1597. [Google Scholar]
  3. Li, S.; Zhang, S.; Habetler, T.G.; Harley, R.G. Modeling, Design Optimization, and Applications of Switched Reluctance Machines—A Review. IEEE Trans. Ind. Appl. 2019, 55, 2660–2681. [Google Scholar] [CrossRef]
  4. Radimov, N.; Ben-Hail, N.; Rabinovici, R. Switched Reluctance Machines as Three-Phase AC Autonomous Generator. IEEE Trans Magn. 2006, 42, 3760–3764. [Google Scholar] [CrossRef]
  5. Cardenas, R.; Pena, R.; Perez, M.; Clare, J.; Asher, G.; Wheeler, P. Control of a switched reluctance generator for variable-speed wind energy applications. IEEE Trans. Energy Convers. 2005, 20, 781–791. [Google Scholar] [CrossRef]
  6. Yahia, H.; Liouane, N.; Dhifaoui, R. Differential evolution method-based output power optimisation of switched reluctance generator for wind turbine applications. IET Renew. Power Gener. 2014, 8, 795–806. [Google Scholar] [CrossRef]
  7. Liu, X.; Wang, C.; Chen, Z. Characteristics Analysis of an Excitation Assistance Switched Reluctance Wind Power Generator. IEEE Trans Magn. 2015, 51, 1–4. [Google Scholar]
  8. Barros, T.A.S.; Ruppert Filho, E. Direct Power Control for Switched Reluctance Generator in Wind Energy. IEEE Lat. Am. Trans. 2015, 13, 123–128. [Google Scholar] [CrossRef] [Green Version]
  9. Barros, T.A.; Neto, P.J.; Filho, P.S.; Moreira, A.B.; Ruppert, E. Approach for performance optimization of switched reluctance generator in variable-speed wind generation system. Renew. Energy 2016, 97, 114–128. [Google Scholar] [CrossRef]
  10. Wang, D.; Shao, C.; Wang, X.; Zhang, C. Performance Characteristics and Preliminary Analysis of Low Cost Tubular Linear Switch Reluctance Generator for Direct Drive WEC. IEEE Trans. Appl. Supercond. 2016, 26, 1–5. [Google Scholar] [CrossRef]
  11. Neto, P.J.S.; Barros, T.A.S.; De Paula, M.V.; de Souza, R.R.; Filho, E.R. Design of Computational Experiment for Performance Optimization of a Switched Reluctance Generator in Wind Systems. IEEE Trans. Energy Convers. 2018, 33, 406–419. [Google Scholar] [CrossRef]
  12. Schofield, N.; Long, S. Generator Operation of a Switched Reluctance Starter/Generator at Extended Speeds. IEEE Trans. Veh. Technol. 2009, 58, 48–56. [Google Scholar] [CrossRef]
  13. Boldea, I.; Tutelea, L.; Parsa, L.; Dorrell, D. Automotive Electric Propulsion Systems With Reduced or No Permanent Magnets: An Overview. IEEE Trans. Ind. Electron. 2014, 61, 5696–5711. [Google Scholar] [CrossRef]
  14. Hu, Y.; Song, X.; Cao, W.; Ji, B. New SR Drive with Integrated Charging Capacity for Plug-In Hybrid Electric Vehicles (PHEVs). IEEE Trans. Ind. Electron. 2014, 61, 5722–5731. [Google Scholar] [CrossRef] [Green Version]
  15. Han, S.; Cui, S.; Song, L.; Chan, C.C. Electromagnetic Analysis and Design of Switched Reluctance Double-Rotor Machine for Hybrid Electric Vehicles. Energies 2014, 7, 6665–6688. [Google Scholar] [CrossRef] [Green Version]
  16. Urase, K.; Yabu, N.; Kiyota, K.; Sugimoto, H.; Chiba, A.; Takemoto, M.; Ogasawara, S.; Hoshi, N. Energy Efficiency of SR and IPM Generators for Hybrid Electric Vehicle. IEEE Trans. Ind. Appl. 2015, 51, 2874–2883. [Google Scholar] [CrossRef]
  17. Valdivia, V.; Todd, R.; Bryan, F.J.; Barrado, A.; Lzaro, A.; Forsyth, A.J. Behavioral Modeling of a Switched Reluctance Generator for Aircraft Power Systems. IEEE Trans. Ind. Electron. 2014, 61, 2690–2699. [Google Scholar] [CrossRef]
  18. Bartolo, B.; Degano, M.; Espina, J.; Gerada, C. Design and Initial Testing of a High-Speed 45-kW Switched Reluctance Drive for Aerospace Application. IEEE Trans. Ind. Electron. 2014, 64, 988–997. [Google Scholar] [CrossRef]
  19. Tursini, M.; Villani, M.; Fabri, G.; Di Leonardo, L. A switched-reluctance motor for aerospace application: Design, analysis and results. Electr. Power Syst. Res. 2017, 112, 74–83. [Google Scholar] [CrossRef]
  20. Cardenas, R.; Pena, R.; Perez, M.; Clare, J.; Asher, G.; Wheeler, P. Power Smoothing Using a Flywheel Driven by a Switched Reluctance Machine. IEEE Trans. Ind. Electron. 2006, 53, 1086–1093. [Google Scholar] [CrossRef]
  21. Wang, Q.; Chen, H.; Cheng, H.; Yan, S.; Abbas, S. An Active Boost Power Converter for Improving the Performance of Switched Reluctance Generators in DC Generating Systems. IEEE Trans. Power Electron. 2020, 35, 4741–4755. [Google Scholar] [CrossRef]
  22. Wang, B.; Wang, Y.; Xu, Y.; Zhang, X.; Gooi, H.B.; Ukil, A.; Tan, X. Consensus-based Control of Hybrid Energy Storage System with a Cascaded Multiport Converter in DC Microgrids. IEEE Trans. Sustain. Energy 2019, 1. [Google Scholar] [CrossRef]
  23. Hu, K.W.; Wang, J.C.; Lin, T.S.; Liaw, C.M. A Switched-Reluctance Generator with Interleaved Interface DC-DC Converter. IEEE Trans. Energy Convers. 2015, 30, 273–284. [Google Scholar] [CrossRef]
  24. Chang, Y.; Liaw, C. On the Design of Power Circuit and Control Scheme for Switched Reluctance Generator. IEEE Trans. Power Electron. 2008, 23, 445–454. [Google Scholar] [CrossRef]
  25. Mendes, R.; Calado, M.R.; Mariano, S. Maximum Power Point Tracking for a Point Absorber Device with a Tubular Linear Switched Reluctance Generator. Energies 2018, 11, 2192. [Google Scholar] [CrossRef] [Green Version]
  26. Dos Reis, L.; Coelho, A.; Almeida, O.; Campos, J. Modeling and controller performance assessment for a switched reluctance motor drive based on setpoint relay. ISA Trans. 2009, 48, 206–212. [Google Scholar] [CrossRef]
  27. Miller, T. (Ed.) Electronic Control of Switched Reluctance Machine; Newness Power Engineering Series; Reed Educational and Professional Publishing Ltd.: Glasgow, UK, 2001. [Google Scholar]
  28. Torrey, D.A. SRG and their control. IEEE Trans. Ind. Electron. 2002, 49, 3–14. [Google Scholar] [CrossRef]
  29. Kioskeridis, I.; Mademlis, C. Optimal efficiency control of switched reluctance generators. IEEE Trans. Power Electron. 2006, 21, 1062–1071. [Google Scholar] [CrossRef]
  30. Labiod, C.; Srairi, K.; Mahdad, B.; Benchouia, M.T.; Benbouzid, M. Speed Control of 8/6 Switched Reluctance Motor with Torque Ripple Reduction Taking into Account Magnetic Saturation Effects. Energy Procedia 2016, 74, 112–121. [Google Scholar] [CrossRef] [Green Version]
  31. Hannoun, H.; Hilairet, M.; Marchand, C. Design of an SRM Speed Control Strategy for a Wide Range of Operating Speeds. IEEE Trans. Ind. Electron. 2010, 57, 2911–2921. [Google Scholar] [CrossRef] [Green Version]
  32. Viajante, G. A grid connection scheme of a SRG for active power injection. In Proceedings of the Electric Machines and Drives Conference (IEMDC), Chicago, IL, USA, 12–15 May 2013. [Google Scholar]
  33. Yu, G.; Ma, L.; Cheng, H.; Chen, H.; Yingjie, H. Research on the control strategy SRG system. In Proceedings of the International Power Electronics and Application Conference and Exposition, Shanghai, China, 5–8 November 2014. [Google Scholar]
  34. Mese, E.; Sozer, Y.; Kokernak, J.M.; Torrey, D.A. Optimal excitation of a high speed SRG. In Proceedings of the Fifteenth Annual IEEE Applied Power Electronics Conference and Exposition (APEC 2000), New Orleans, LA, USA, 6–10 February 2000. [Google Scholar]
  35. Liang, X.; Li, G.; Ojeda, J.; Gabsi, M.; Ren, Z. Comparative Study of Classical and Mutually Coupled Switched Reluctance Motors Using Multiphysics Finite-Element Modelling. IEEE Trans. Ind. Electron. 2014, 61, 5066–5074. [Google Scholar] [CrossRef]
  36. Mesbes, M.; Multon, B. MRVSim code: Logiciel de simulation pour l’aide au dimensionnement des MRVDS et de convertisseur. IDDN.FR 2008. 001.430010.000.S.C.2004.000.30645. [Google Scholar]
Figure 1. Phase inductance variation versus position.
Energies 13 03032 g001
Figure 2. Electrical layout of power generation.
Energies 13 03032 g002
Figure 3. SRG operating modes.
Energies 13 03032 g003
Figure 4. Experimental Switched Reluctance (SR) Generator drive.
Energies 13 03032 g004
Figure 5. Influence of turn on angle on DC bus voltage. The other parameters are set to: I r e f = 16 A, θ p = 150 , R L = 15 Ω , ω = 800 rpm.
Energies 13 03032 g005
Figure 6. Influence of the conduction angle on the DC bus voltage. The other parameters are set to: I r e f = 16 A, ψ = 180 , R L = 15 Ω , and ω = 800 rpm.
Energies 13 03032 g006
Figure 7. Influence of the reference current on the DC bus voltage. The other parameters are set to: ψ = 180 , θ p = 150 , R L = 15 Ω , and ω = 800 rpm.
Energies 13 03032 g007
Figure 8. Influence of the velocity on the DC bus voltage. The other parameters are set to: I r e f = 16 A, ψ = 180 , θ p = 150 , and R L = 15 Ω .
Energies 13 03032 g008
Figure 9. Influence of the load on the DC bus voltage. The other parameters are set to: I r e f = 16 A, ψ = 180 , θ p = 150 , and ω = 800 rpm.
Energies 13 03032 g009
Figure 10. Flowchart of the parametric method.
Energies 13 03032 g010
Figure 11. Drive efficiency.
Energies 13 03032 g011
Figure 12. SRG-based drive control block diagram.
Energies 13 03032 g012
Figure 13. DC bus voltage regulation for different control parameters, at ω = 800 rpm and R L = 15 Ω .
Energies 13 03032 g013
Figure 14. SRG operation under variable speed, at R L = 15 Ω .
Energies 13 03032 g014
Figure 15. DC bus voltage regulation for different loads, at ω = 800 rpm.
Energies 13 03032 g015
Figure 16. Experimental efficiency of the SRG-based drive.
Energies 13 03032 g016
Table 1. Switched Reluctance Generator (SRG) characteristics.
ParameterSymbolValueUnit
Number of stator poles N s 8
Number of rotor poles N r 6
Number of phasesq4
Nominal power P n 1200W
Nominal speed ω n 3000rpm
Nominal torque T n 4.5 Nm
Maximal current I m a x 100A
Inertia factorJ 0.0068 kg·m 2
Friction coefficientF 0.005 Nm/rad s 1
Windings resistancer 0.05 Ω
Table 2. DC bus voltage ripple comparison between simulation and measurement at ω = 800 rpm and R L = 15 Ω .
VoltageSimulationMeasurement
V D C r e f = 24 V 1.25 % 2.90 %
V D C r e f = 26 V 1.15 % 2.35 %
V D C r e f = 28 V 1.11 % 2.43 %
V D C r e f = 30 V 1.07 % 2.33 %
Table 3. DC bus voltage ripple comparison between simulation and measurement at V D C = 24 V and R L = 15 Ω .
SpeedSimulationMeasurement
ω = 400 rpm 4.83 % 9.54 %
ω = 800 rpm 1.29 % 3.40 %
ω = 1000 rpm 0.92 % 2.04 %
Table 4. DC bus voltage ripples comparison between simulation and measurement at V D C = 24 V and ω = 800 rpm.
Load ResistanceSimulationMeasurement
R L = 7 Ω 1.54 % 4.87 %
R L = 15 Ω 1.17 % 3.42 %
R L = 31 Ω 0.96 % 2.54 %

