Article

The Application of the Bispectrum Analysis to Detect the Rotor Unbalance of the Induction Motor Supplied by the Mains and Frequency Converter

Department of Electrical Machines, Drives and Measurements, Wrocław University of Science and Technology, 50-370 Wroclaw, Poland
Energies 2020, 13(11), 3009; https://doi.org/10.3390/en13113009
Submission received: 19 May 2020 / Revised: 4 June 2020 / Accepted: 7 June 2020 / Published: 11 June 2020
(This article belongs to the Special Issue Modern Electrical Drives: Trends, Problems, and Challenges)

Abstract

:
This article presents the effectiveness of bispectrum analysis for the detection of the rotor unbalance of an induction motor supplied by the mains and a frequency converter. Two diagnostic signals were analyzed, as well as the stator current and mechanical vibrations of the tested motors. The experimental tests were realized for two low-power induction motors, with one and two pole pairs, respectively. The unbalance was modeled using a test mass mounted on a specially prepared disc and directly on the rotor and the influence of this unbalance location was tested and discussed. The results of the bispectrum analysis are compared with results of Fourier transform and the effectiveness of unbalance detection are discussed and compared. The influence of the registration time of the analyzed signal on the quality of fault symptom analyses using both transforms was also tested. It is shown that the bispectrum analysis provides an increased number of fault symptoms in comparison with the classical spectral analysis as well as it is not sensitive to a shorter registration time of the diagnostic signals.

1. Introduction

Three-phase induction motors constitute the basis of an electrical drive in industry. According to the data [1], the sales of AC (alternating current) motors in Europe made up 96% of all sold motors, and it should be noted that 87% of the total sales were induction drives. This popularity results from the simple structure of these machines, their low price and the increasingly efficient control methods—frequency converters and softstarts. According to [2], 43–46% of global electricity is consumed by electric motor drives. The necessity to save electrical power is translated into the implementation of the International Standard IEC (International Electrotechnical Commission) 60034-30 which introduces four efficiency classes for selected induction motors: standard efficiency (IE1), high efficiency (IE2), premium efficiency (IE3) and super-premium efficiency (IE4) [3]. This standard made it necessary for electrical machines manufacturers to search for new construction solutions.
The life cycle of electric machines can be divided into four stages: production, distribution, use and end of life. The stage of use has the greatest impact on the environment. Electric motors are designed in such a way that their service life under normal operating conditions, without renovation, is about 15–20 years [2]. In industrial hubs using electrical drives, an essential characteristic of these machines is their reliability as it allows to limit production downtime, repairs and equipment replacement. A long and reliable operation has a positive impact on company economic performance. However, various types of faults may occur in electrical machines due to various reasons and changeable operating conditions or a harsh environment. The basic types of such faults can be divided into [4,5,6]:
  • electrical, e.g., stator winding and rotor faults, insulation faults;
  • mechanical, e.g., bearing faults, eccentricity, non-alignment of shafts, rotor unbalance, transmission faults.
The faults may originate from the machine itself (internal faults), e.g., bearing or stator winding insulation faults, or they may be caused by external factors, e.g., unbalance, non-alignment of shafts, voltage asymmetry, high humidity or too frequent machine overload [5]. The early detection of fault symptoms allows to plan the production downtime necessary for machine overhaul or replacement, often even without bearing extra costs. Monitoring machine technical conditions allows its operator to purchase necessary spare parts even before dismantling the machine, which significantly reduces repair time [4]. However, this is possible only when diagnostic signals, storing as much information about the machine condition as possible, are analyzed. The most frequently used diagnostic signals encompass: phase current [6,7,8,9], mechanical vibration [6,8,9,10,11,12,13,14,15,16], axial stray flux [6], acoustic signal [16,17], and temperature [18]. The applications of high-calculation power systems enables diagnosing processes in real time. The development of microprocessor technology allowed to construct low-budget diagnostic systems, based on measurement cards and various programing environments [13,19,20,21,22,23]. In this type of diagnostic systems, it is possible to develop their functionality by adding new methods of diagnostic signal processing. Another cheap approach used to diagnose electrical machines can be the use of a smartphone [16]. Currently manufactured mobile phones have high-performance processors and a large amount of memory, so they can be successfully used to conduct preliminary diagnostics of electrical machines, for which the installation of professional systems would be economically unjustified.
Since the market is dominated by AC motors, the progress of signal processing was also connected with the development of signal processing and the diagnostics of these machines. The same applies to fault detection. Diagnostic signals can be analyzed in the time [8] and frequency domain. The most frequently used diagnostic method is the spectral analysis of a diagnostic signal using the fast Fourier transform [6,7,8,10,13,14,16,17]. Unfortunately, this method is not sufficient in the case of the simultaneous occurrence of a few faults or a non-stationary signal. The spectrum of such a signal is complex, and it can be only analyzed by qualified personnel. For the purpose of removing the fundamental component from the stator current spectrum, it is possible to use the Park’s vector [7]. Another approach facilitating unbalance symptom identification, is the envelope analysis of the filtered vibration signal [8]. In diagnostics, higher-order transforms are increasingly frequently used [12,24]. To detect unbalance, one can use: bispectrum [11], power spectrum [11], power spectral density (PSD) of synchronously sampled stator current [25], full spectrum [12], discrete wavelet transform [7,8], and the Hilbert transform [8,25]. The automation of the diagnostic process can also be obtained by the application of neural networks [9,16], fuzzy logic [12] or classifiers (e.g., nearest mean and support vector machine classifiers) [17]. In these articles, the authors present diagnostic methods that they used to detect unbalance. The research is usually limited to one object, one power source and the constant parameters of measurement data acquisition. In this article, experimental research was expanded to analyze the impact of: the diagnostic signal measurement time and the motor power supply method on the possibility of detecting a modeled unbalance.
The physical modelling of unbalance can be obtained in a number of ways. Most frequently, unbalance is modeled using an extra disc fixed to the motor shaft (of the drive system) [12,13,14,15]. In [6], the unbalance was modeled by assembling a test mass on the motor fan, in [8], openings were made in the rotor, in [9], the test mass was screwed to the rotor, while in [23], unbalance masses were added to the shaft collar. Publication [17] presents cases when unbalance was obtained by damaging the fan blades of the commutator motor of an electric impact drill and the commutator motor of a blender. In all the discussed articles, only one method of unbalance modeling was analyzed. This article attempts to compare the possibilities of detecting unbalance modeled in two ways. In the first case, the unbalance was outside the tested machine, and in the second case, the rotor of the tested motor was unbalanced.
The unbalance of the rotating elements is the main source of vibration. For the purpose of improving the efficiency and simultaneously limiting the deterioration of the machine’s technical condition, finally leading to its destruction resulting from material fatigue, it is necessary to decrease the level of vibration by balancing the rotating element [24]. From the economic perspective, it seems justified to detect unbalance at the initial stage of its occurrence, to prevent the further damage of the drive system. In this research, the effectiveness of two known methods of unbalance symptoms analysis were compared, namely the bispectrum analysis and fast Fourier transform. These transforms were applied to stator phase current and mechanical vibration signals measured in the experimental set-up. According to the representative data in [1], 79.1% of used AC motors are small power motors (0.75–7.5 kW). Among three phase low-voltage AC motors, in terms of the number of pole pairs, the dominant type are motors with two pole pairs (50–70%), whereas 10–35% are motors with one pair of poles. The motors for the experimental research were selected on the basis of the presented statistical data. The tests were conducted using two small power motors, the first with one pole pair and the other one with two pairs of poles. Both tested motors were supplied by the mains and a frequency converter. The unbalance was modeled using a specially prepared disc fixed on the motors shaft and by installing a test mass directly on a rotor.
The article is composed of six sections. Section 2 presents the unbalance phenomenon and the symptoms observable in a stator current and mechanical vibration. Section 3 discusses the bispectrum analysis used in the diagnostics, how it was determined and its basic properties. The experimental research methodology, experimental set-up and the analyzed cases are presented in Section 4, while Section 5 is devoted to an in-depth discussion of the obtained results. The final part of the article is a short summary.

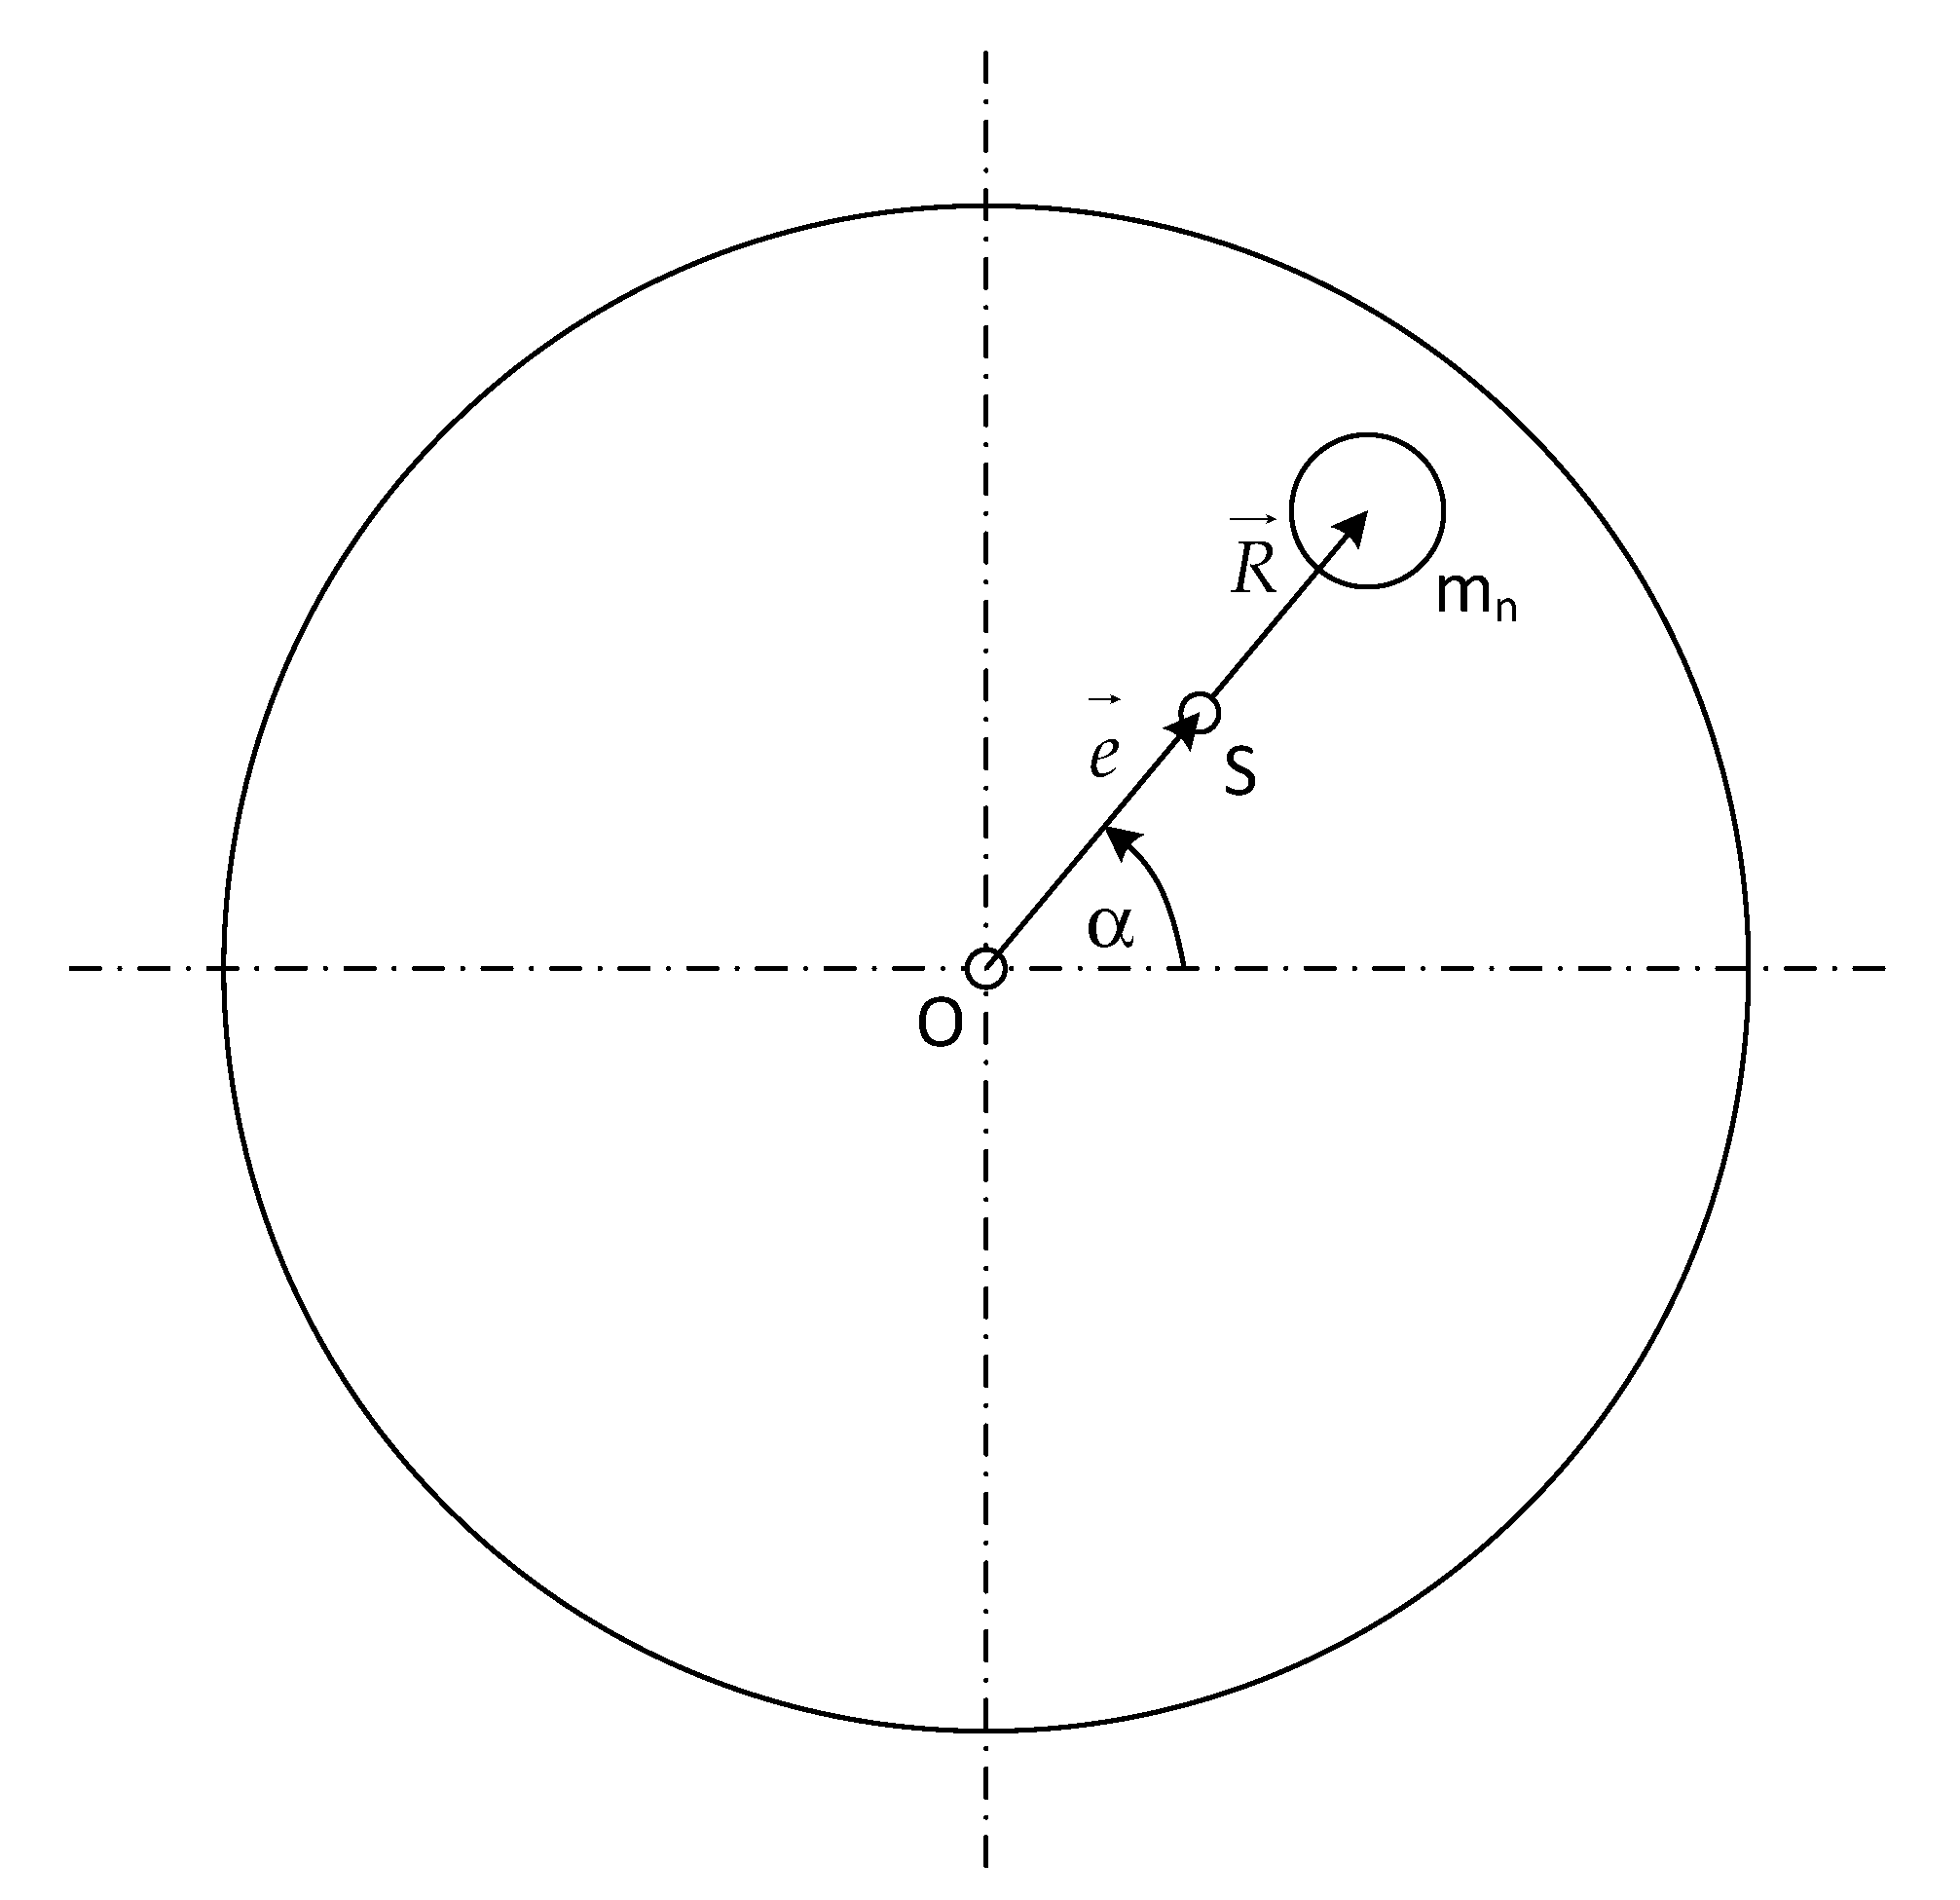
2. Rotor Unbalance and Its Symptoms

Unbalance occurs when a rotating element is characterized by uneven mass distribution with regards to the axis of rotation, which results in creating unbalanced forces and moments of inertia. Exceeding the acceptable unbalance levels results in the faster wear of the exploited machine, which especially and significantly contributes to bearing wear. Moreover, unbalanced equipment generates a higher vibration level and an increased noise level [24]. The unbalanced rotating elements can be electrical machine rotors, clutches, dusty fans, vehicle wheels, unequally distributed wash load in a washing machine drum, etc. From the economic perspective, it seems essential to monitor the unbalance level in very expensive machines and those operating in strategic industry sectors. Energy from renewable sources is not only free from pollutants, but it is also a cost-effective resource. Mechanical faults influence the wind turbine operation and may generate mechanical vibration and possible problems with energy quality. Due to the fact that about 20% of wind energy conversion systems operate with rotor unbalance, the early detection of this problem is extremely important [26]. Marine Current Turbines can generate 800–900 times more power than a comparable wind turbine, owing to the higher density of seawater. Unfortunately, turbines installed in this difficult marine environment may become an ‘artificial reef’, which leads to their unbalance [25].
Unbalance is presented in the form of unbalance mass mn installed at distance R from the point of rotation (point 0) at angle α called the unbalance angle. The so located unbalance mass results in shifting the gravity center of a rotating element from point 0 to point S by vector e , it is called the gravity center eccentricity [14]. Figure 1 presents the rotor unbalance in a graphic form.
Unbalance is defined as the product of unbalance mass mn and vector R [10,14]:
N ¯ = m n R [ g m m ] .
At the moment of setting an unbalanced element into a rotating motion, a centrifugal force is exerted on unbalanced mass mn [10,14,26]:
F = m n R ω 2 .
It follows from the above dependencies that unbalance depends on an unbalanced mass and its location with respect to the point of rotation and squared angular speed (ω).
There are four types of unbalance [8,10]:
  • static—the rotor axis and its main inertia axis undergo a parallel shift with regards to each other;
  • quasi-static—rotor axis and its central inertia axis do not intersect at the point of the center of gravity of the rotor;
  • torque—the rotor axis and its central inertia axis intersect at the point of the center of gravity of the rotor;
  • dynamic—a combination of static and torque unbalance.
Rotor unbalance can be detected during machine operation. Setting an unbalanced mass into motion results in the creation of unbalanced forces which are shifted directly to bearings and each point of the bearing experiences a centrifugal force once during a rotation [8,10]. These forces lead to machine frame vibration. Because unbalance depends on rotational speed n, in the vibration acceleration spectrum, an increase in rotational frequency is observed [13]:
f u n v = f r = n 60 [ Hz ] ,
where funv—fault frequency of the unbalance occurring in the mechanical vibration signal, fr—rotational frequency of the rotor.
Rotor vibration is caused by a rotating unbalanced mass leading to asymmetry in an air gap, followed by stator area interference. In the stator current vector, an increase in frequency amplitude is observed [7,8]:
f u n c = f s ± f r [ Hz ] ,
where: func—unbalance fault frequency occurring in stator current signal, fs—supply voltage frequency.

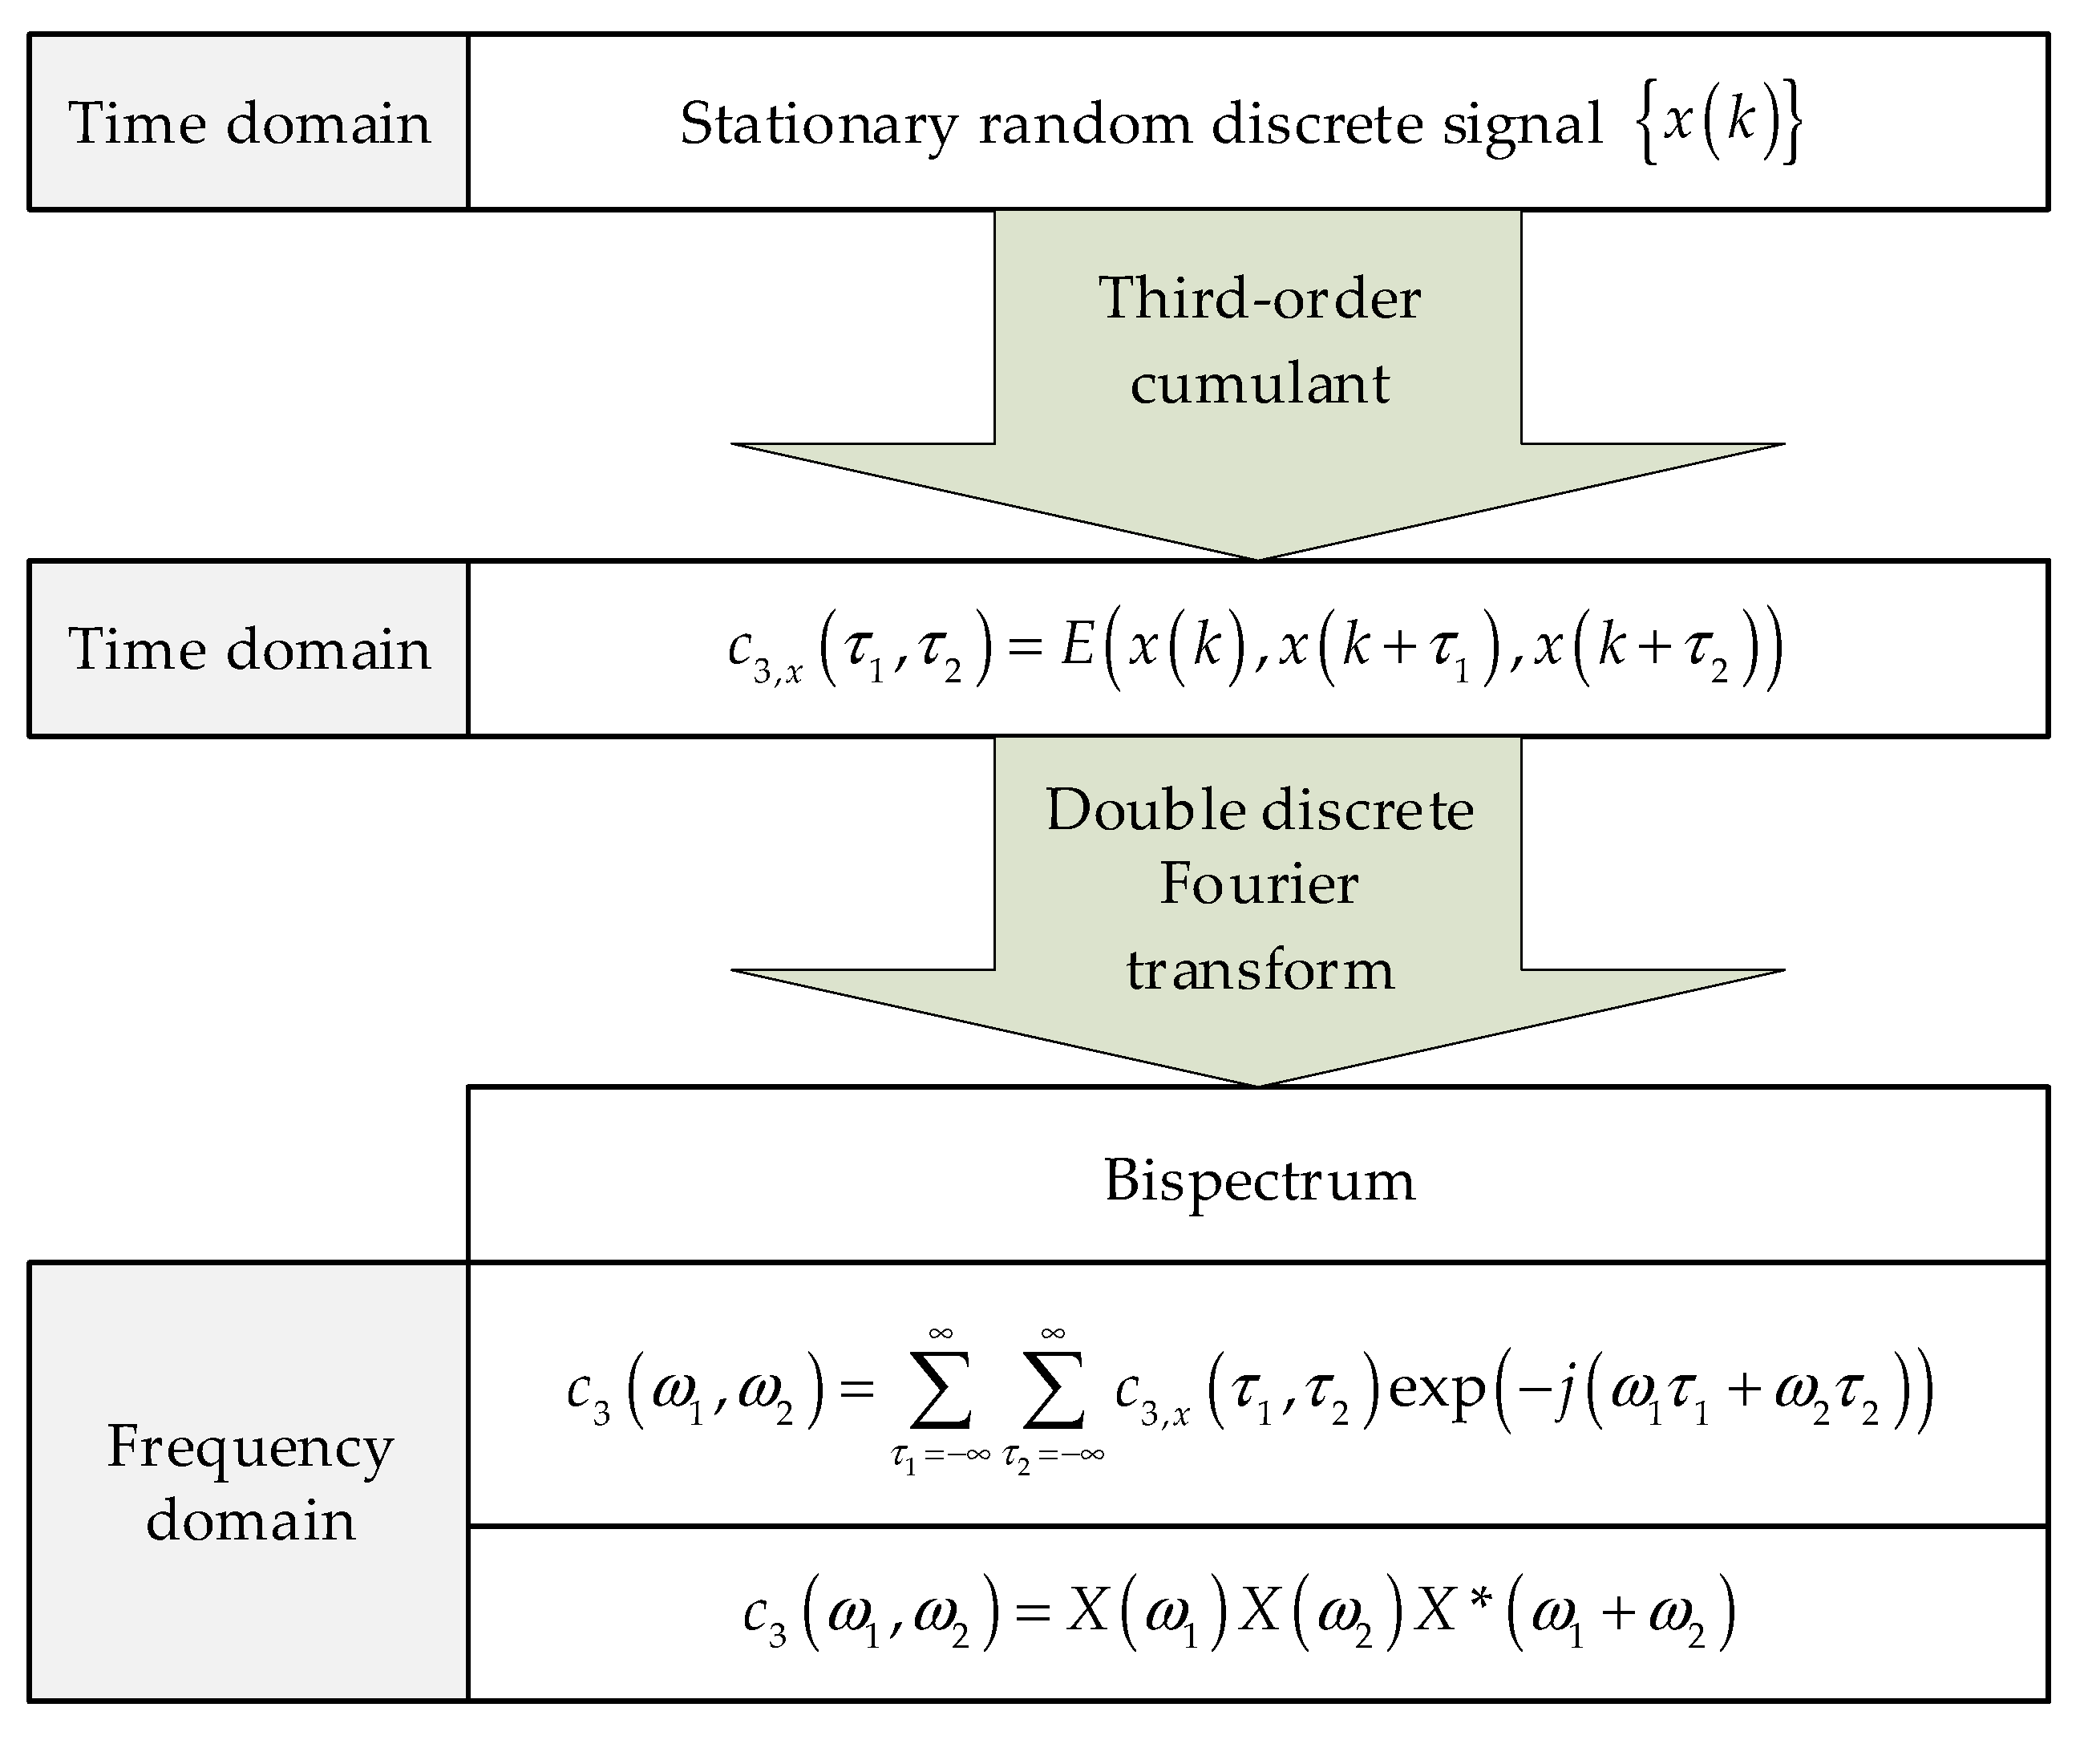
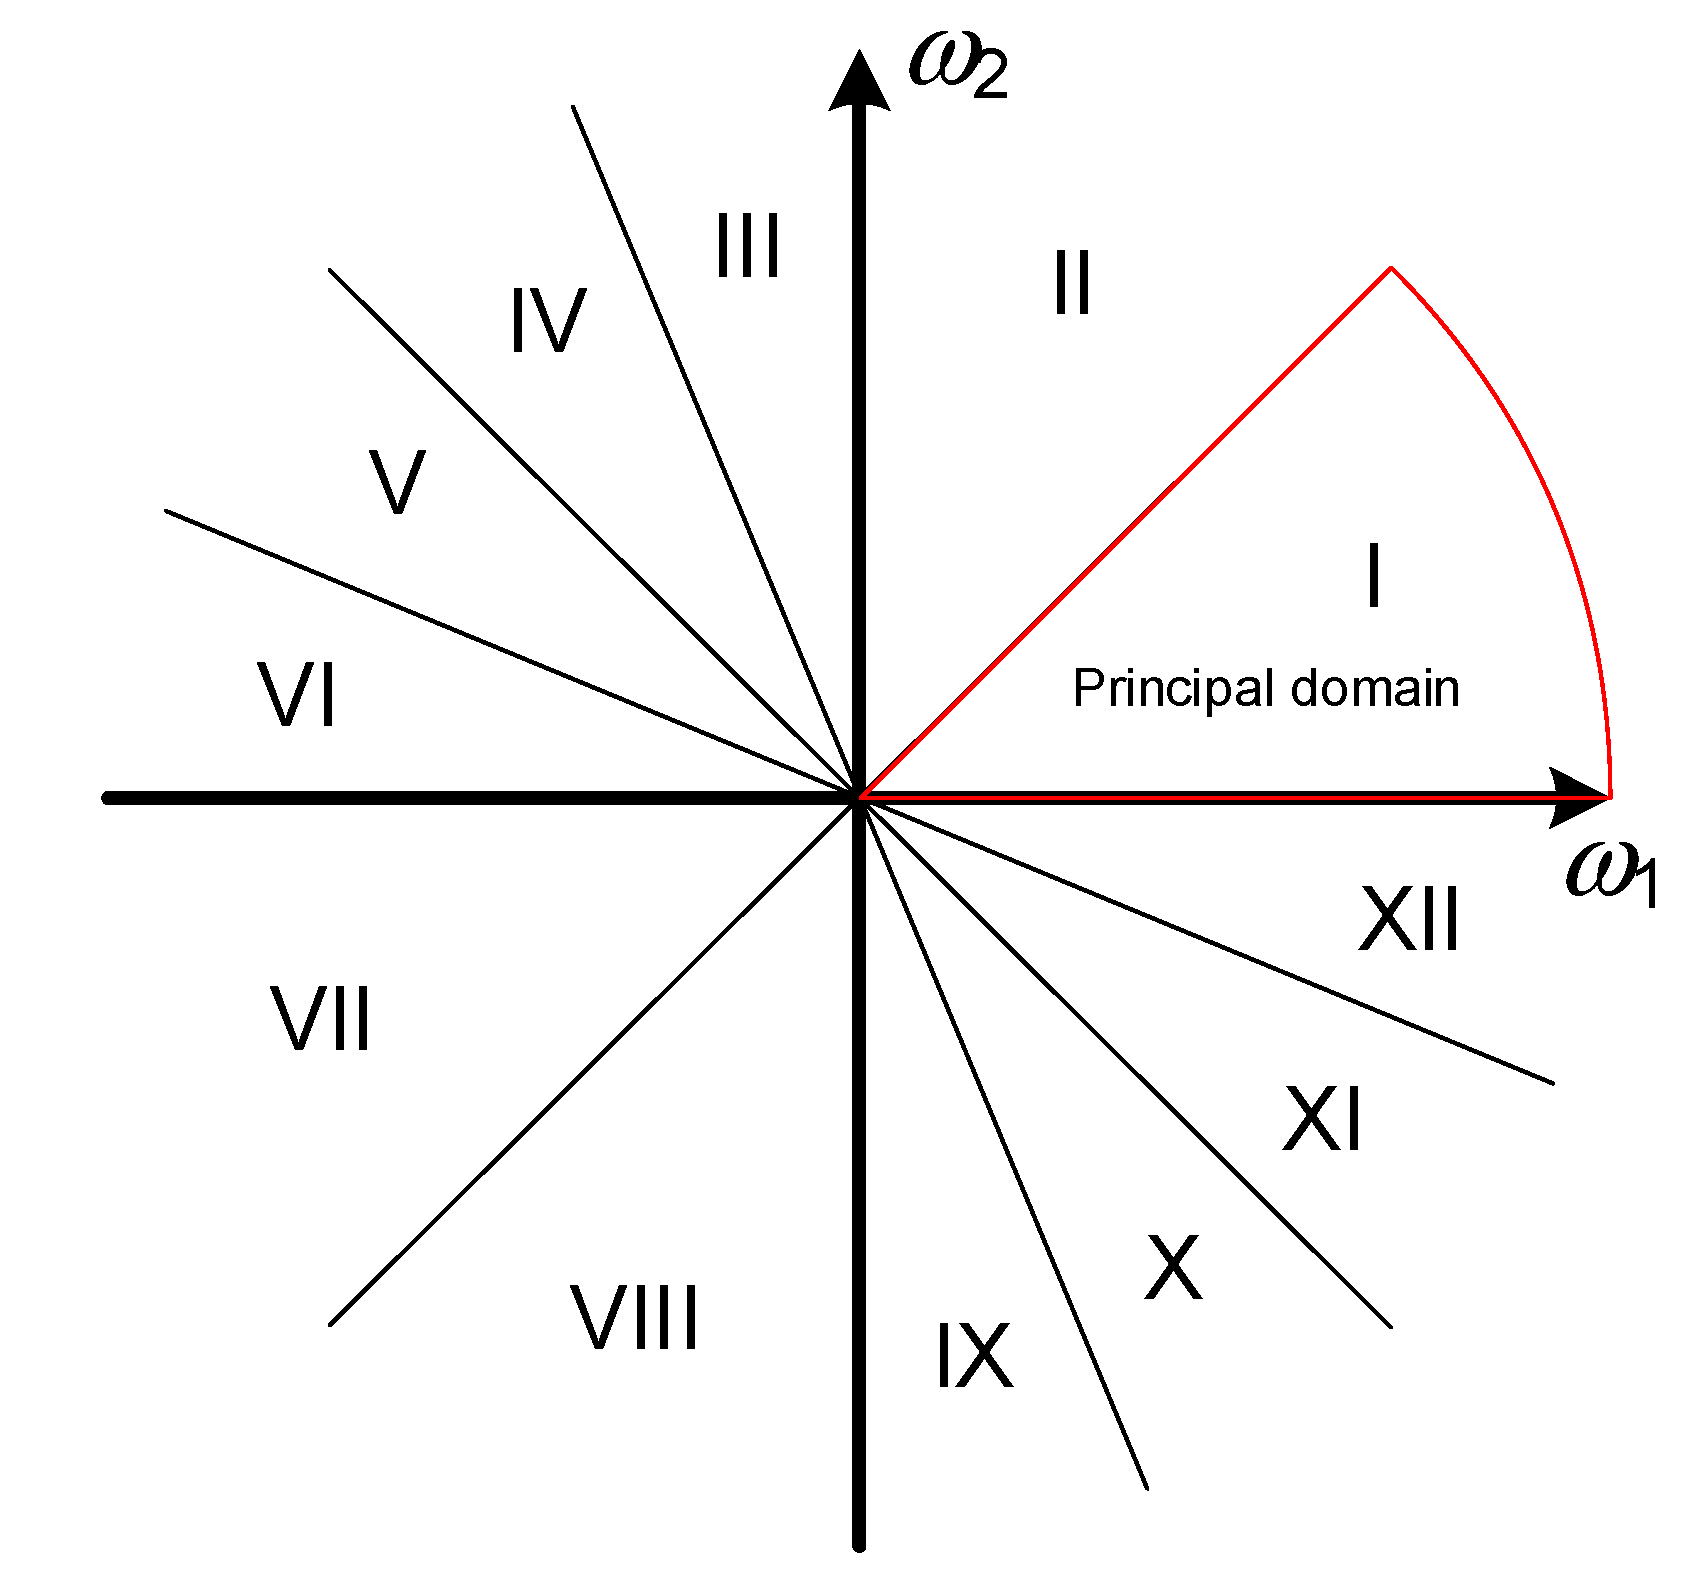
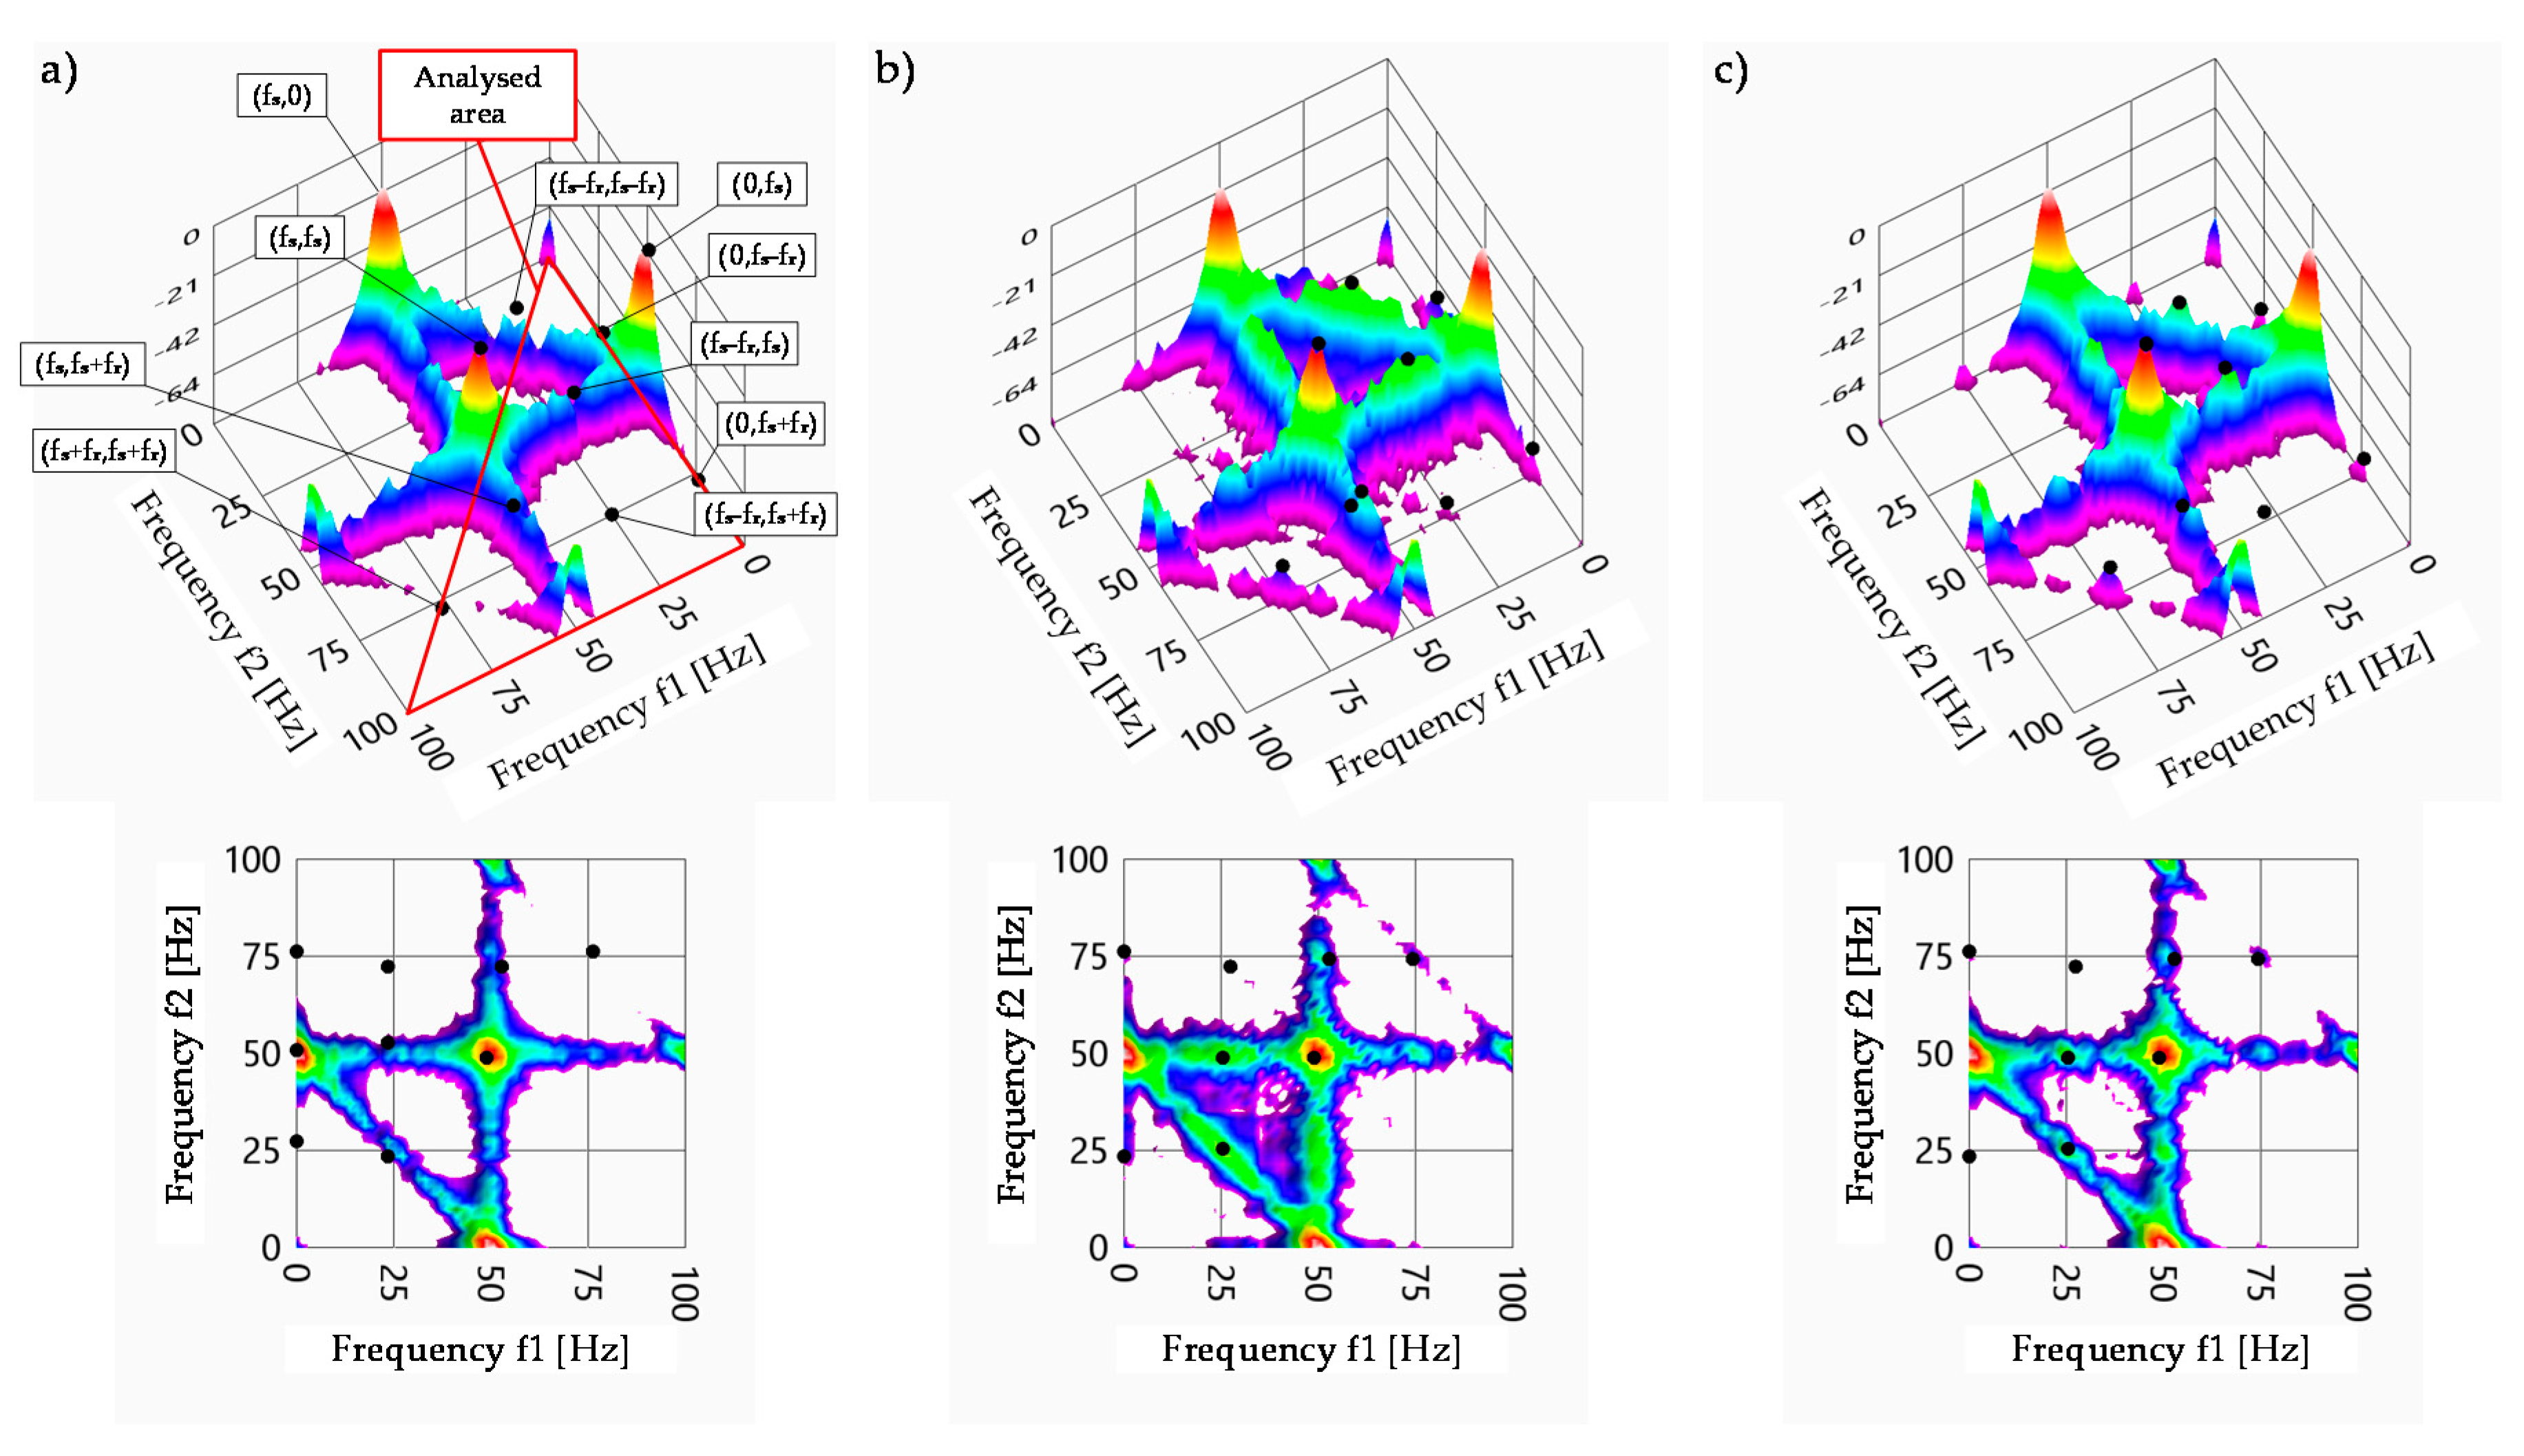
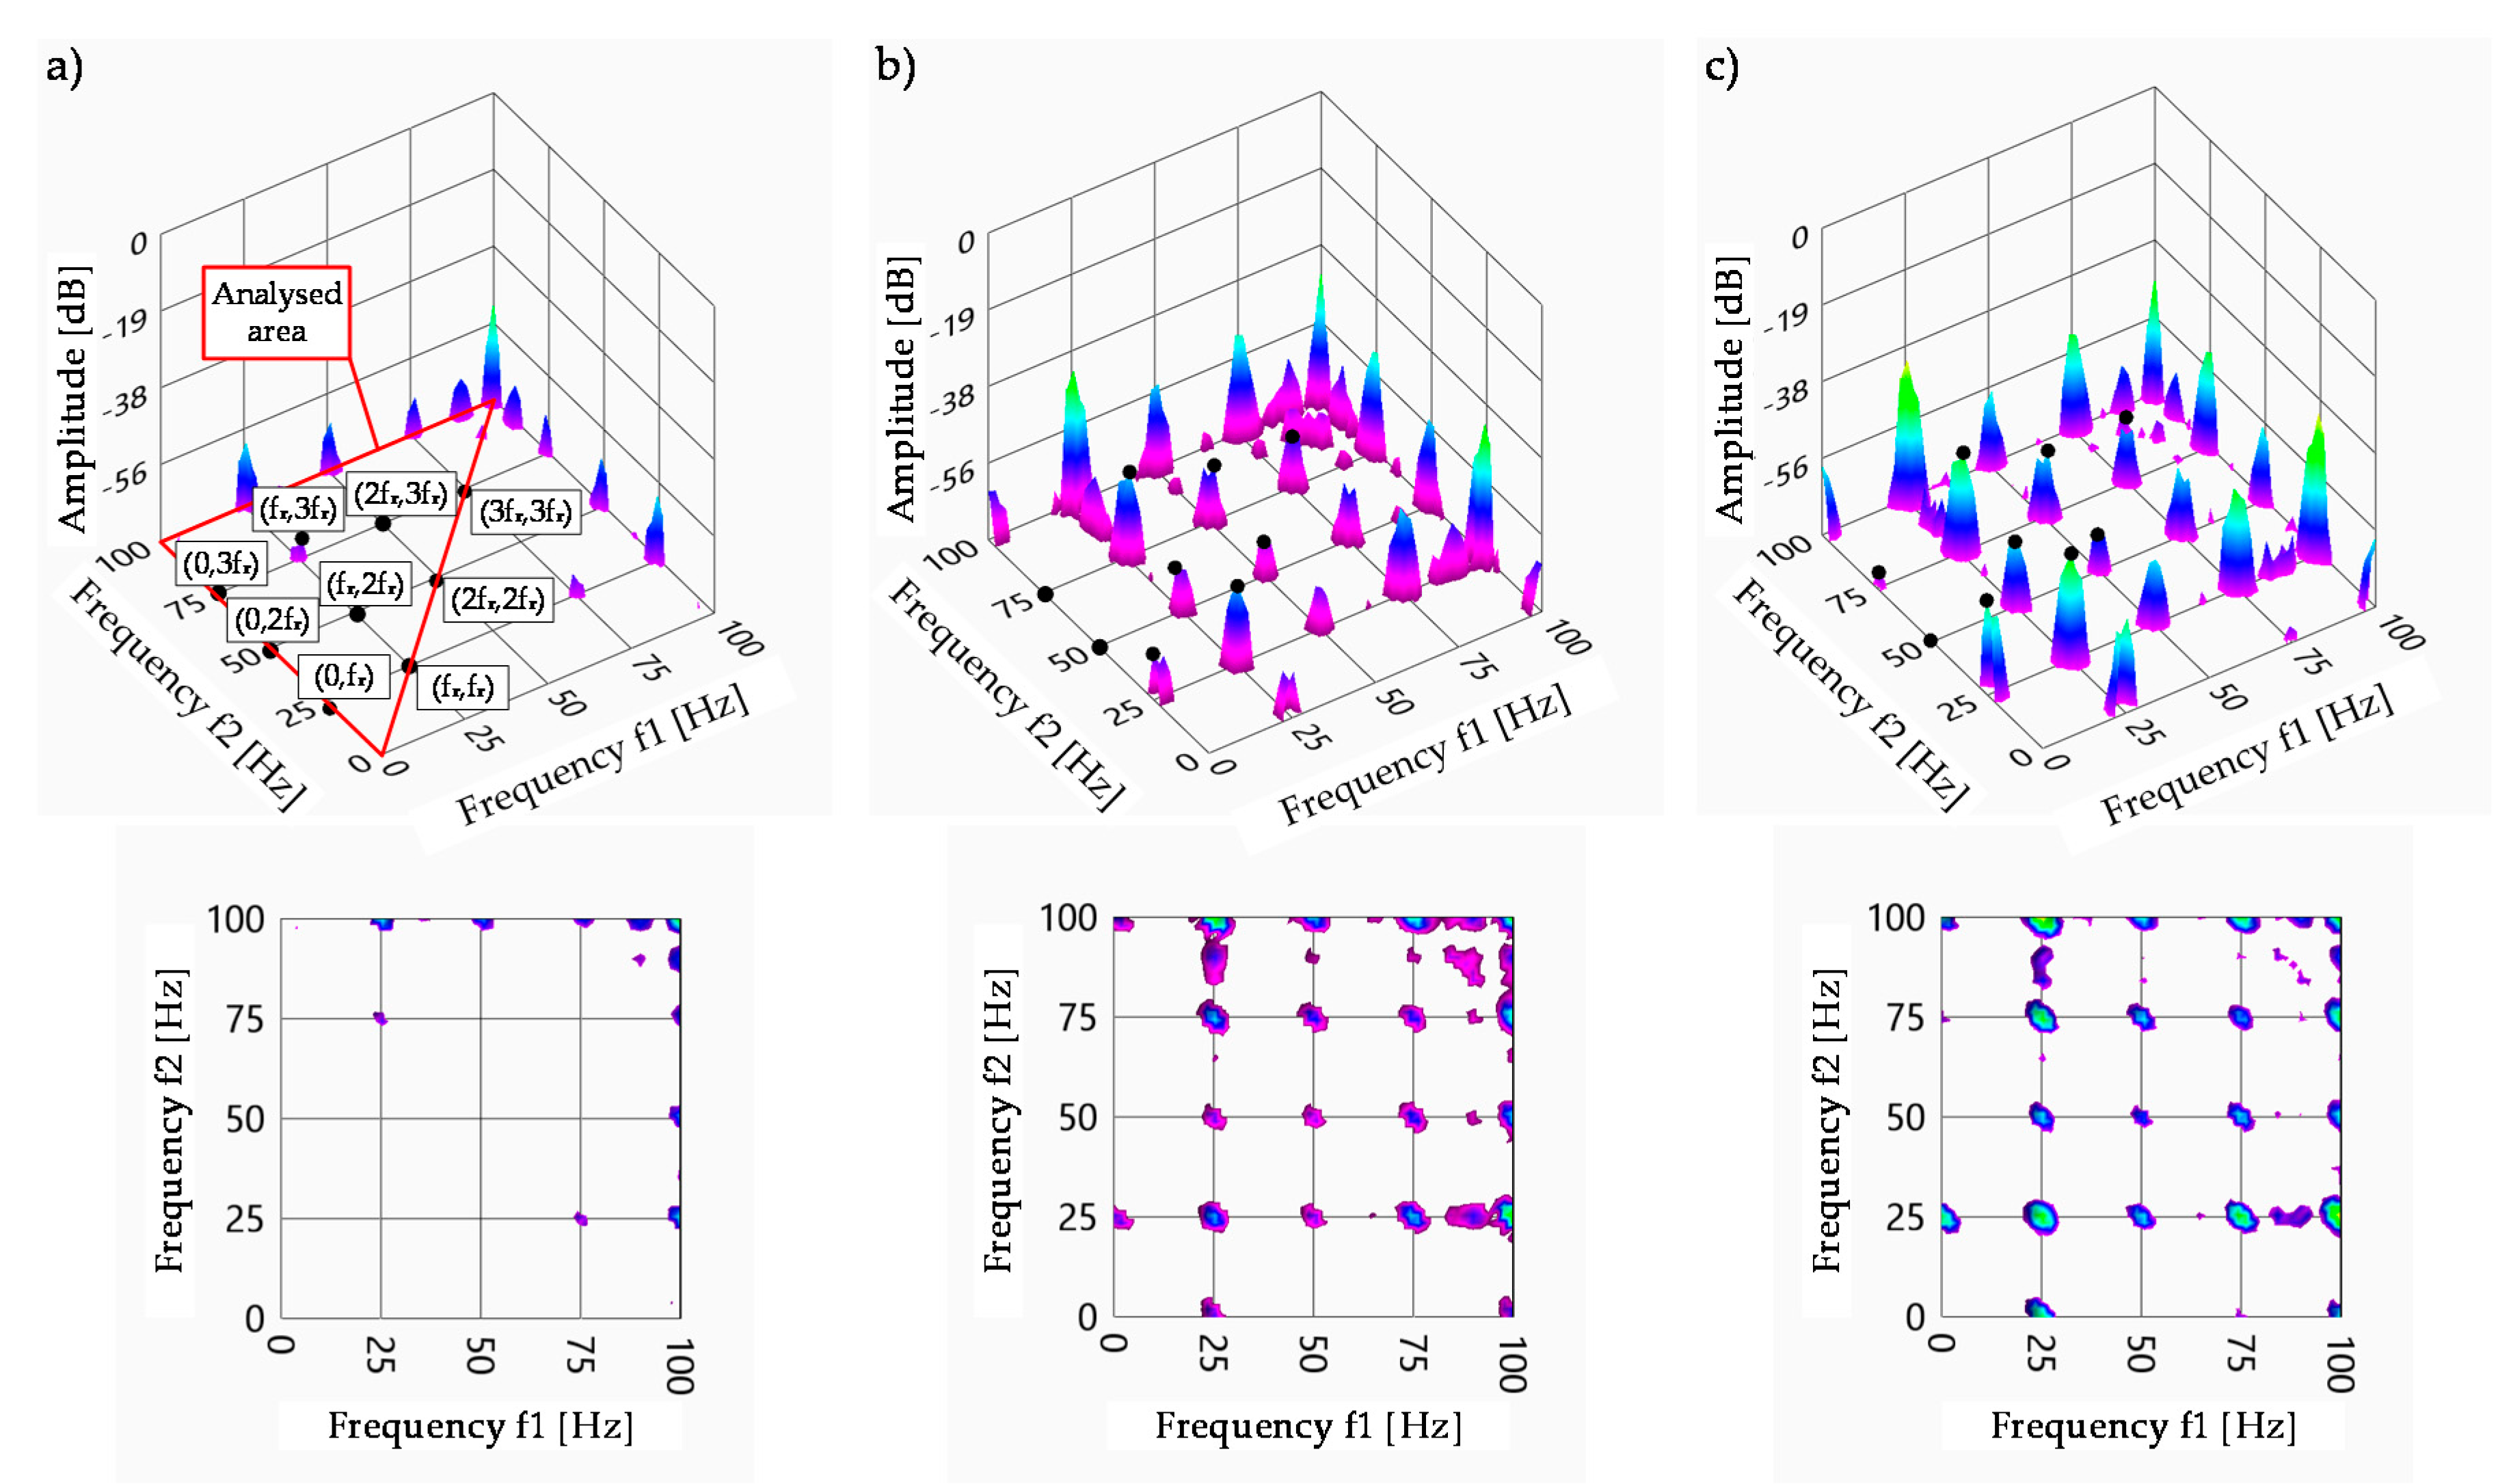
3. Bispectrum Analysis

Higher-order transforms came into practical use in the 1970s of the last century, in such disciplines including plasma physics, biomedicine, optics and economics, however, they are also used in devices such as radars and sonars. They are efficient tools in image and sound processing, signal estimation and denoising [27].
Such transforms, also called polyspectra, are obtained using the fast Fourier transform. Higher order statistics are described by cumulants and torque of order n > 2. An important characteristic of higher-order transforms and also their advantage over the power spectrum (polyspectrum of order n = 2 cumulant) is the fact that, apart from the information about the amplitude, they also contain information about the phase shift of the analyzed signal [28,29]. They are also ‘blind’ to signals with normal distribution. Most often noises are such signals and the signals useful in this respect have a distribution which deviates from the normal distribution. This is the reason why higher-order transforms are capable of strengthening the useful signal to noise ratio [30]. Among higher-order transforms, the bispectrum characterized by relatively simple calculations in comparison with other transforms has gained the greatest popularity.
For a stationary random discrete signal {x(k)}, where k = 0, ±1, ±2, …, is the sample number, the third-order cumulant is a two-variable function τ1, τ2. The relation between the cumulant and the random signal is as follows [31,32]:
c 3 , x ( τ 1 , τ 2 ) = E ( x ( k ) , x ( k + τ 1 ) , x ( k + τ 2 ) ) .
By calculating the double discrete Fourier transform from the third-order cumulant {x(k)}, one obtains the bispectrum of the two-variable function ω1 and ω2 [30,32]:
c 3 ( ω 1 , ω 2 ) = τ 1 = τ 2 = c 3 , x ( τ 1 , τ 2 ) exp ( j ( ω 1 τ 1 + ω 2 τ 2 ) ) ,
assuming that |ω1| ≤ π, |ω2| ≤ π, |ω1 + ω2| ≤ π.
It follows from the above that the bispectrum preserves the information about the amplitude and signal phase.
Bispectrum can be expressed in another way as the products of Fourier transforms X() of one variable (X*() denotes coupling) [9,11,29,30,33]:
c 3 ( ω 1 , ω 2 ) = X ( ω 1 ) X ( ω 2 ) X * ( ω 1 + ω 2 ) .
In the literature, a bispectrum is also notated by B(ω1, ω2).
The process of calculating a bispectrum is schematically presented in Figure 2.
Higher-order transforms are characterized by the same properties as the cumulants calculated on their basis. The most important property from the perspective of the calculation and determination of bispectrum is argument symmetry (τ, ω), which means that a change in the order of arguments does not change their values. Hence, calculations can be limited to one area, called the principal domain (Figure 3) [27,31].
The most important cumulant symmetries are [32]:
c 3 ( τ 1 , τ 2 ) = c 3 ( τ 2 , τ 1 ) = c 3 ( τ 2 , τ 1 τ 2 ) = c 3 ( τ 2 τ 1 , τ 1 ) = c 3 ( τ 1 τ 2 , τ 2 ) = c 3 ( τ 1 , τ 2 τ 1 ) .
The most important bispectrum symmetries are [9,30,32]:
c 3 ( ω 1 , ω 2 ) = c 3 ( ω 2 , ω 1 ) = c 3 ( ω 2 , ω 1 ) = c 3 ( ω 1 , ω 1 ω 2 ) = c 3 ( ω 1 ω 2 , ω 2 ) = = c 3 ( ω 1 ω 2 , ω 1 ) = c 3 ( ω 2 , ω 1 ω 2 )
It results from the above that the bispectrum has 12 symmetry areas (Figure 3). From the calculation of the value of the bispectrum in the principal domain (area ‘I’), it is possible to calculate bispectra for the remaining areas on this basis [32].
In section five, the analysis of the research results was limited to one triangular area and the bispectrum was defined as follows [29]:
B ( f 1 , f 2 ) = X ( f 1 ) X ( f 2 ) X * ( f 1 + f 2 ) ,
where 0 f 1 f 2 f i 2 , f 1 + f 2 f i 2 , fi—sampling frequency.

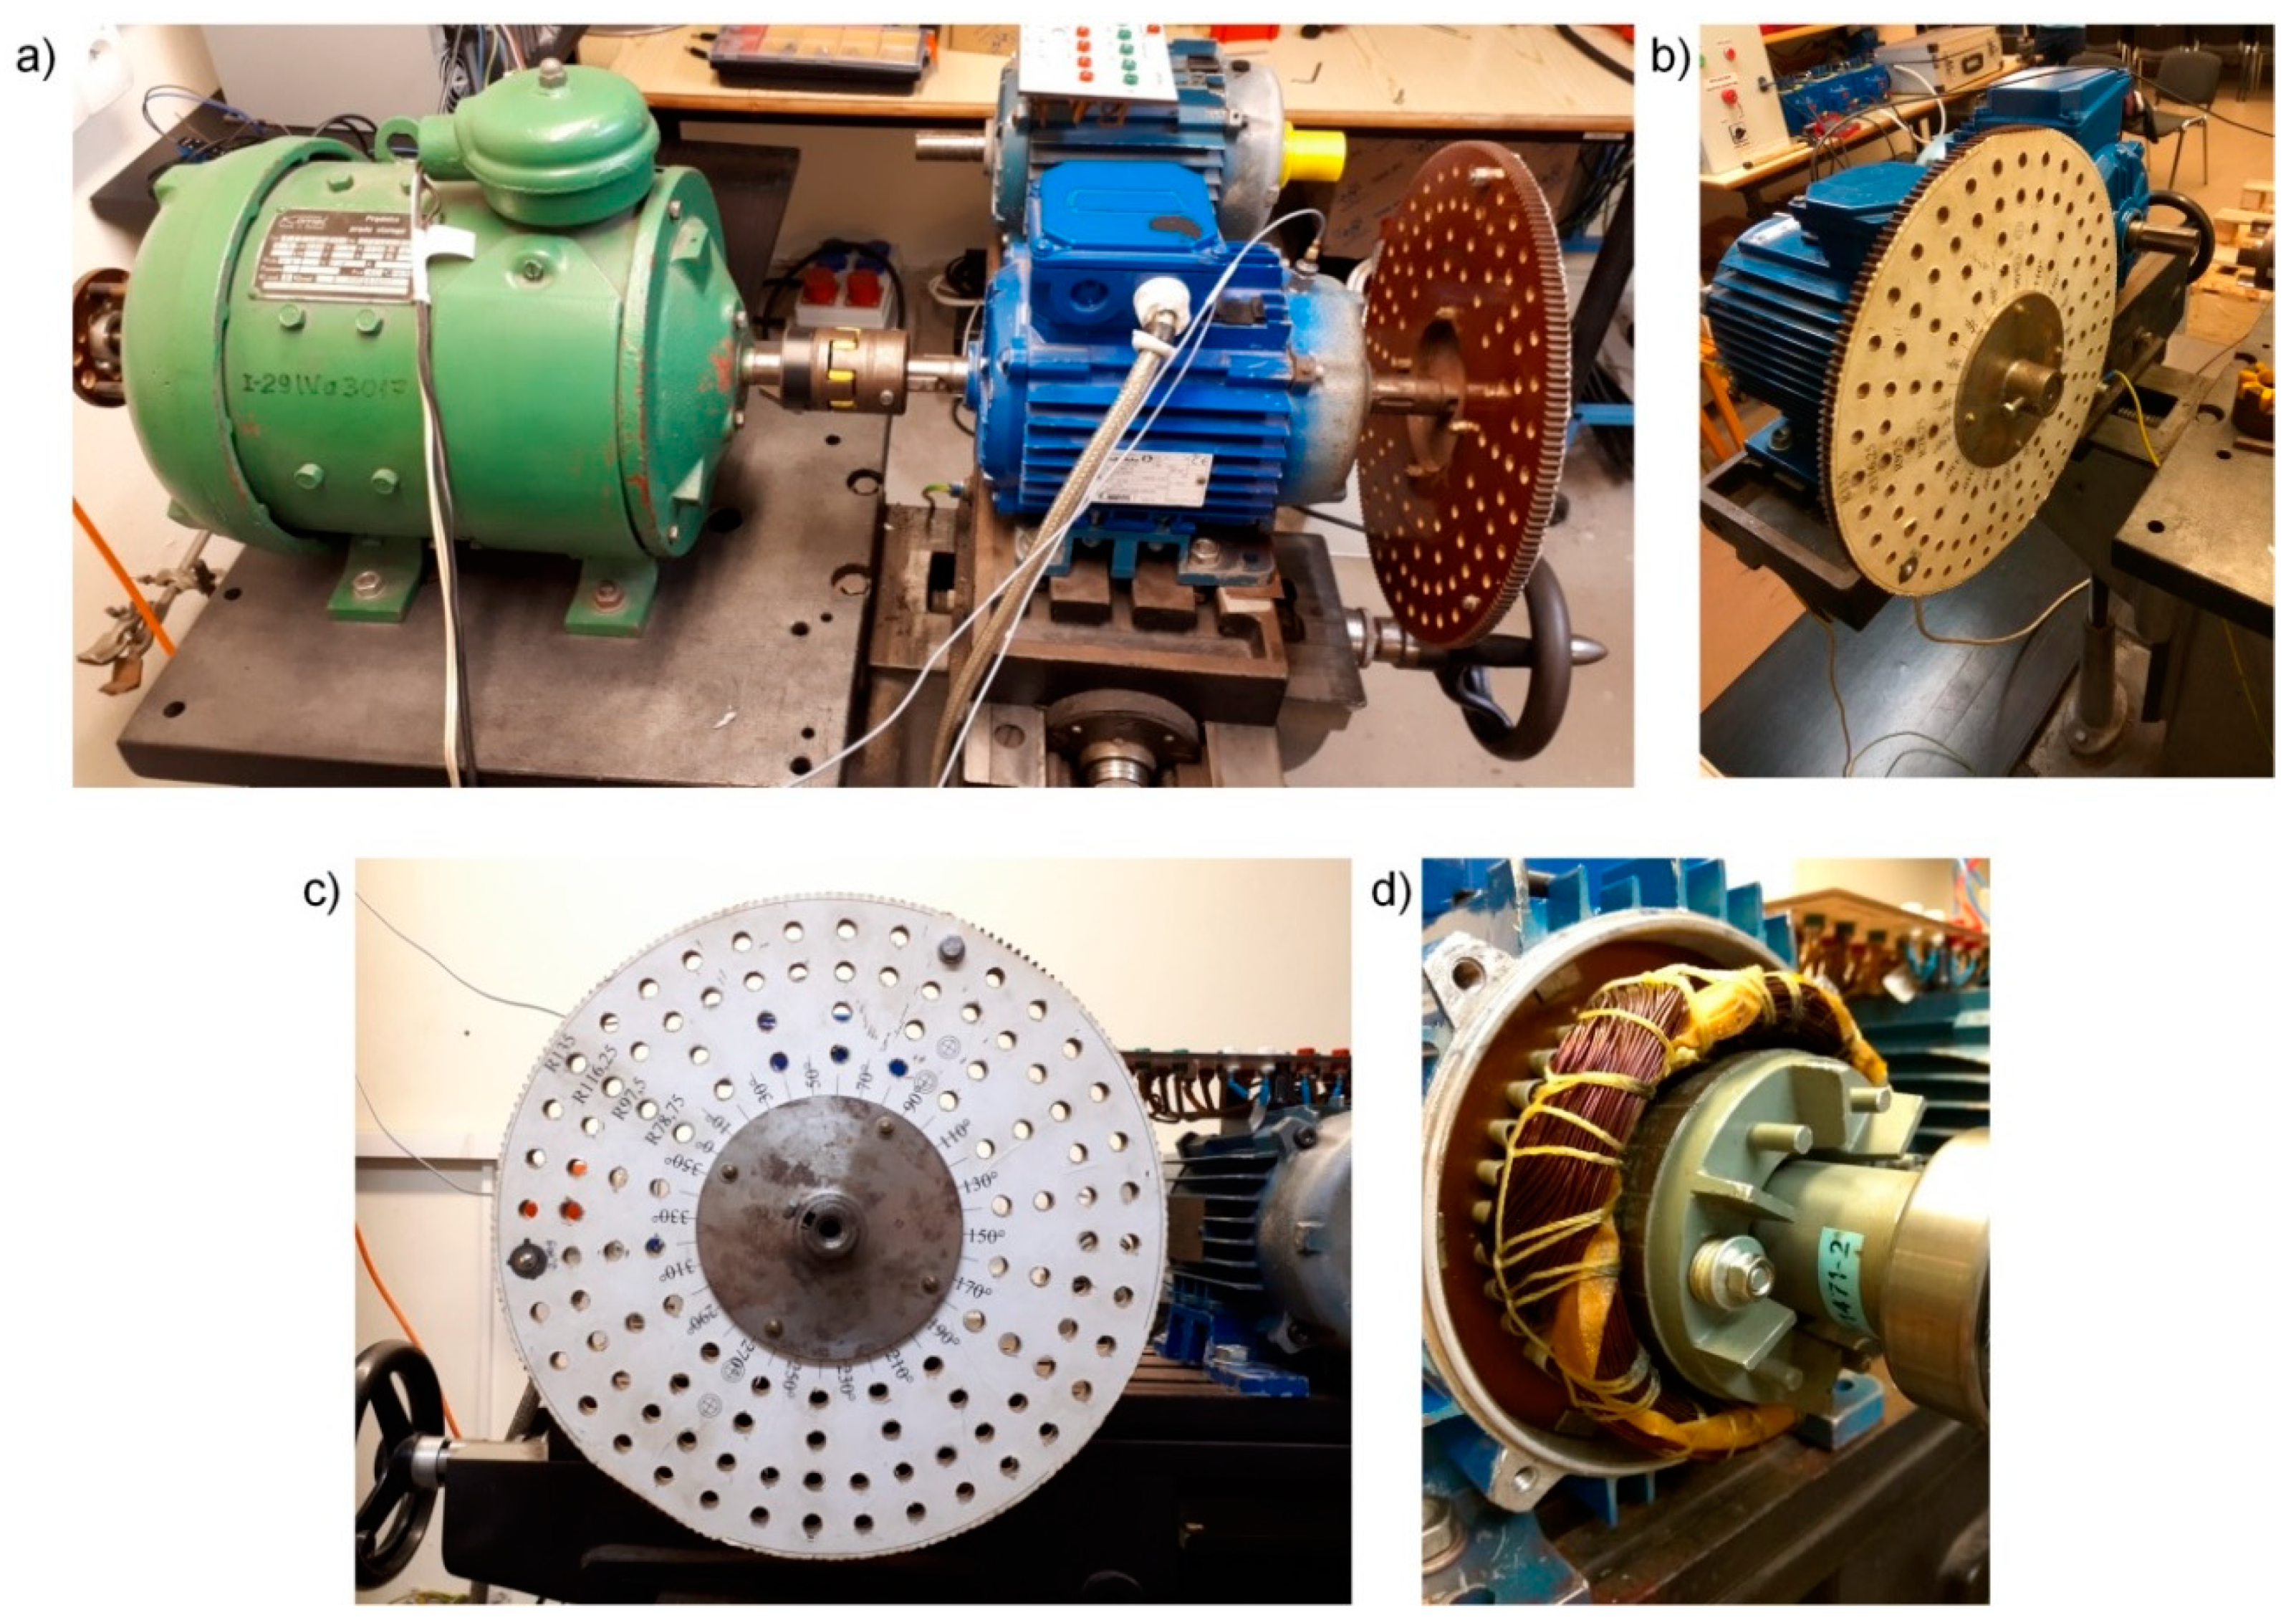
4. Research Methodology

The laboratory research was conducted for three different cases. The nominal parameters of the used induction motors are shown in Appendix A, Table A1.

4.1. Case No. 1:

The examined object was an induction motor, 1.5 kW, Sh90L-4 type, CELMA indukta, (Cantoni Motor S.A., Cieszyn, Poland), with two pairs of poles and a rated speed of 1410 RPM. The motor was supplied from three-phase mains through an autotransformer necessary for a soft start-up. The load in the investigated machine was a 4.5 kW DC generator PZB6446, KOMEL (Katowice, Poland). The disc allowing to the model rotor unbalance was mounted on the counter drive side of the motor. Figure 4a presents a photo of the experimental set-up for modeling an unbalanced rotor.
The used disc (Figure 4c) allows to model the unbalance every 20° for the radius value R1 = 78.75 mm and R2 = 97.5 mm and every 10° for radius value R3 = 116.25 mm and R4 = 135 mm (excluding the angle of 320° for R4 at which the disc correction mass was fixed). A controlled unbalance change was obtained by fixing a screw with a nut and washers in a selected opening.

4.2. Case No. 2:

The investigated object was an induction motor, 1.5 kW, ShR90-2S type, BESEL–Brzeg (BESEL S.A., Brzeg, Poland), with two pairs of poles and a rated speed of 2820 RPM. The motor was supplied from a frequency converter. The same disc as the one described in Case No. 1 was also used here. The measurements were taken for two supply frequency values: 25 Hz and 10 Hz. Figure 4b presents the tested motor with the fixed unbalance modeling disc.

4.3. Case No. 3:

The tested object was an induction motor, 1.5 kW, SH90L-4 type, INDUKTA, with two pairs of poles and a rated speed of 1410 RPM. The motor was supplied from a frequency converter. In this case, the test mass was fixed directly on the rotor. For this purpose, an aluminum rod used to balance the rotor was tapped and the mass test was fixed on the rod. The measurements were taken for two test masses: m1 = 2.32 g and m2 = 6.45 g, and three supply frequencies: 20 Hz, 25 Hz and 50 Hz. The mass was fixed at the radius of 30 mm. Figure 4d presents a photo of the tested motor with the test mass fixed directly on the rotor.
In each of the described cases, the current measurements were made using LEM measurement transducers, however, the vibration acceleration measurements were made using two piezoelectric accelerometers mounted on the motor casing at an angle of 90° to each other. In the research, an industrial computer, National Instruments (National Instruments Corporation, Austin, Texas, U.S.), with a PXI-4472 measurement card, was used. Due to the analysis of the measurement signals in the low frequency band, the sampling was set at 2 kHz. The signals were recorded every 10 s, and due to this, the analyzed spectra had a resolution of 0.1 Hz.

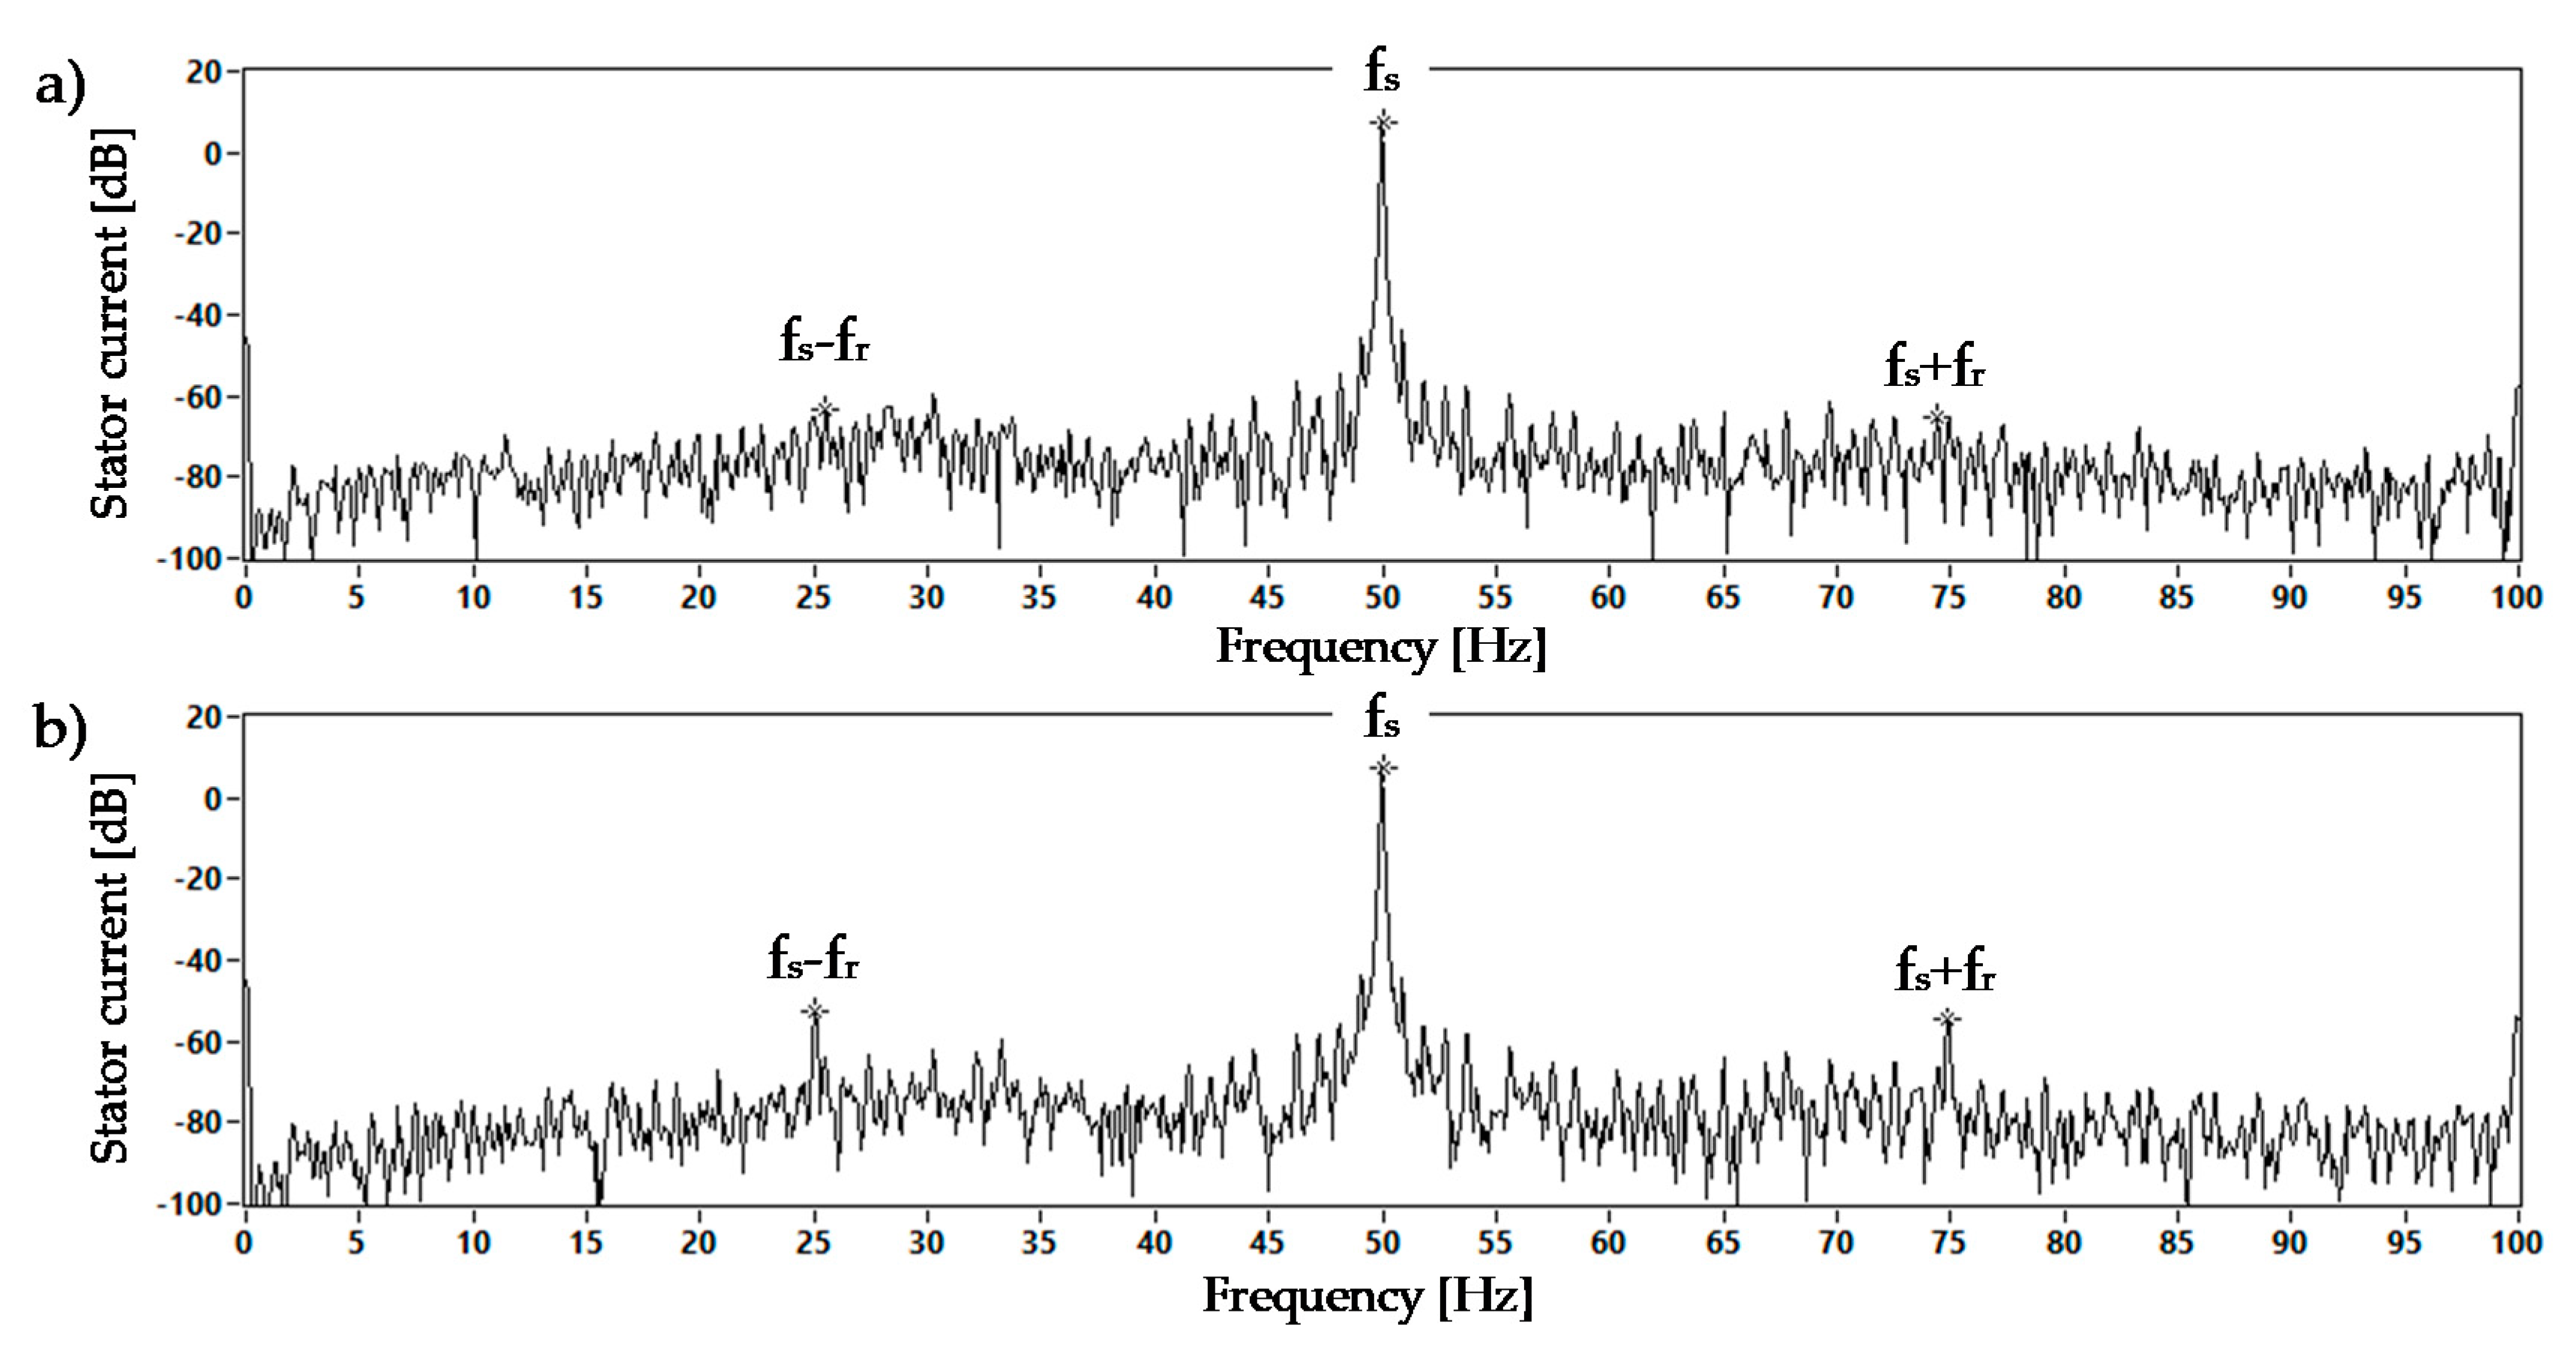
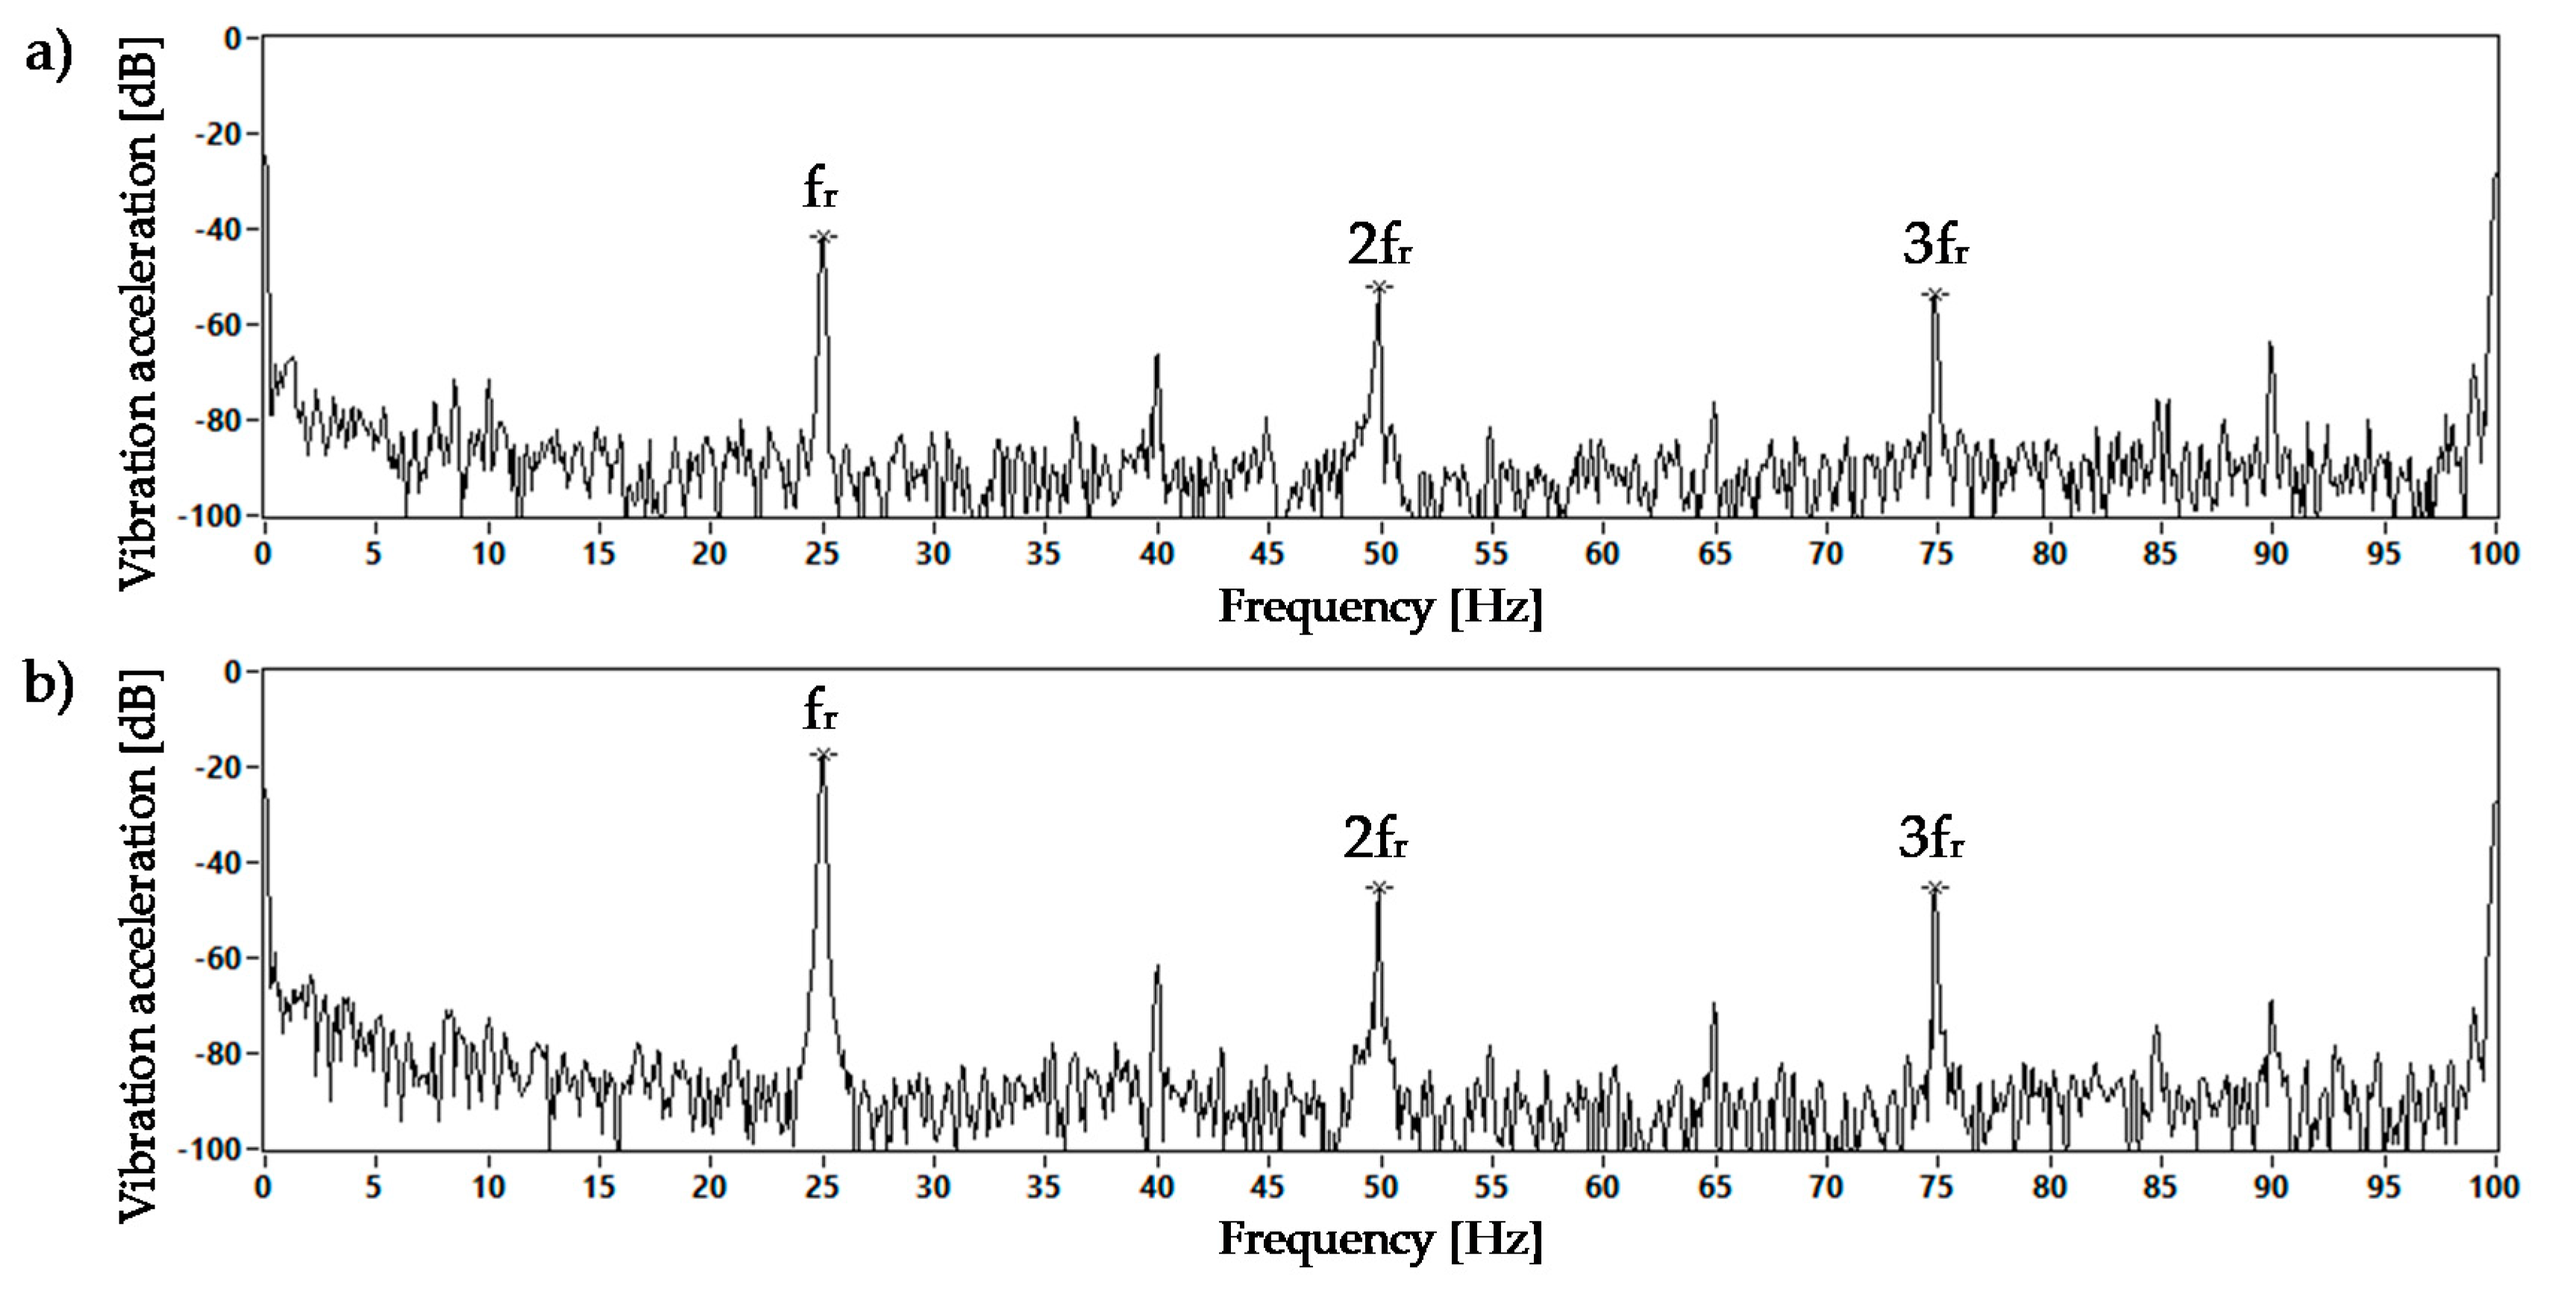
5. Research Results Analysis

The measurement set-up allows to test the unbalance of both the loaded and unloaded motor, for the purpose of eliminating the influence of the generator used as a load. The present article discusses the results for an unloaded motor.

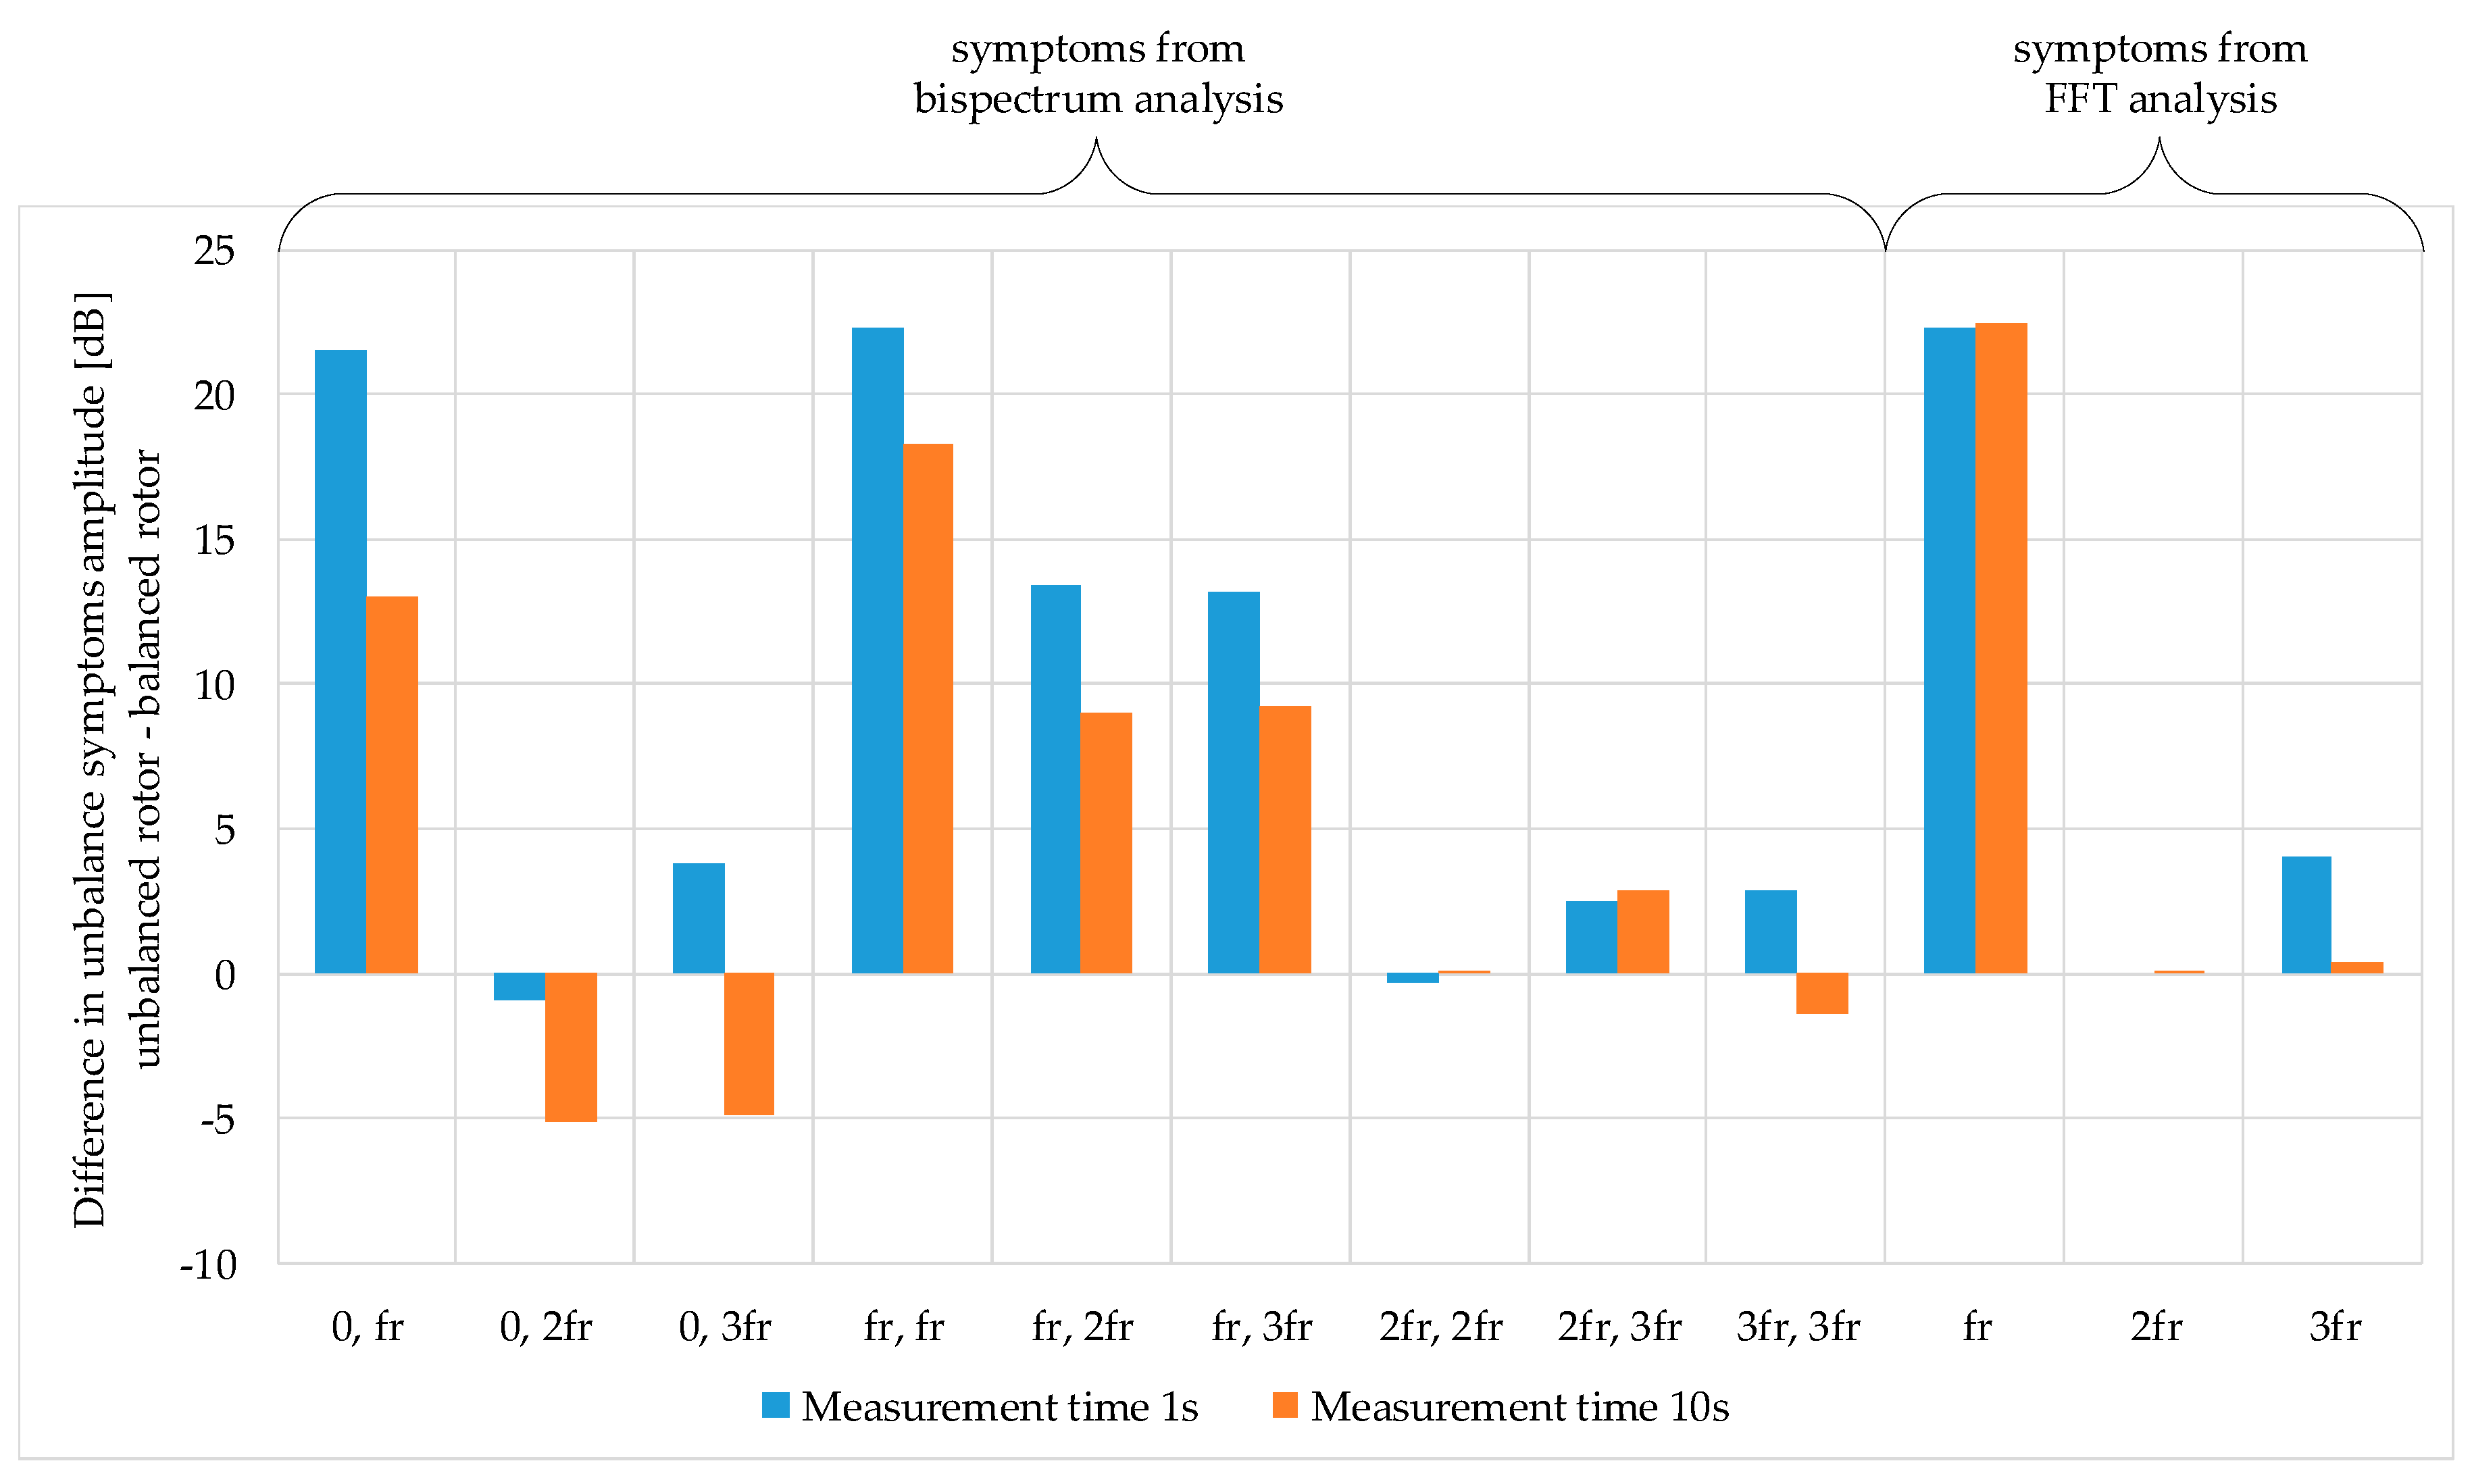
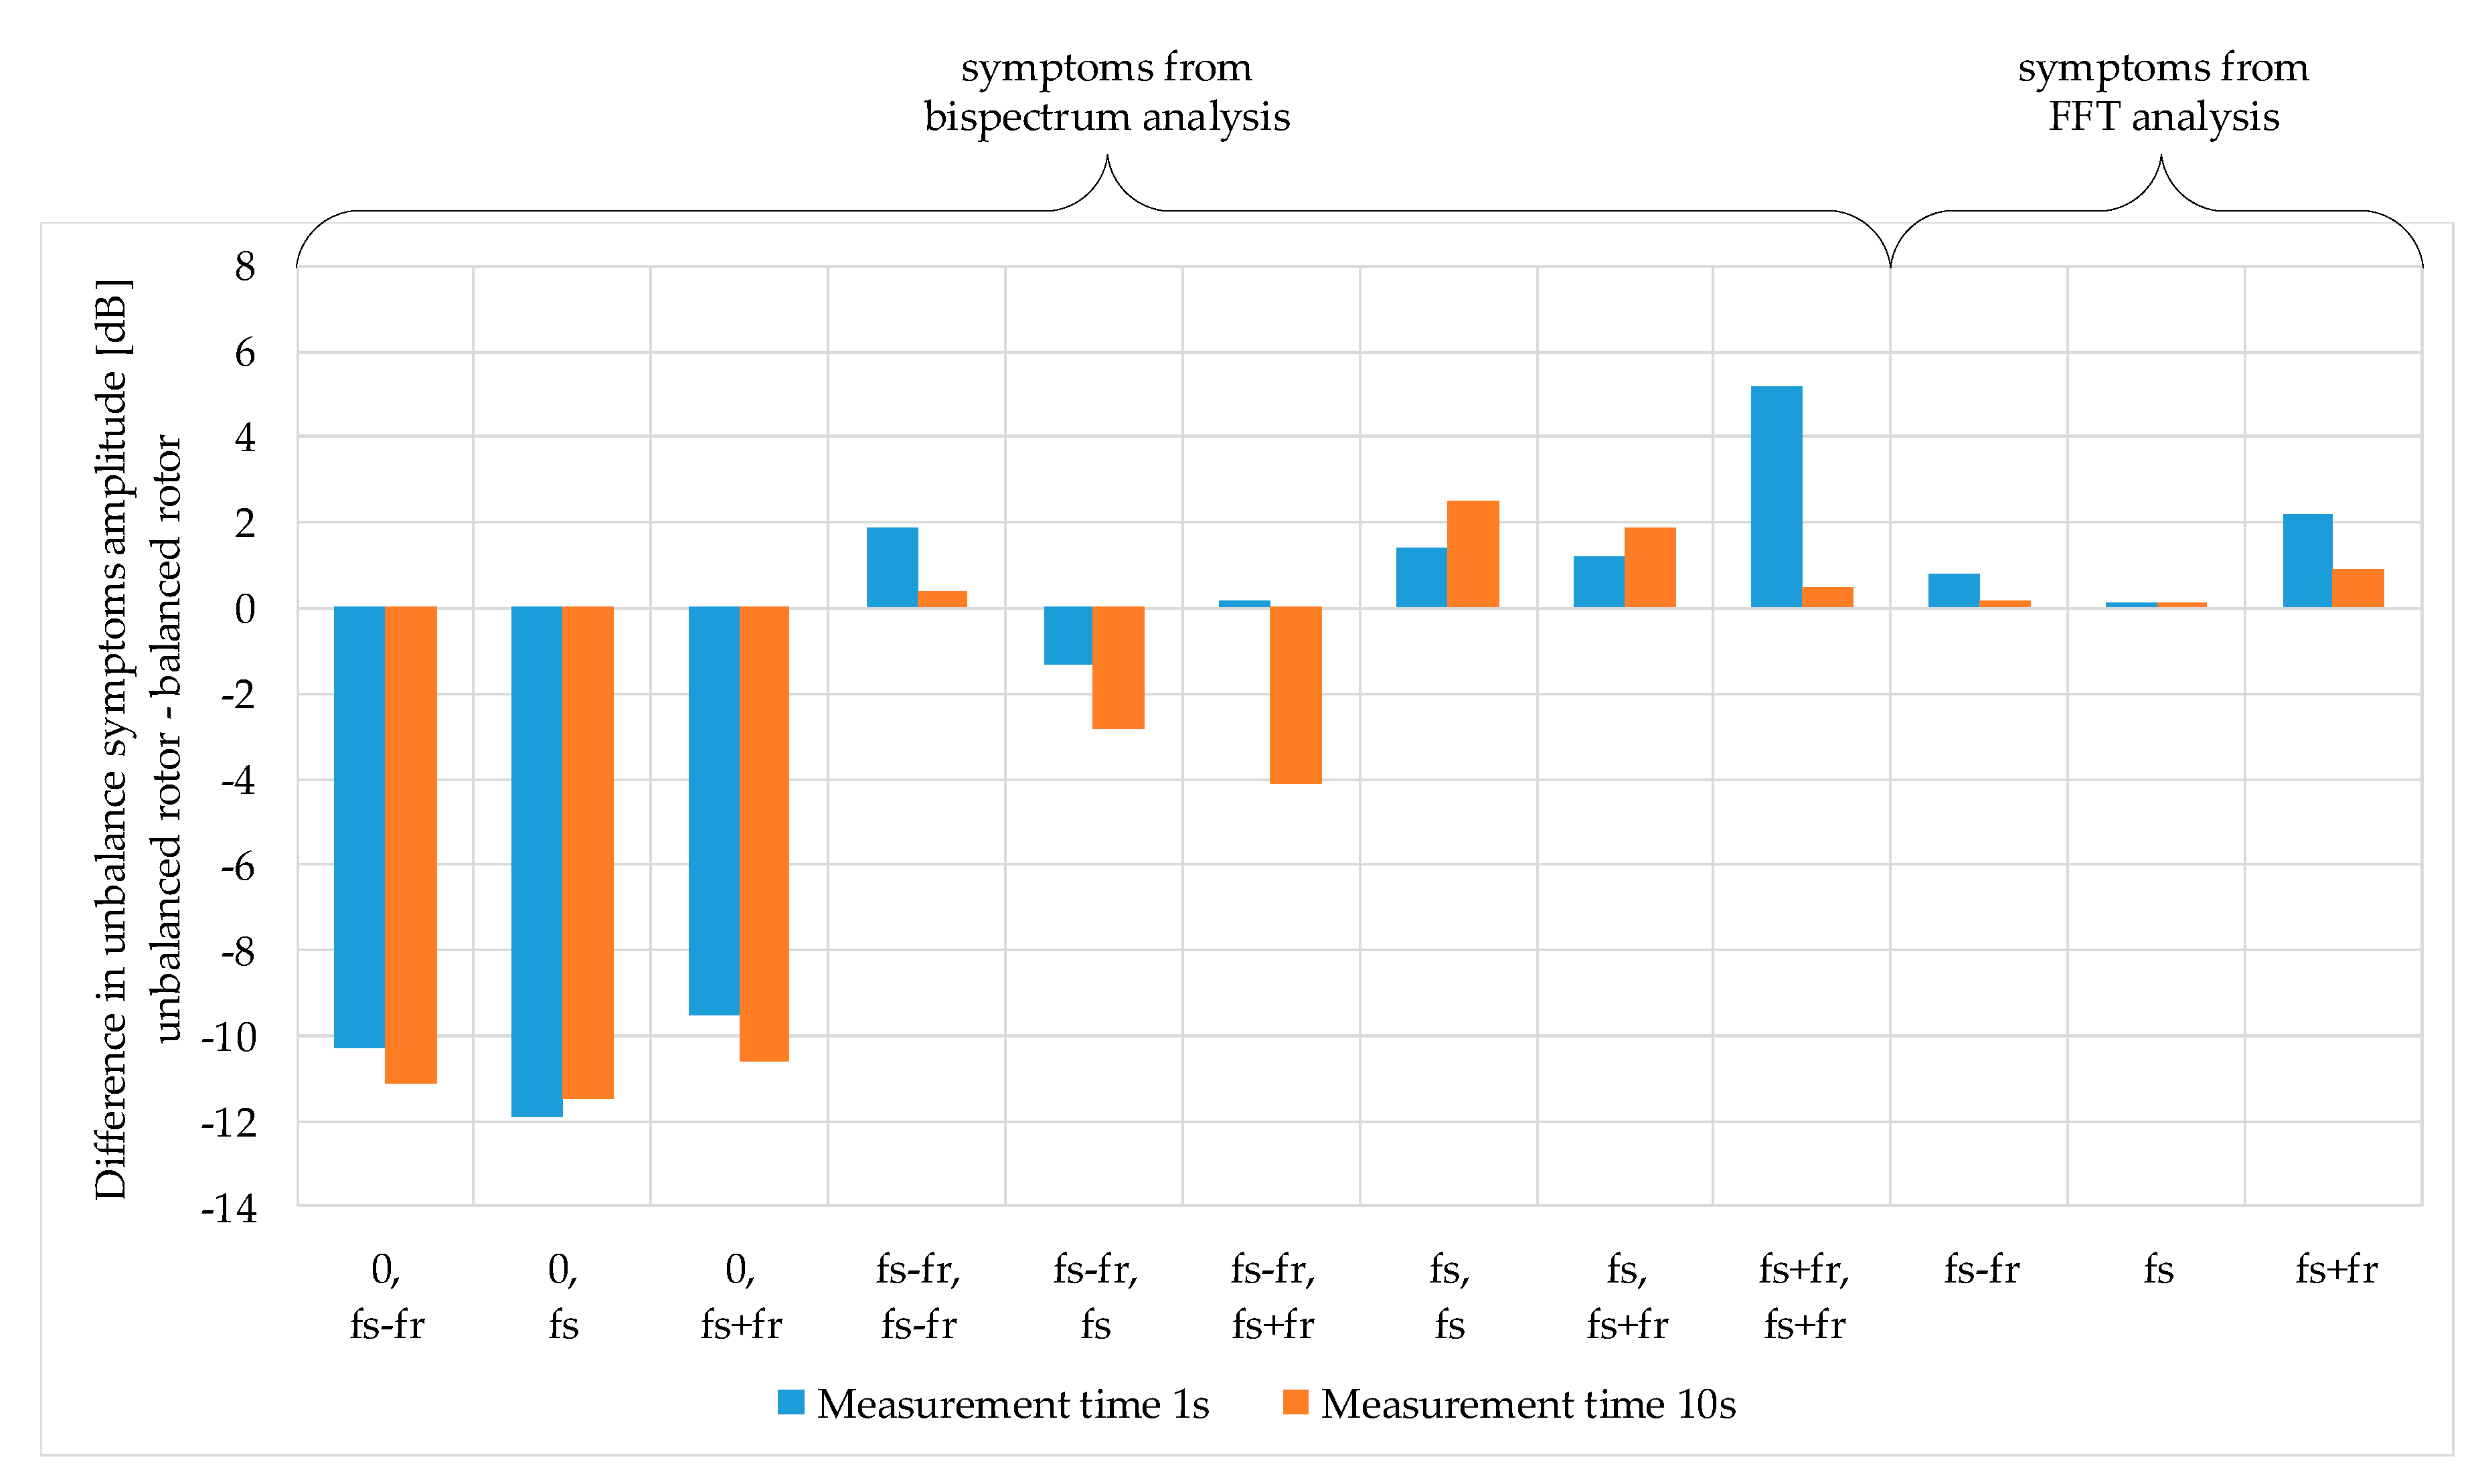
5.1. Results Analysis for Case No. 1

Figure 5 presents stator current spectra for a motor with a balanced rotor (Figure 5a) and with an unbalanced rotor (Figure 5b). The unbalance was obtained by mounting a test mass of m = 16.26 g, radius R4 = 135 mm and angle 80°. In the presented case, the rotor unbalance of 2195.1 g·mm is exerted on the rotor. In the stator rotor spectrum, an increase in the amplitude of characteristic frequencies func = fs ± fr by about 11 dB is observed.
Figure 6 presents the mechanical vibration spectra of a motor with a balanced (Figure 6a) and unbalanced (Figure 6b) rotor. In this case, identical unbalance results in an increase in the frequency amplitude funv = fr by about 24 dB.
For the purpose of recognizing the area where unbalance symptoms should be searched for, in Figure 7a and Figure 8a, three-dimensional bispectra are demonstrated for a motor with a balanced rotor. The area where unbalance symptoms for the two analyzed diagnostic signals will be searched for is marked (red triangle). The area was determined by bispectrum symmetry properties to facilitate the analysis of the obtained results. Figure 7a presents a third-order spectrum for a stator current signal. The characteristic frequencies occurring in the signal are marked. The three highest peaks, marked as: (0, fs), (fs, 0), (fs, fs), stem from the mains frequency fs = 50 Hz. Frequencies related to unbalance are marked with black dots. In the case of the stator current, the most visible are frequencies: (fsfr, fsfr), (fsfr, fs), (fs, fsfr). Analogically, in Figure 8a, the unbalance symptoms occurring in the mechanical vibration bispectrum are also marked with black dots.
Figure 7 presents 3D and 2D bispectra of the stator current for a motor with a balanced rotor (Figure 7a) and the mounted test mass m = 16.26 g at an angle of 80° and a radius R1 = 78.75 mm (Figure 7b) and also at a radius of R4 =135 mm (Figure 7c). In the presented case, two unbalances were found: the first one was about 1280.5 g·mm and the other one 2195.1 g·mm. The figure shows also the change of the presented bispectrum in the frequency area containing the unbalance symptoms. An increase in the amplitudes of the characteristic symptoms under the influence of unbalance is observed. Moreover, a larger radius resulted in a decrease in the noise level and the extraction of frequencies responsible for unbalance. Frequencies (fsfr, fsfr) and (fsfr, fs) are more visible, however, and their amplitude decreases in comparison with the case presented in Figure 7b, which is clearly observable in the 2D bispectrum.
Figure 8 presents 3D and 2D bispectra of mechanical vibration registered for analogous unbalance levels. An increase in the test mass radius, and hence the larger unbalance, results in increasing the symptom amplitudes, indicating unbalance. The largest values of amplitude changes were observed for frequencies (fr, fr), which were about 29 dB in comparison with the level observed for a motor with a balanced rotor.
The influence of the time when the measurement signals were registered on the bispectrum effect and the fast Fourier transform was also examined. The results presented in Figure 9 and Figure 10 were obtained for the unbalance mass m = 10.37 g mounted at an angle of 80° and a radius of R4 = 135 mm. Figure 9a,c and Figure 10a,c demonstrate the results obtained for a registration time of 1 s, while in Figure 9b,d and Figure 10b,d the registration time was 10 s.
Figure 9 presents the results of the stator current analysis. In the case of a 3D bispectrum, a shorter signal registration time led to an increase in the amplitudes of the characteristic frequencies. In addition to this, the noise visible around the marked symptoms was reduced. In the case of the FFT analysis of the stator current, the frequencies characteristic of the shorter registration time cannot be differentiated from the background. In this case, the analysis is significantly hindered.
Figure 10 shows the results of the analysis of the mechanical vibration acceleration. In the presented example, the 3D bispectra are similar to each other. The reduction of the registration time does not hinder the detection of the characteristic symptoms of unbalance. In the case of the classical FFT analysis, the detection of unbalance was also possible. Here, the shorter signal registration time deteriorates the spectrum resolution, however, despite this frequency, fr is still well visible.

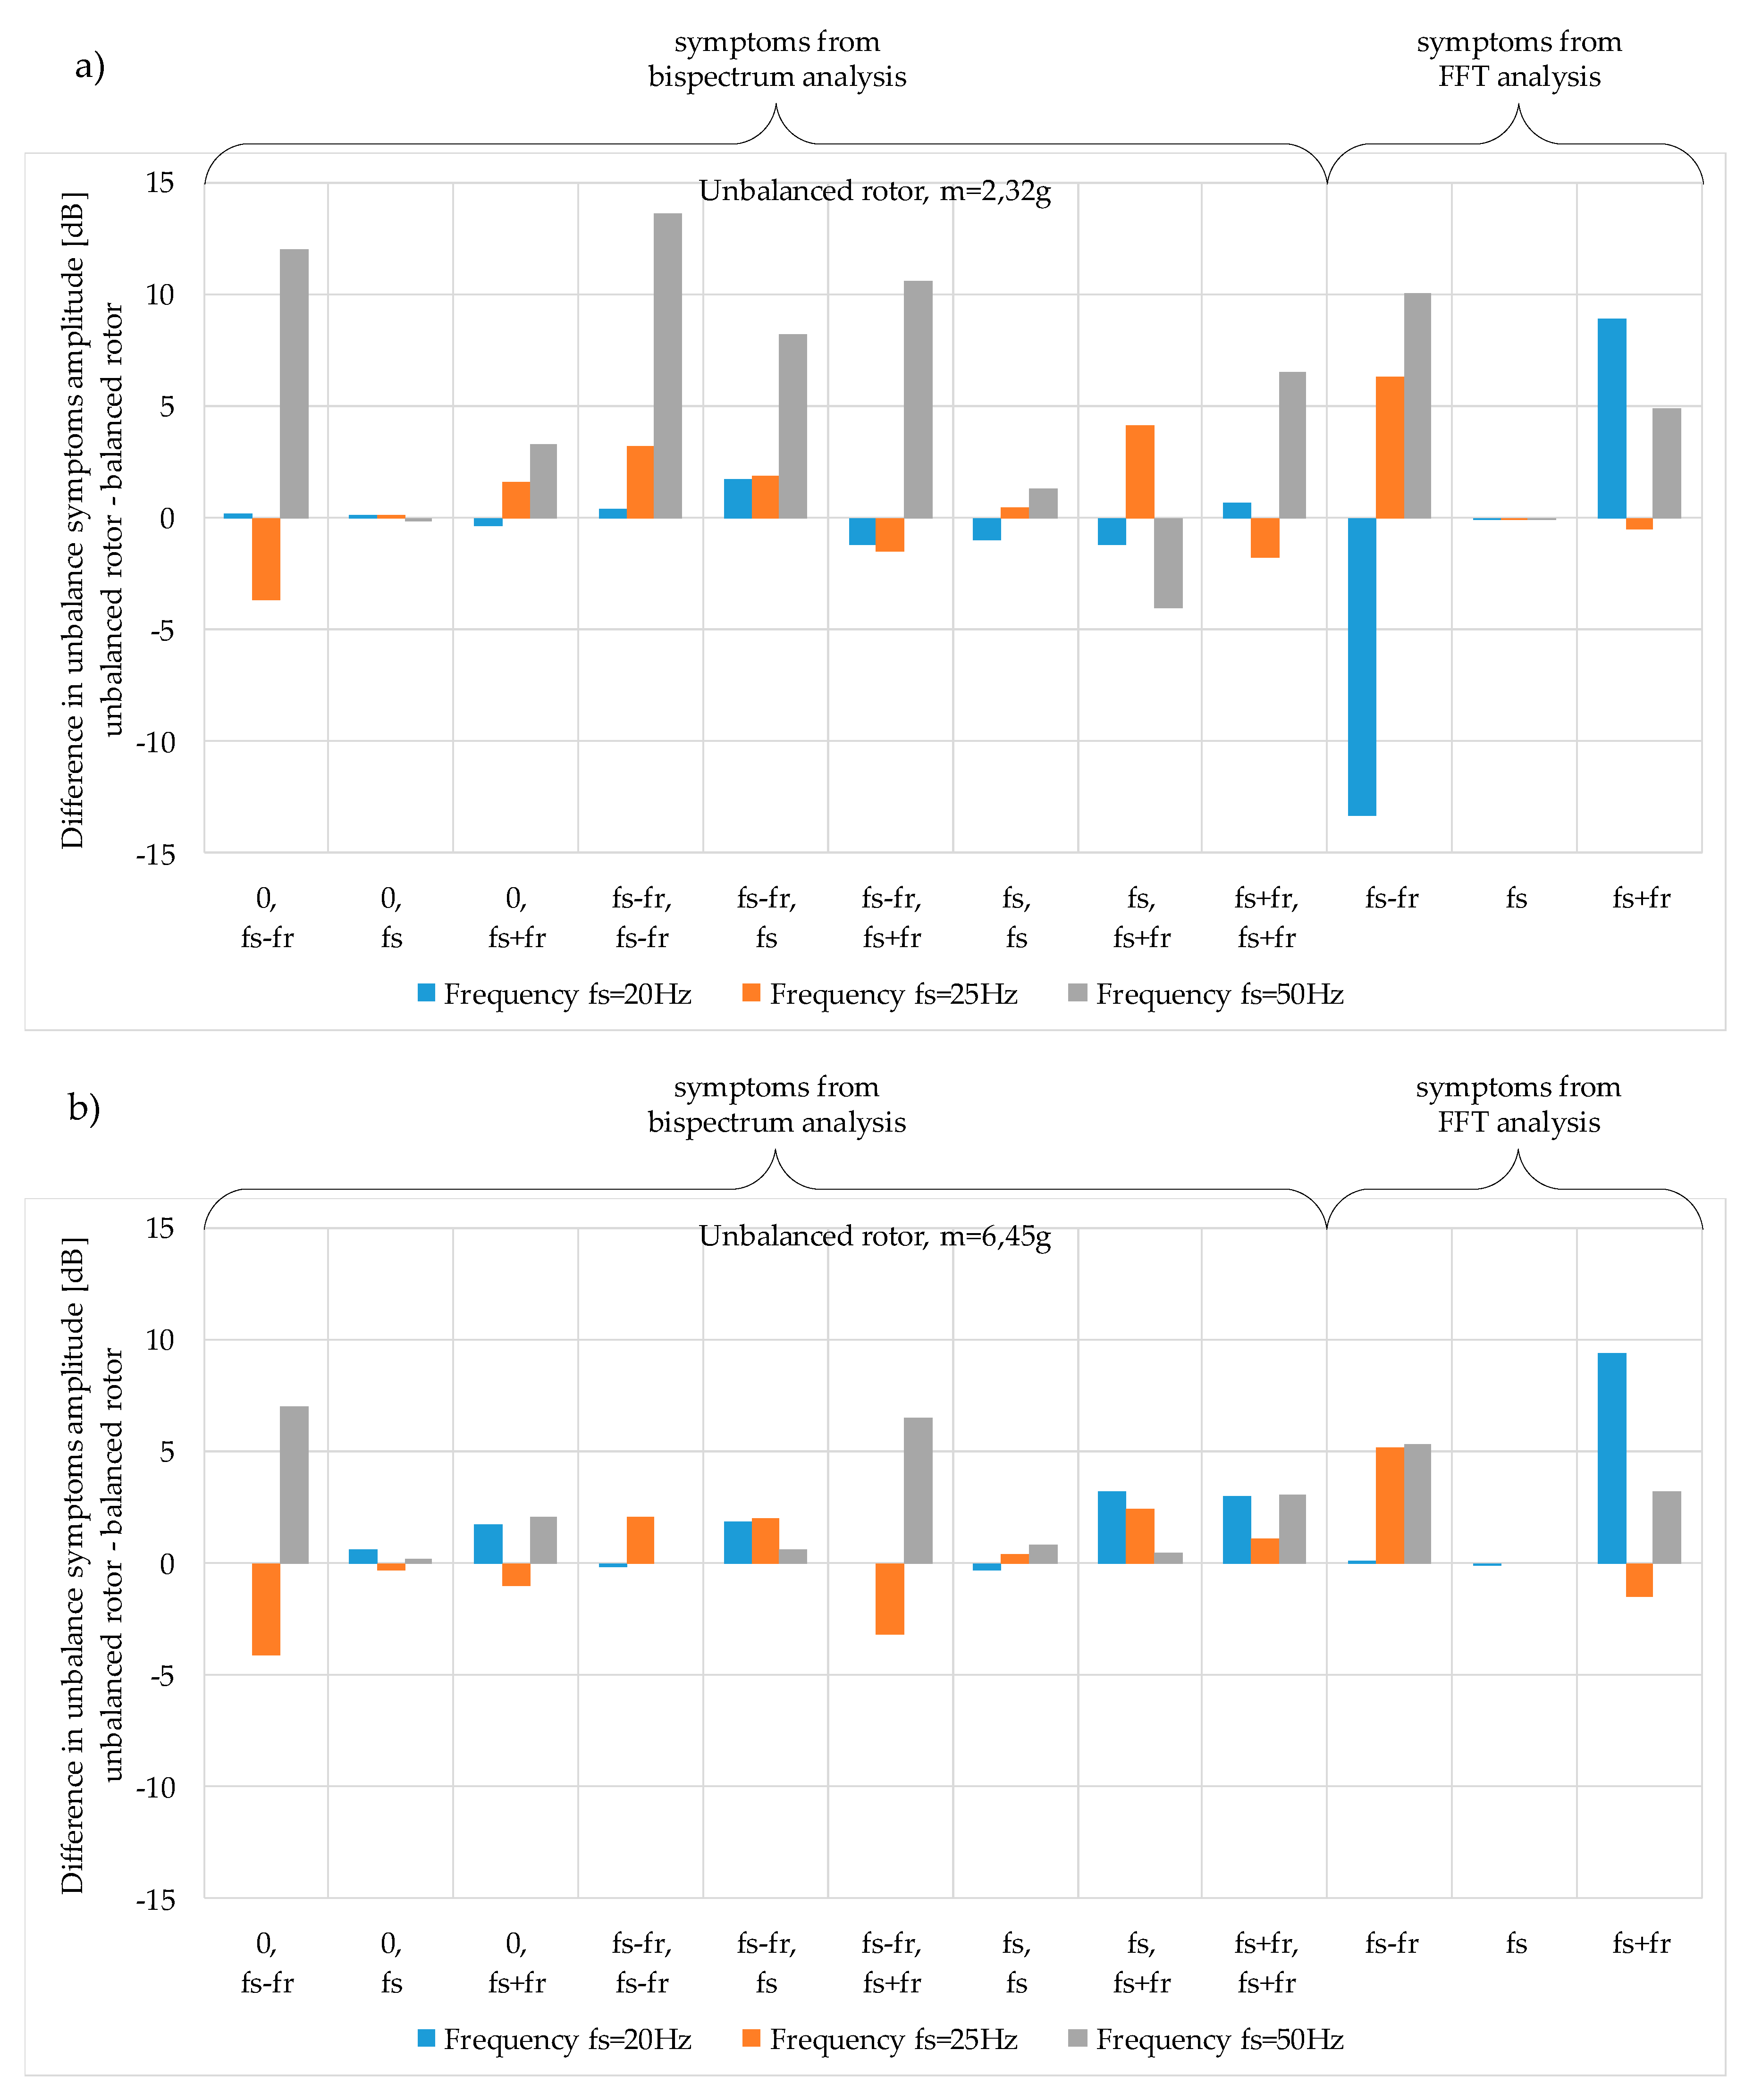
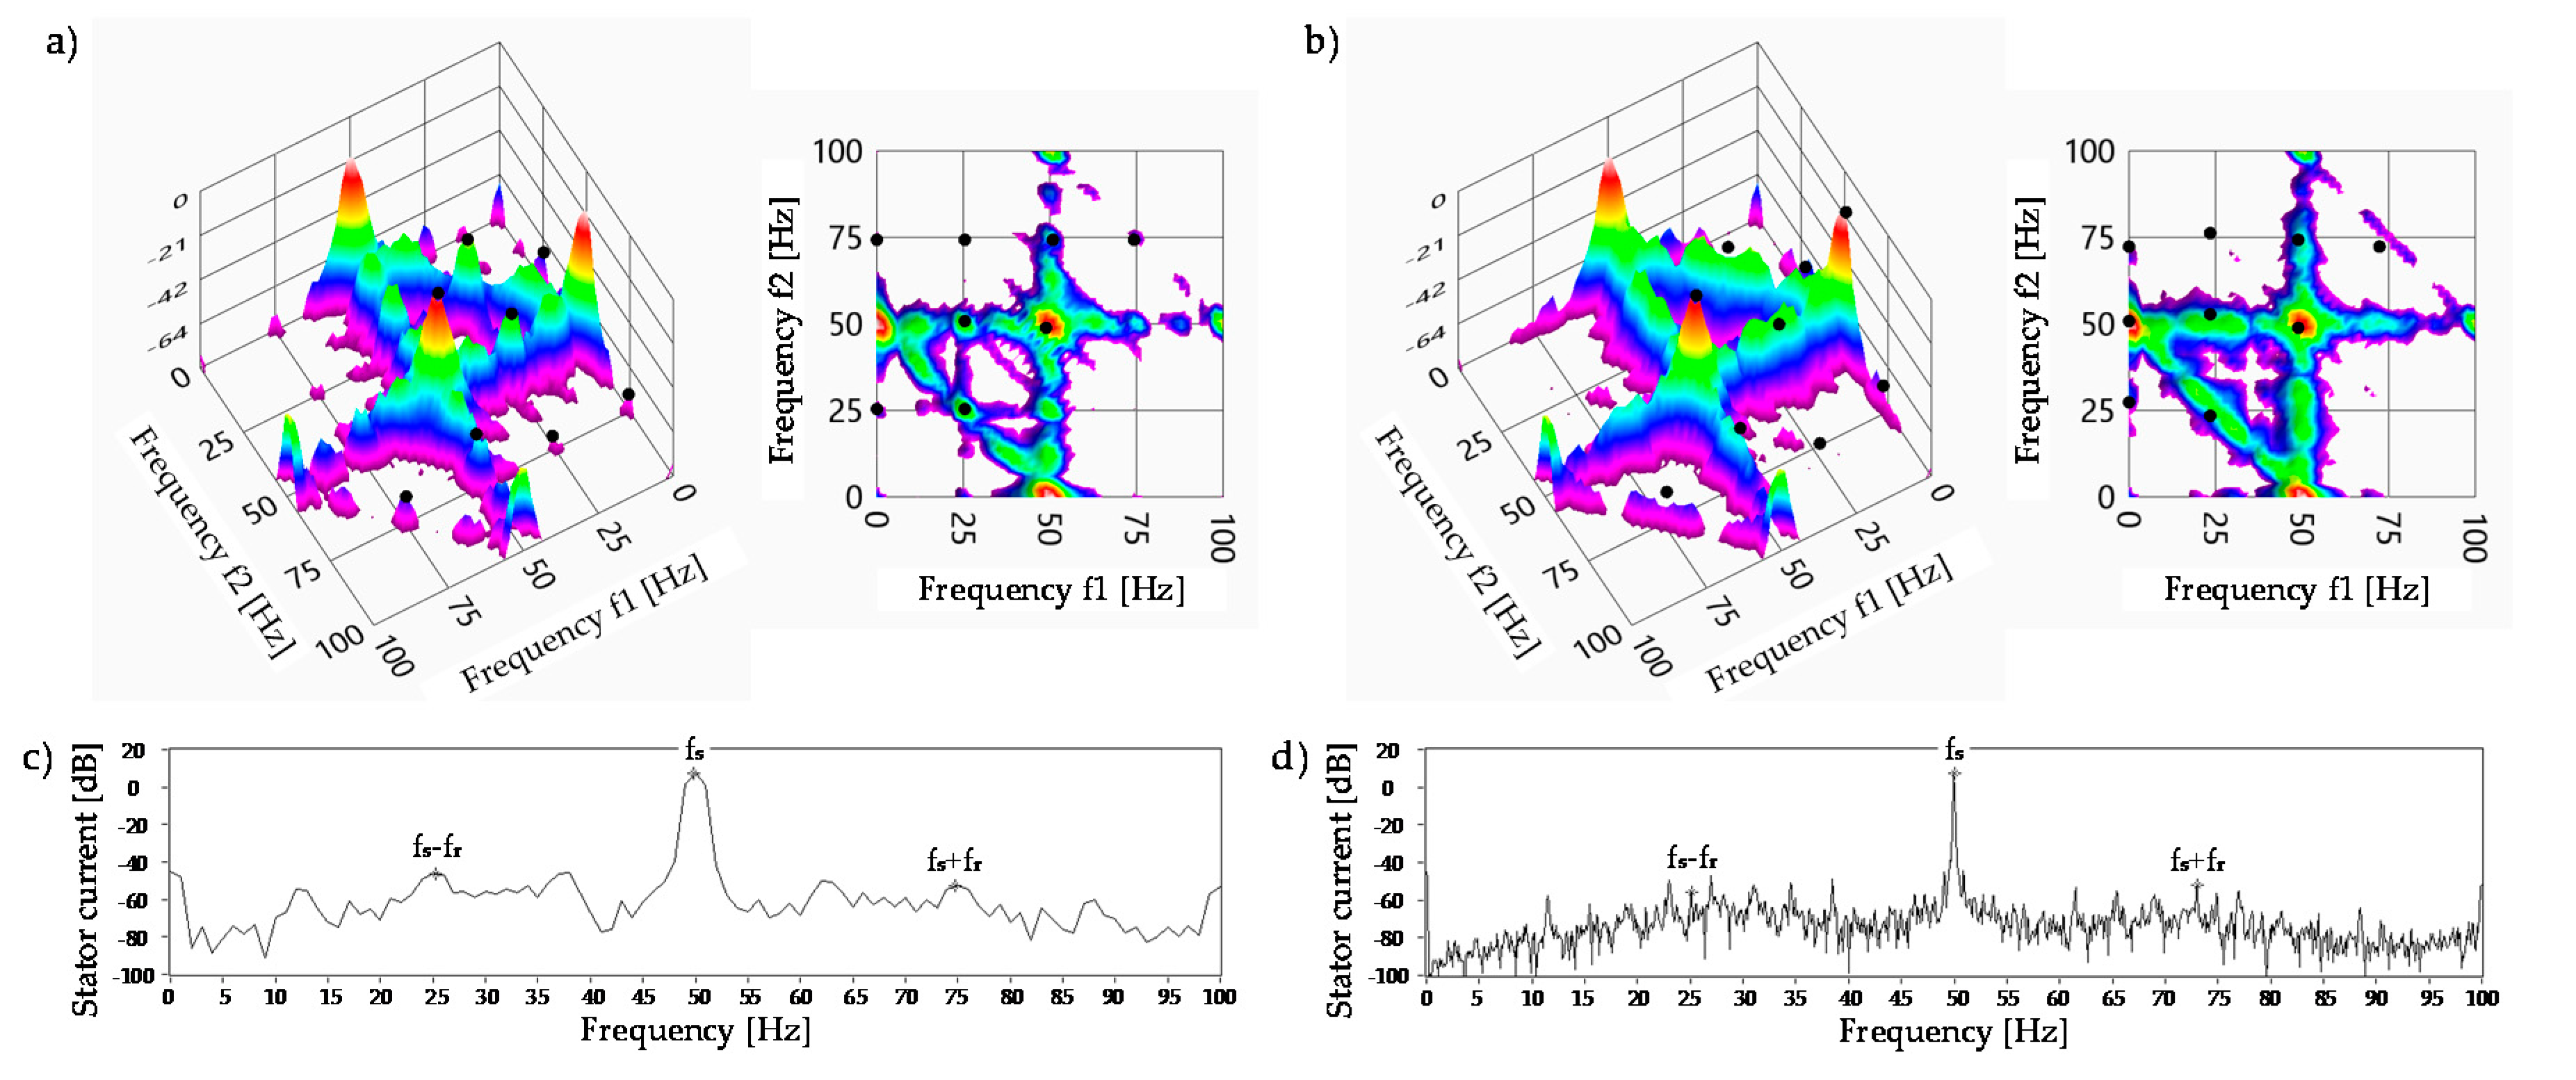
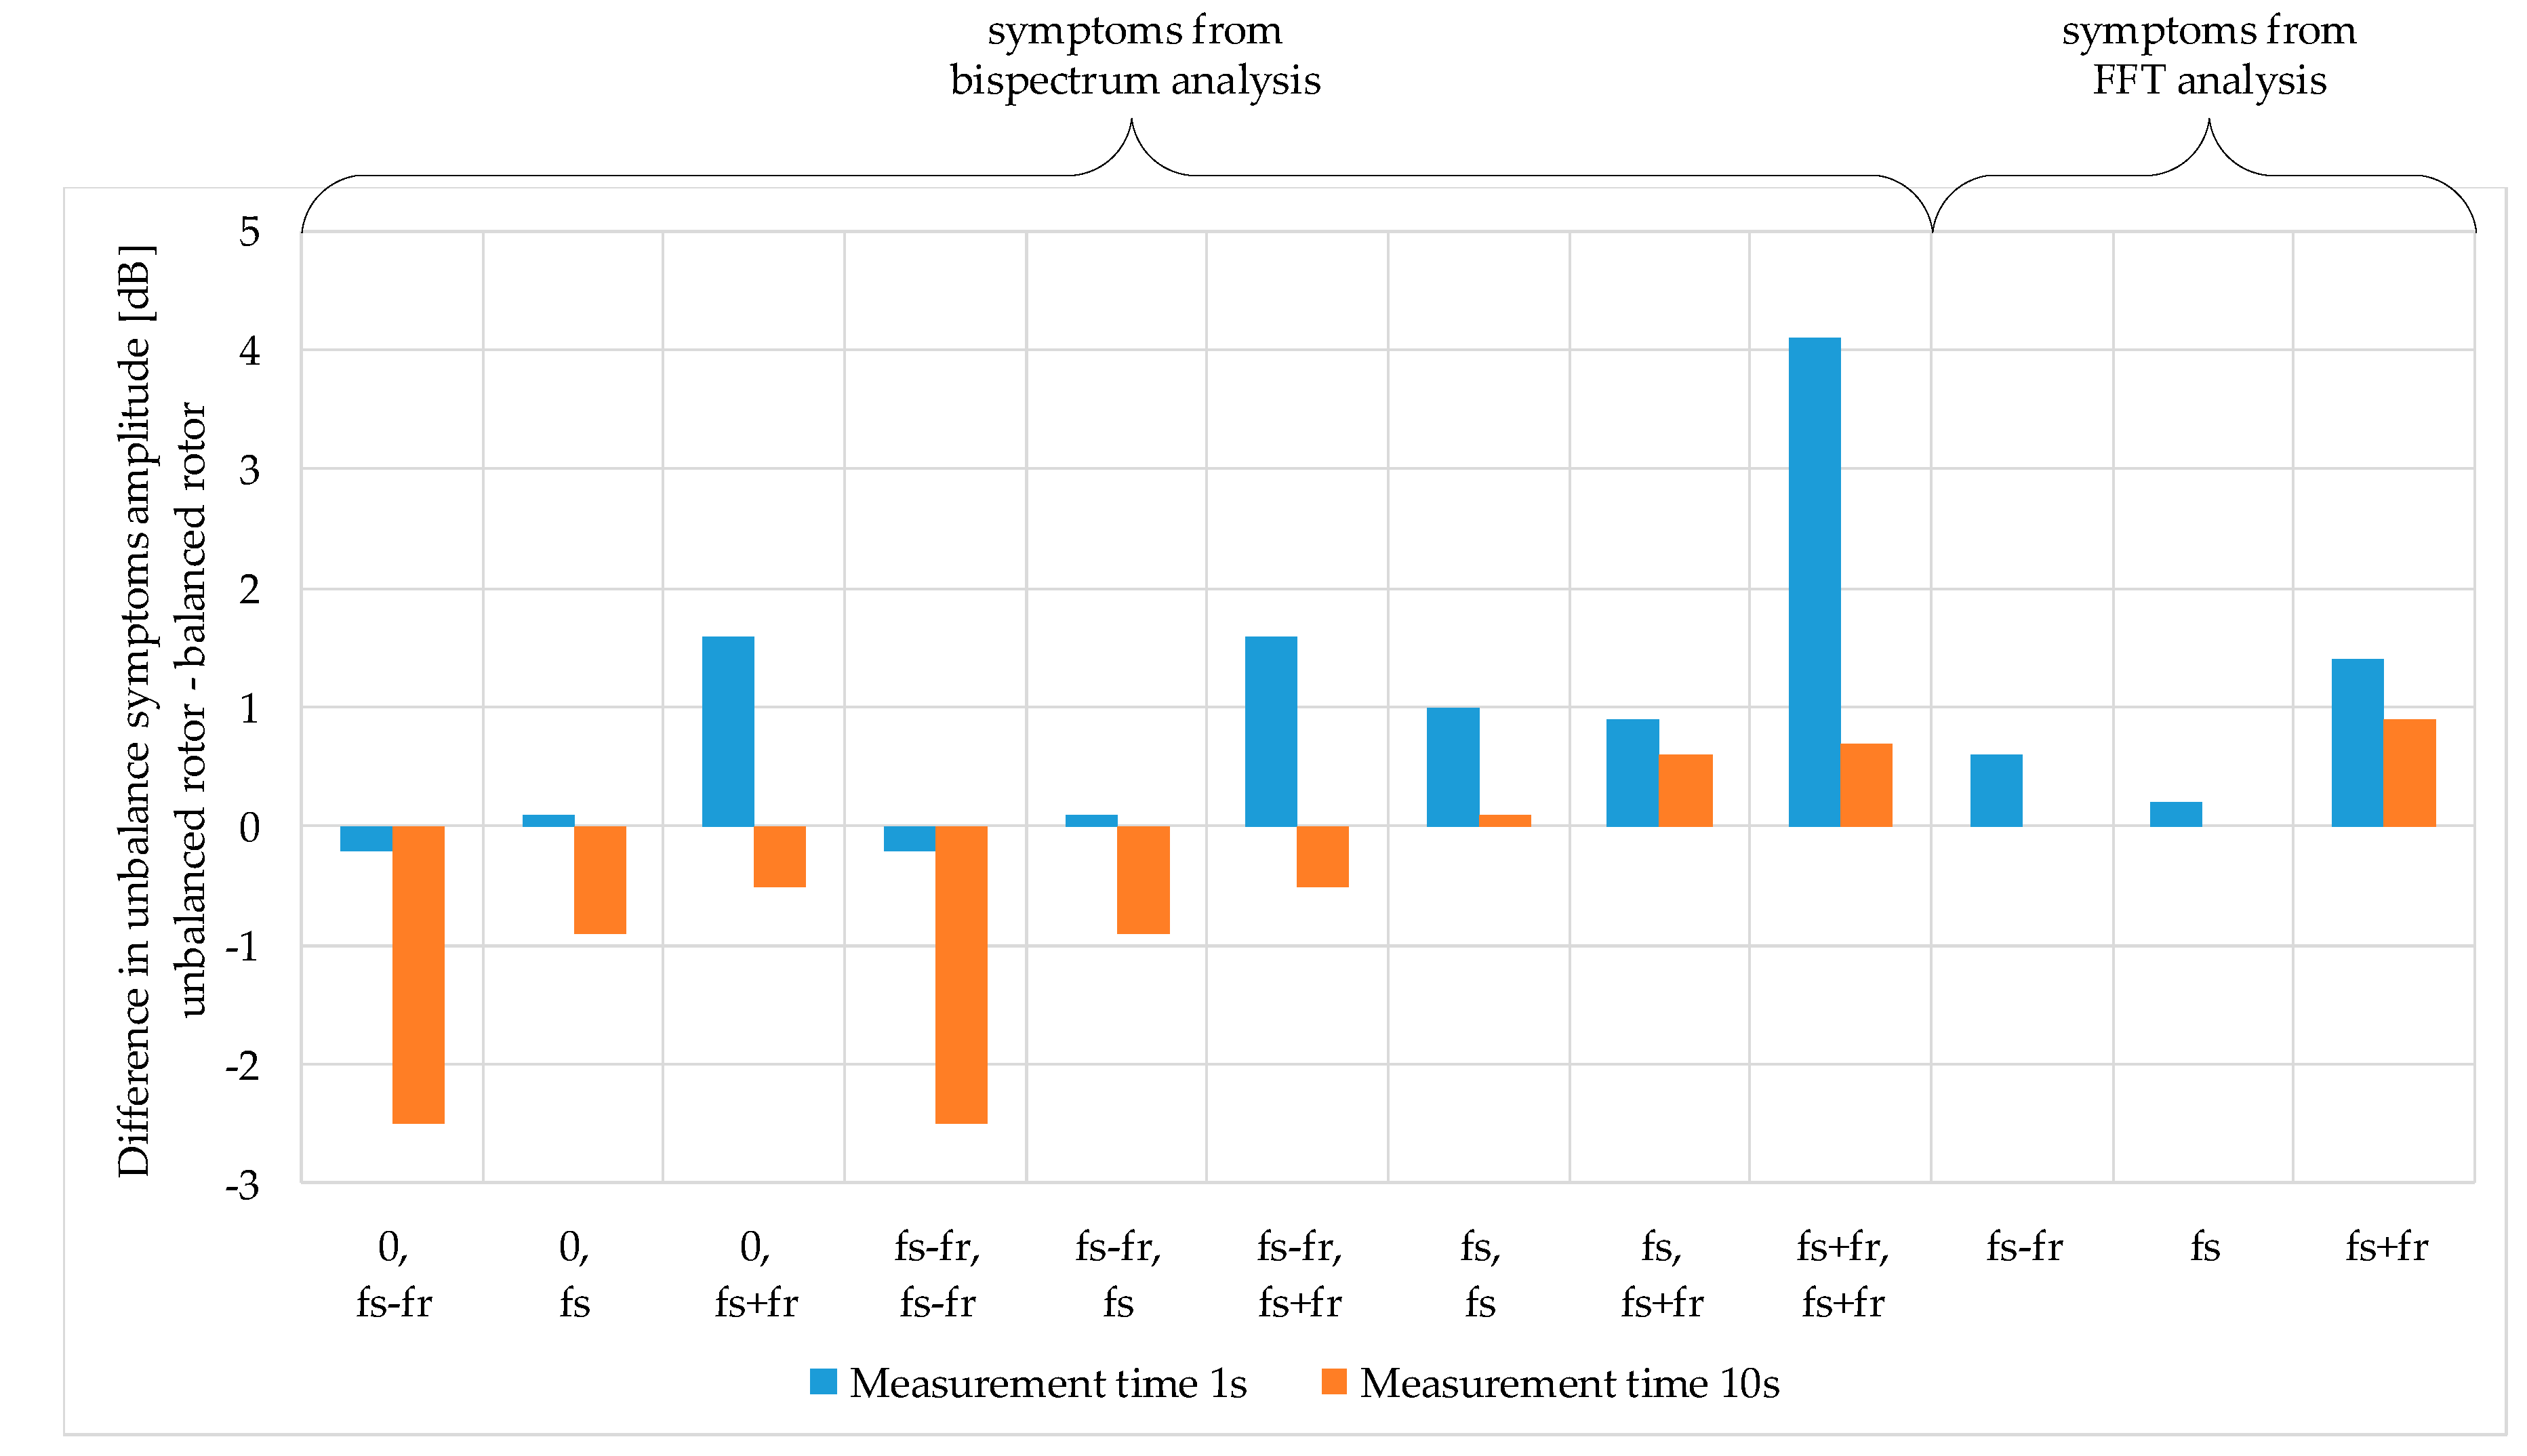
5.2. Results Analysis for Case No. 2

During these tests, a motor with one pair of poles was used. In the case of this motor, the rotational frequency without a load was approximately equal to the supply frequency. Due to the fact that unbalance changes with the value of the squared speed, in the case of the motor with one pair of poles, the maximum supply frequency was halved (to 25 Hz). Thanks to this, the motor speed did not exceed 1500 RPM and was close to the speed of the motor with two pairs of poles with a supply voltage frequency of 50 Hz. Additionally, the tests were also conducted for a motor supplied with a voltage frequency of 10 Hz.
Figure 11 collates the amplitudes of characteristic frequencies occurring in the bispectrum and the spectrum of a motor supplied with a voltage frequency of 10 Hz. The diagnostic signal measurement time exerts a considerable influence on the number of symptoms. The analysis also showed that in the case of the bispectrum analysis, the measurement time of only 1 s is sufficient. The largest amplitude change between the balanced and unbalanced motor was observed for symptom (fs + fr, fs + fr). The amplitude difference was 5.2 dB. Extending the measurement time to 10 s, unfortunately, has an adverse effect on the analysis of higher-order results (limiting the number of symptoms to one–(fs, fs + fr)). In the case of the spectral analysis of a stator current, only one symptom fs + fr remains useful. The mass test of 10.37 g resulted in an increase in the amplitude of this frequency by 2.2 dB. In the case of the unloaded motor with one pair of poles, frequency fsfr can be detected as the fundamental component. Due to the fact that measurement systems can remove the fundamental component, this symptom should not be analyzed in the detection of unbalance.
In the case of the motor supplied with a voltage frequency of 25 Hz (Figure 12) in the analyzed stator current signal, similar symptoms occur as in the case of a voltage frequency of 10 Hz. Thus, it is also more advantageous to analyze a signal registered for 1 s. In the bispectrum analysis, the largest amplitude change was observed also for symptom (fs + fr, fs + fr), it was 4.1 dB. In the stator current spectrum, component fs + fr rose by 1.4 dB.
Figure 13 shows the collation of the results obtained in the analysis of the bispectrum and the fast Fourier transform of the mechanical vibration acceleration signal of a motor supplied by a frequency converter, voltage frequency 10 Hz. The research showed that in the bispectrum analysis as many as four symptoms of rotor unbalance were significant: (0, fr), (fr, fr), (fr, 2fr) and (fr, 3fr). The largest amplitude changes were observed for the mechanical vibration measurement time of 1 s for two symptoms: (0, fr), (fr, fr) and they were about 22 dB. For the other two symptoms—(fr, 2fr) and (fr, 3fr)—the changes are also substantial, about 10 dB. The extension of the measurement time to 10 s resulted in reducing the amplitude changes for the first two symptoms to 13.5 dB and 14.7 dB, respectively. For the remaining two symptoms, the introduction of a test mass of 10.37 g resulted in an amplitude increase by 7.5 dB. In the spectral analysis of the mechanical vibration, unbalance is detected by only one symptom, rotational frequency fr. For the signal registered for 1 s, an increase in rotational frequency amplitude by 21.3 dB is observed, while for the signal registered for 10 s the same value is equal to 13.6 dB.
In the case when the motor was supplied by a voltage frequency of 25 Hz (Figure 14), similar changes of amplitudes characteristic of unbalance symptoms occurring in the bispectrum of mechanical vibration were observed. In addition, in this case it is more advantageous to register a signal for 1 s. Only in the FFT analysis, the change in the signal registration time does not influence the change in the rotational frequency amplitude. For both the registration time of 1 s and 10 s, the introduction of the test mass of 10.37 g results in an increase in the frequency amplitude fr by about 22 dB.

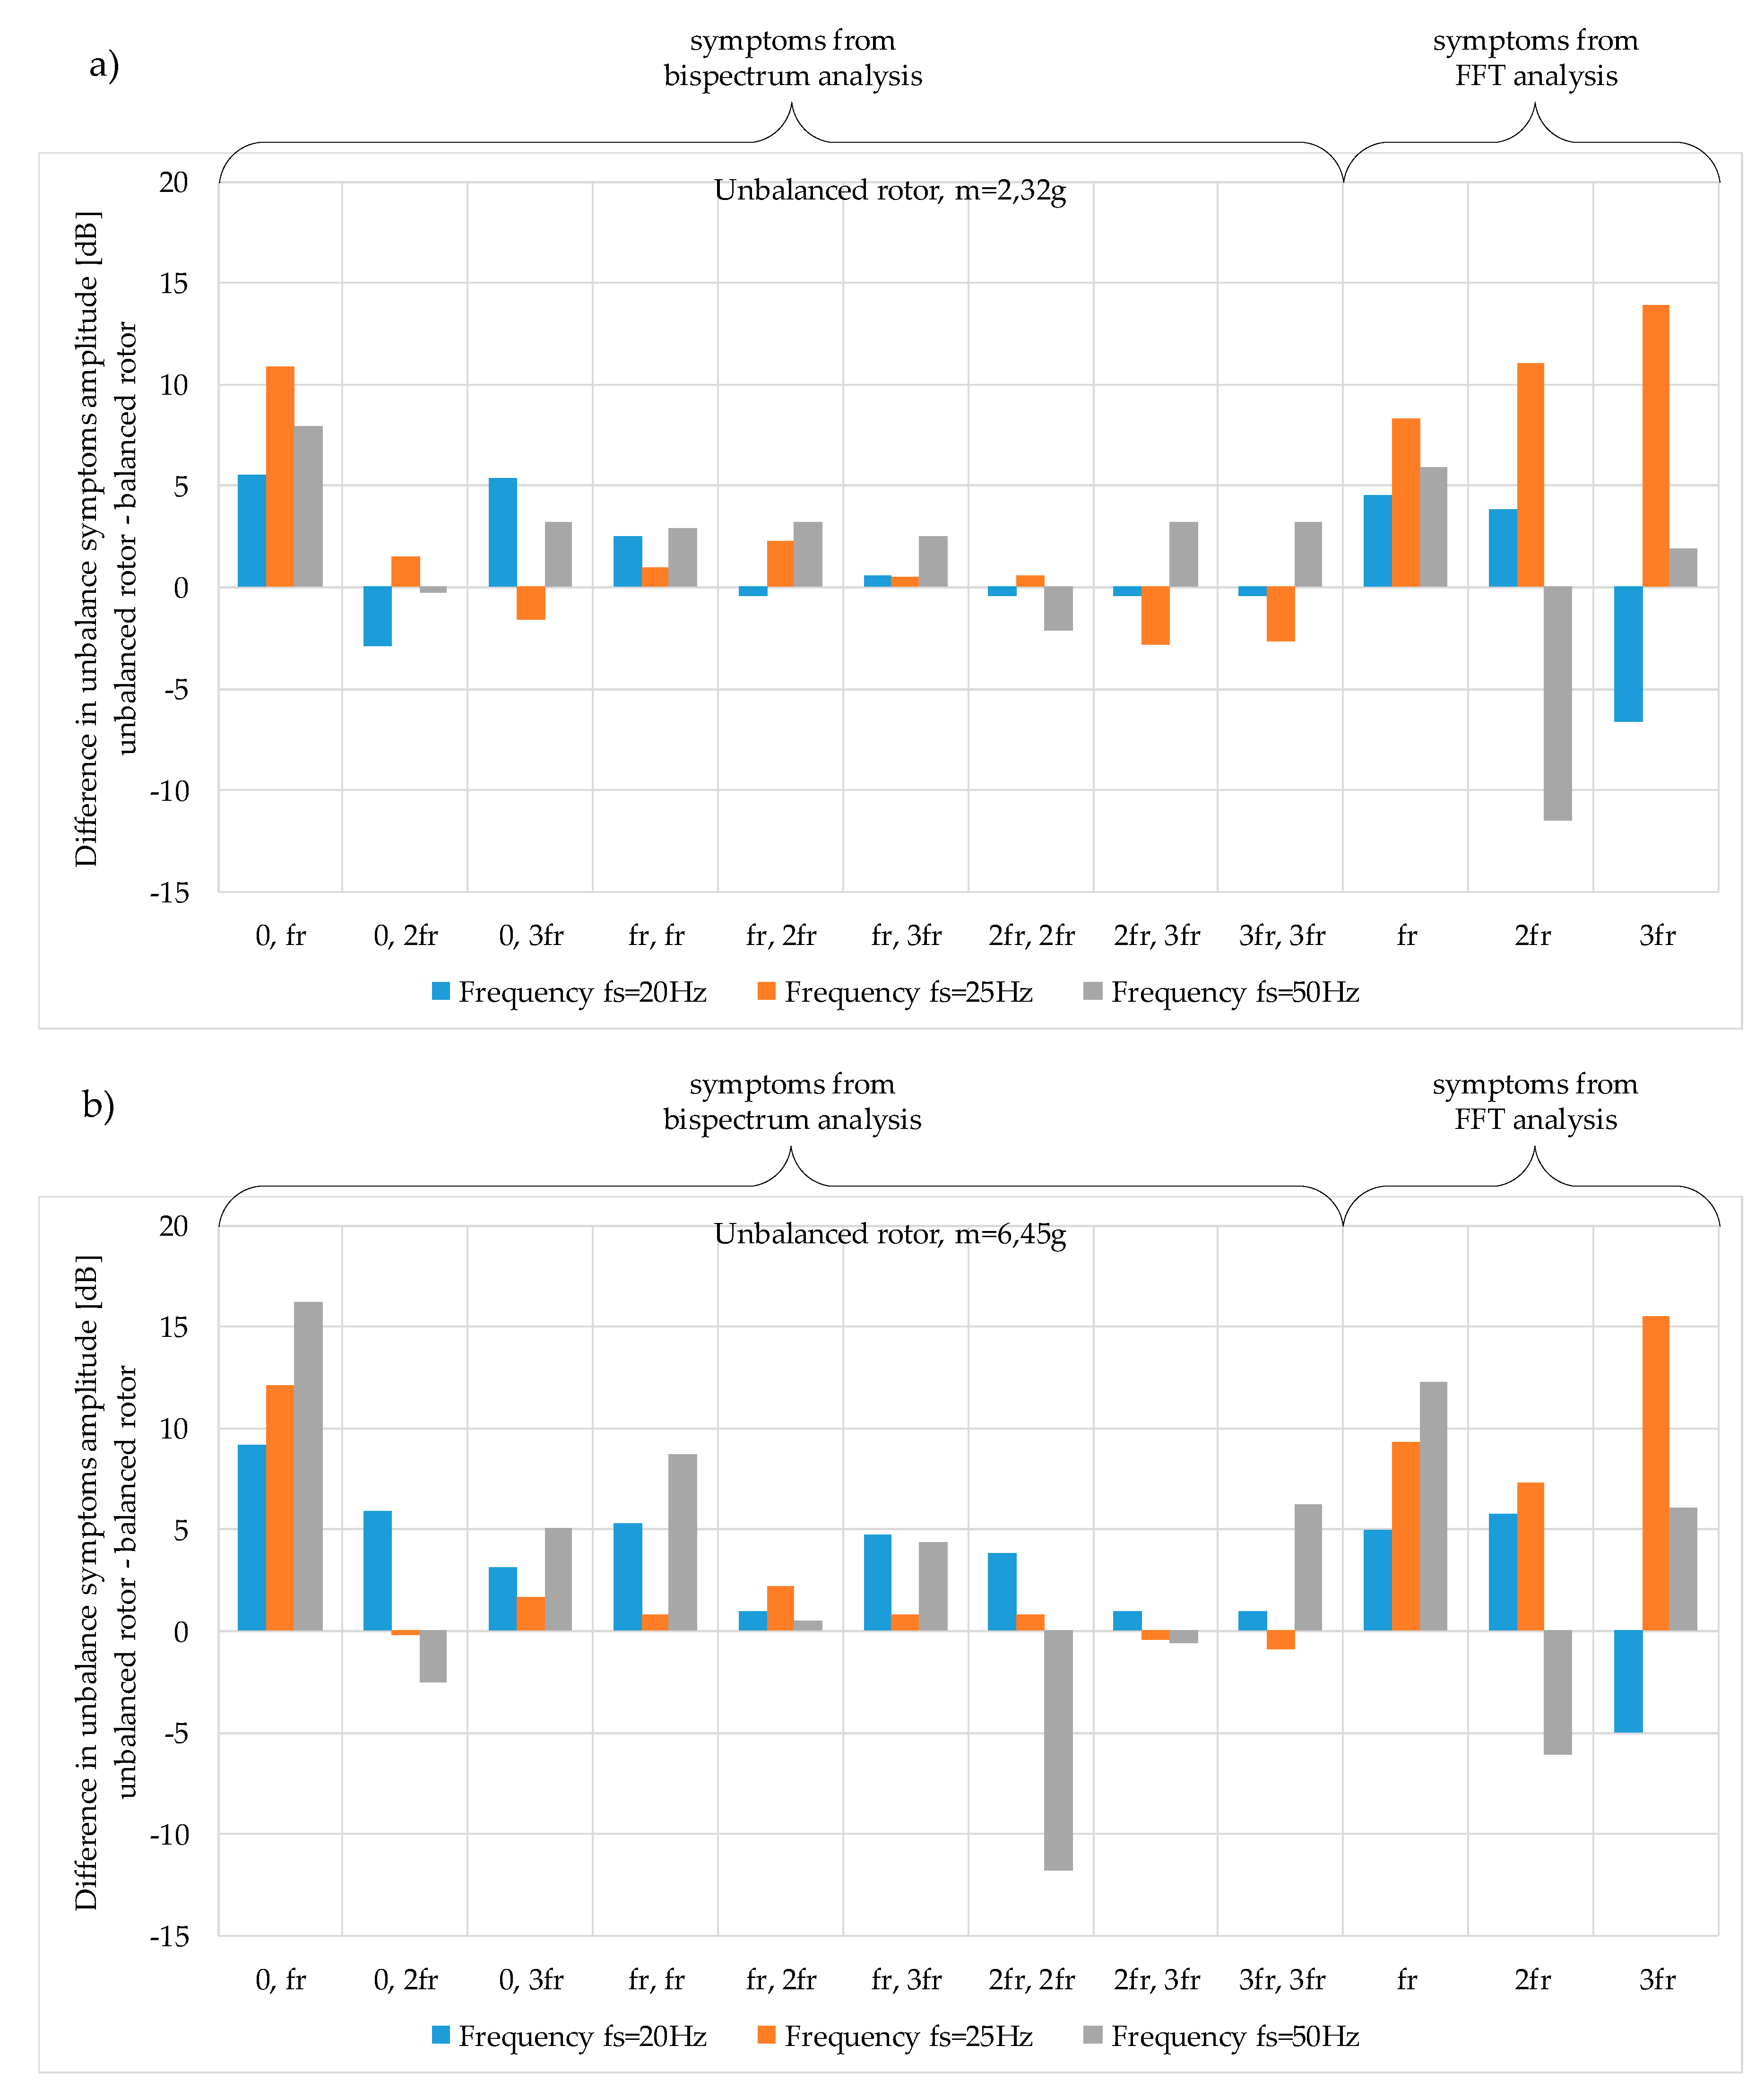
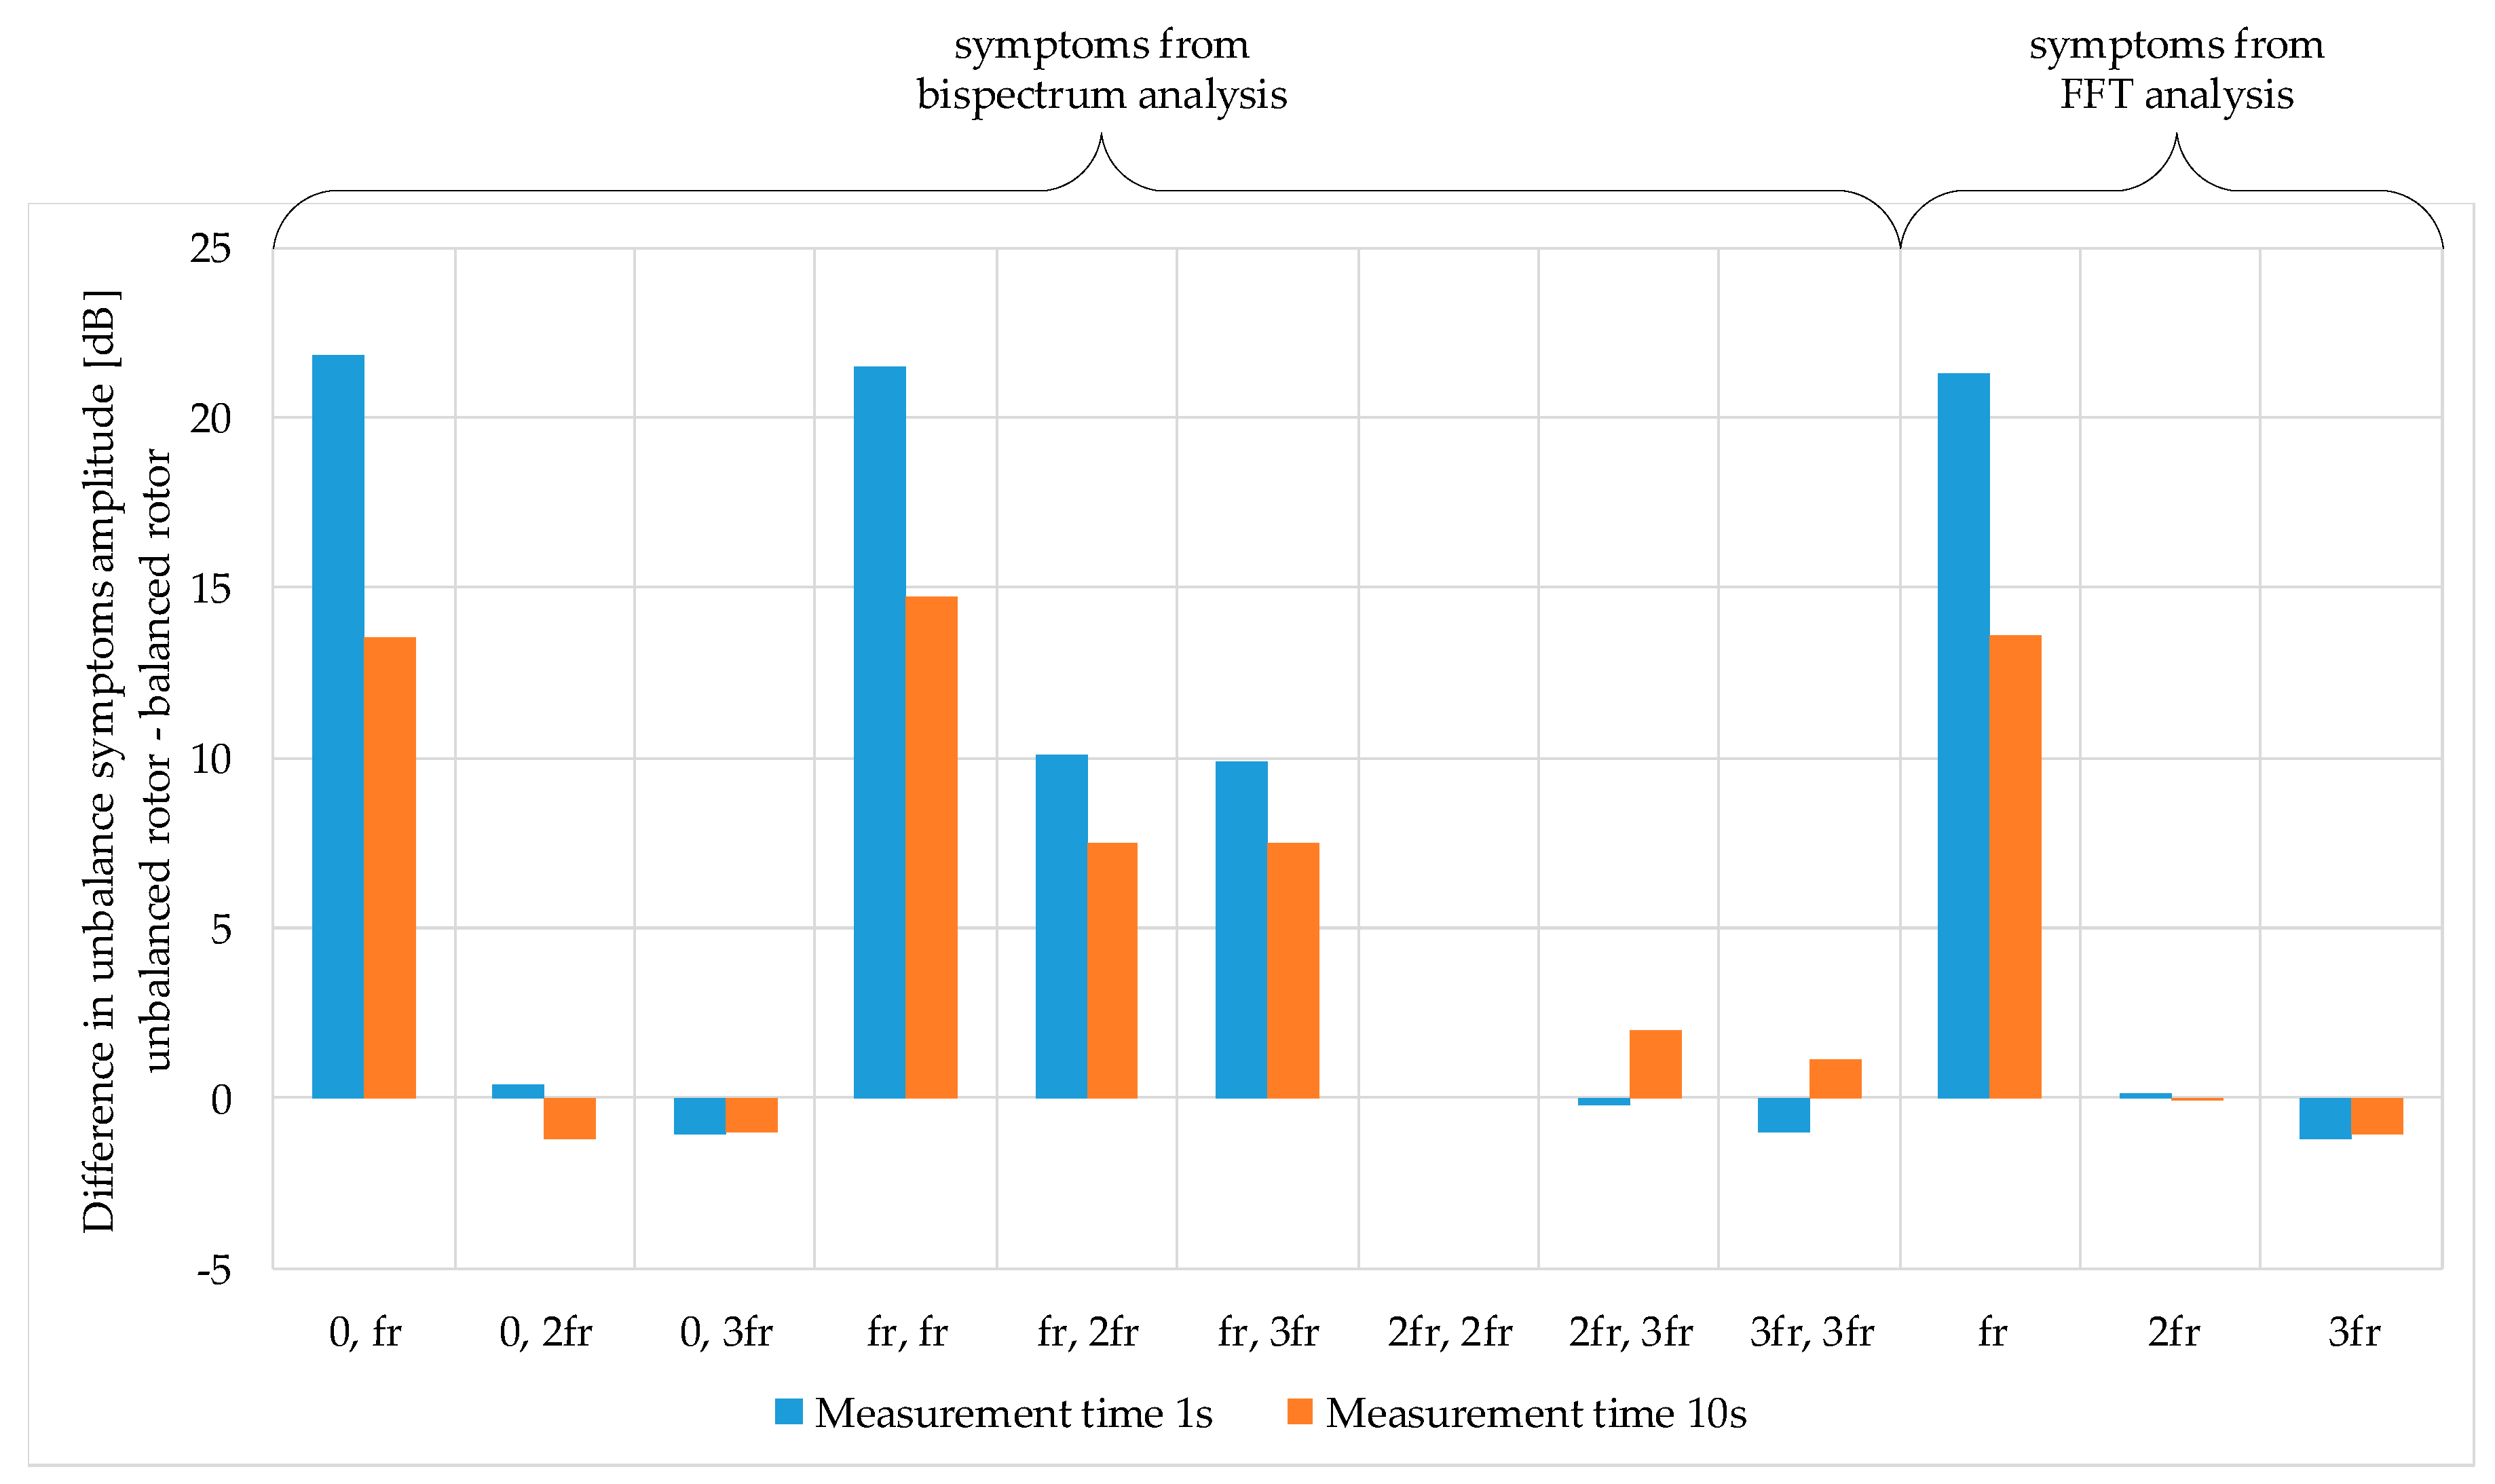
5.3. Results Analysis for Case No. 3

In Case No. 3, the motor with two pairs of poles was used, supplied by a frequency converter; however, the method used to model the unbalance was different. In this approach, the test mass was mounted directly on the rotor. Due to the location of the test mass (limited space), during the tests, two different masses were used: 2.32 g and 6.45 g. Moreover, the radius of the fixed samples was also smaller, only 30 mm. This resulted in a decrease in the unbalance affecting the rotor to the value of: 69.6 g·mm and 193.5 g·mm, respectively.
Figure 15 presents the collation of results obtained in the bispectrum analysis and the fast Fourier transform of the stator current of the motor supplied by a frequency converter, with a voltage frequency of 20 Hz, 25 Hz and 50 Hz. The presented results were obtained for a registration time of 1 s. Unfortunately, in this case it is difficult to unambiguously choose the symptom which always reacts to the occurrence of unbalance. The generation of higher harmonics by an inverter and the small test mass mean that at a supply frequency of 20 Hz and 50 Hz, the highest amplitude changes (for a test mass of 2.32 g—Figure 15a and 6.45 g—Figure 15b) in the bispectrum were observed for symptoms (fsfr, fs) and (fs + fr, fs + fr), while in the case of a frequency of 25 Hz, the amplitude change was observed for three symptoms: (fsfr, fsfr), (fsfr, fs) and (fs, fs + fr). In the case of the fast Fourier transform, it is necessary to analyze two symptoms, fs ± fr. Unfortunately, only in the case of the motor supplied with a voltage frequency of 50 Hz, do two symptoms react simultaneously to unbalance. Increasing the measurement time of the stator current to 10 s does not exert a positive influence on the way of detecting unbalance.
Figure 16 shows the collation of results for the bispectrum analysis and the fast Fourier transform of the mechanical vibration acceleration in the case of the motor supplied by the frequency converter. The results were also obtained for the registration time of 1 s. The comparison of Figure 16 with Figure 13 and Figure 14 allows to observe that the symptoms do not overlap. To detect unbalance, it is necessary to observe the components (0, fr) and (fr, fr) occurring in the bispectrum of the vibration acceleration. The observed amplitude changes are within the limits of about 5 ÷ 16 dB. However, the symptom (fr, fr) for the motor supplied with a voltage frequency of 25 Hz is an exception. In this case, the observed amplitude change was only 1 dB. In the analyzed case, the components (fr, 2fr) and (fr, 3fr) reacted to the unbalance change to a lesser extent (amplitude change of about 1 ÷ 5 dB is observed). In the mechanical vibration spectrum, the change of the rotational frequency amplitude fr should be observed. In this case, an amplitude increase by about 5 dB was observed for the motor supplied by a frequency voltage of 20 Hz to about 12 dB for the frequency fs of 50 Hz. The extension of the measurement time of the analyzed diagnostic signal influences the amplitude of the symptoms characteristic of rotor unbalance only to a small extent.

6. Summary

On the basis of the conducted experimental research, one can conclude that the bispectrum analysis is a useful tool for unbalance detection. It is characterized by an increased number of fault symptoms in comparison with the classical spectral analysis. The shorter registration time of the analyzed signal does not have a negative effect on the results obtained from the bispectrum analysis. The research indicated that one 1 s long signal is sufficient to detect motor unbalance using the bispectrum analysis. In the case of the fast Fourier transform, the shorter registration time of the stator current results in reducing the spectrum resolution, which has an adverse effect on the formulation of the right diagnosis.
Motor supply from a frequency converter does not limit the possibility of rotor unbalance detection. This was confirmed by the tests of both the motor with one pair of poles and with two pairs of poles. Unfortunately, the changes in the amplitudes characteristic of unbalance symptoms occurring in the bispectrum and also in the stator current spectrum were insignificant (at the level of about 1–5 dB), which was why the recommended tool is the analysis of the mechanical vibration acceleration (the change of the amplitudes of characteristic symptoms at the level of about 10–20 dB). The extension of the registration time of the stator current to 10 s, does not improve the process efficiency of rotor balance detection.
Rotor unbalance modeled using a test mass mounted directly on the rotor can also be detected using the bispectrum analysis and the fast Fourier transform of the stator current and mechanical vibration acceleration. The research also demonstrated that in this case, it is more beneficial to analyze the vibration acceleration signal.
The conducted research showed that rotor unbalance can be detected even if the rotational frequency of the rotor is only 10 Hz. Moreover, the fault modeling method, i.e., the place where the test mass is fixed (directly on the rotor or on a specially prepared disc) does not adversely influence the process of unbalance detection.
On the basis of the conducted analyses, it can be stated that the vibration acceleration signal is a better information carrier in the case of rotor unbalance than the stator current signal. The changes in the amplitudes characteristic of unbalance symptoms occurring in the mechanical vibration analysis are a few or sometimes even more than a dozen times higher than those observed in the stator current analysis. Therefore, the analysis of the mechanical vibration signal is a better solution in the detection of rotor unbalance.

Funding

This research was partly supported by statutory funds of the Department of Electrical Machines, Drives and Measurements of the Wroclaw University of Science and Technology (2020) and by the National Science Centre Poland under grant number 2017/27/B/ST7/00816.

Conflicts of Interest

The author declares no conflict of interest.

Appendix A

Table A1. The nominal parameters of used induction motors.
ParametersType of Motor
Sh90L-4 CELMA INDUKTAShR90-2S BESEL–BRZEG
Rated output PN (kW)1.51.5
Rated voltage UN (V)230∆/400Y220∆/380Y
Frequency fN (Hz)5050
Speed nN (RPM)14102820
Efficiency ηN (%)79-
Power factor cos ϕN (–)0.780.84
Rated current IN (A)6.1/3.55.9/3.4
Number of pole pairs (–)21

References

  1. Almeida, A.T.d; Ferreira, F.J.T.E.; Fong, J.; Fonseca, P. EUP Lot 11 Motors; Final Report; University of Coimbra: Coimbra, Portugal, 2008. [Google Scholar]
  2. Rassõlkin, A.; Belahcen, A.; Kallaste, A.; Vaimann, T.; Lukichev, D.V.; Orlova, S.; Heidari, H.; Asad, B.; Acedo, J.P. Life cycle analysis of electrical motor-drive system based on electrical machine type. In Proceedings of the Estonian Academy of Sciences; Estonian Academy Publishers: Liivalaia, Tallinn Estonia, 2020; Volume 69, pp. 162–177. [Google Scholar]
  3. Rotating Electrical Machines—Part 30-1: Efficiency Classes of Line Operated AC Motors (IE Code). IEC 60034-30-1:2014, 3 June 2014.
  4. Siddiqui, K.M.; Sahay, K.; Giri, V.K. Health Monitoring and Fault Diagnosis in Induction Motor- A Review; (An ISO 3297: 2007 Certified Organization). Int. J. Adv. Res. Electr. Electron. Instrum. Eng. 2014, 3, 6549–6565. [Google Scholar]
  5. Choudhary, A.; Goyal, D.; Shimi, S.L.; Akula, A. Condition Monitoring and Fault Diagnosis of Induction Motors: A Review. Arch. Comput. Methods Eng. 2018, 26, 1221–1238. [Google Scholar] [CrossRef]
  6. Salah, M.; Bacha, K.; Chaari, A. Comparative investigation of diagnosis media for induction machine mechanical unbalance fault. ISA Trans. 2013, 52, 888–899. [Google Scholar] [CrossRef] [PubMed]
  7. Hang, J.; Zhang, J.; Cheng, M.; Wang, Z. Fault diagnosis of mechanical unbalance for permanent magnet synchronous motor drive system under nonstationary condition. In Proceedings of the 2013 IEEE Energy Conversion Congress and Exposition, Denver, CO, USA, 15–19 September 2013; pp. 3556–3562. [Google Scholar] [CrossRef]
  8. Rahman, M.; Uddin, M.N. Online Unbalanced Rotor Fault Detection of an IM Drive Based on Both Time and Frequency Domain Analyses. IEEE Trans. Ind. Appl. 2017, 53, 4087–4096. [Google Scholar] [CrossRef]
  9. Niu, G. Data-Driven Technology for Engineering Systems Health Management. Design Approach, Feature Construction, Fault Diagnosis, Prognosis, Fusion and Decisions; Springer: Beijing, China, 2017. [Google Scholar] [CrossRef]
  10. MacCamhaoil, M. Static and dynamic balancing of rigid rotors. Bruel&Kjaer 2016, 1–20, (Application note BO 0276-12). Available online: https://www.yumpu.com/en/document/read/7936761/static-and-dynamic-balancing-of-rigid-rotors (accessed on 9 June 2020).
  11. Hassan, M.A.; Coats, D.; Gouda, K.; Shin, Y.-J.; Bayoumi, A. Analysis of nonlinear vibration-interaction using higher order spectra to diagnose aerospace system faults. In Proceedings of the 2012 IEEE Aerospace Conference, Big Sky, MT, USA, 3–10 March 2012; pp. 1–8. [Google Scholar]
  12. Silva, R.R.D.; Costa, E.D.S.; Oliveira, R.C.L.D.; Mesquita, A.L.A. Fault diagnosis in rotating machine using full spectrum of vibration and fuzzy logic. J. Eng. Sci. Technol. 2017, 12, 2952–2964. [Google Scholar]
  13. Korkua, S.; Jain, H.; Lee, W.; Kwan, C. Wireless health monitoring system for vibration detection of induction motors. In Proceedings of the Conference Record Industrial and Commercial Power Systems Technical Conference 1993, St. Petersburg, FL, USA, 9–13 May 2010; pp. 1–6. [Google Scholar]
  14. Yamamoto, G.K.; da Costa, C.; da Silva, J.S. A smart experimental setup for vibration measurement and imbalance fault detection in rotating machinery. Case Stud. Mech. Syst. Signal Process. 2016, 4, 8–18. [Google Scholar] [CrossRef] [Green Version]
  15. Ibn Shamsah, S.M.; Sinha, J.K. Rotor Unbalance Estimation with Reduced Number of Sensors. Machines 2016, 4, 19. [Google Scholar] [CrossRef] [Green Version]
  16. Vaimann, T.; Sobra, J.; Belahcen, A.; Rassõlkin, A.; Rolak, M.; Kallaste, A. Induction machine fault detection using smartphone recorded audible noise. IET Sci. Meas. Technol. 2018, 12, 554–560. [Google Scholar] [CrossRef] [Green Version]
  17. Glowacz, A. Recognition of Acoustic Signals of Commutator Motors. Appl. Sci. 2018, 8, 2630. [Google Scholar] [CrossRef] [Green Version]
  18. Garcia-Ramirez, A.G.; Morales-Hernandez, L.A.; Osornio-Rios, R.A.; Benitez-Rangel, J.P.; Garcia-Perez, A.; Romero-Troncoso, R.D.J. Fault detection in induction motors and the impact on the kinematic chain through thermographic analysis. Electr. Power Syst. Res. 2014, 114, 1–9. [Google Scholar] [CrossRef]
  19. Boudiaf, M.; Cherroun, L.; BenBrika, M. Real-time diagnosis of three-phase induction machine using Arduino-Uno card based on park’s circle method. Diagnostyka 2018, 19, 63–71. [Google Scholar] [CrossRef]
  20. Huang, S.-R.; Huang, K.-H.; Chao, K.-H.; Chiang, W.-T. Fault analysis and diagnosis system for induction motors. Comput. Electr. Eng. 2016, 54, 195–209. [Google Scholar] [CrossRef]
  21. Lee, J.-H.; Pack, J.-H.; Lee, I.-S. Fault Diagnosis of Induction Motor Using Convolutional Neural Network. Appl. Sci. 2019, 9, 2950. [Google Scholar] [CrossRef] [Green Version]
  22. Wolkiewicz, M.; Skowron, M. Diagnostic System for Induction Motor Stator Winding Faults Based on Axial Flux. Power Electronics Drives 2017, 2, 137–150. [Google Scholar] [CrossRef]
  23. Pesch, A.H.; Scavelli, P.N. Condition Monitoring of Active Magnetic Bearings on the Internet of Things. Actuators 2019, 8, 17. [Google Scholar] [CrossRef] [Green Version]
  24. Gomaa, F.R.; Khader, K.M.; Eissa, M.A. Fault Diagnosis of Rotating Machinery based on vibration analysis. Int. J. Adv. Eng. Glob. Technol. 2016, 4, 1571–1586. [Google Scholar]
  25. Zhang, M.; Wang, T.; Tang, T.; Benbouzid, M.; Diallo, D. An imbalance fault detection method based on data normalization and EMD for marine current turbines. ISA Trans. 2017, 68, 302–312. [Google Scholar] [CrossRef]
  26. Mohammadi, E.; Fadaeinedjad, R.; Moschopoulos, G. Performance Investigation of a Stall-Regulated Wind Turbine Considering Rotor Imbalance Faults. In Proceedings of the IECON 2019-45th Annual Conference of the IEEE Industrial Electronics Society, Lisbon, Portugal, 14–17 October 2019; Volume 1, pp. 2469–2474. [Google Scholar]
  27. Mendel, J.M. Tutorial on higher-order statistics (spectra) in signal processing and system theory: Theoretical results and some applications. Proc. IEEE 1991, 79, 278–305. [Google Scholar] [CrossRef]
  28. Benbouzid, M.E.H. A review of induction motors signature analysis as a medium for faults detection. IEEE Trans. Ind. Electron. 2000, 47, 984–993. [Google Scholar] [CrossRef] [Green Version]
  29. Saidi, L. The deterministic bispectrum of coupled harmonic random signals and its application to rotor faults diagnosis considering noise immunity. Appl. Acoust. 2017, 122, 72–87. [Google Scholar] [CrossRef]
  30. Sun, L.; Feng, Z.; Lu, N.; Wang, B.; Zhang, W. An advanced bispectrum features for EEG-based motor imagery classification. Expert Syst. Appl. 2019, 131, 9–19. [Google Scholar] [CrossRef]
  31. Chow, W.S.; Fei, G. Three phase induction machines asymmetrical faults identification using bispectrum. IEEE Trans. Energy Convers. 1995, 10, 688–693. [Google Scholar] [CrossRef]
  32. Matsuoka, T.; Ulrych, T.J. Phase estimation using the bispectrum. Proc. IEEE 1984, 72, 1403–1411. [Google Scholar] [CrossRef]
  33. Yang, D.-M.; Stronach, A.F.; MacConnell, P.; Penman, J. Third-Order Spectral Techniques for the Diagnosis of Motor Bearing Condition Using Artificial Neural Networks. Mech. Syst. Signal Process. 2002, 16, 391–411. [Google Scholar] [CrossRef]
Figure 1. Graphic presentation of rotor unbalance.
Energies 13 03009 g001
Figure 2. Flow chart of the bispectrum algorithm.
Energies 13 03009 g002
Figure 3. Symmetry areas and the principal domain of the bispectrum.
Energies 13 03009 g003
Figure 4. Experimental set-up for the rotor unbalance tests: (a) the Sh90L-4 motor, INDUKTA, with a fixed disc (Case No. 1), (b) the ShR90-2S type motor, BESEL, with a fixed disc (Case No. 2), (c) the front view unbalance modeling disc and (d) the rotor of the Sh90L-4 type motor with a test mass (Case No. 3).
Energies 13 03009 g004
Figure 5. Fast Fourier transform (FFT) analysis of the stator current of the motor with: (a) a balanced rotor, and (b) a mounted test mass m = 16.26 g, radius R4 = 135 mm and angle 80°.
Energies 13 03009 g005
Figure 6. FFT analysis of the mechanical vibration for a motor with: (a) a balanced rotor, and (b) a mounted test mass m = 16.26 g radius R4 = 135 mm and angle 80°.
Energies 13 03009 g006
Figure 7. Three-dimensional (3D) and 2D bispectra of the stator current for motor with: (a) a balanced rotor and test mass mounted radii of (b) R1 = 78,75 mm and (c) R4 = 135 mm.
Energies 13 03009 g007
Figure 8. Three-dimensional and 2D bispectra of the mechanical vibration for a motor with: (a) a balanced rotor and test mass mounted radii of (b) R1 = 78.75 mm and (c) R4 = 135 mm.
Energies 13 03009 g008
Figure 9. Influence of the change in the registration time of the stator current on the bispectrum analysis result: (a) t = 1 s, (b) t = 10 s, and the fast Fourier transform: (c) t = 1 s, (d) t = 10 s.
Energies 13 03009 g009
Figure 10. Influence of the change in the registration time of the mechanical vibration on the bispectrum analysis results: (a) t = 1 s, (b) t = 10 s, and the fast Fourier transform: (c) t = 1 s, (d) t = 10 s.
Energies 13 03009 g010
Figure 11. Collation of the bispectrum analysis and fast Fourier transform for the stator current of the motor with one pair of poles supplied by a frequency converter, 10 Hz frequency.
Energies 13 03009 g011
Figure 12. Collation of the bispectrum analysis and fast Fourier transform for the stator current of the motor with one pair of poles supplied by a frequency converter, 25 Hz frequency.
Energies 13 03009 g012
Figure 13. Collation of the bispectrum analysis and fast Fourier transform of the mechanical vibration acceleration for a motor with one pair of poles Collation of the bispectrum analysis and fast Fourier transform of the mechanical vibration acceleration for a motor with one pair of poles, supplied by a frequency converter, 10 Hz frequency.
Energies 13 03009 g013
Figure 14. Collation of the bispectrum analysis and fast Fourier transform of the mechanical vibration acceleration for a motor with one pair of poles Collation of the bispectrum analysis and fast Fourier transform of the mechanical vibration acceleration for a motor with one pair of poles, supplied by a frequency converter, 25 Hz frequency.
Energies 13 03009 g014
Figure 15. Collation of the bispectrum analysis and fast Fourier transform of the stator current of the motor with two pairs of poles supplied by a frequency converter (registration time 1 s). The test mass is (a) 2.32 g; (b) 6.45 g.
Energies 13 03009 g015
Figure 16. Collation of the bispectrum analysis and fast Fourier transform of the mechanical vibration acceleration for the motor with two pairs of poles supplied by a frequency converter (registration time 1 s). The test mass is (a) 2.32 g; (b) 6.45 g.
Energies 13 03009 g016

