Article

Enhanced Cooling of LED Filament Bulbs Using an Embedded Tri-Needle/Ring Ionic Wind Device

1
School of Mechanical Science and Engineering, Huazhong University of Science and Technology, Wuhan 430074, China
2
School of Power and Mechanical Engineering, Wuhan University, Wuhan 430072, China
3
Accelink Technologies Co. Ltd., Wuhan 430205, China
4
Shenzhen Institutes of Advanced Technology, University of Chinese Academy of Sciences, Shenzhen 518055, China
5
Institute of Technological Sciences, Wuhan University, Wuhan 430072, China
*
Author to whom correspondence should be addressed.
Energies 2020, 13(11), 3008; https://doi.org/10.3390/en13113008
Submission received: 19 May 2020 / Revised: 8 June 2020 / Accepted: 10 June 2020 / Published: 11 June 2020
(This article belongs to the Special Issue Experimental Heat Transfer in Energy Systems)

Abstract

:
Improving the heat dissipation ability for light-emitting diode (LED) filament bulb is very difficult. A tri-needle/ring ionic wind generator was developed to improve the heat dissipation condition of bulbs. The operation characteristics of the ionic wind generator, such as the electrode gap, inception voltage, and discharge current with regard to the operation voltage, were studied by experiments. The ionic wind velocity within the bulb was investigated under different electrode gaps and applied voltages. The temperature drop achieved by the ionic was were tested with the consideration of many operation parameters for analysis. The experiments showed that ionic wind can provide efficient and stable cooling effect for LED filament bulbs. The temperature drop of LED junction can reach 30 °C at best. Good stability and adjustability of the ionic wind generator were demonstrated by tracing the temperature history of LED filaments in long-term tests. Finally, the light efficiency of LED filament bulbs with ionic wind cooling was studied. The experimental results showed that light efficiency was improved by 7.3% under the best cooling case. The experimental results indicate that the embedded ionic wind generator can provide an effective solution for cooling LED filament bulbs.

Graphical Abstract

1. Introduction

Heat dissipation is critical for light emitting diode (LED) in many applications. High junction temperature can reduce the luminous efficiency, reliability, and operation life of LEDs [1]. There has been many methods developed to improve the cooling effect of LEDs in both industries and academics in order to overcome the adverse effects of poor thermal performance [2]. Adopting materials with good heat conductivity, heat sink and a rotary fan are the common methods for LED cooling [3,4]. Moreover, ionic wind has been investigated on its effort on heat exchange enhancement for decades and in recent years the research on LED cooling using ionic wind is increasing [5,6]. The ionic wind is produced by corona discharge if high voltage is applied on electrodes with a great deal of difference in curvature. Air molecules close to the electrode with smaller curvature radius are ionized into charged ions. The produced ions are accelerated in the electric field and transfer their momentum to air molecules by collision. The induced secondary flow is called ionic wind [7]. According to the electrohydrodynamic characteristics, ionic wind has been widely used in electrostatic precipitation, electrostatic driving [8], and water treatment. Ionic wind shows great potential as a competitive method for LED cooling due to the advantages of low power consumption, simple and reliable structure, low noise and fast response [9].
Chen et al. [10,11] used ionic wind to augment cooling of LED. The experimental results showed that the electrode gap and applied voltage were the key factors affecting the cooling results. Curvature radius of electrode could influence the operation range of applied voltage, while its influence on cooling performance is minimal. Zhang et al. [12,13,14] studied the flow characteristics of ionic wind produced by different electrode arrangements by experiments and numerical simulation. The results proved that the cooling performance of ionic wind had a strong relationship with the ionic wind velocity. Shin et al. [15,16] used ionic wind to cool the LED chip that was attached on a heat sink. The cooling effect of heat sink under ionic wind was better than heat sink working only in natural convection state and the increase ratio was computed to study the cooling effect. Wang et al. [17,18] developed ionic wind solid-state fan for LED cooling. The multiple needles to mesh electrode arrangement is adopted as the ionic generator. Optimizing the arrangement of multiple needle electrodes could increase the cooling effect of ionic wind. The corrosion of electrodes was found to affect the working durability of the fan and the influence could be reduced by coating CNT and MnO2 on the electrodes. The work mentioned above is the typical work published on LED cooling while using ionic wind in recent years. Although the researches focus on different aspects, the operation voltage of ionic wind can be seen as the most important parameter for cooling. Larger voltage being applied on the electrode can generate higher speed ionic wind for cooling. The LED chip used for studying the cooling effect of ionic wind was attached on a substrate or a heat sink. The easiest way to increase the operation voltage of ionic wind generator is increasing the electrode gap.
However, although there are many researches on ionic wind cooling of LED, the researches on cooling of LED filament bulb using ionic wind are few. For LED filament bulb, the filament is made up of small LED chips and a narrow strip on which the small LED chips are mounted. Filament is coated by silicone and light is emitted from all area of the transparent bulb. Good appearance and nearly 360 degrees light angle make LED filament bulb become a compelling lighting product [19]. The main application occasion of LED filament is indoor illumination to replace the traditional incandescent bulb. That means the LED filament bulb must show some advantages, such as operation life, light efficiency, reliability, and energy consumption as compared with incandescent bulb. As known to all, those advantages mentioned cannot be realized without good the cooling effect of the LED. Therefore, the cooling effect is a very important indicator for choosing or evaluating the property of LED [20,21]. However, poor thermal dissipation condition limits the development of LED filament bulb. The LED filament itself is in a closed transparent bulb without heat sink. The heat that is generated by the LED chips packaged in the filament is difficult to be transferred from the inner space of the bulb to the external environment. Being limited by the structure, the heat management solution that is feasible for choosing is less than the solution used for traditional LED module working in an open environment [22]. Thus, the power of LED filament bulb on the market is low and the product reliability is not very good. Industries and research institutions have developed many methods for improving the thermal performance of LED filament bulb. Feng et al. [23] studied the influences of different filling gases and filament substrates on thermal performance of LED filament bulb. Filling helium in the bulb could dramatically reduce the average junction temperature by more than 50 °C as compared with air and nitrogen. Adopting perforated copper as filament substrate could also reduce the average junction temperature by more than 20 °C when compared with glass. However, these methods increase the fabrication cost. The gas leak from the bulb to the external environment can also affect the effect of filling helium in the bulb. Liu et al. [24] studied the effects of bulb size, filament size, and shape of filament substrate on heat dissipation condition of LED filament bulb by theoretical analysis, and found that increasing bulb and filament size could reduce the temperature of the LED filament bulb. There are also some problems that are caused by increasing the size of bulb and filament. The light extraction efficiency of the LED is reduced with thicker glass bulb and phosphor layer and the weight of the bulb is also increased. Wang et al. [25] investigated the thermal features of LED filament bulb by comparing the junction temperature of filaments with different shapes. The optical and thermal performances of LED filament bulb with vertical arrangement were better than that of horizontal filament arrangement. The increased manufacturing difficulty need to be considered by the industries despite the advantages brought by improving the filament arrangement. Wang et al. [26] also presented another work to investigate the heat performance of LED filament bulb with different shapes. The stretching height of the filament is treated as the main study object. The experiment results showed that increasing the stretching height could reduce the junction temperature of LED filament, but the improvement is not significant. Besides, when the stretching height is too large, the junction temperature began to rise. That means the method to improve the heat performance of LED filament by optimizing the shape has limits. Xu et al. [27] employed ionic wind to cool LED filament bulb. The needle and mesh electrode arrangement was installed in a rubber tube that was connected with the inner space of the bulb. Ionic wind blew into the bulb through the tube and reduced the junction temperature of bulb. However, the existence of the tube affected the appearance and light angle of bulb. Luo et al. [28] improved the structure of the bulb to obtain a good cooling effect of LED bulb. The conical radiator made of aluminum is fixed near the bulb holder. The heat within the bulb can be transferred to the external environment through the radiator. The heat dissipation ability could meet the requirement of a 16 watts LED bulb, but the appearance of the bulb was changed. The light angle was less than 360 degrees. The similar work was carried out by Petroski et al. [29] to cool LED bulb. The shape of the annular chimney radiator fixed in the bulb was optimized. The open area in the chimney could enhance the heat transfer from the LED to the environment. However, the improvement brought up by an open style chimney was achieved at the expense of a closed environment, which can affect the reliability of the LED. Jang et al. [30] studied the influence of radiator orientation on the heat performance of LED bulb. The inclination angle relative to the axis of the bulb was studied to investigate its influence on heat transfer. The core concept of the study was to change the air flow near the radiator to influence the heat convection condition. The cooling effect achieved was relatively good, but, meanwhile, the application range of the method is restricted. If the orientation of the bulb is changed to not vertically downward, the cooling effect of the designed radiator would be reduced. At present, the method of using heat sink to enhance the heat dissipation of LED bulb through increasing the heat transferred by conduction indeed achieved fairly good results. Meanwhile, the weight and dimension of the bulb were increased. The light angle was affected by the radiator that weakened the original advantages of LED bulb on lighting effects. The adverse factors restrict its application in LED bulb while using filaments as light source. Yang et al. [31] developed a new kind of silicone resin that is used for filament packaging. The transparent resin showed high thermal stability, even the temperature is more than 300 °C. Theoretically, the luminousness of the bulb can be increased, which reduces the heat that is produced by light absorbing. The researchers can provide more useful information regarding the thermal performance of the filament packaging if they carried out some studies on measuring the junction temperature of the LED filament.
When considering maintaining the specialty of LED filament bulb and pursuing good heat dissipation performance as well, we employ an ionic wind generator that is installed within the bulb for LED filament bulb cooling. The electrode arrangement producing ionic wind consists of three needles and a ring electrode. The ionic wind can strengthen the air flow inside the bulb and enhance the heat exchange between the LED filament and the air. The velocity of ionic wind that is generated within the bulb is investigated. The relationship between the junction temperature of LED filament and the excitation voltage of ionic wind is studied in order to evaluate the heat dissipation ability of the installed ionic wind generator. The influence of the gap between the needle and ring electrode on heat dissipation ability is discussed. The change of bulb’s luminous efficiency under ionic wind is also studied. The ionic wind can achieve a maximum temperature drop that is approximately 30 °C. Good stability and adjustability of the ionic wind generator on LED cooling are confirmed by investigating the cooling performance of ionic wind in long-term tests. This work shows the potential of ionic wind for enhancing heat dissipation ability of LED filament bulb and provides a new idea for the thermal management of LED filament bulb.

2. Materials and Methods

This section first presents the structure of the tri-needle/ring ionic wind device and the method for measuring ionic wind velocity within the bulb. Afterwards, the experimental setup for evaluating the heat dissipation ability of the tri-needle/ring ionic wind device is presented. The characteristics of the instruments used, environmental conditions, and operation conditions of ionic wind are introduced.

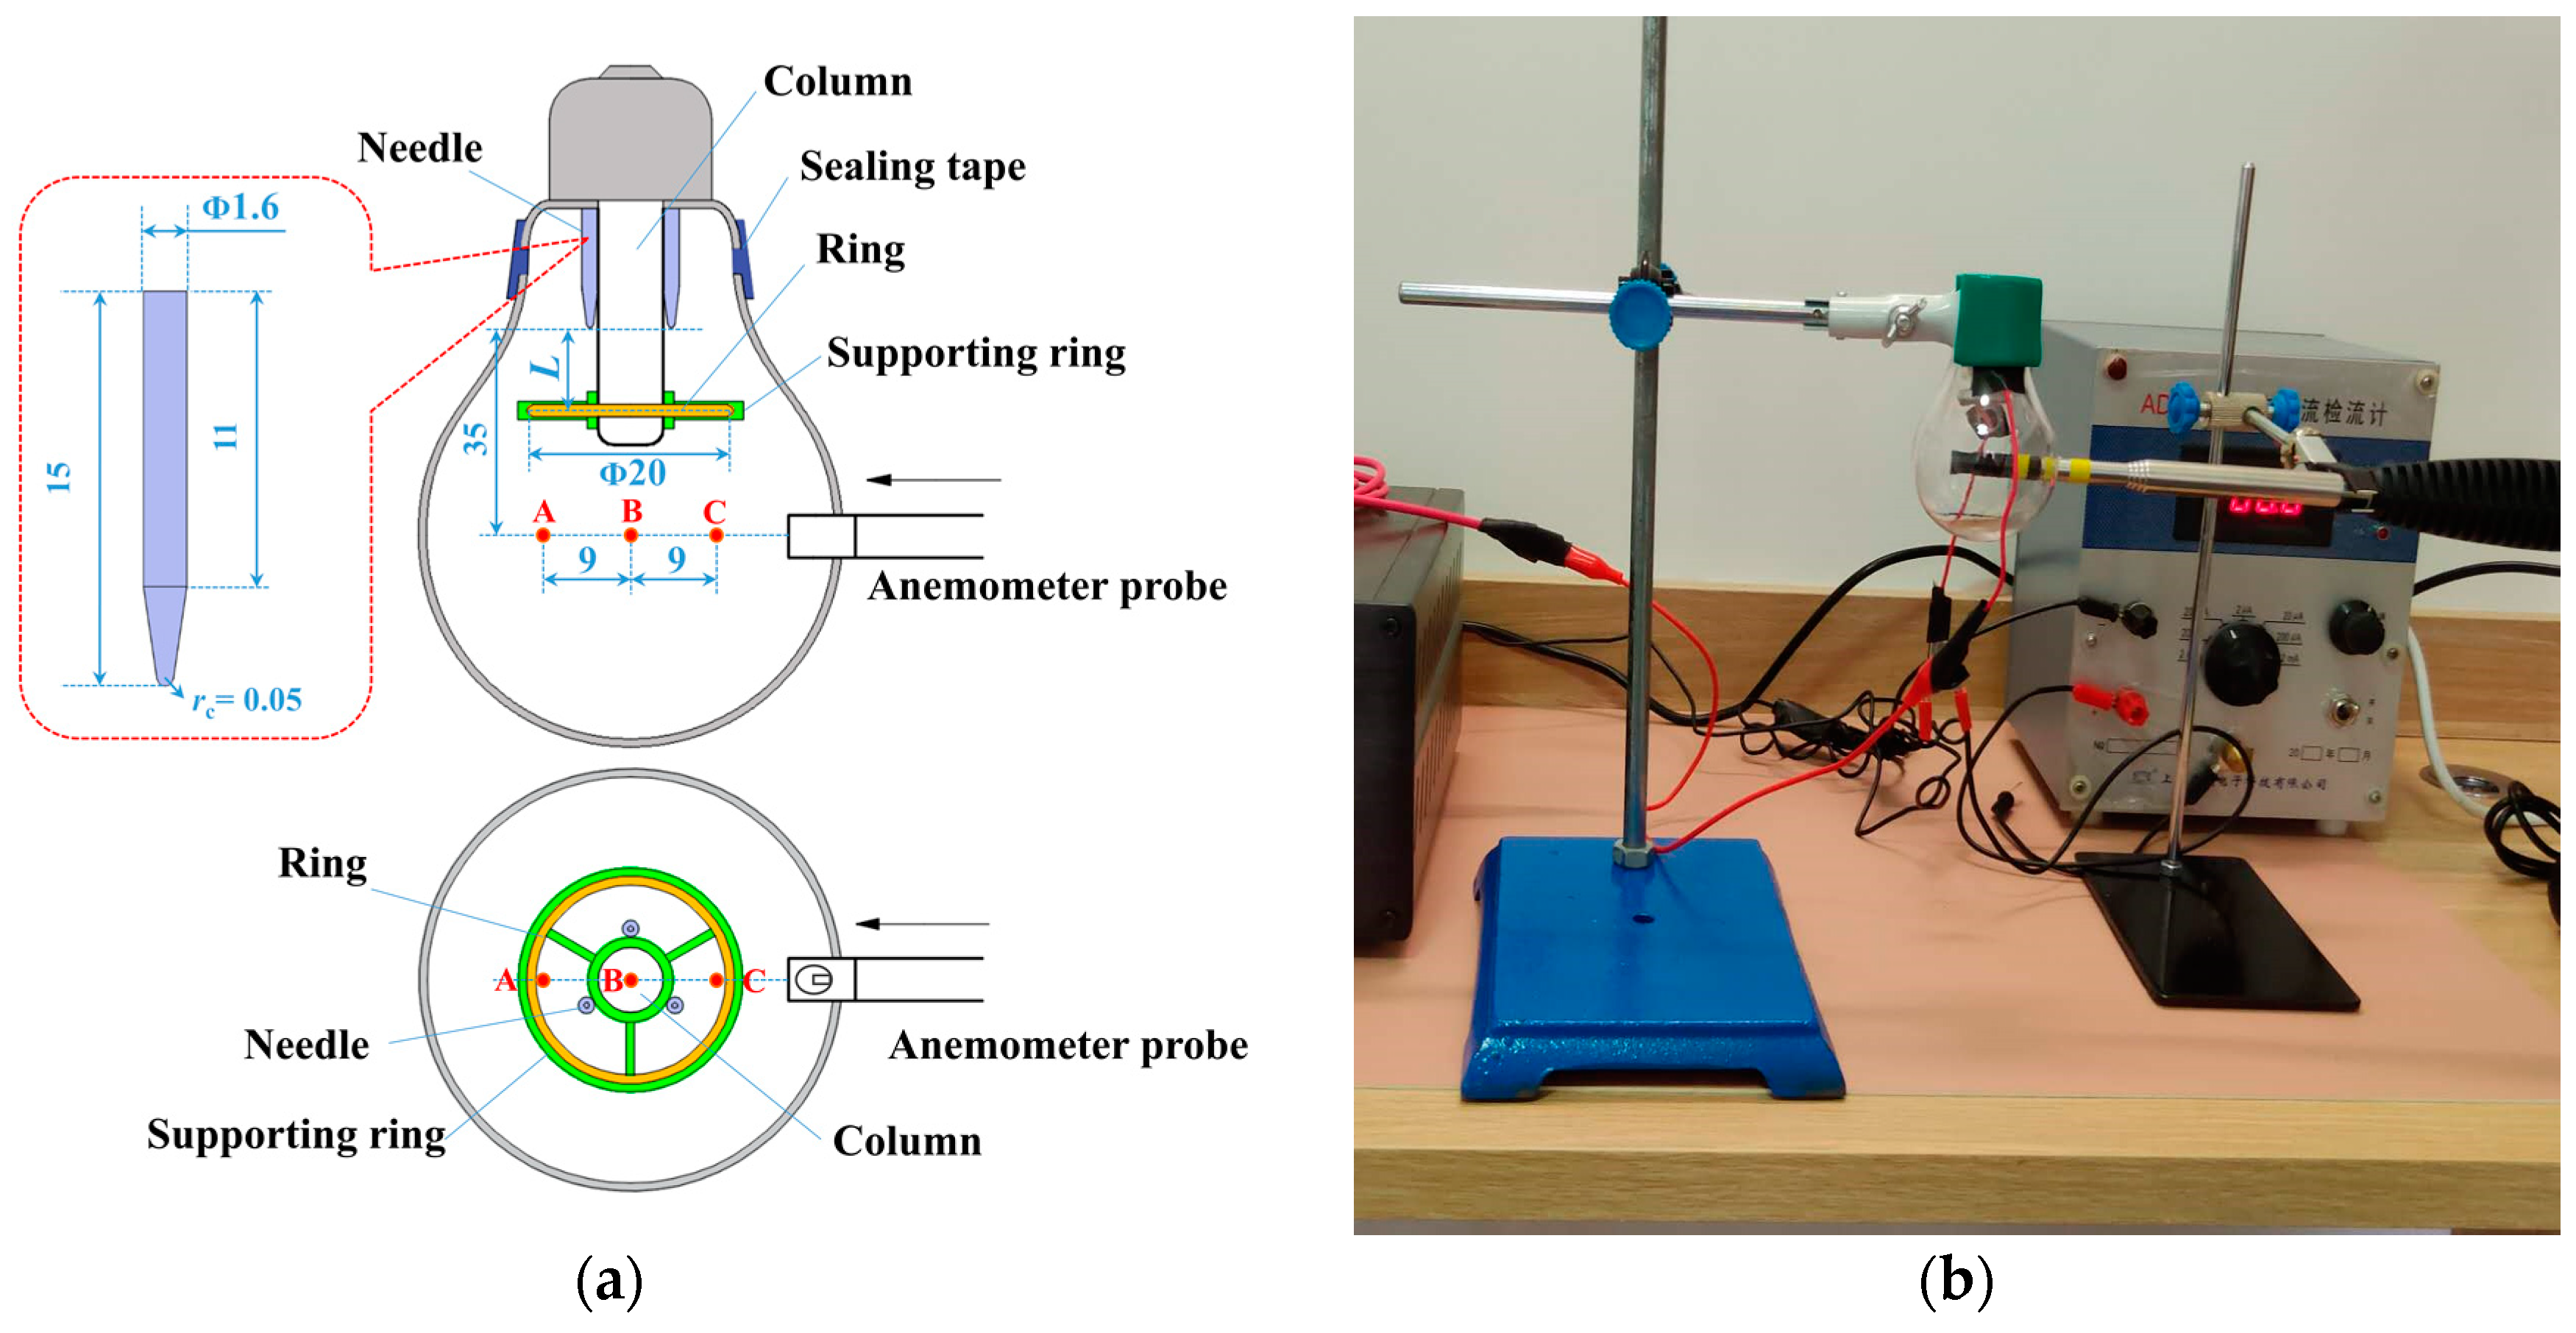
2.1. Tri-Needle/Ring Electrode Ionic Wind Device

Figure 1a shows the structure of the tri-needle/ring ionic wind device installed within an A60 polycarbonate (PC) resin bulb. A column that is made of insulating rubber is used as the bulb pole. The insulation rubber can maintain good insulation capacity if the applied voltage is no higher than 40 kV. Three tungsten needles are uniformly distributed around the column. Figure 1a shows the dimensions of the needle. The ring electrode is fixed on the other side of the column by a supporting ring made of PC which is also fixed on the column. The ring electrode is made of tin wire and the wire diameter is 2 mm. External diameter of the ring is 20 mm. Two holes near the lamb holder are drilled in the bulb for the electrical connection of the ionic electrodes the high voltage power supply. The holes are sealed with sealing tape to prevent the gas exchange between the bulb and the external environment. If the holes are not totally sealed, then the working space of LED filaments is not an enclosed space. Thus, the gas can flow outside from the inner space of the bulb, which makes the junction temperature lower. The inaccurate temperature value will lead to a higher heat dissipation performance than the real situation. The gap L represents the distance from the needle tip to the ring which is 6 mm, 10 mm, and 15 mm, respectively.
Aiming to investigate the velocity of the ionic wind within the bulb, a hole is drilled on the bulb for inserting the probe of hot wire anemometer. The gap between the probe and the needle electrode is 35 mm. The velocities of the three spots (A, B, C) that are shown in Figure 1a are measured. Figure 1b is the photograph of measuring the velocity in the bulb. The average velocity of the three spots is chosen to compare the velocity in the central region that is close to the filaments within the bulb.

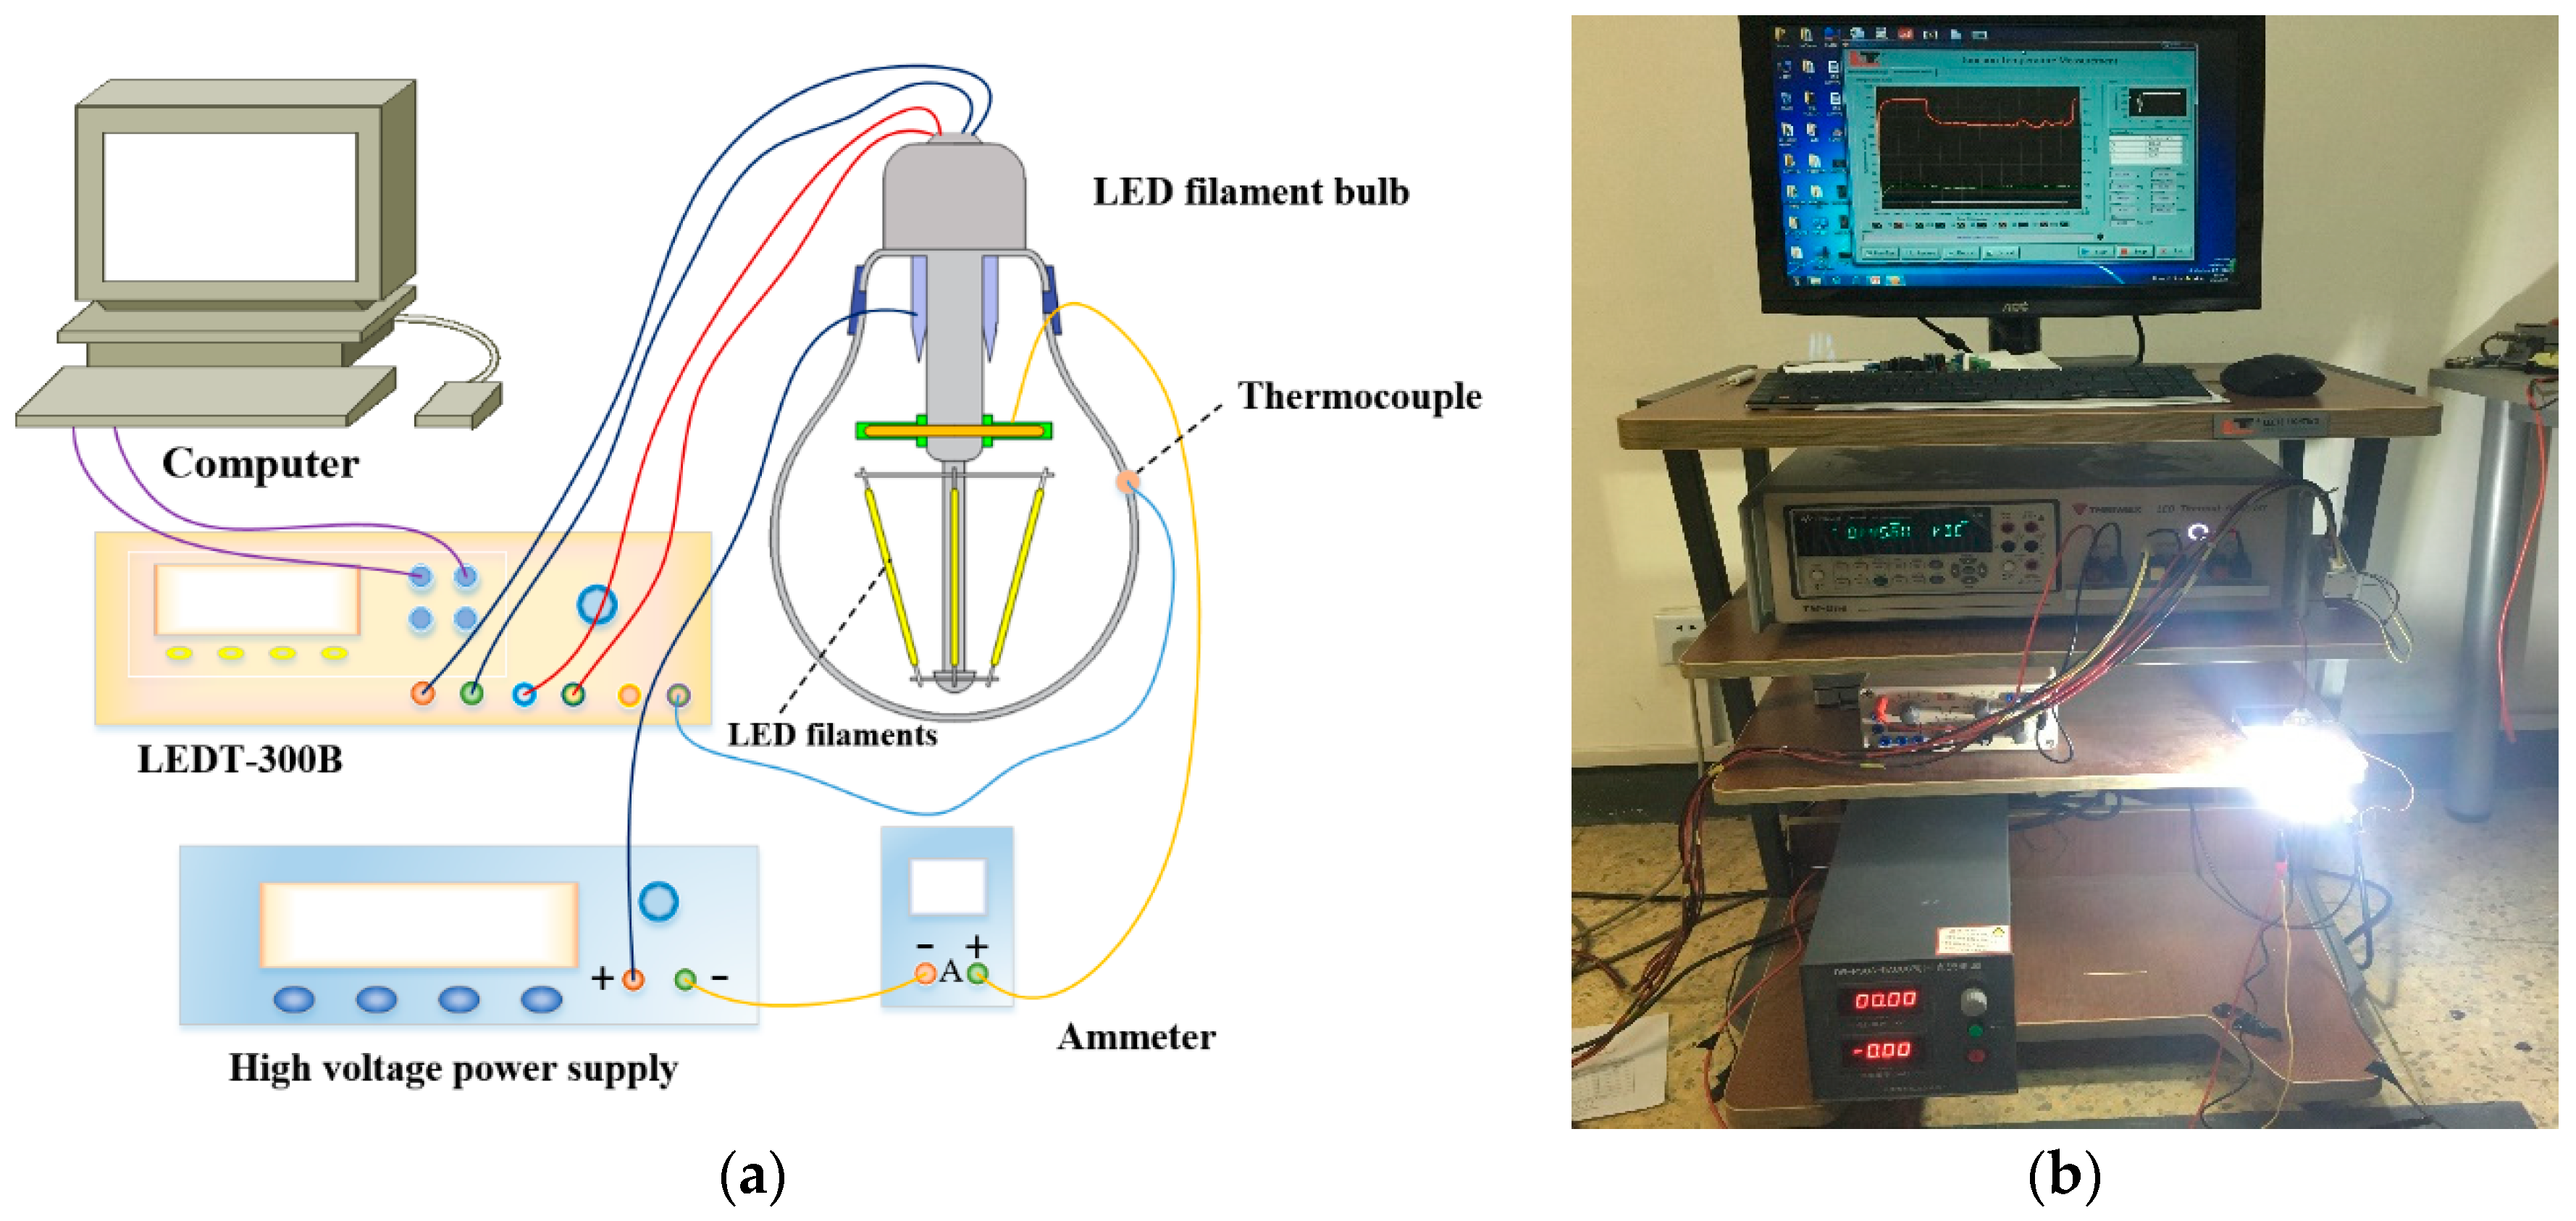
2.2. Experimental Setup for Measuring Junction Temperature of LED Filament Bulb

Figure 2a shows the system frame chart for measuring the junction temperature of LED filament bulb. The A60 LED filament bulb is brought from the market (brand: Jerad from Shenzhen Shanliang Lighting Co., Ltd.). There are six LED filaments in the bulb and the nominal power of the bulb is six watts. The operation current of the LED filaments is 30 mA. The glass bulb is replaced by a A60 polycarbonate (PC) resin bulb. Three tungsten needle electrodes are fixed on the bulb pole near the bulb holder and uniformly distributed around the bulb pole. The ring electrode is fixed on the bulb pole near the LED filaments. The geometrical sizes of the needle and ring electrodes, the gap L between the needle and the ring are the same as the parameters mentioned and shown in Figure 1a. Two holes are drilled in the PC bulb for the electrical connection of the ionic electrodes with the high voltage power supply. The needles and ring are connected to the positive pole and negative pole, respectively, by electric wire. The holes are sealed with sealing tape to prevent the gas exchange between the bulb and the external environment.
The junction temperature Tj of LED filaments is tested by the forward voltage method with the instrument LEDT-300B. The measurement is carried out in whole bulb test mode. Thus, the junction temperature measured represents the average temperature of all the LEDs in the filaments. A 30 mA current is exported to the LED filament bulb by LEDT-300B to make the bulb work. The forward voltage Vf of the LED filaments is measured in order to obtain the value of Tj when the bulb is working. A T-type thermocouple that is connected with LEDT-300B is attached on the outer surface of the bulb as a sensitive temperature reference point. The environmental temperature is also measured by the T-type thermocouple integrated in LEDT-300B. The discharge current of ionic wind is measured by ammeter. Figure 2b shows the photograph of measuring Tj. Besides, the light efficiency of the LED filament bulb working under ionic wind is also measured by a 300 mm integrating sphere. Detailed information on the instruments used in the tests are shown in Table 1. The measurement errors of the tests are analyzed in Appendix A.
The relationship between Vf and Tj of the LED filament bulb need to be calibrated first because Tj is measured by the forward voltage method. The LED filament bulb is placed in a temperature cycling chamber. The calibration temperature spots used for calibration are 40 °C, 69 °C, 97 °C, and 125 °C. The temperature in the chamber is kept at those temperature spots and Tj is measured by the thermocouple, which is located at the sensitive temperature reference point. A 1 mA calibration current is applied on the LED filaments for 5 ms and, meanwhile, Vf is measured. The calibration current is very small and the action time is very short, thus the thermal shock of calibration current on Tj can be ignored. Figure 3 shows the calibration results of Vf and Tj. Vf and Tj shows an approximate nonlinear relationship. The linear fitting result of the values of Tj and Vf is shown in Equation (1). The R2 correlation coefficient is 0.9997.
Vf = −0.0707Tj + 141.92

3. Results and Discussion

In this section, the current–voltage characteristics is studied, the velocity measurement results of generated ionic wind in the bulb with regard to various electrode distances are also discussed. The junction temperature of the bulb measured under various operation conditions of ionic wind are measured and the results are presented. The impact of operating condition on junction temperature reduction is then investigated. Afterwards, we also discuss the influence of ionic wind cooling on LED luminous efficiency.

3.1. Operating Characteristics of the Ionic Wind Device

Corona discharge can be motivated only if the applied voltage reaches a certain critical level, as illustrated in Figure 4 (i.e., corona inception voltage). The discharge is strengthened when increasing the voltage, which can be seen from the increase of the current. The operation range is within the range from the inception voltage and the breakdown voltage. In this range, it can be seen that there is an exponential relationship between the current and the voltage. If the voltages applied on the electrode are the same, the discharge current of ionic wind generated by smaller electrode gap is higher. The reason is that the electric intensity is higher if the distance between electrodes are smaller, Besides, the driving force of ions applied by the electric filed is strengthened, which also increases the ion mobility in the electric field. The combined actions of the factor result in a higher current. This phenomenon agrees with the results from most of other published studies [12,32].
The inception voltage is defined as the state when the discharge current is 1 μA in this study, which varies with the electrodes gap L, and is higher when L increases (Figure 4b). Generally, the ionic wind is generated within the range from between inception voltage and spark over voltage. The breakdown voltage is the critical voltage between corona discharge and spark over discharge. Once the operation voltage is higher than the break down voltage, the gas between the electrodes is strike through and the phenomenon of corona discharge can be very instable or even disappear [33]. The noise of gas spark over and big shock on the discharge current can appear when the breakdown happens. In the experiments for generating ionic wind, the voltage applied should be confined to the value below the breakdown voltage in order to avoid possible damage or negative influence of spark over. In fact, occasional breakdown could happen when the value of applied is very close to the critical voltage and the discharge shows a little instability. Thus, the breakdown voltage that is stated in this work is the maximum stable operation voltage of corona discharge in order to make sure that the experiments are carried out in stable conditions. The operating voltage applied is between the inception voltage and the maximum stable voltage, also widening with the electrodes gap increase, as in Figure 4b. The power consumption for generating ionic wind is determined by the operation voltage and operation current. The power consumption increases along with the increase of applied voltage. The maximum power consumption is decided by the electrode distance. When the electrode distance increases from 6 mm to 10 mm and 15 mm, the maximum power consumption increases from 0.36 watts to 1.13 watts and 2.21 watts, respectively.
The diameter of the anemometer probe is about 8 mm. The largest inner diameter of A60 PC resin bulb is 54 mm. The probe cannot be ignored when measuring the ionic wind velocity in the bulb, as shown in Figure 1b. Therefore, the influence of the probe’s existence in the bulb on the gas flow need to be considered. However, at present there is no feasible method to measure the true gas velocity inside the bulb without using probe. Therefore, the measurement error of the experimental uncertainty that is caused by the probe dimension is not considered in the analysis. Even so, the value measured by anemometer here can still be useful for figuring out the approximate velocity of the ionic wind within the bulb. The location of spot A and C shown in Figure 1a is the proximity area close to the geometric center of an LED filament, while spot B lies in the axis line of the bulb. Thus, the velocity of the three spots are measured and the average value of them is used to evaluate the ionic wind velocity near the middle area of the filaments.
The ionic wind velocity with regard to different operation voltage under three different needle-ring gaps, as in Figure 5. The value of velocity increases when the operation voltage applied is increased and the results shown are the same with the three electrode distances. The discharge is strengthened by higher voltage producing more ions in the space and higher electric intensity. Both results are beneficial for the generation of ionic wind. Consequently, ionic wind with higher velocity is achieved. In general, the measured velocity is lower with the same applied voltage when the electrode gap is larger. The results are consistent with the characteristics of ionic wind that is illustrated on the discussion about discharge current previously. However, there is little variation in the value of velocity measured when the electrode distance is 6 mm and 10 mm. In fact, it is hard to accurately measure by an anemometer if the wind velocity varies in low velocity range, since the difference of the velocity is so small, less than 0.02 m/s. Therefore, it is a reasonable explanation that this difference cannot be pointed out in allowable resolution in the present experiment condition. Moreover, related experimental uncertainty analysis is also carried out in Appendix A.

3.2. Cooling Performance of LED Filaments with Ionic Wind

Figure 6 shows the evolution of the junction temperature Tj when LED filaments is lighting under ionic wind at different electrode gaps of 6.0, 10.0, and 15.0 mm. In every test, after the LED filament is lit, the junction temperature rapidly rises to about 132.8 °C and remains constant (natural convection cooling at an ambient temperature of 27 °C). After approximately 30 min. of lighting, voltage is applied on electrodes to produce ionic wind for measuring the change of junction temperature of LED filaments. The junction temperature has not changed after turning on the ionic wind generator when the gap distance between electrodes is 6.0 mm under the applied voltage of 6.0 kV and 6.5 kV, as shown in Figure 6a. This is because the ion wind velocity is very small under this condition (in Figure 5), and there is no significant cooling effect from forced convection. As seen from Figure 6b, the cooling action of ionic wind on LED filaments begin to be obvious under the electrode gap of 10.0 mm. The minimum temperature reduction (ΔTj) is 5.6 °C, which increases with the increase of applied voltage, as illustrated in the insets of Figure 6b. Similar junction temperature evolution appears in the LED filaments with the electrode gap of 15.0 mm, as shown in Figure 6c. The junction temperature can drop as high as 30 °C, which is very effective. According to the results of junction temperature obtained by experiments, the value of distance between the electrodes need to be considered as the influence factor that has the largest impact on the operation characteristics of the ionic wind generator.
The cooling ability or heat dissipation effect is analyzed by the law put forward by Newton on heat transfer. The improvement of ionic wind on heat dissipation effect on LED filaments is analyzed and evaluated by the following two equations [33]:
Enhancement   factor   ξ = h ionic h free = T j , free T a T j , ionic T a
Enhancement   ratio   δ = h ionic h free h free × 100 %
where the parameters hfree and hionic are used to represent heat transfer coefficients in free convection condition and under ionic wind forced convection, respectively, and Tj,free and Tj,ionic are the corresponding temperature of LED junction in filaments, respectively. Ta is the environment temperature outside the bulb. Figure 7 shows that the enhancement factor and ratio vary with applied voltage under electrode gaps of 10.0 and 15.0 mm. The results that are shown in Figure 7 are visualized to present the improvement of heat transfer effect under different ionic wind operation voltage. At best, the enhancement factor and ratio reach 1.4 and 40% in the forced convection condition under ionic wind. As expected, the cooling effect is more significant than that in the free convection condition. However, as compared with the cooling performance obtained by ionic wind for cooling LED attached on heat sink, which is higher than 100%, even the best enhancement ratio 40% is relatively low. The main reason is that the working environment of ionic wind is a closed space. The heat transfer is restricted by the limited space.
We further test the system for a long time in order to investigate the feature about the stability and adjustability of ionic wind device. The results show the quite stable performance for the long-term operation and demonstrate the good stability in effectively cooling LED filaments, as presented in Figure 8a. In Figure 8b, three successive increases in applied voltage from 10.0 kV to 11.5 kV for 120 min. under the electrode gap of 15.0 mm, the temperature drops are consistent with that of Figure 6c. The obtained results show that the working condition of LED filament bulb is safe and reliable and that the optimized configuration of tri-needle/ring meets this demand. It should be noted that the ordinary lifespan of the LED filament is more than 3000 h, which is very long when compared with the experiments time which is just several hours. However, the experiments results that are shown in Figure 6 and Figure 8 are still indicative and show the potential of the ionic wind cooling solution.

3.3. Luminous Efficiency of LED Chips

The luminous properties of LED filament bulb under ionic wind are measured by an integrating sphere (ATA-1000, EVERFINE Corporation, Hangzhou, China). The accuracy of the integrating sphere is ±2%. As shown in Figure 9a,b, the electric power of the LED chips increases when the junction temperature is reduced. The experimental results are consistent with the working characteristics of LED chip. From Equation (1), we know that the forward voltage of LED shows a negative linear relationship with junction temperature. The operation current of LED is kept constant. Thus, the electric power of LED increases with regard to the reduced junction temperature. We can also find that the luminous power of LED increases with regard to the reduced junction temperature and the value increased is not less than that of electric power of LED. For electrode gap L, which is 10.0 mm, the luminous power of LED is increased by 0.05 watt when the operation voltage of ionic wind is 8 kV. For electrode gap L that is 15 mm, the value of luminous power is increased by 0.11 watt at best and the increase ratio is about 6%. As seen in Figure 9c,d, the luminous flux of LED filament bulb is also increased with regard to the reduced junction temperature. The luminous flux of LED filament bulb is about 548 lm when the bulb is working in original state that no ionic wind is produced within the bulb or the state that the cooling effect obtained by ionic wind is not obvious. The increase rate of luminous flux (δL) is approximately 4% at best for the electrode gap L is 10.0 mm. When the electrode gap is L is increased to 15.0 mm and the ionic wind operation voltage is 11.5 kV, the junction temperature drop gets to about 30 °C and the maximum increase ratio of luminous flux reaches 7.3%. The results that are shown in Figure 9 confirm that the light efficiency of the LED filament bulb is improved due to the cooling effect of ionic wind. The working characteristics of the LED filament bulb is stable. The values of operation current, the forward voltage, and luminous flux of the LED filament bulb are stable during the tests. There is no flicker happening when the operation voltage of ionic wind is within the operation range. The ionic wind seems have good compatibility with the bulb in the experiments in short time tests that last no longer than 2 h.

4. Conclusions

This paper investigates the cooling effect of ionic wind that is generated by tri-needle/ring electrodes on LED filament bulb. The operating characteristics of the ionic wind generator, such as the inception voltage of ionic wind, the discharge current, the operation voltage, and the velocity of ionic wind, are discussed according to the experiment results. The influences of electrode gap and operation voltage applied on the electrodes on heat dissipation ability of ionic wind are studied. At last, the light efficiency of the LED filament bulb under ionic wind is also studied. According to the experimental results discussed, several conclusions can are made:
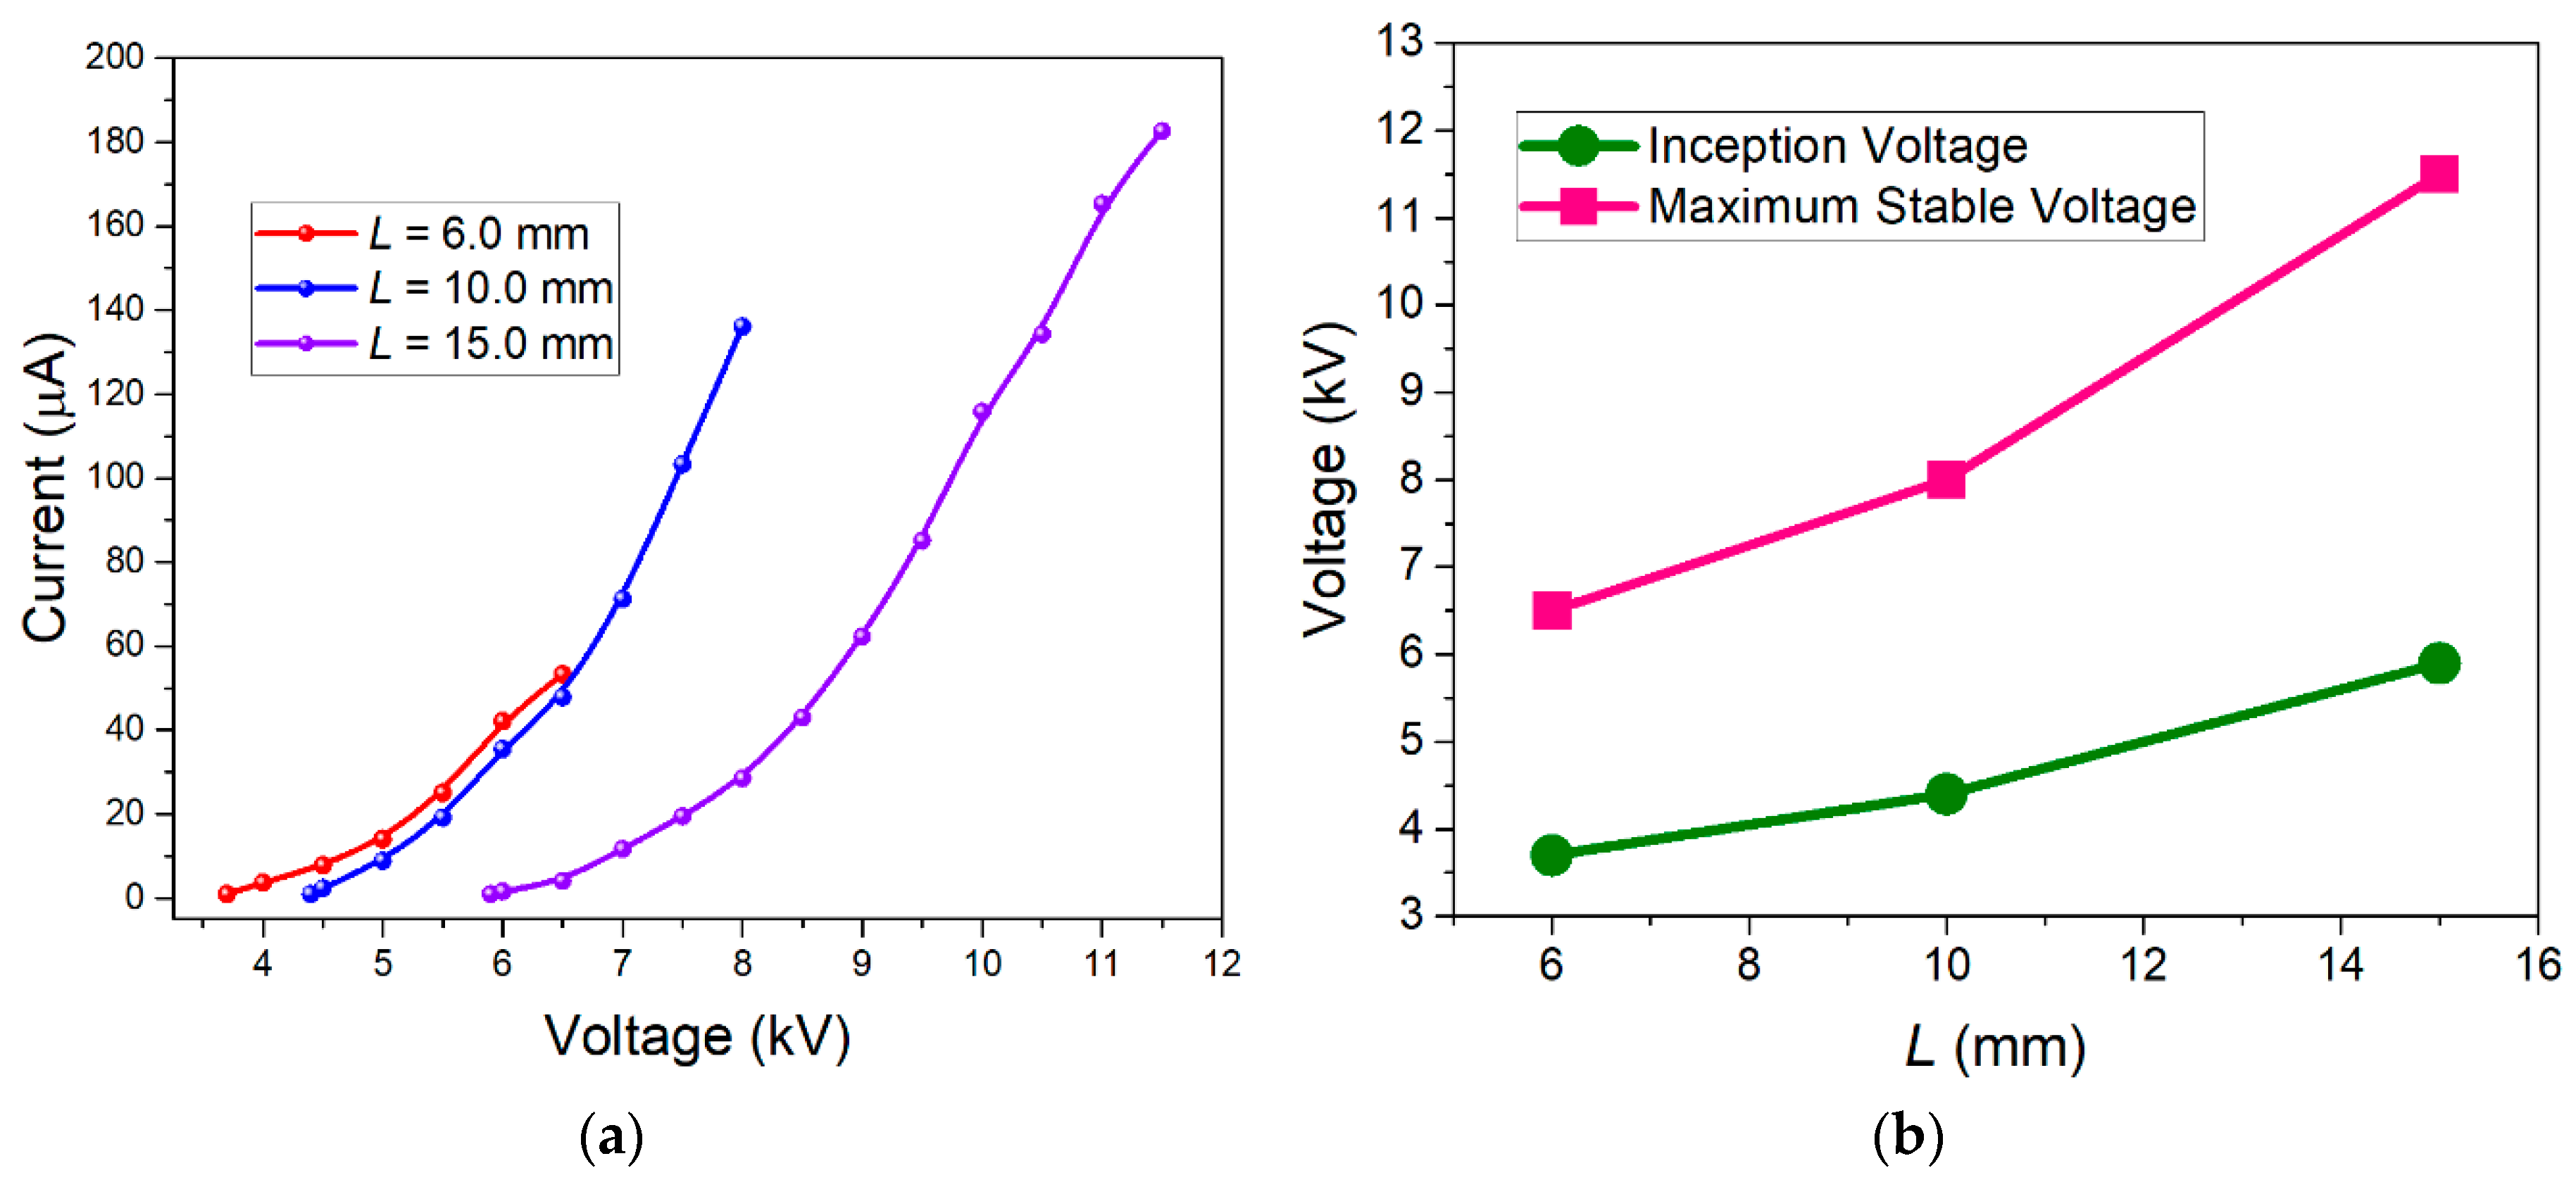
  • When voltage applied on electrodes is higher than the inception voltage, the current increases quickly when increasing the value of voltage. The inception voltage of ionic wind is increased if the electrode gap L increases. The ionic wind discharge current is increased with the addition of applied voltage. For the same voltage applied, the current is larger if the electrode gap is smaller. The larger electrode gap can also accommodate larger discharge current with higher voltage being applied.
  • It is found that ionic wind is strengthened by applying higher voltage. For the same voltage applied, the ionic wind velocity with a larger electrode gap is lower. However, a larger electrode gap can enlarge the range of ionic wind operation voltage and generate higher velocity ionic wind. The range of ionic wind operation voltage is increased from range [3.7 kV, 6.5 kV] to [5.9 kV, 11.9 kV] when the electrode gap is increased from 6.0 mm to 15.0 mm. The largest ionic wind velocity obtained when the electrode gap is 15.0 mm and the applied voltage is 11.5 kV.
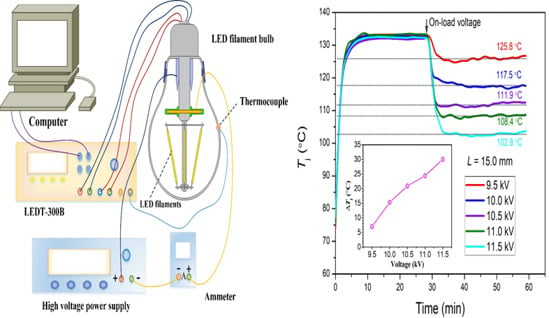
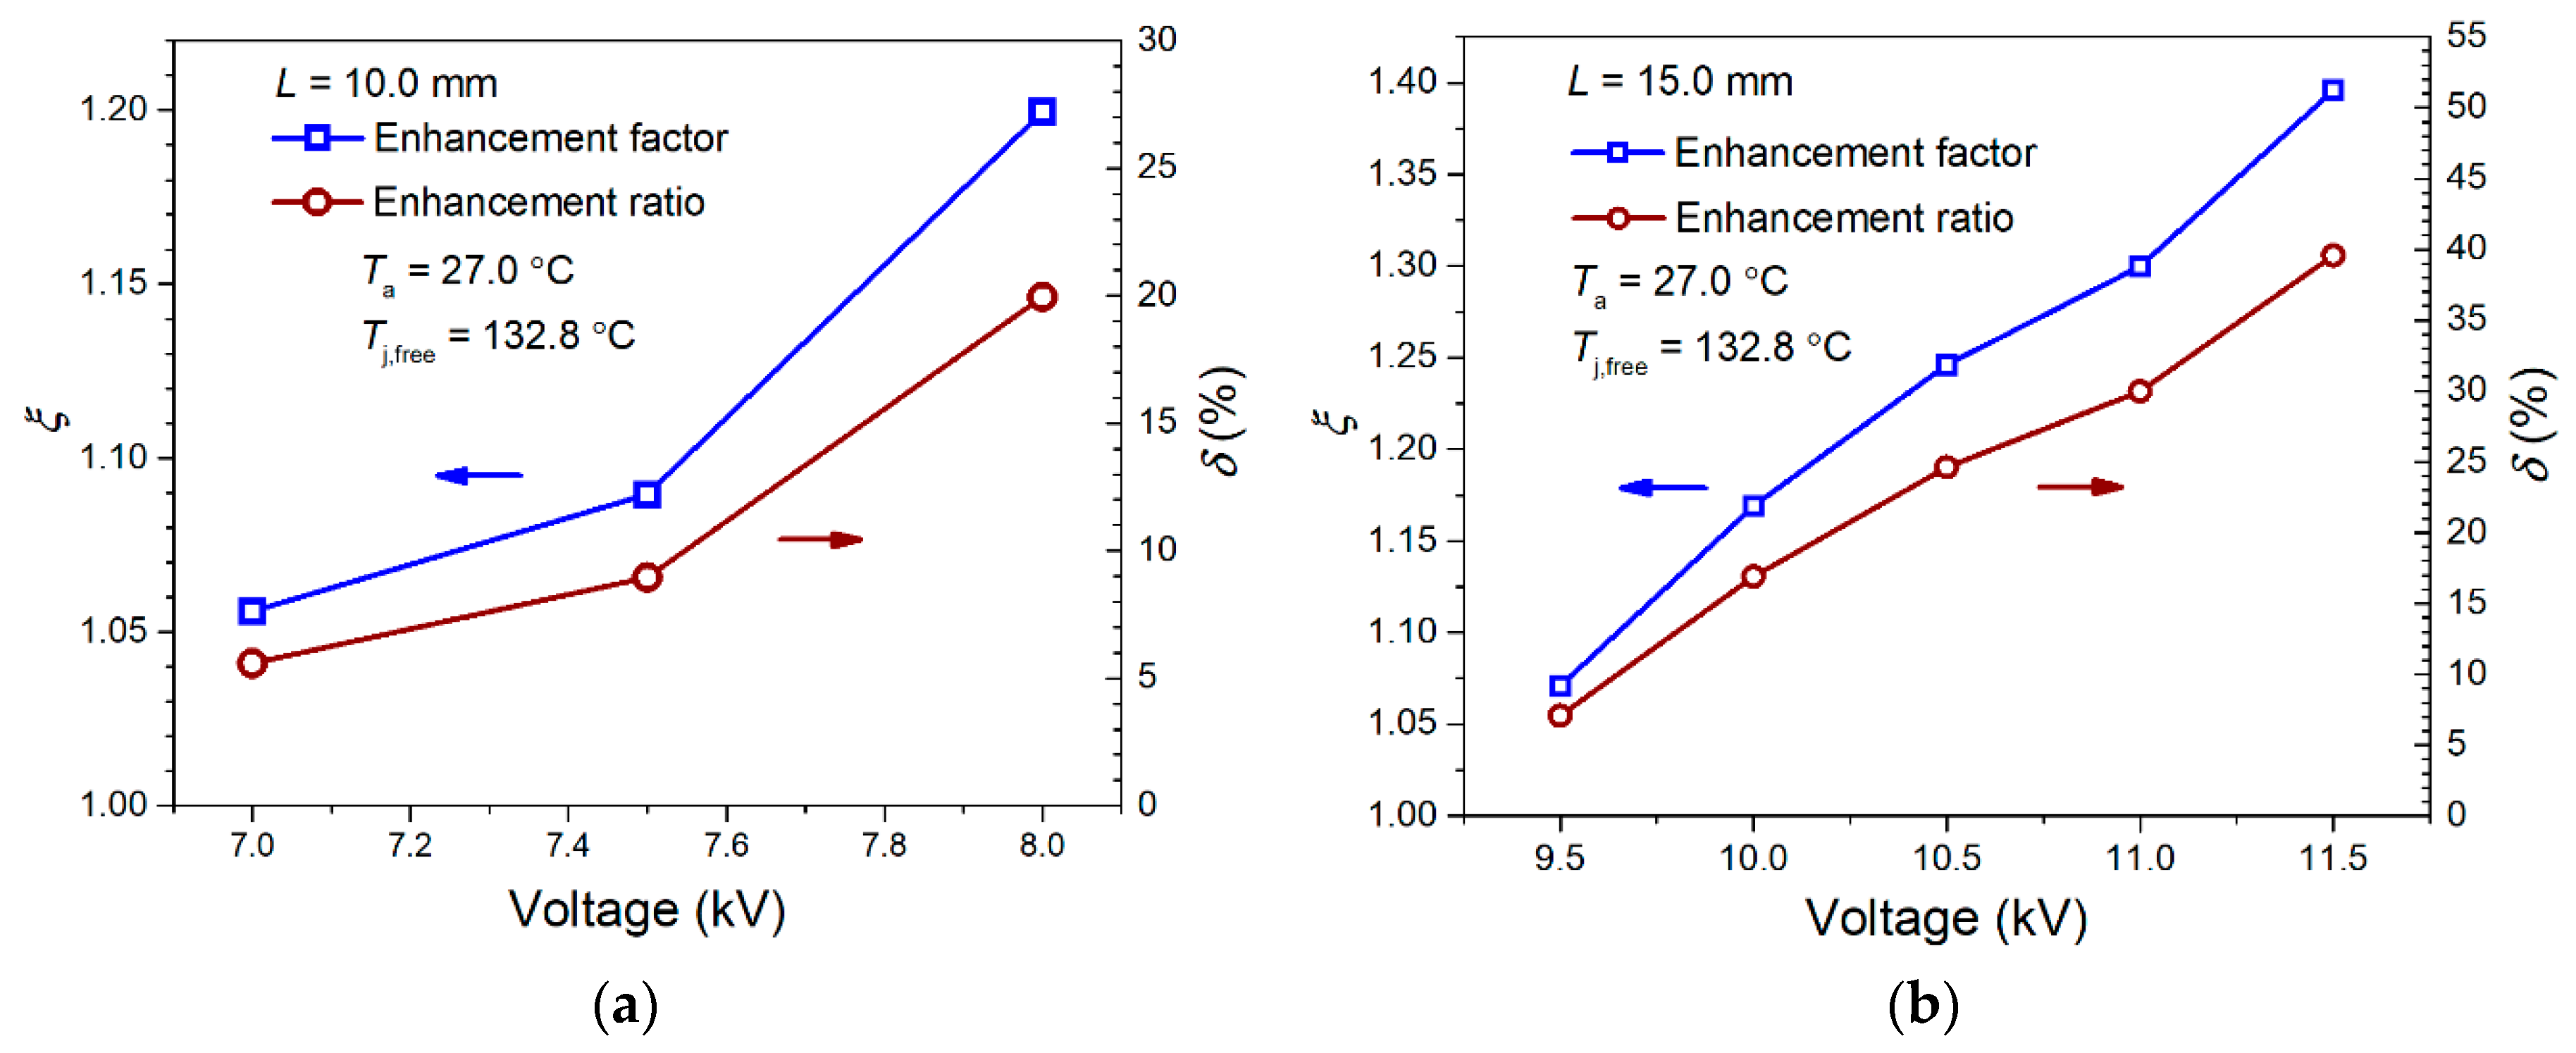
  • The junction temperature of the LED filament bulb is also influenced by the electrode gap L. A larger gap can enlarge the voltage applied on electrode and increase the ionic wind velocity within the bulb. The heat dissipation ability is improved due to higher velocity. The temperature fall with the electrode distance of 6.0 mm is very poor, because the ionic wind velocity is small. The junction temperature can be reduced to about 115.2 °C, at best, with the electrode gap of 10.0 mm. The enhancement ratio of the cooling performance is about 20% as compared with that of natural convection condition. The junction temperature can be reduced to about 102.8 °C at best when the gap increases to 15.0 mm and the enhancement ratio of the cooling performance reaches 40% when compared with that of natural convection condition.
  • The stability and adjustability of using ionic wind generator for cooling LED are confirmed by investigating the junction temperature under ionic wind in long-term tests. The values of temperature drops are consistent with the former measurement results. The LED filament bulb can work safety and reliably under ionic wind cooling.
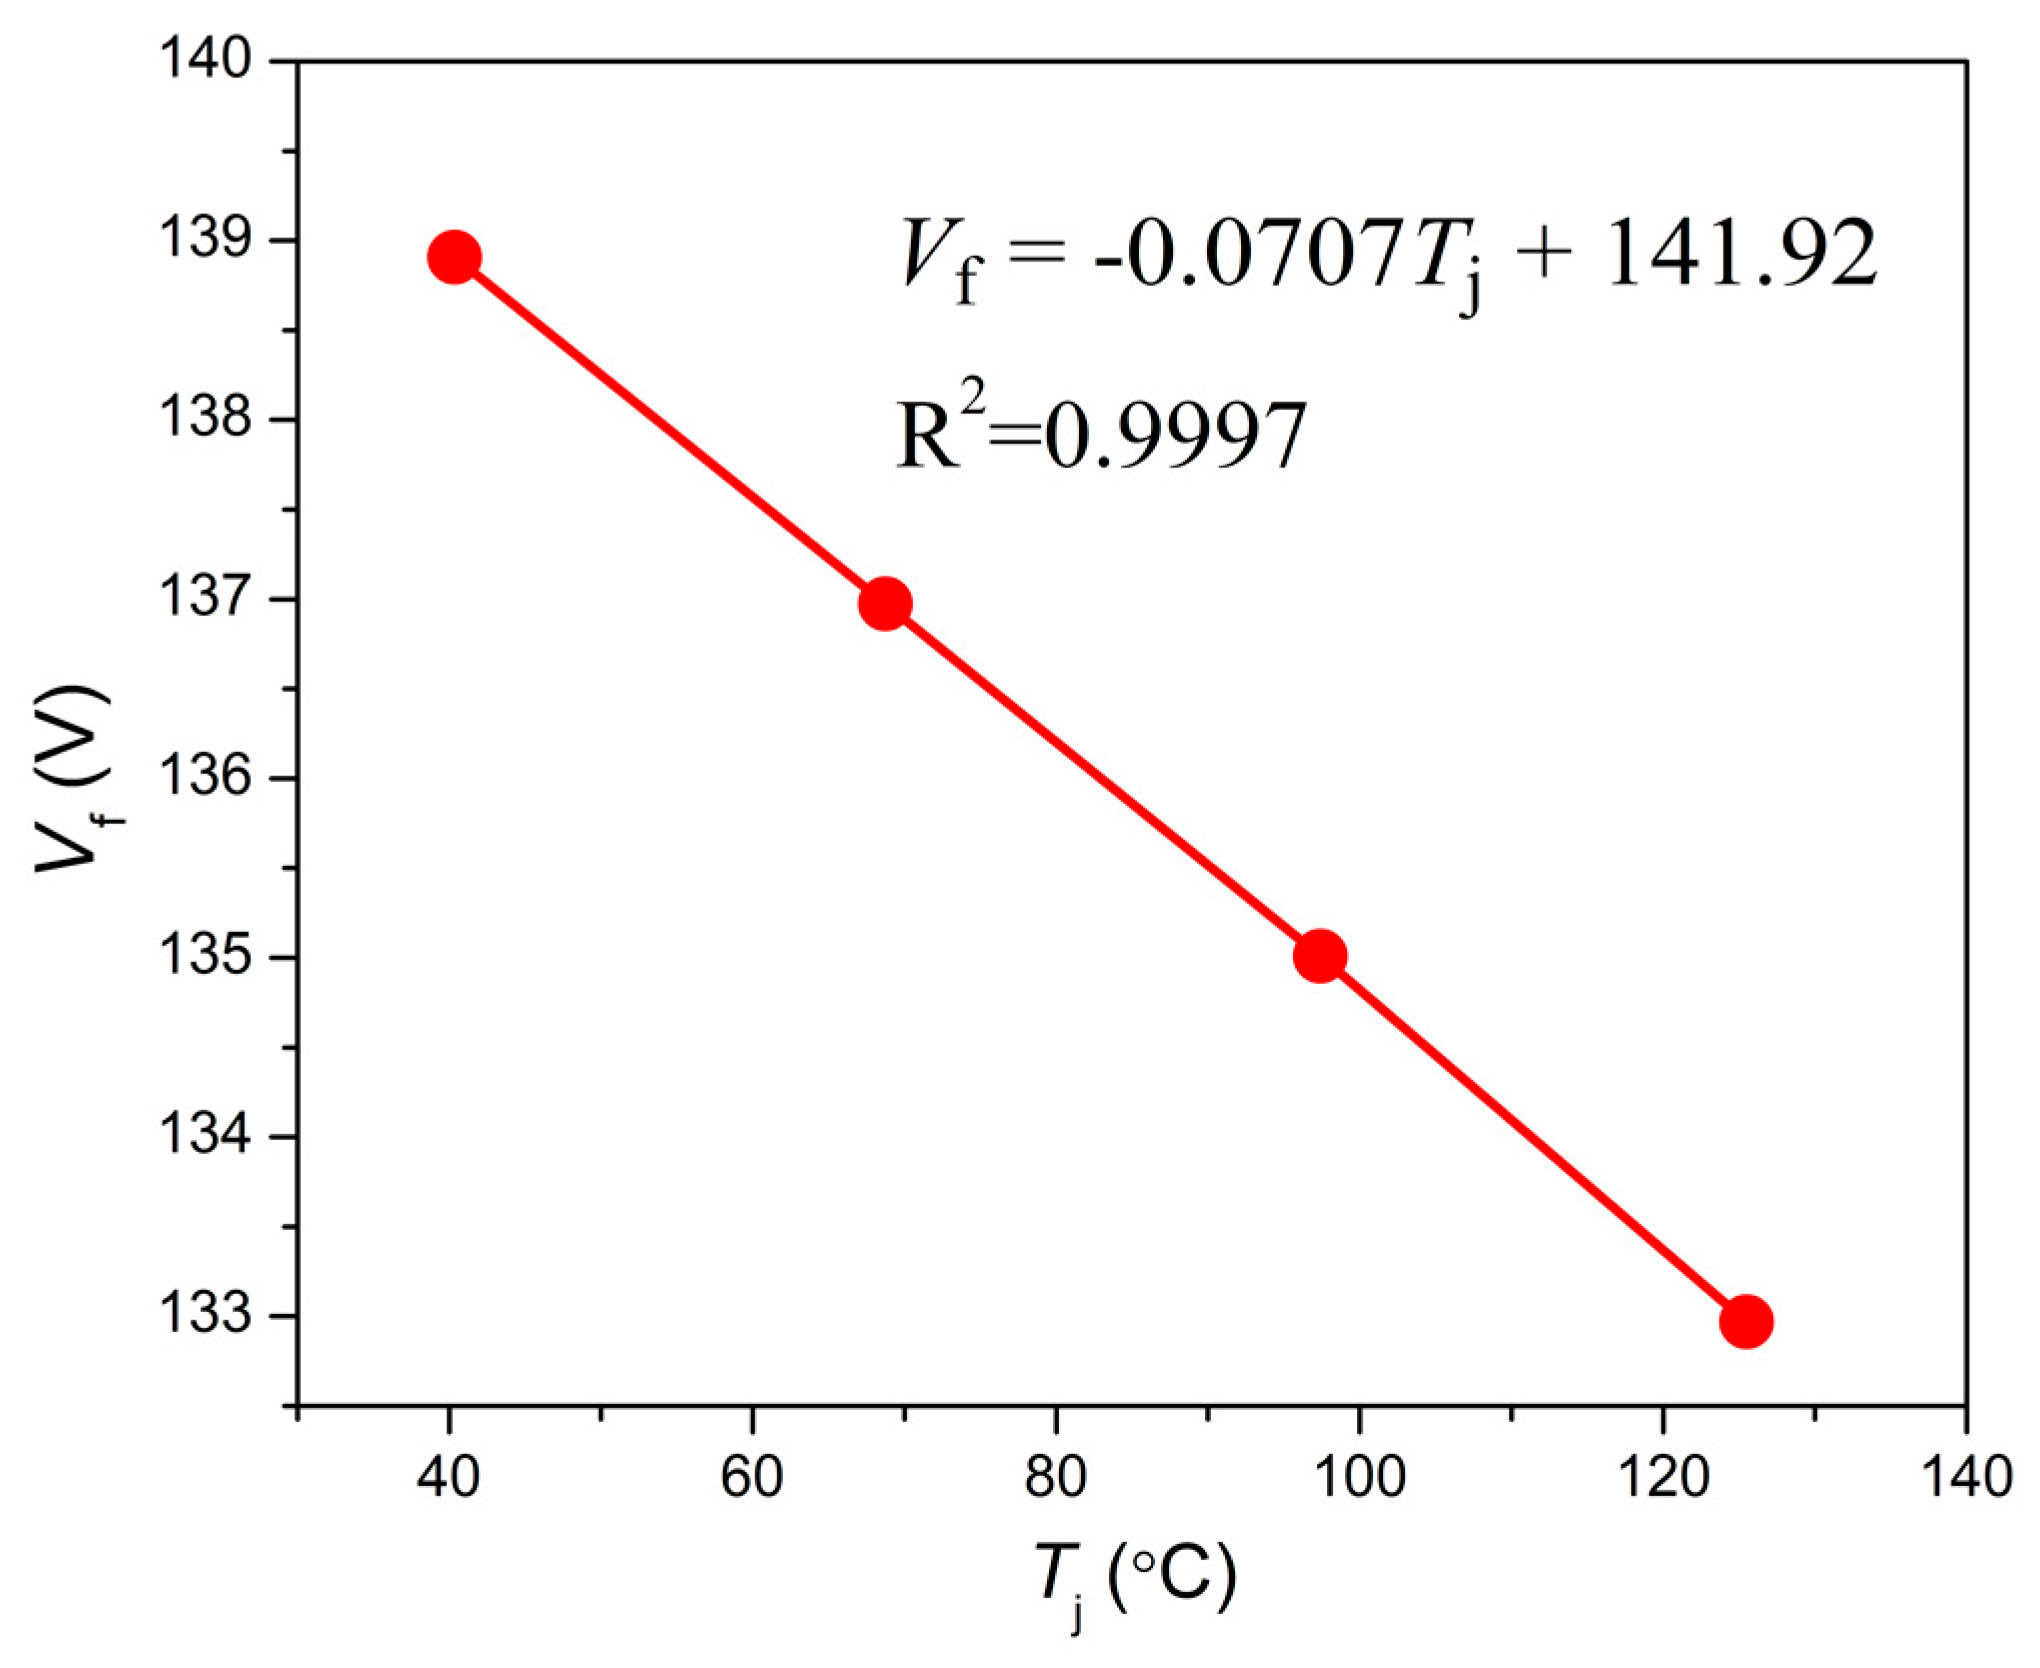
  • The light efficiency of the LED filament bulb is improved with regard to junction temperature drop. The electric power and luminous power of the bulb are also increased when the junction temperature is reduced. The maximum increase rate of luminous flux reaches 7.3% when the junction temperature reduction of LED reaches 30 °C.
The experimental results show that the heat dissipation condition of LED filament bulb can be improved under ionic wind. The maximum power that is consumed by generating ionic wind is less than 2.5 watts, which is lower than the rotating fan used for electronic product cooling. The method that is presented in the work can provide a new idea for thermal management of LED filament bulb. The negative effect of heat on the working characteristics of the LED filaments can be relieved, owing to the improved heat dissipation performance. The life span of the bulb can also be extended. Optimizing shape and arrangement of ionic wind electrodes to reduce the voltage that is needed to generate ionic wind and to achieve higher wind speed can make the method more feasible to the real-life application. However, the influence of high voltage on the LED filament bulb need to be considered and investigated when it comes to application. The issues that are brought up by high voltage, such as LED operation stability, electromagnetic compatibility, and system safety, need to be studied in the future.

Author Contributions

Methodology, C.X. and H.Z.; Validation, C.X., J.L. and J.C.; Formal analysis, C.X. and H.Z.; Resources, H.Z., X.Z., R.S.; Writing-original draft preparation, C.X.; Writing-review and editing, H.Z. and S.L.; Supervision, S.L.; Project administration, S.L.; Funding acquisition, S.L. All authors have read and agreed to the published version of the manuscript.

Funding

The research was funded by National Natural Science Foundation of China (U1501241) and Hubei Provincial Major Program of Technological Innovation (2017AAA121).

Conflicts of Interest

The authors declare no conflict of interest.

Appendix A

Appendix A.1. Analysis of Measurement Error on LED Junction Temperature Tj

The measurement error of Tj is mainly caused by the four parts: calibration error of the relationship between forward voltage Vf and junction temperature Tj, linear fitting error of Vf and Tj, measurement error of instrument LEDT-300B, and accidental measurement error.
The calibration error of Vf and Tj is caused by the measurement error of T-type thermocouple and the measurement error of instrument LEDT-300B for calibration. The measurement error of the thermocouple (δt) is ±0.5 °C. The measurement error of LEDT-300B (δs) includes system error of the instrument, the output error of the calibration current, the measurement error of Vf, and the truncation error of the instrument. The measurement error of LEDT-300B (δs) on Tj is ±1 °C.
Therefore, the maximum measurement error of the calibration error (δc) of Vf and Tj is
δ c = ± δ t 2 + δ s 2 = ± 0.5 2 + 1 2   C = ± 1.12   C
The linear fitting result of the Vf and Tj is shown in Equation (A2).
T j = 14.14 V f + 2006.51
The maximum lining fitting error for Tj with regard to the value range of Vf from 130 V to 145 V is
δ lmax = ± 0.05   C
The accidental measurement error for Tj during the junction temperature test is
δ a = ± i = 35 n ( T i T j ¯ ) 2 ( n 34 ) ( n 35 ) = ± i = 35 60 ( T i T j ¯ ) 2 650
where T j ¯ is average junction temperature of LED filaments under ionic wind from 35 to 60 min. Ti is the average junction temperature measured in “i” minute. The maximum accidental measurement error for Tj with regard to the electrode gap and voltage applied in all of the tests is
δ amax = ± 0.13   C
Therefore, the maximum measurement error of Tj is
δ T jmax = ± δ c 2 + δ lmax 2 + δ s 2 + δ amax 2 = ± 1.51   C

Appendix A.2. Analysis of Measurement Error on Environmental Temperature Ta

The measurement error of environmental temperature Ta is mainly caused by the measurement error of T-type thermocouple, the measurement error of instrument LEDT-300B and the accidental measurement error.
The accidental measurement error for environmental temperature Ta in every test is
δ a T a = ± i = 0 n ( T a , i T a ¯ ) 2 n ( n + 1 ) = ± i = 0 60 ( T a , i T a ¯ ) 2 3660
where T a ¯ is the average environmental temperature. T a , i is the environmental temperature measured in “i” minute. The maximum accidental measurement error of environmental temperature is
δ a T amax = ± 0.03   C
Therefore, the maximum measurement error of Ta is
δ T amax = ± δ t 2 + δ s 2 + δ a T amax 2 = ± 1.12   C

Appendix A.3. Analysis of Measurement Error on Ionic Wind Velocity v

Velocity measurement error includes accidental measurement error and intrinsic error of anemometer. The accidental measurement error δ a v is
δ a v = ± i = 1 n ( v i v ¯ ) 2 n ( n 1 )
where n is the measurement times, v i is the velocity of ionic wind measured, and v ¯ is average value of measurement. Velocity with regard to voltage applied to generate ionic wind is measured five times and the maximum accidental measurement error is
δ a v max = ± 0.13   C
According to Table 1, the measurement accuracy of hot wire anemometer is ±(1% f.s. + 1dgt) or ±(5%rdg + 1dgt). The biggest value of velocity measured in tests is 1.36 m/s. Therefore, the maximum measurement error of hot wire anemometer in the tests is
δ v hmax = ± ( 0.05 × 1.36 + 0.01 )   m / s = ± 0.08   m / s
Thus, the maximum measurement error of ionic wind velocity is
δ v = ± δ a v max 2 + δ vhmax 2 = ± 0.15   m / s

Appendix A.4. Analysis of Measurement Error on Discharge Current of Ionic Wind I

Discharge current I is measured by the microammeter, the measurement range used for measuring current is 0~20 µA and 0~200 µA. The range 0~20 µA is used for measuring current that is no larger than 15 µA. For current that is larger than 15 µA, the range 0~200 µA is used. The measurement error of the current is produced due to measurement error of ammeter δsI and accidental measurement error δaI. The measurement error of ionic wind current is
δ I = ± δ a I 2 + δ s I 2
The accidental measurement error of current is
δ a I = ± i = 1 n ( I i I ¯ ) 2 n ( n 1 )
where Ii is the current value measured and I ¯ is the average value of current measured. The discharge current with regard to every voltage is tested five times.
The maximum accidental measurement error is shown in Equations (A16) and (A17).
δ a I max = ± 0.16   μ A   ( I 15   μ A )
δ a I max = ± 0.8   μ A   ( I > 15   μ A )
The maximum measurement error of ammeter is shown in Equations (A18) and (A19).
δ s I = ± ( 0.5 % × 20 + 0.01 ) μ A = ± 0.11   μ A   ( I 15   μ A )
δ s I = ± ( 0.5 % × 200 + 0.1 ) μ A = ± 1.1   μ A   ( I > 15   μ A )
Therefore, the maximum measurement error on discharge current is shown in Equations (A20) and (A21).
δ I max = ± δ a I max 2 + δ s I 2 = ± 0.19   μ A   ( I 15   μ A )
δ I max = ± δ a I max 2 + δ s I 2 = ± 1.4   μ A   ( I > 15   μ A )

Appendix A.5. Analysis of Measurement Error on Electric Power of LED

The electric power of LED filament bulb (PE) is not directly measured by the experiments. The electric power of LED is computed by Equation (A22):
P E = V w · I w
where Vw is the operation voltage of the LED and Iw is the operation current of the LED. As mentioned above, when the LED filament bulb is working, the value of the operation current outputted by LEDT-300B is kept at 30 mA as a constant. The operation voltage is measured by LEDT-300B. In fact, according to the experiment results shown in Figure 6 and Figure 8, junction temperature of LED is not a constant, but fluctuates in a small range. Therefore, the measurement error of the electric power is determined by the output error of power applied on the LED filament bulb and the accidental measurement error. The output error of power applied on the LED filament bulb is caused by the output error of operation current and the measurement error of operation voltage. The output error of power applied on LED filament bulb can be computed by Equation (A23):
δ s P E = ± ( P E V w ) 2 · δ V w 2 + ( P E I w ) 2 · δ I w 2
where δ V w and δ I w is the measurement error of the operation voltage and operation current, respectively. The accuracy of the operation current Iw output by LEDT-300B is ±0.2%. The accuracy of the LEDT-300B on measuring the operation voltage is ±0.02% for the full measurement range that is 0~500 V. The maximum value of operation voltage measured in all the experiments is 148.53 V when the junction temperature is about 102.8 °C. Thus, the maximum measurement error of the electric power of LED filament bulb is:
δ s P E max = ± ( 0.03   ×   500   ×   0.02 % ) 2 + ( 148.53   ×   0.03   ×   0.2 % ) 2   W = ± 0.009   W
The accidental measurement error of electric power of LED filament bulb is:
δ a P E = ± i = 35 n ( P E , i P E ¯ ) 2 ( n 34 ) ( n 35 ) = ± i = 35 60 ( V w , i · I w , i V w · I w ¯ ) 2 650
where n is the measurement times, P E ¯ is average electric power of LED filament bulb when the ionic wind is already generated in the bulb from 35 to 60 min. PE,i is the electric power measured in “i” minute. The maximum accidental measurement error for PE in all the experiments is:
δ a P E max = ± 0.003   W
Therefore, the maximum measurement error of electric power PE is:
δ P Emax = ± δ s P E max 2 + δ a P E max 2   = ± 0.009   W

Appendix A.6. Analysis of Measurement Error on Luminous Power of LED

The luminous power of the LED filament bulb is measured by integrating sphere. The measurement error is caused by two parts: the measurement error of the integrating sphere and the electric power of the LED filament bulb. The measurement error of the integrating sphere is caused by many factors, such as the system error of the integrating sphere, the measurement error of the linear detector, the environmental temperature, the external vibration of the environment, and the installation location of the bulb. It should also be noted that the luminous flux of the LED filament bulb reduces as the operation time increases. However, luminous flux depreciation with time is very difficult to measure and to be evaluated, so the factor is usually not considered when measuring the luminous power and luminous flux of LED. Therefore, the luminous flux depreciation is not also considered in our work. According to product manual, the accuracy of the integrating sphere is ±2%. Thus, the maximum measurement error of the integrating sphere on luminous power ( δ s P L max ) is:
δ s P L max = ± P Lmax × 2 % = ± 0.037   W
where PLmax is the maximum value of the luminous power measured and the maximum value is 1.84 W.
The luminous power measured by the integrating sphere is also influenced by the electric power applied on the LED filament bulb. The luminous power of the LED filament bulb changes if the electric power outputted from LEDT-300B to the LED filament bulb is changed. The electric power is turned into heat and light while the average ratio between the luminous flux and the electric power is 39.5%. The uncertainty of the electric power applied has been analyzed in Appendix A.5. Thus, the measurement error of luminous power that is caused by the uncertainty of the electric power is:
δ L P E = ± δ P E max   ×   39.5 % = ± 0.004   W
The accidental measurement error of luminous power is:
δ a P L = ± i = 35 n ( P L , i P L ¯ ) 2 ( n 34 ) ( n 35 )
where n is the measurement times, PL,i is the luminous power of LED filament bulb measured in “i” minute. P L ¯ is the average luminous power. The maximum accidental measurement error in all the experiments is:
δ a P Lmax = ± 0.002   W
The maximum measurement error of luminous power is:
δ P Lmax = ± δ s P L max 2 + δ L P E 2 + δ a P L max 2 = ± 0.037   W

Appendix A.7. Analysis of Measurement Error on Luminous Flux of LED

The luminous flux of LED is also measured by the integrating sphere. The factors influencing the measurement error of the luminous flux are the same as factors influencing the luminous power. Thus, the error analysis follows the way used to analyze the error of luminous power. The maximum measurement error of the integrating sphere on luminous flux is:
δ s L f max = ± F Lmax   ×   2 % = ± 11.8   lm
where FLmax is the maximum value of luminous flux measured in the experiments.
According to Appendix A.5, the maximum output error of electric power ( δ P Emax ) is ±0.009 W. From Figure 9, the average light efficiency of the LED is about 130 lm/W and the maximum light efficiency is 132 lm/W when the junction temperature is the lowest. The maximum error that is caused by the output error of electric power of LED is:
δ F L max = ± δ P E max   ×   132   lm / W = ± 1.2   lm
The accidental measurement error of luminous flux is:
δ a F L = ± i = 35 n ( F L , i F L ¯ ) 2 ( n 34 ) ( n 35 )
where n is the measurement times, FL,i is the luminous flux of LED filament bulb measured in “i” minute. F L ¯ is the average luminous power. The maximum accidental measurement error in all the experiments is:
δ a F L max = ± 1.7   lm
The maximum measurement error of luminous power is:
δ F L max = ± δ s F L max 2 + δ F L max 2 + δ a F L max 2 = ± 12.0   lm

References

  1. Luo, X.; Hu, R.; Liu, S.; Wang, K. Heat and fluid flow in high-power LED packaging and applications. Prog. Energy Combust. Sci. 2016, 56, 1–32. [Google Scholar] [CrossRef] [Green Version]
  2. Yang, L.; Zhang, Q.; Li, F.; Xie, A.; Mao, L.; Ma, J. Thermally stable lead-free phosphor in glass enhancement performance of light emitting diodes application. Appl. Opt. 2019, 58, 4099–4104. [Google Scholar] [CrossRef] [PubMed]
  3. Weng, C.-J. Advanced thermal enhancement and management of LED packages. Int. Commun. Heat Mass Transf. 2009, 36, 245–248. [Google Scholar] [CrossRef]
  4. Lei, X.; Zheng, H.; Guo, X.; Zhang, Z.; Wu, J.; Xu, C.; Liu, S. Reduction of die-bonding interface thermal resistance for high-power LEDs through embedding packaging structure. IEEE Trans. Power Electron. 2017, 32, 5520–5526. [Google Scholar] [CrossRef]
  5. Wang, H.-C.; Jewell-Larsen, N.E.; Mamishev, A.V. Thermal management of microelectronics with electrostatic fluid accelerators. Appl. Therm. Eng. 2013, 51, 190–211. [Google Scholar] [CrossRef]
  6. Wang, J.; Zhu, T.; Cai, Y.-X.; Zhang, J.-F.; Wang, J.-B. Review on the recent development of corona wind and its application in heat transfer enhancement. Int. J. Heat Mass Transf. 2020, 152, 119545. [Google Scholar] [CrossRef]
  7. Hsu, C.-P.; Jewell-Larsen, N.E.; Krichtafovitch, I.A.; Mamishev, A.V. Heat-Transfer-Enhancement Measurement for Microfabricated Electrostatic Fluid Accelerators. J. Microelectromech. Syst. 2009, 18, 111–118. [Google Scholar]
  8. Mei, L.; Zhang, H.; Meng, H.; Qian, S. Electroosmotic Flow of Viscoelastic Fluid in a Nanoslit. Micromachines 2018, 9, 155. [Google Scholar] [CrossRef] [Green Version]
  9. Jewell-Larsen, N.E.; Ran, H.; Zhang, Y.; Schwiebert, M.K.; Tessera, K.A.H.; Mamishev, A.V. Electrohydrodynamic (EHD) cooled laptop. In Proceedings of the 25th Annual IEEE Semiconductor Thermal Measurement and Management Symposium, San Jose, CA, USA, 15–19 March 2009; pp. 261–266. [Google Scholar]
  10. Chen, I.Y.; Guo, M.-Z.; Yang, K.-S.; Wang, C.-C. Enhanced cooling for LED lighting using ionic wind. Int. J. Heat Mass Transf. 2013, 57, 285–291. [Google Scholar] [CrossRef]
  11. Chen, I.Y.; Chen, C.-J.; Wang, C.-C. Influence of electrode configuration on the heat transfer performance of a LED heat source. Int. J. Heat Mass Transf. 2014, 77, 795–801. [Google Scholar] [CrossRef]
  12. Qu, J.; Kong, L.; Zhang, J. Experimental Investigation on Flow and Heat Transfer Characteristics of a Needle-Cylinder Type Ionic Wind Generator for LED Cooling. Energies 2018, 11, 1149. [Google Scholar] [CrossRef] [Green Version]
  13. Zhang, J.; Zhao, C.; Li, H.; Tao, W. 3D Numerical Simulation of Heat Transfer of a Heated Plate under the Electric Field Generated by a Needle Electrode. Math. Probl. Eng. 2014, 2014, 354180. [Google Scholar] [CrossRef] [Green Version]
  14. Zhang, J.F.; Wang, S.; Li, H.Y.; Qu, Z.G. Parametric Study and Optimization of Flow Characteristics of Wire-Nonparallel Plate-Type Electrostatic Air Accelerators. J. Fluids Eng. 2018, 140, 101105. [Google Scholar] [CrossRef] [PubMed]
  15. Shin, D.H.; Baek, S.H.; Ko, H.S. Development of heat sink with ionic wind for LED cooling. Int. J. Heat Mass Transf. 2016, 93, 516–528. [Google Scholar] [CrossRef]
  16. Shin, D.H.; Sohn, D.K.; Ko, H.S. Analysis of thermal flow around heat sink with ionic wind for high-power LED. Appl. Therm. Eng. 2018, 143, 376–384. [Google Scholar] [CrossRef]
  17. Wang, J.; Cai, Y.-X.; Bao, W.-W.; Li, H.-X.; Liu, Q. Experimental study of high power LEDs heat dissipation based on corona discharge. Appl. Therm. Eng. 2016, 98, 420–429. [Google Scholar] [CrossRef]
  18. Wang, J.; Zhu, T.; Cai, Y.-X.; Wang, J.-B.; Wang, J. Development and application of a solid-state fan for enhanced heat dissipation. Appl. Therm. Eng. 2020, 169, 114922. [Google Scholar] [CrossRef]
  19. Wang, L.; Li, W.; Xu, Y.; Yang, B.; Shi, M.; Zou, J.; Li, Y.; Qian, X.; Zheng, F.; Yang, L. Effect of different bending shapes on thermal properties of flexible light-emitting diode filament. Chin. Phys. B 2018, 27, 110701. [Google Scholar] [CrossRef]
  20. Madias, E.N.D.; Doulos, L.T.; Kontaxis, P.A.; Topalis, F.V. A decision support system for techno-economic evaluation of indoor lighting systems with LED luminaires. Oper. Res. 2019. [Google Scholar] [CrossRef]
  21. Doulos, L.T.; Sioutis, I.; Kontaxis, P.; Zissis, G.; Faidas, K. A decision support system for assessment of street lighting tenders based on energy performance indicators and environmental criteria: Overview, methodology and case study. Sustain. Cities Soc. 2019, 51, 101759. [Google Scholar] [CrossRef]
  22. Kagel, H.; Jacobs, H.; Bier, F.F.; Glökler, J.; Frohme, M. A Novel Microtiter Plate Format High Power Open Source LED Array. Photonics 2019, 6, 17. [Google Scholar] [CrossRef] [Green Version]
  23. Feng, W.; Feng, B.; Zhao, F.; Shieh, B.; Lee, R. Simulation and optimization on thermal performance of LED filament light bulb. In Proceedings of the 12th China International Forum on Solid State Lighting (SSLCHINA), Shenzhen, China, 2–4 November 2015; pp. 88–92. [Google Scholar]
  24. Liu, J.; Xu, C.; Zheng, H.; Liu, S. Numerical Analysis and Optimization of Thermal Performance of LED Filament Light Bulb. In Proceedings of the IEEE 67th Electronic Components and Technology Conference (ECTC), Orlando, FL, USA, 30 May–2 June 2017; pp. 2243–2248. [Google Scholar]
  25. Wang, W.; Zou, J.; Zheng, Q.; Li, Y.; Yang, B.; Shi, M.; Li, Y.; Li, X.; Zhang, C.; Li, C.; et al. The Effect of Different Filament Arrangements on Thermal and Optical Performances of LED Bulbs. Appl. Sci. 2020, 10, 1373. [Google Scholar] [CrossRef] [Green Version]
  26. Wang, L.P.; Zou, J.; Yang, B.B.; Li, W.B.; Li, Y.; Shi, M.M.; Zhu, W.; Zhang, C.Y.; Wang, F.C.; Lin, Y.J. Optical and electrical properties of a spiral LED filament. J. Semicond. 2018, 39, 024003. [Google Scholar] [CrossRef]
  27. Xu, C.; Zhang, Z.; Chu, J.; Wu, J.; Lei, X.; Zheng, H.; Liu, S. Thermal dissipation enhancement of LED filament bulb by ionic wind. In Proceedings of the 17th International Conference on Electronic Packaging Technology (ICEPT), Wuhan, China, 16–19 August 2016; pp. 1212–1215. [Google Scholar]
  28. Luo, X.B.; Mao, Z.M.; Liu, S. Thermal design of a 16W LED bulb based on thermal analysis of a 4W LED bulb. In Proceedings of the Electronic Components and Technology Conference, Las Vegas, NV, USA, 1–4 June 2010; pp. 1906–1911. [Google Scholar]
  29. Petroski, J. Advanced natural convection cooling designs LED bulb systems. J. Electron. Packag. 2014, 136, 041005. [Google Scholar] [CrossRef]
  30. Yang, X.F.; Liu, J.; Chen, Q.; Shen, Y.P.; Liu, H.Z.; Lai, G.Q. A low temperature vulcanized transparent silane modified epoxy resins for LED filament bulb package. Chin. J. Polym. Sci. 2018, 36, 114–121. [Google Scholar] [CrossRef]
  31. Jang, D.; Park, S.J.; Yook, S.J.; Lee, K.S. The orientation effect for cylindrical heat sinks with application to LED light bulb. Int. J. Heat Mass Transf. 2014, 71, 496–502. [Google Scholar] [CrossRef]
  32. Zhang, Y.; Liu, L.; Chen, Y.; Ouyang, J. Characteristics of ionic wind in needle-to-ring corona discharge. J. Electrost. 2015, 74, 15–20. [Google Scholar] [CrossRef]
  33. Shin, D.H.; Yoon, J.S.; Ko, H.S. Experimental optimization of ion wind generator with needle to parallel plates for cooling device. Int. J. Heat Mass Transf. 2015, 84, 35–45. [Google Scholar] [CrossRef]
Figure 1. Schematic diagram of ionic wind velocity test: (a) structure of LED bulb with ionic wind device. A: the farthest spot from the entrance hole for anemometer probe, B: the middle spot from the entrance hole for anemometer probe, C: the nearest spot from the entrance hole for anemometer probe; and, (b) photograph of experimental setup for measuring ionic wind velocity.
Energies 13 03008 g001
Figure 2. Experimental setup for measuring junction temperature of LED filament bulb: (a) system frame chart for measuring junction temperature of LED filament bulb; and, (b) photograph of experiment on measuring junction temperature of LED filament bulb.
Energies 13 03008 g002
Figure 3. The calibration of junction temperature and forward voltage of LED filament.
Energies 13 03008 g003
Figure 4. Electrical characteristic of the ionic wind device under three different needle-ring distances: (a) variation of discharge current with the applied voltage; and, (b) inception voltage and maximum stable voltage.
Energies 13 03008 g004
Figure 5. Average velocity of ionic wind with regard to operation voltage under three different needle-ring distances.
Energies 13 03008 g005
Figure 6. Evolution of the junction temperature for the LED filament when applied with different voltages on electrodes: (a) electrode gap of 6.0 mm; (b) electrode gap of 10.0 mm; and, (c) electrode gap of 15.0 mm.
Energies 13 03008 g006aEnergies 13 03008 g006b
Figure 7. Enhancement factor and ratio according to applied voltage under different electrode gaps: (a) electrode gap of 10.0 mm; and, (b) electrode gap of 15.0 mm.
Energies 13 03008 g007
Figure 8. Stability and adjustability testing of ionic wind device: (a) continuous working for 100 min; and, (b) successive increasing applied voltage.
Energies 13 03008 g008
Figure 9. Light efficiency of LED filament bulb under ionic wind: (a) electric power and luminous power of LED filament bulb with electrode gap 10.0 mm; (b) electric power and luminous power of LED filament bulb with electrode gap 15.0 mm; (c) luminous flux of LED filament bulb with electrode gap 10.0 mm; and, (d) luminous flux of LED filament bulb with electrode gap 15.0 mm.
Energies 13 03008 g009
Table 1. Detailed information of Instruments.
InstrumentsParameters and Accuracy
LEDT-300B
(Shanghai LEETS LIGHTING Co., Ltd., Shanghai, China)
Output voltage: 0–500 V
Output Current: 0–5 A
Resolution: 0.0001 V, 0.001 A
Operation temperature: 0–150 °C
Calibration current: 1.0 mA ± 0.2%
Temperature calibration accuracy: ±0.5 °C
Junction temperature measuring error: ±1 °C
High voltage power supply (Dong wen high voltage Co. Ltd., Tianjin, China)Voltage: 0–30 kV
Resolution: 0.001 kV, 0.01 mA
Accuracy: ±(1% f.s. 1 + 1 V), ±(1% f.s.1 + 0.01 mA)
Hot wire anemometer
(HT-9829, Dongguan Xintai Instrument Co., Ltd., Dongguan, China)
Velocity: 0.1–25 m/s
Resolution: 0.01 m/s
Accuracy: ±(5% rdg 2 + 1dgt 3)/±(1% f.s. 1 +1dgt 3)
T-type thermocoupleTemperature: 0–350 °C
Accuracy: ±0.5 °C
Microammeter
(AD5/1-7 Digital-dc galvanometer, Shanghai Dongmao Electronic Technology Co., Ltd., Shanghai, China)
Measurement range: 0–20 µA/0–200 µA
Resolution: 0.01 µA/0.1 µA
Accuracy: ±(0.5% f.s. 1 + 0.01 µA)/±(0.5% f.s. 1 + 0.1 µA)
1 Full measurement range; 2 Reading value; 3 Instrument resolution.

