Article

Study of the Effect of Addition of Hydrogen to Natural Gas on Diaphragm Gas Meters

1
Oil and Gas Institute–National Research Institute, ul. Lubicz 25a, 31-503 Kraków, Poland
2
Independent expert, 30-605 Kraków, Poland
*
Author to whom correspondence should be addressed.
Energies 2020, 13(11), 3006; https://doi.org/10.3390/en13113006
Submission received: 17 April 2020 / Revised: 25 May 2020 / Accepted: 5 June 2020 / Published: 11 June 2020
(This article belongs to the Section A5: Hydrogen Energy)

Abstract

:
Power-to-gas technology plays a key role in the success of the energy transformation. This paper addresses issues related to the legal and technical regulations specifying the rules for adding hydrogen to the natural gas network. The main issue reviewed is the effects of the addition of hydrogen to natural gas on the durability of diaphragm gas meters. The possibility of adding hydrogen to the gas network requires confirmation of whether, within the expected hydrogen concentrations, long-term operation of gas meters will be ensured without compromising their metrological properties and operational safety. Methods for testing the durability of gas meters applied at test benches and sample results of durability tests of gas meters are presented. Based on these results, a metrological and statistical analysis was carried out to establish whether the addition of hydrogen affects the durability of gas meters over time. The most important conclusion resulting from the conducted study indicates that, for the tested gas meter specimens, there was no significant metrological difference between the obtained changes of errors of indications after testing the durability of gas meters with varying hydrogen content (from 0% to 15%).

1. Introduction

Transmission and distribution systems for gaseous fuels are required for the reliable and secure transport of such fuels through the network to final customers and to the networks of other operators. Critical functions of the operator in this regard include organizing the gas system, managing network operations, maintenance, repairs, and developing the gas distribution infrastructure. The operators provide gaseous fuel transport services based on contracts for the provision of distribution and transmission services concluded with trading companies [1]. They are also responsible for the quality of gas being transported. All tasks are performed in accordance with the provisions of governmental energy policy documents [2].
The chemical energy storage system is the only technically and economically feasible system that enables the provision of long-term storage of renewable energy and satisfying demand. Power-to-gas (P2G) technology, which uses green electric energy converted into hydrogen through electrolysis and stored in the natural gas network, plays a key role in the success of the energy transformation. The size and configuration of the required P2G systems largely depend on the location of the equipment in the gas network. It is estimated that by 2050, the share of renewable energy sources (RES) will account for about 55% of total energy consumption [3]. This means that, with the development of renewable energy, the demand for energy storage will increase. This paper will also demonstrate that storage technologies will remain crucial, especially in the context of changing electricity prices. Integrating energy markets, which will host an increasing share of renewable energy, will require the development of electricity networks and the implementation of new forms of energy storage [4] in such a way that the gas system can contribute to increasing the storage capacity of electricity produced from the RES [5]. The European Union (EU) acknowledges that, along with the increasing number of renewable energy installations, surplus electricity will increase at certain times of the day, which, through the use of P2G technology, can be converted into hydrogen, which in turn can be stored using the existing natural gas infrastructure. Then, the stored hydrogen can be reconverted into electricity.
There is also the possibility of converting renewable electricity into fuels or chemical energy (e.g., methanol) or synthetic gases (e.g., synthetic methane). Publication [6] describes a Power-to-gas (P2G) concept combining high-temperature steam electrolysis (SOEC) under high pressure with a CO2 methanation module in an independent and thermally integrated operation. It is emphasized that, with less than 2% by volume of H2 and more than 97% by volume of CH4 present in the final produced synthetic natural gas (SNG), it can be injected directly into the existing German natural gas network without further gas treatment and without capacity restrictions. In publication [7], however, P2G technology is discussed as a means of the production of advanced renewable gaseous fuels for transport while providing auxiliary services to the electrical grid through decentralized energy storage on a small scale up to 10 MW.
Publication [8] demonstrates that RES are developing rapidly as an alternative to fossil-fuel energy sources in order to make society independent of carbon sources. Wind and photovoltaic energy generation is interrupted by weather conditions. Therefore, particular attention is paid to the storage of excess electricity, and gas supply systems (P2G) appear to be one of the most promising technologies to meet that objective. In the analyzed project, the product was SNG, which can be directly injected into the natural gas distribution network. However, as pointed out in publication [9], the conversion of electricity into gas for the use of renewable energy sources is commonly focused on hydrogen production, which involves compliance issues with the existing gas system infrastructure.
In 2016, the EU adopted the document “Strategy for liquefied natural gas and gas storage” [10]. In a future scenario for large facilities with good capacity utilization, a production cost of renewable gases well below 10 cents/kWh can be achieved. This document also highlights the potential of P2G technology for storing energy from renewable sources and its use in the form of a neutral gas in terms of carbon dioxide emissions in transport, heating, and energy production. This means that P2G increases the possibility of focusing on renewable energy production and, in particular, on the development of individual specializations in that domain. This will lead to increased energy self-sufficiency of individual countries.
On 1 February 2017, a draft document by the European Commission, “Energy storage - the role of electricity”, was published, which emphasized that energy storage will be a key part of maintaining flexible support for the integration of renewable energy into the energy system [11]. Energy storage plays a crucial role in the development of a low-carbon energy model in EU countries.
The analyses performed as part of the study [12] included a comprehensive inventory and assessment of know-how in the field of adding hydrogen to the natural gas network. This document also presented an up-to-date overview of the tolerance of hydrogen effects on various elements of the gas supply system. For the first time in history, a scientific assessment of the potential and limitations of the storage function and hydrogen tolerance of existing natural gas infrastructure was performed in Germany. However, the need still exists for research into the effects of hydrogen on some key elements, such as natural gas storage in geological structures, gas turbines, and natural gas vehicle tanks. Practical research is required in these areas for specific gas infrastructure applications. Furthermore, the study showed that for admixture concentrations greater than 10% of H2 by volume (that it concerns hydrogen content in natural gas/hydrogen mixture in the distribution network or at the recipient point), preparatory field tests must be carried out with a large number of devices and quality parameters of mixtures of gas with hydrogen. According to the results of preliminary studies regarding the change in gas quality, it can be noted that, depending on the specific application of high-methane gas, appropriate methods and devices for measuring and compensating for changes in gas quality are needed. Also, in many countries, the permissible limit of hydrogen concentration in the distribution network may differ significantly from the limit set for Germany—10% V/V—for example, it is 0.5% V/V in the Netherlands, while in the UK it amounts to 0.1% V/V [13,14].
Research is being conducted as part of further projects clarifying these outstanding issues. One of them is the study performed by the Oil and Gas Institute–National Research Institute on the assessment of the effect of the addition of hydrogen to natural gas on the safety and accuracy of diaphragm gas meters described in publication [15]. However, despite this study’s optimistic research results, further research results may prove that key elements of the gas infrastructure are not adapted to the transmission of a natural gas mixture with hydrogen, and their adaptation may pose costly economic challenges.
In 2007, the EU set out its strategic objectives in European energy policy, which included “combating climate change, reducing the Union’s vulnerability to external factors arising from dependence on the import of hydrocarbons, and supporting employment and economic growth” [16]. The EU’s energy policy is, therefore, intended to strengthen energy security. According to EU strategic documents, by 2050 the share of RES in the energy balance will increase. For that reason, in 2007, the European Commission (EC) proposed to launch in 2008 activities leading to the appropriate planning of energy infrastructure networks and the transition to new systems that would help develop tools in the following areas: Smart networks, transport and storage of carbon dioxide, and hydrogen distribution [17]. In 2007, hydrogen and fuel cells were listed in the "Actions for the European Strategic Energy Technology Plan" document as technologies that can be used in a short time horizon [18].
In 2008, the European Commission published the “HyWays. The European Hydrogen Roadmap”, which highlights the role of that energy resource for the climate and the economy [19]. The document also indicates that there are significant barriers to overcome to increase the importance of hydrogen for the economy. The document also defines the main political challenge, which is the lack of a role for hydrogen in the programs of ministries responsible for climate issues or energy security [19].
In 2008, the ”Fuel Cells and Hydrogen. Joint Undertaking-FCH JU” was established based on Council Regulation (no. 521/2008) ([20], p. 1). One of the objectives of FCH JU (Article 2 of Council Regulation no. 521/2008) was to develop public-private cooperation in the field of research on fuel cells and hydrogen technologies in the Member States [20]. A greater focus on demonstration activities, which would allow the use of hydrogen to store electricity produced from RES, was recommended [21]. In 2014, on the basis of Council Regulation no. 559/2014 of 6 May 2014, FCH 2 JU was established. Its objectives included increasing the effectiveness of hydrogen production from renewable energy sources, as well as demonstrating the large-scale use of hydrogen to integrate RES with the energy system (Article 2) [22]. Moreover, the draft document "FCH JU Multi-Annual Work Plan 2014–2020" emphasized that the injection of hydrogen produced from RES into the energy system will take place through natural gas networks [23].

Introducing Hydrogen to the Network According to Applicable Legal Regulations

Currently in Poland, there are no legal or technical regulations that clearly specify the rules for adding hydrogen to the natural gas network. Neither the applicable legal acts nor technical documents [24,25,26,27] clarify what may be the maximum hydrogen content in natural gas transported by gas networks. It can, therefore, be concluded that in the case of the injection of hydrogen into the natural gas distribution network, the only information on the maximum content of hydrogen in natural gas results from such documents as the Regulation [28] and the Distribution Network Operation and Maintenance Manual (IRiESD) [29]; however, this information is not given directly, but results from the requirements included in those documents for maintaining gas energy parameters, presented in Table 1.
  • Natural gas E is gas of group E of the second gas family, whose main component is methane.
  • Natural gas Lw is gas of group Lw linked with the second gas family, whose main components are methane and nitrogen.
  • Natural gas Ls is gas of group Ls linked with the second gas family, whose main components are methane and nitrogen.
  • Wobbe index Ws is the ratio of the gross calorific value of a gas per unit volume and the square root of its relative density under the same reference conditions [30].
The data given in Table 1 demonstrate that the difference in the requirements regarding the permissible values of gas energy parameters exists in the gross calorific value of natural gas of group E, which, according to the Regulation, should be at least 34.0 MJ/m3, while, according to IRiESD, it should be at least 38.0 MJ/m3. When introducing hydrogen into the distribution network, it should be kept in mind that the required energy parameters for the natural gas-hydrogen mixture resulting from the introduction of hydrogen into the natural gas network should be maintained. Considering the possible gas compositions, the maximum hydrogen content in the gas mixture can be determined, which, for the gas from the LNG regasification, amounts to a maximum of 36% (mol/mol) H2, and for gas of group 2E, 26% (mol/mol) [31]. Issues related to changes in natural gas parameters after adding hydrogen are discussed in publication [32]. The authors found, among others, that the addition of hydrogen in a mixture with natural gas can have a beneficial effect on transmission conditions (increasing the distance of gas transmission as a result of the reduction in the pressure drop). However, the hydrogen content should not exceed 15–20% since above 20%, in a mixture with methane, the gross calorific value of the gas drops below 35 MJ/Nm3 and, as a consequence, the natural gas may not meet the quality requirements provided in the relevant standards. Note also that the addition of hydrogen to a gas network built of steel pipes and steel fittings may contribute to the effect of hydrogen embrittlement inside the gas pipeline. That effect was described, among others, in publication [33], where the use of hydrogen as an energy carrier for electric vehicles powered by fuel cells is discussed. Mixing hydrogen with gas transferred through the existing gas pipeline system is proposed as a means of a more efficient use of renewable energy. The durability and integrity of the existing gas pipeline system is an open question since hydrogen significantly reduces the mechanical performance of steel. In this context, the hydrogen embrittlement effect, occurring particularly at higher gas pressures, was analyzed. The hydrogen embrittlement of steel was first discovered by Johnson. For safety reasons, hydrogen embrittlement must be considered in the transport of pure hydrogen or natural gas with hydrogen through steel pipelines. Caused by the weakening of metal atomic bonds and change in plasticity, this effect is distinct for its adverse effects on the mechanical properties of steel.
For metrological, but also for fiscal and safety reasons, it has to be determined whether the measuring equipment can accurately and safely measure natural gas with the addition of hydrogen, and, should it be possible to measure such a mixture, the maximum level of hydrogen content at which this equipment will be reliable. Moreover, it has to be determined whether the safety requirements, including explosion risk, will be met. The tightness of the construction of measuring instruments may also depend on the type of gas for which the device is designed and built. Due to valid safety requirements, devices used in the distribution network and located in explosion hazard zones should meet explosion safety requirements as part of intrinsic safety.
As pointed out by the author of [34], home gas meters operating in a distribution network are influenced by many factors, including the place of installation (indoor, outdoor), usage, and average annual gas consumption. A critical part of a diaphragm gas meter is its diaphragm, as well as the components of the gas meter measuring system, in which resistance to the conditions present in use will considerably affect the accuracy of the measurements and balancing of the entire gas distribution system. Factors that can significantly affect the performance of gas meters include the ambient temperature and the lifespan of the meter.
The ambient temperature may cause permanent or temporary changes in the diaphragm’s linear dimensions, which in turn affects the gas meter’s cyclic volume (measuring chamber volume) and thus contributes to an error of indication. Other factors affecting the diaphragm geometry may be, for example, vapors of some hydrocarbons, including toluene or isooctane. When such compounds cause, for example, the diaphragm to shrink, the gas meter will reduce its cyclic volume and will overstate the indications (positive errors). The temperature might also damage the diaphragm by perforation, which is manifested by lowered indications of the meter, particularly at low flow rates. The operating conditions can also lead, for example, to a change in the mechanical resistance of the gas meter’s kinematic system. As a result of wear in internal parts, inner leaks may also occur. All these factors may cause the permissible errors to be exceeded during use and generate unsettled amounts of gas (UAG). UAG values are understood as the difference between the measured amount of gas at the inlet and that at the outlet from the gas network (the amount delivered to end users) [35]. The key parts of UAG include gas measurements, accounting (billing cycles, network accumulation, network filling and emptying, and operators’ own consumption), gas emissions, and theft [36]. Due to the greatest percentage of diaphragm gas meters present in the gas distribution system, the amounts of UAG resulting from the inaccuracy of those meters can be significant. The amounts of UAG have to be included in the gas network balancing equation to account for the errors of measurement [37].
Many types of gas meters, regardless of whether they were put into service by type approval or by assessing compliance in accordance with the MID metrology directive [38], can be used formally for natural and artificial gas fuels also with hydrogen content (also coke oven gas) up to 59% (synthetic gas in group 1 according to EN 437 [30]). However, it cannot be unequivocally confirmed that despite the formal approval for the measurement of gaseous fuels with hydrogen content, the gas meters currently used will be resistant to higher hydrogen content values. If, after adding hydrogen, there are changes in the metrological characteristics of gas meters, this will affect the formation of UAG [37]. Currently, without comprehensive tests, it cannot be proven that the types of gas meters in operation will meet a number of legal and normative requirements, including those for the maximum permissible errors (MPEs) in the entire flow range (particularly at low flow rates) when measuring gas mixtures with hydrogen. Gas meters put into service based on the assessment of compliance with the MID metrological directive [38] generally meet the requirements of the relevant harmonized European standards, namely: EN 1359 [39] (diaphragm gas meters), EN 12,261 [40] (turbine gas meters), and EN 12,480 [41] (rotary displacement gas meters). The "Scope of the standard" section contains provisions according to which gas meters are intended to measure the volume of gaseous fuels of the first, second, and third groups (for diaphragm and rotary gas meters) and the first and second groups (for turbine gas meters) according to EN 437. In EN 437, the first group applies to artificial gases with a hydrogen content of up to 59%. Thus, it can be concluded that gas meters placed on the market and put into service after formal and legal compliance assessment can be used for natural gas mixtures with hydrogen content up to 59%.

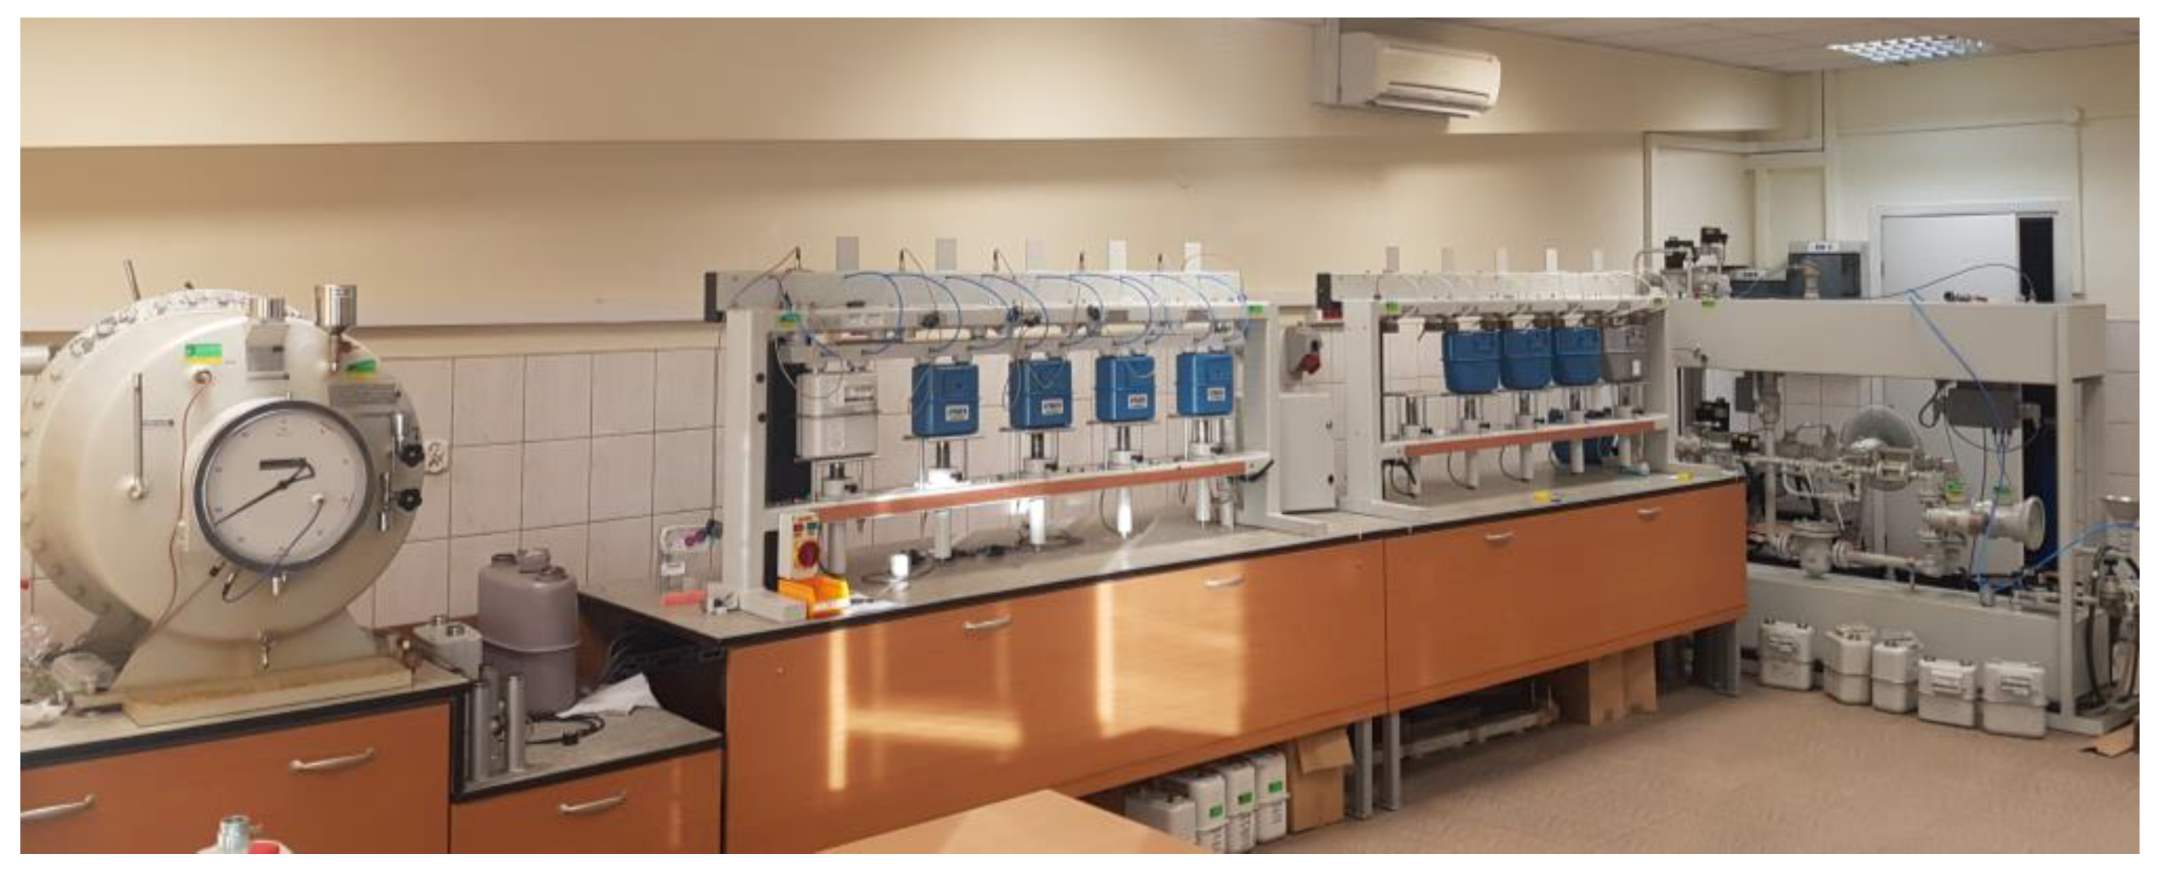
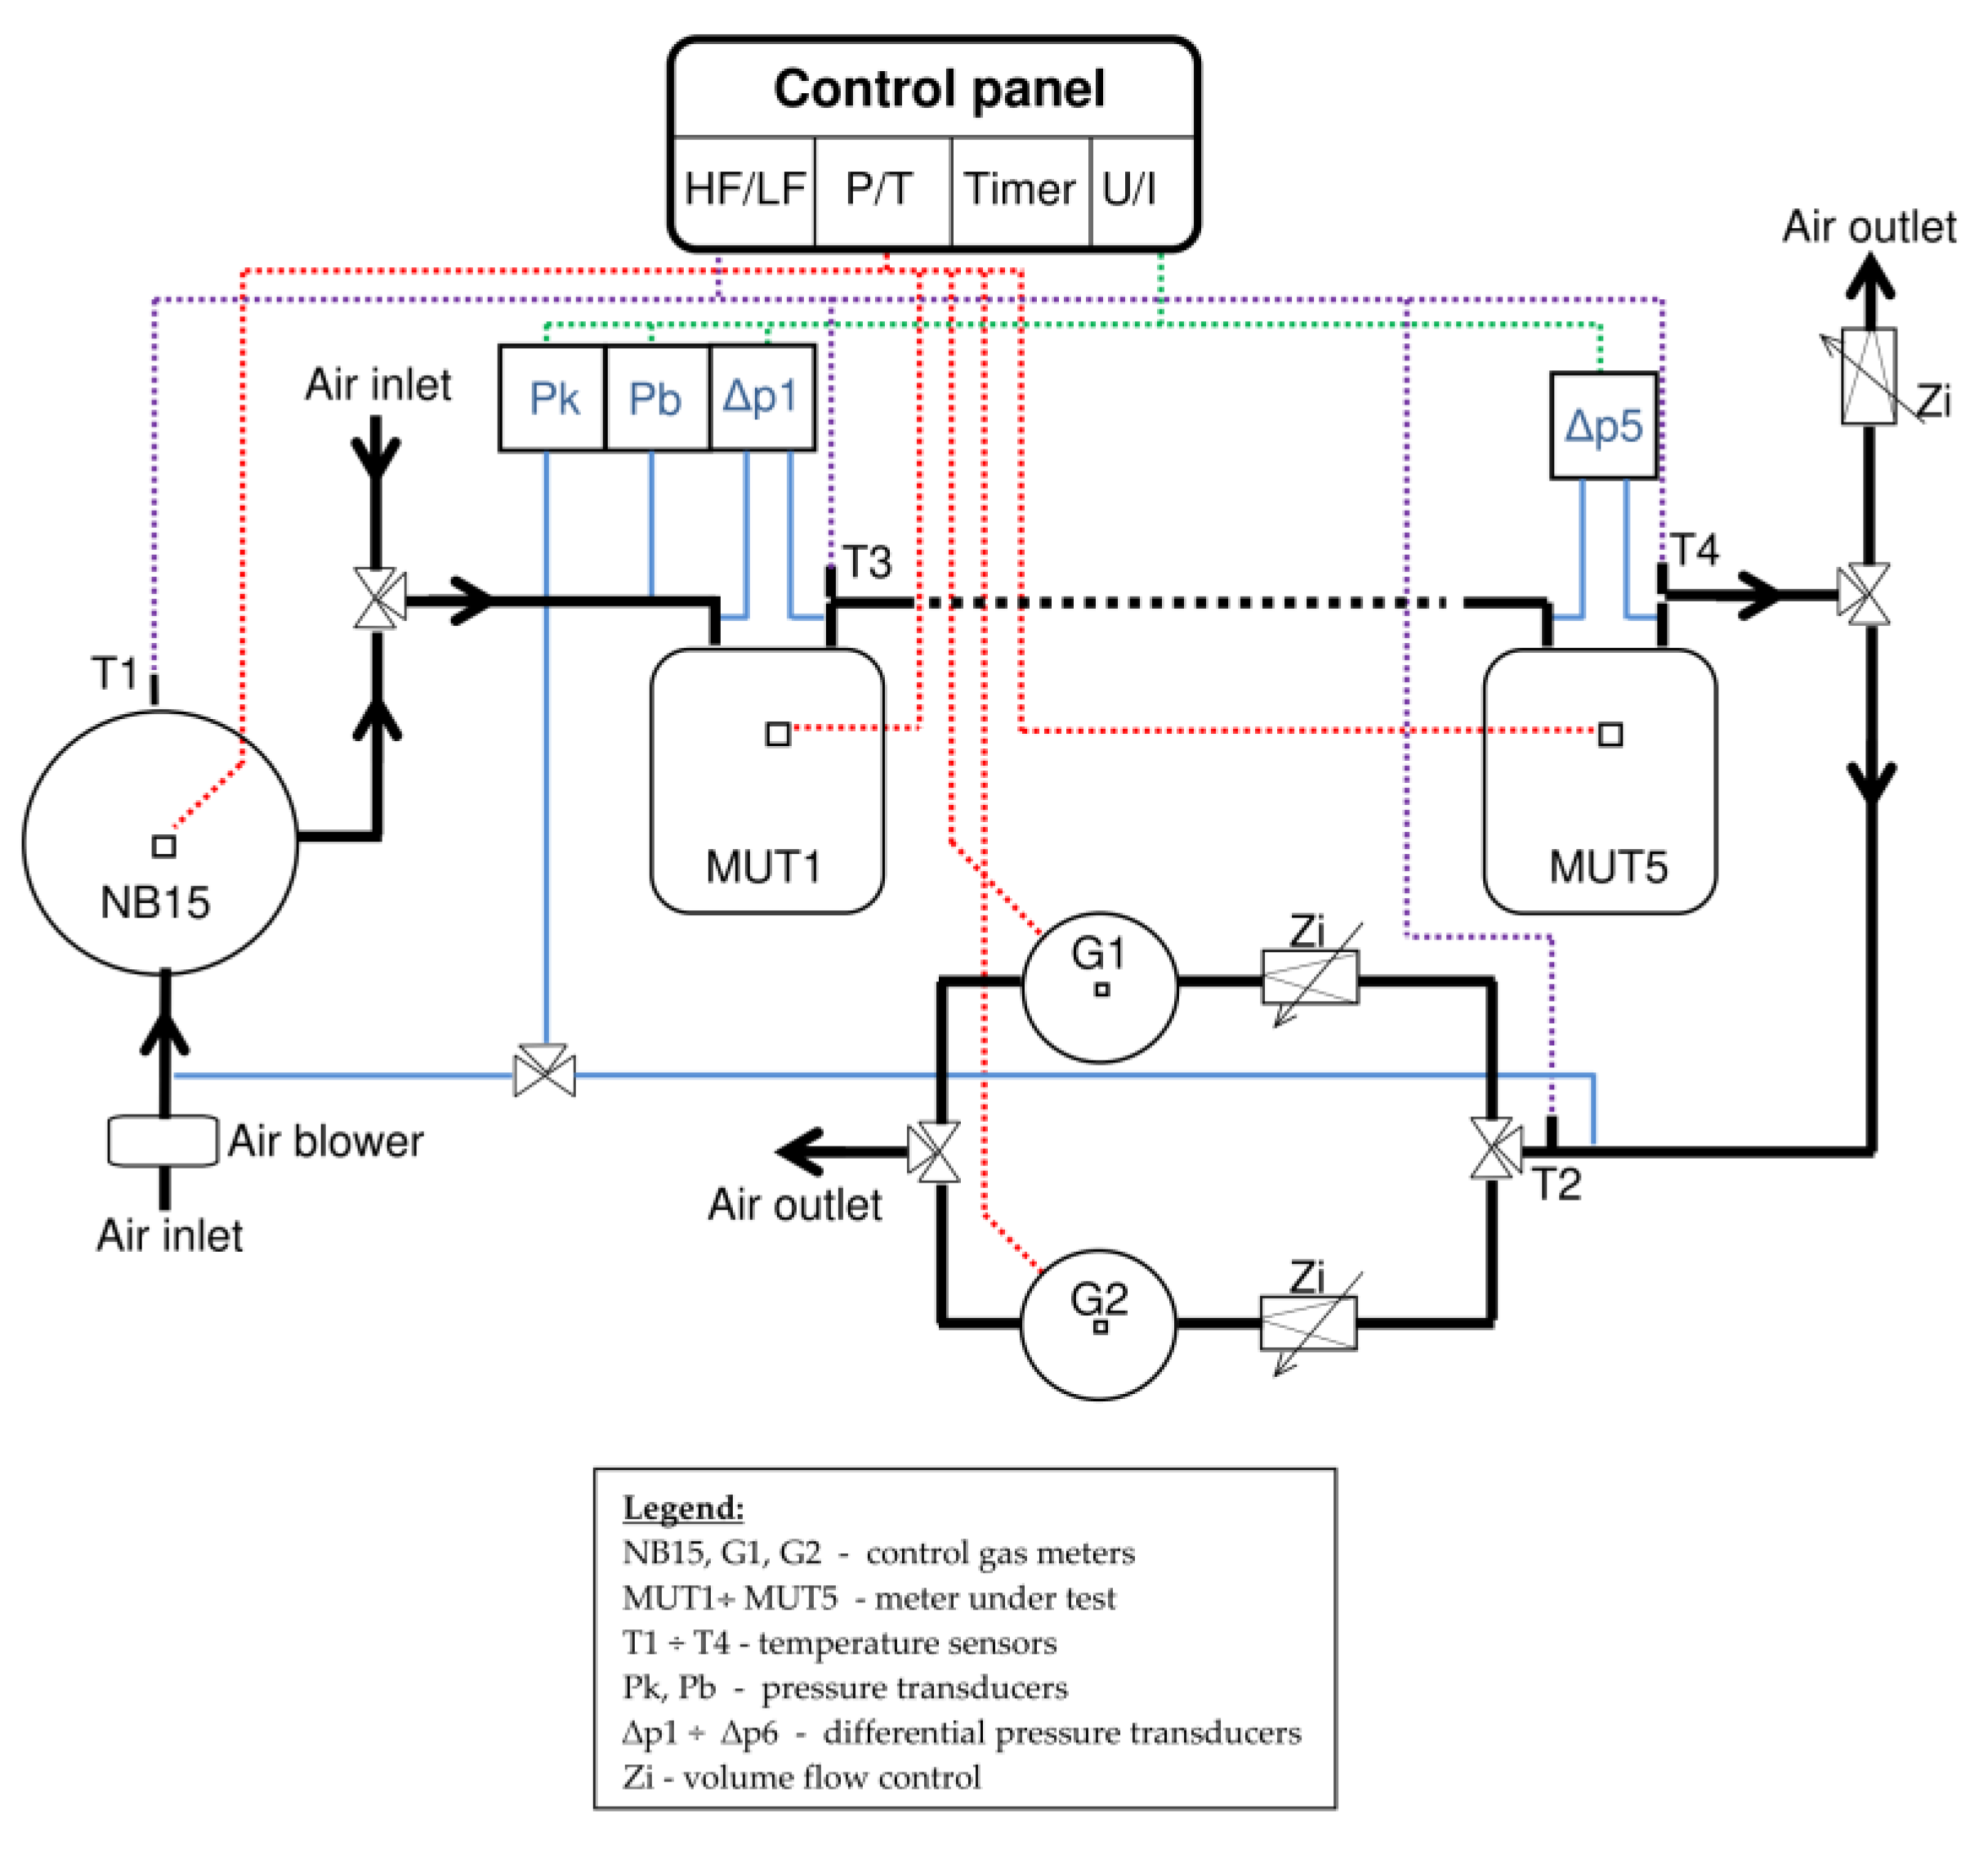
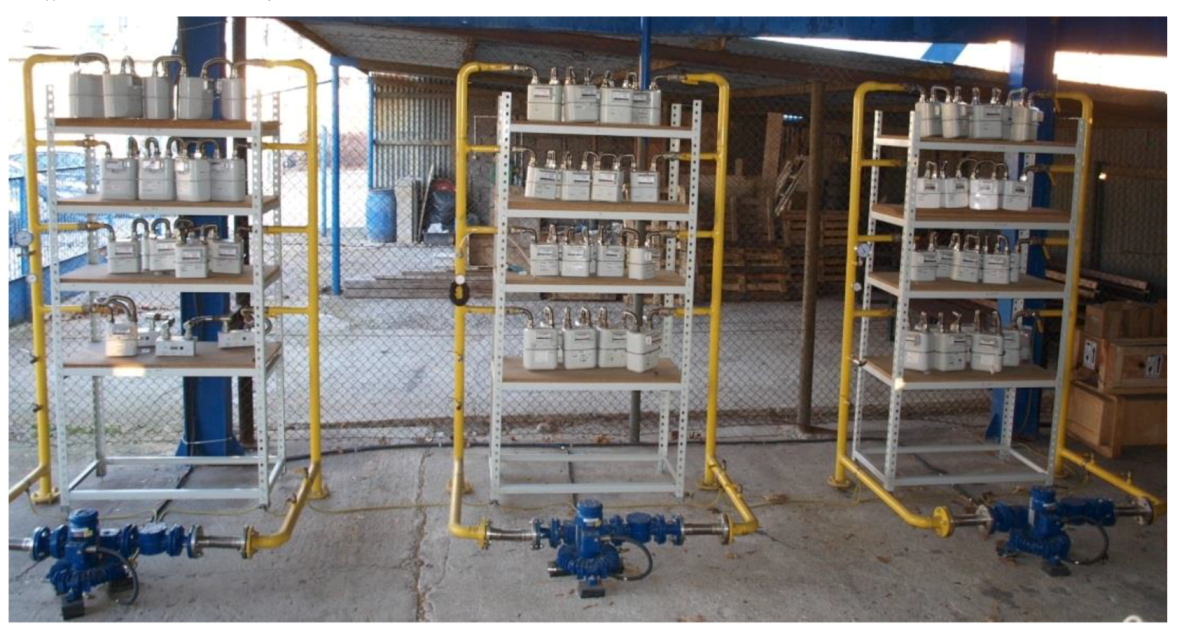
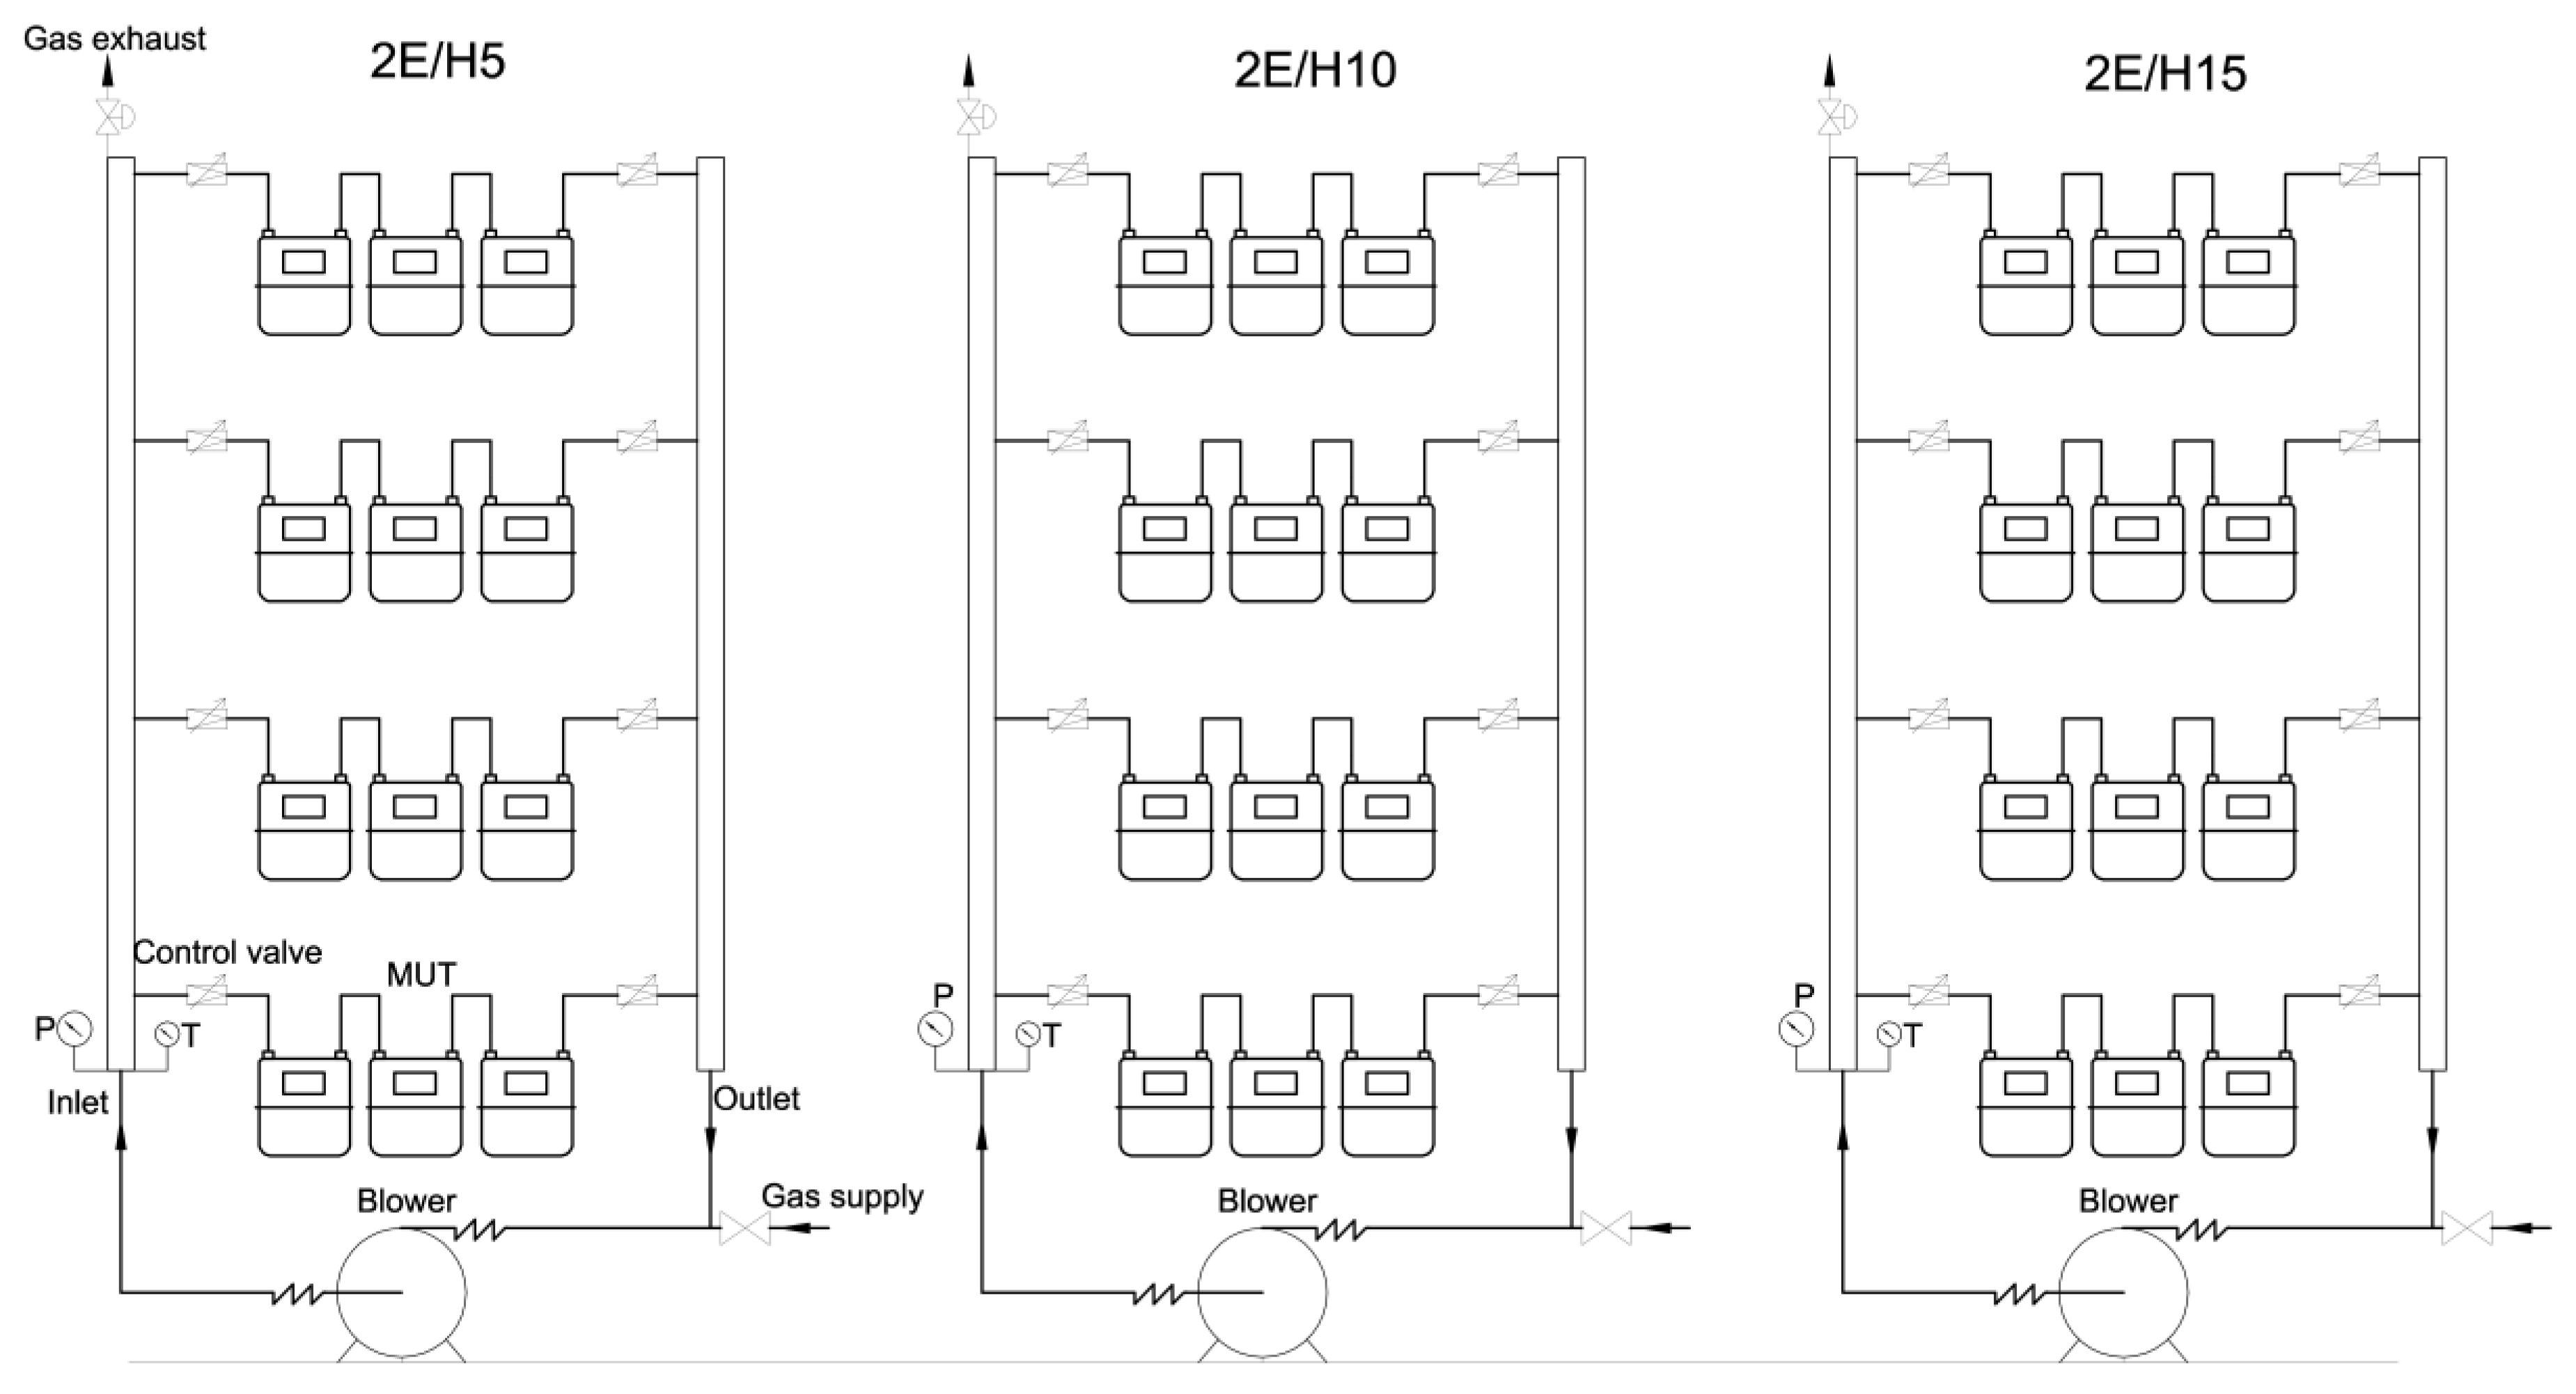
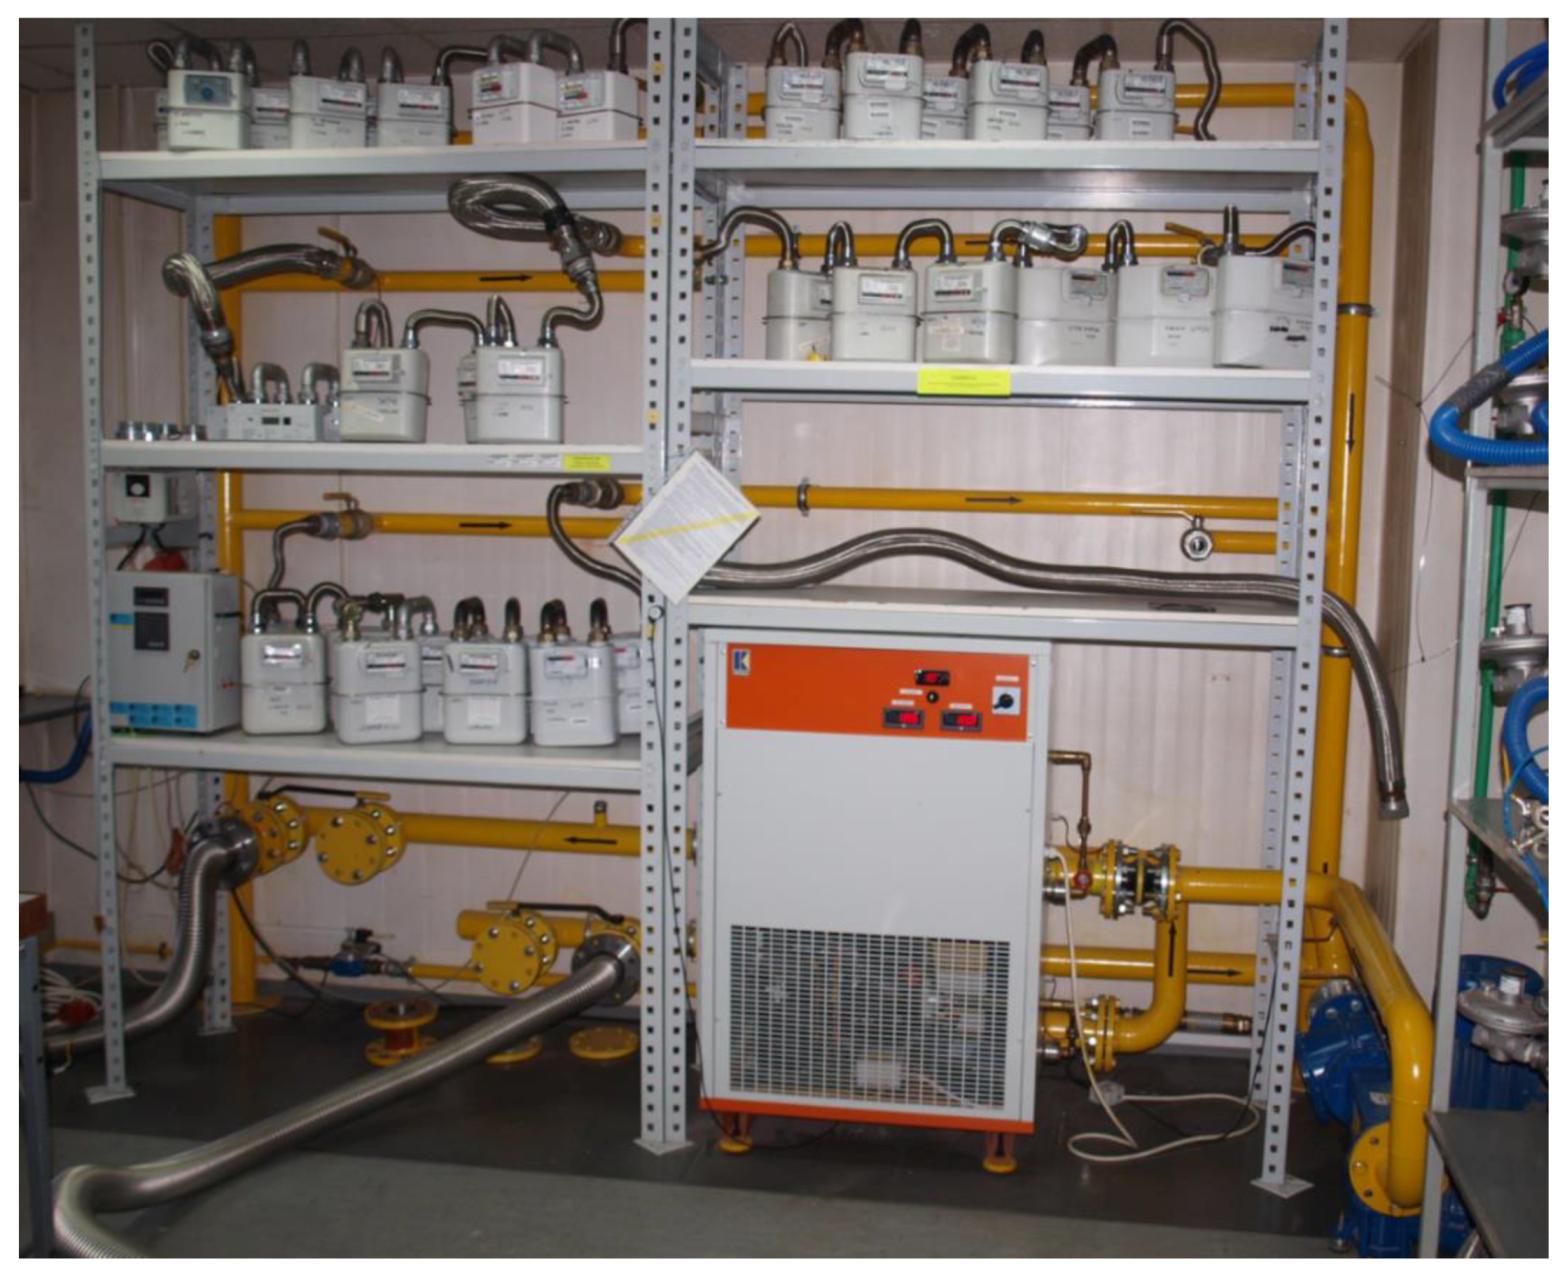
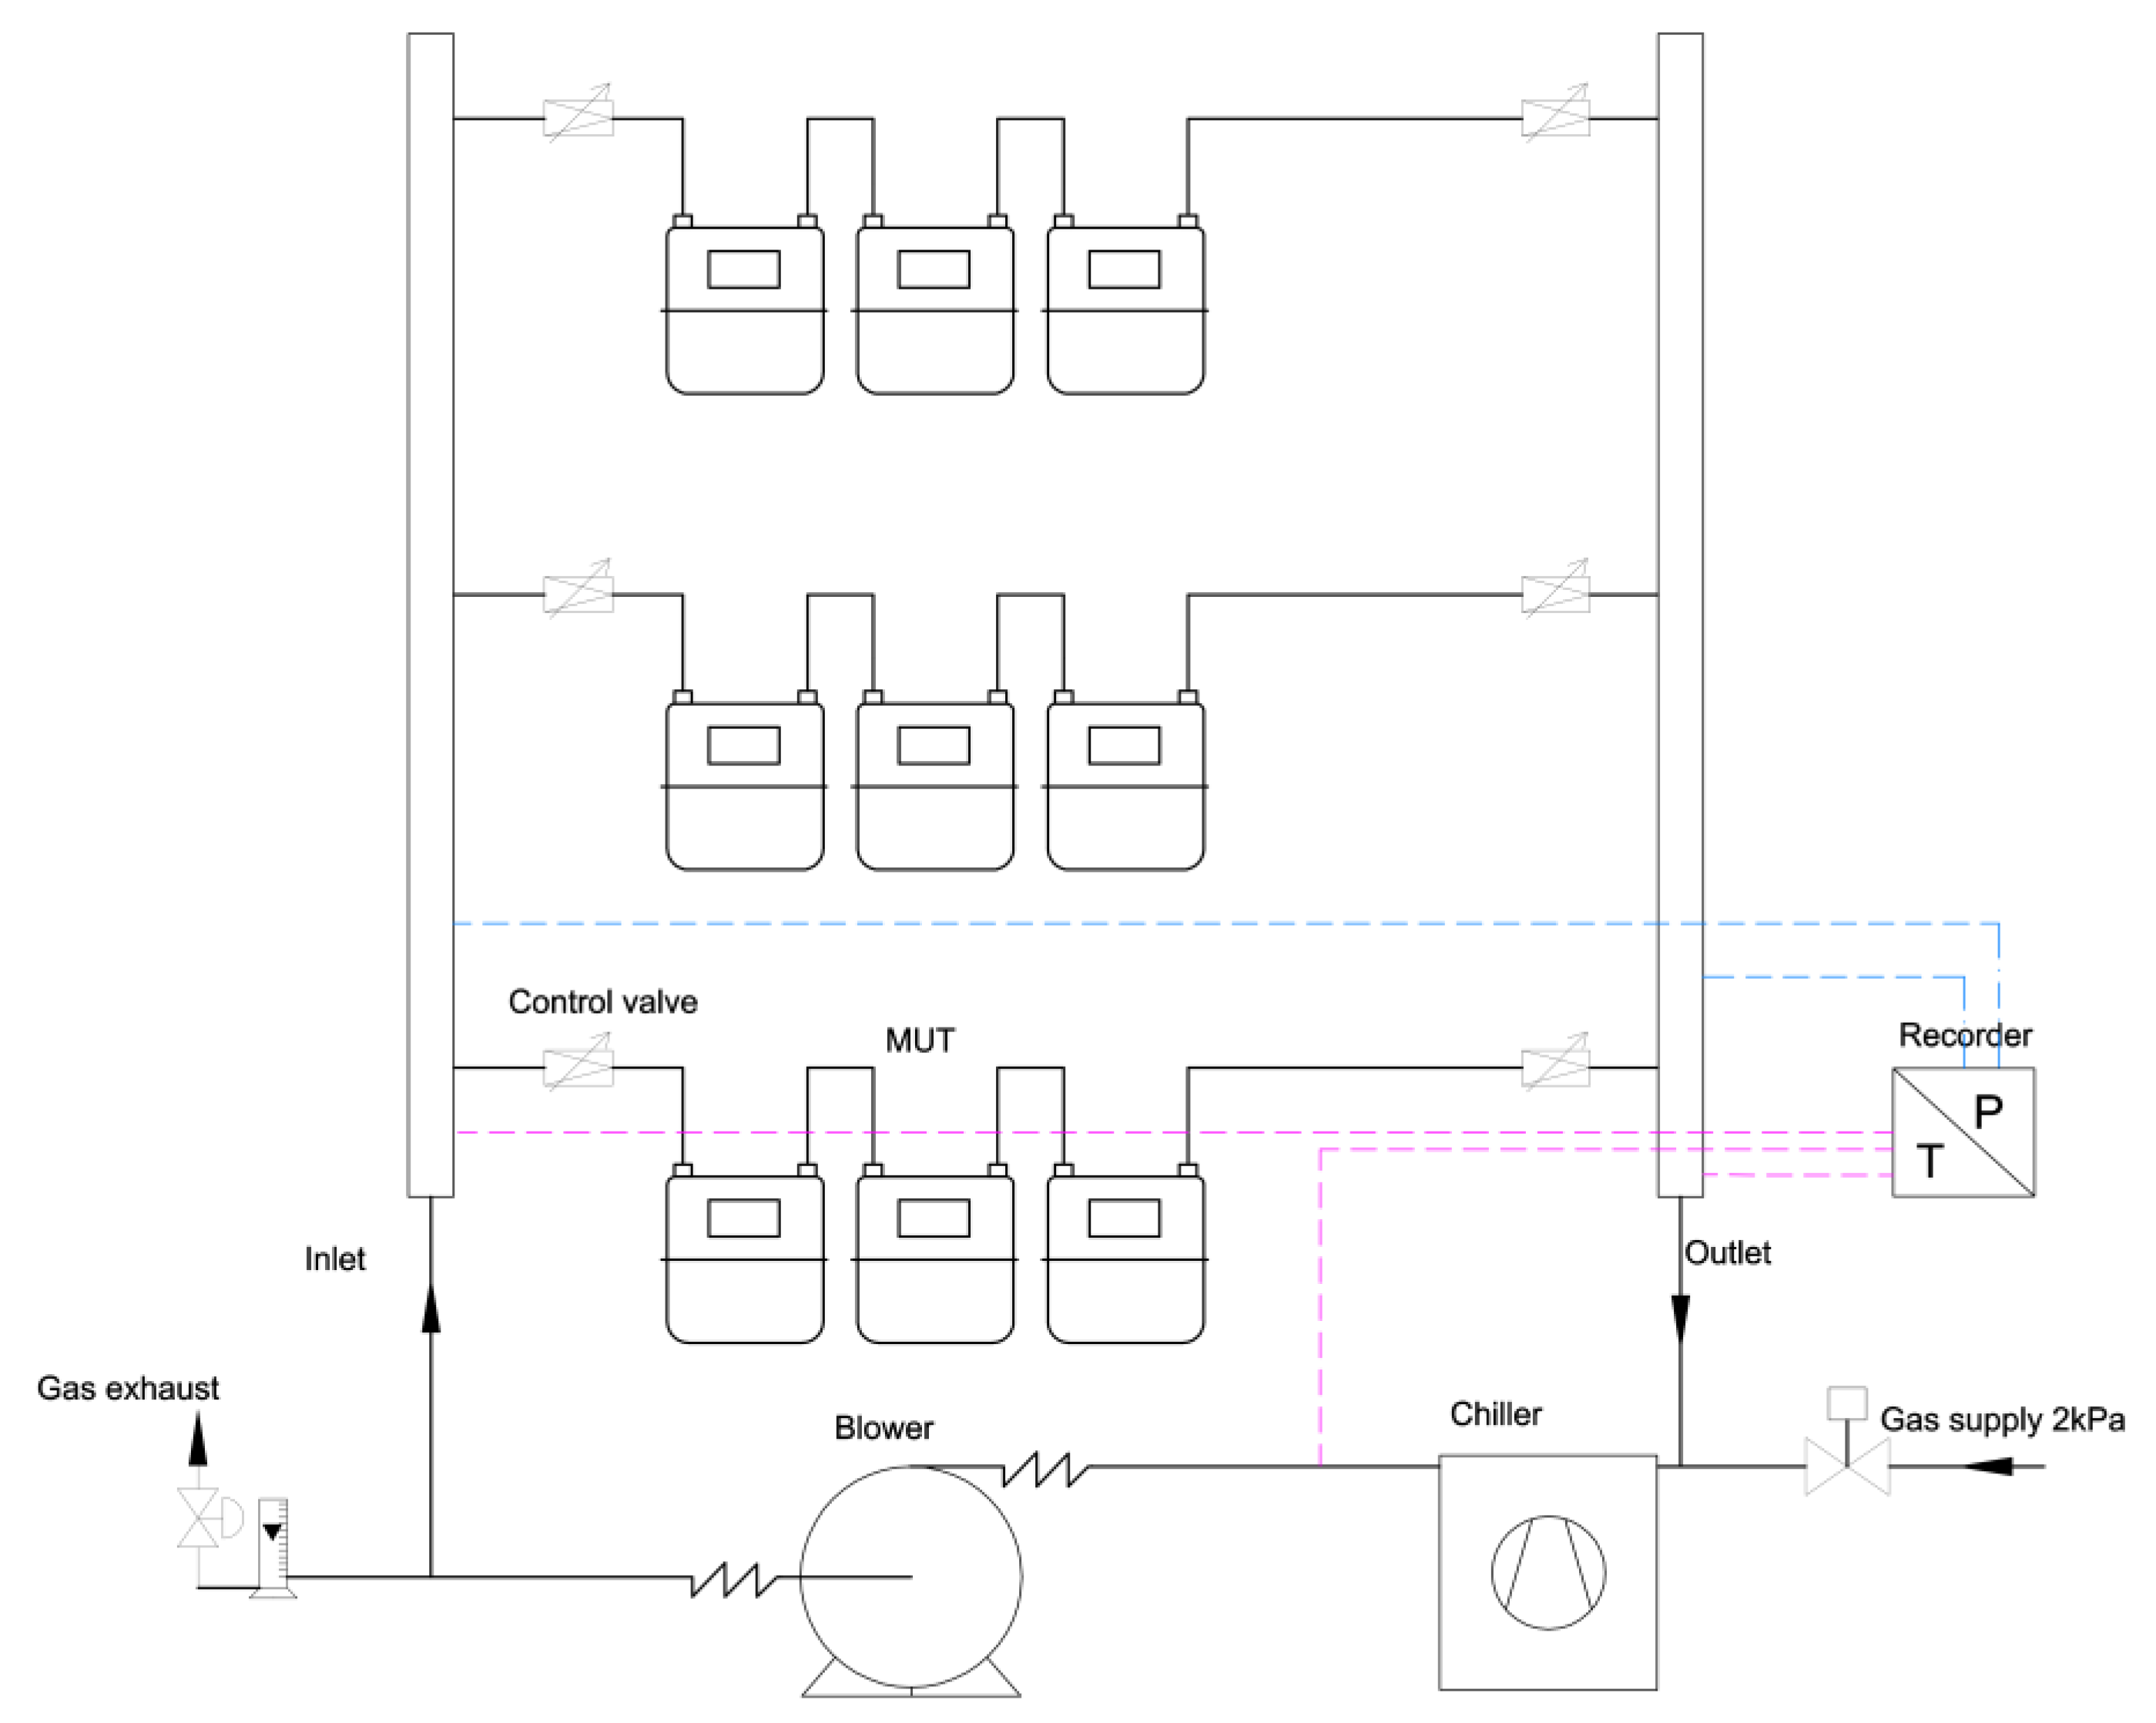
2. Materials and Methods

As mentioned in the introduction, due to the potential possibility of adding hydrogen to the gas network, it is necessary to confirm whether, within the expected hydrogen concentrations, long-term operation of gas meters will be ensured without compromising their metrological properties and operational safety. Since individual user groups account for the largest number of consumers on the gas markets, the main focus was on the problem of resistance of diaphragm gas meters as the most commonly used devices in this area.
Among the many technical requirements for diaphragm gas meters, it is very important to ensure the required durability. A gas meter, as a measuring device, is used for customer billing and must ensure the reliability of measurements throughout its lifetime. Diaphragm gas meters are subject to conformity assessment before placing on the market and putting in use. The problem of durability (long-term stability) of diaphragm gas meters is more widely described in publications [42,43].
Tests of diaphragm gas meter durability can be performed in accordance with normative documents, such as EN 1359:1998 and EN 1359:2017, or the recommendations of the International Organization of Legal Metrology (OIML) R 137-1&2:2012 [44]. The durability test methodology in accordance with EN 1359:1998 consists of passing through a gas meter a volume of natural gas of the equivalent volume that will flow for a period of 5000 hours at its maximum flow rate (maximum gas meter flow capacity). The test is performed using natural gas distributed through a distribution network at a pressure not exceeding the maximum working pressure of the gas meters. During the test, the errors of indications and gas pressure loss are checked after 250 hours, 2000 hours, 3500 hours, and 5000 hours. According to EN 1359, error of indication is a value that shows the relationship in percentage terms of the difference between the volume indicated by the meter and the volume that has actually passed through the meter, to the latter volume.
Another method of testing durability was recently introduced along with an update of EN 1359:2017 and is based on cyclic stream changes in accordance with the diagram below.
One 16-second operating cycle consists of the following periods of operation:
  • 2/3 Qmax; for 5 s,
  • 1/3 Qmax; for 3 s,
  • 3/3 Qmax; for 5 s,
  • No flow; for 3 s.
The test is continued for 450,000 work cycles.
For the durability test method according to EN 1359:2017, the working gas is air. During the test, the gas meters should be metrologically checked after 25,000, 150,000, 300,000, and 450,000 operating cycles to determine the error of indications and pressure loss using the same measuring equipment at which the initial errors were determined. The criteria for assessing the test results are the same as in EN 1359:1998. Manufacturers can also prove gas meter durability by performing tests in accordance with OIML Recommendations R 137-1&2:2012. The method consists of passing through the gas meter a volume of gas or air with a flow rate between 0.8 Qmax and Qmax corresponding to the volume that will pass in 2000 hours with a flow rate of Qmax. The test is performed using gas at a pressure not exceeding the maximum working pressure of the gas meters. The errors of indications are checked at the beginning and at the end of the gas meter durability test.
During work related to the determination of the effect of adding hydrogen to natural gas on the operational safety and accuracy of indications of diaphragm gas meters, the experience of the authors of this publication in the testing of gas meters, primarily in durability tests with various methods, was taken into account [43]. The studies and analyses carried out as part of the work [15] were the basis for formulating conclusions relevant in the context of adding hydrogen to the gas network.

Assumptions for the Study

The most important area of the study was subjecting the diaphragm gas meters to the long-term exposure of a mixture of natural gas and hydrogen. Operational safety was also checked by assessing the external tightness of gas meters after durability tests. The leak tightness test method was adopted in accordance with EN 1359 [39]. The test pressure was 1.5 times the maximum pressure of the gas meters, and the pressure drop was observed for 10 minutes on a 0.06 class pressure gauge. The test medium was air. As part of the study, the most frequently installed on the Polish market new types of gas meters in the PSG distribution operator network were used, along with the most commonly used meters dismantled from the network after about 10 years of operation (which corresponds to the current validity period in Poland). In the tests, the methodology for testing the durability of diaphragm gas meters based on EN 1359:1998 requirements was employed, since the required test medium in this method is network-quality natural gas and, therefore, this appeared to be the most suitable method for conducting the planned tests. A deviation from the standard method was applied with respect to ambient temperature during the test, since the durability tests were carried out in external temperature conditions (present in Krakow from May 2018 to date), at the location of the test installation together with gas meters, in a roofed area to protect them from rain and snow.
Prior to the commencement of experimental work, it was necessary to determine, on the basis of prior literature study and own research by INiG-PIB employees, what level of hydrogen content in natural gas in the distribution network in Poland can be initially acceptable. Thereby, two levels of allowable hydrogen content were determined: 23%, due to the operational safety of household appliances for preparing meals and domestic hot water, and 15%, due to the efficiency of combustion processes in those appliances [45]. Based on that information, the maximum hydrogen content of 15% was adopted in the study, and tests using three mixtures of Group 2E high-methane natural gas were selected (taken from the gas network of the PSG distribution system operator) with hydrogen concentration 5%, 10%, and 15% (V/V). The mixtures were marked as follows:
  • 2E/H0–2E natural gas mixture without hydrogen addition;
  • 2E/H5–2E natural gas mixture with 5% hydrogen content (V/V);
  • 2E/H10–2E natural gas mixture with 10% hydrogen content (V/V);
  • 2E/H15–natural gas mixture with 15% hydrogen content (V/V).
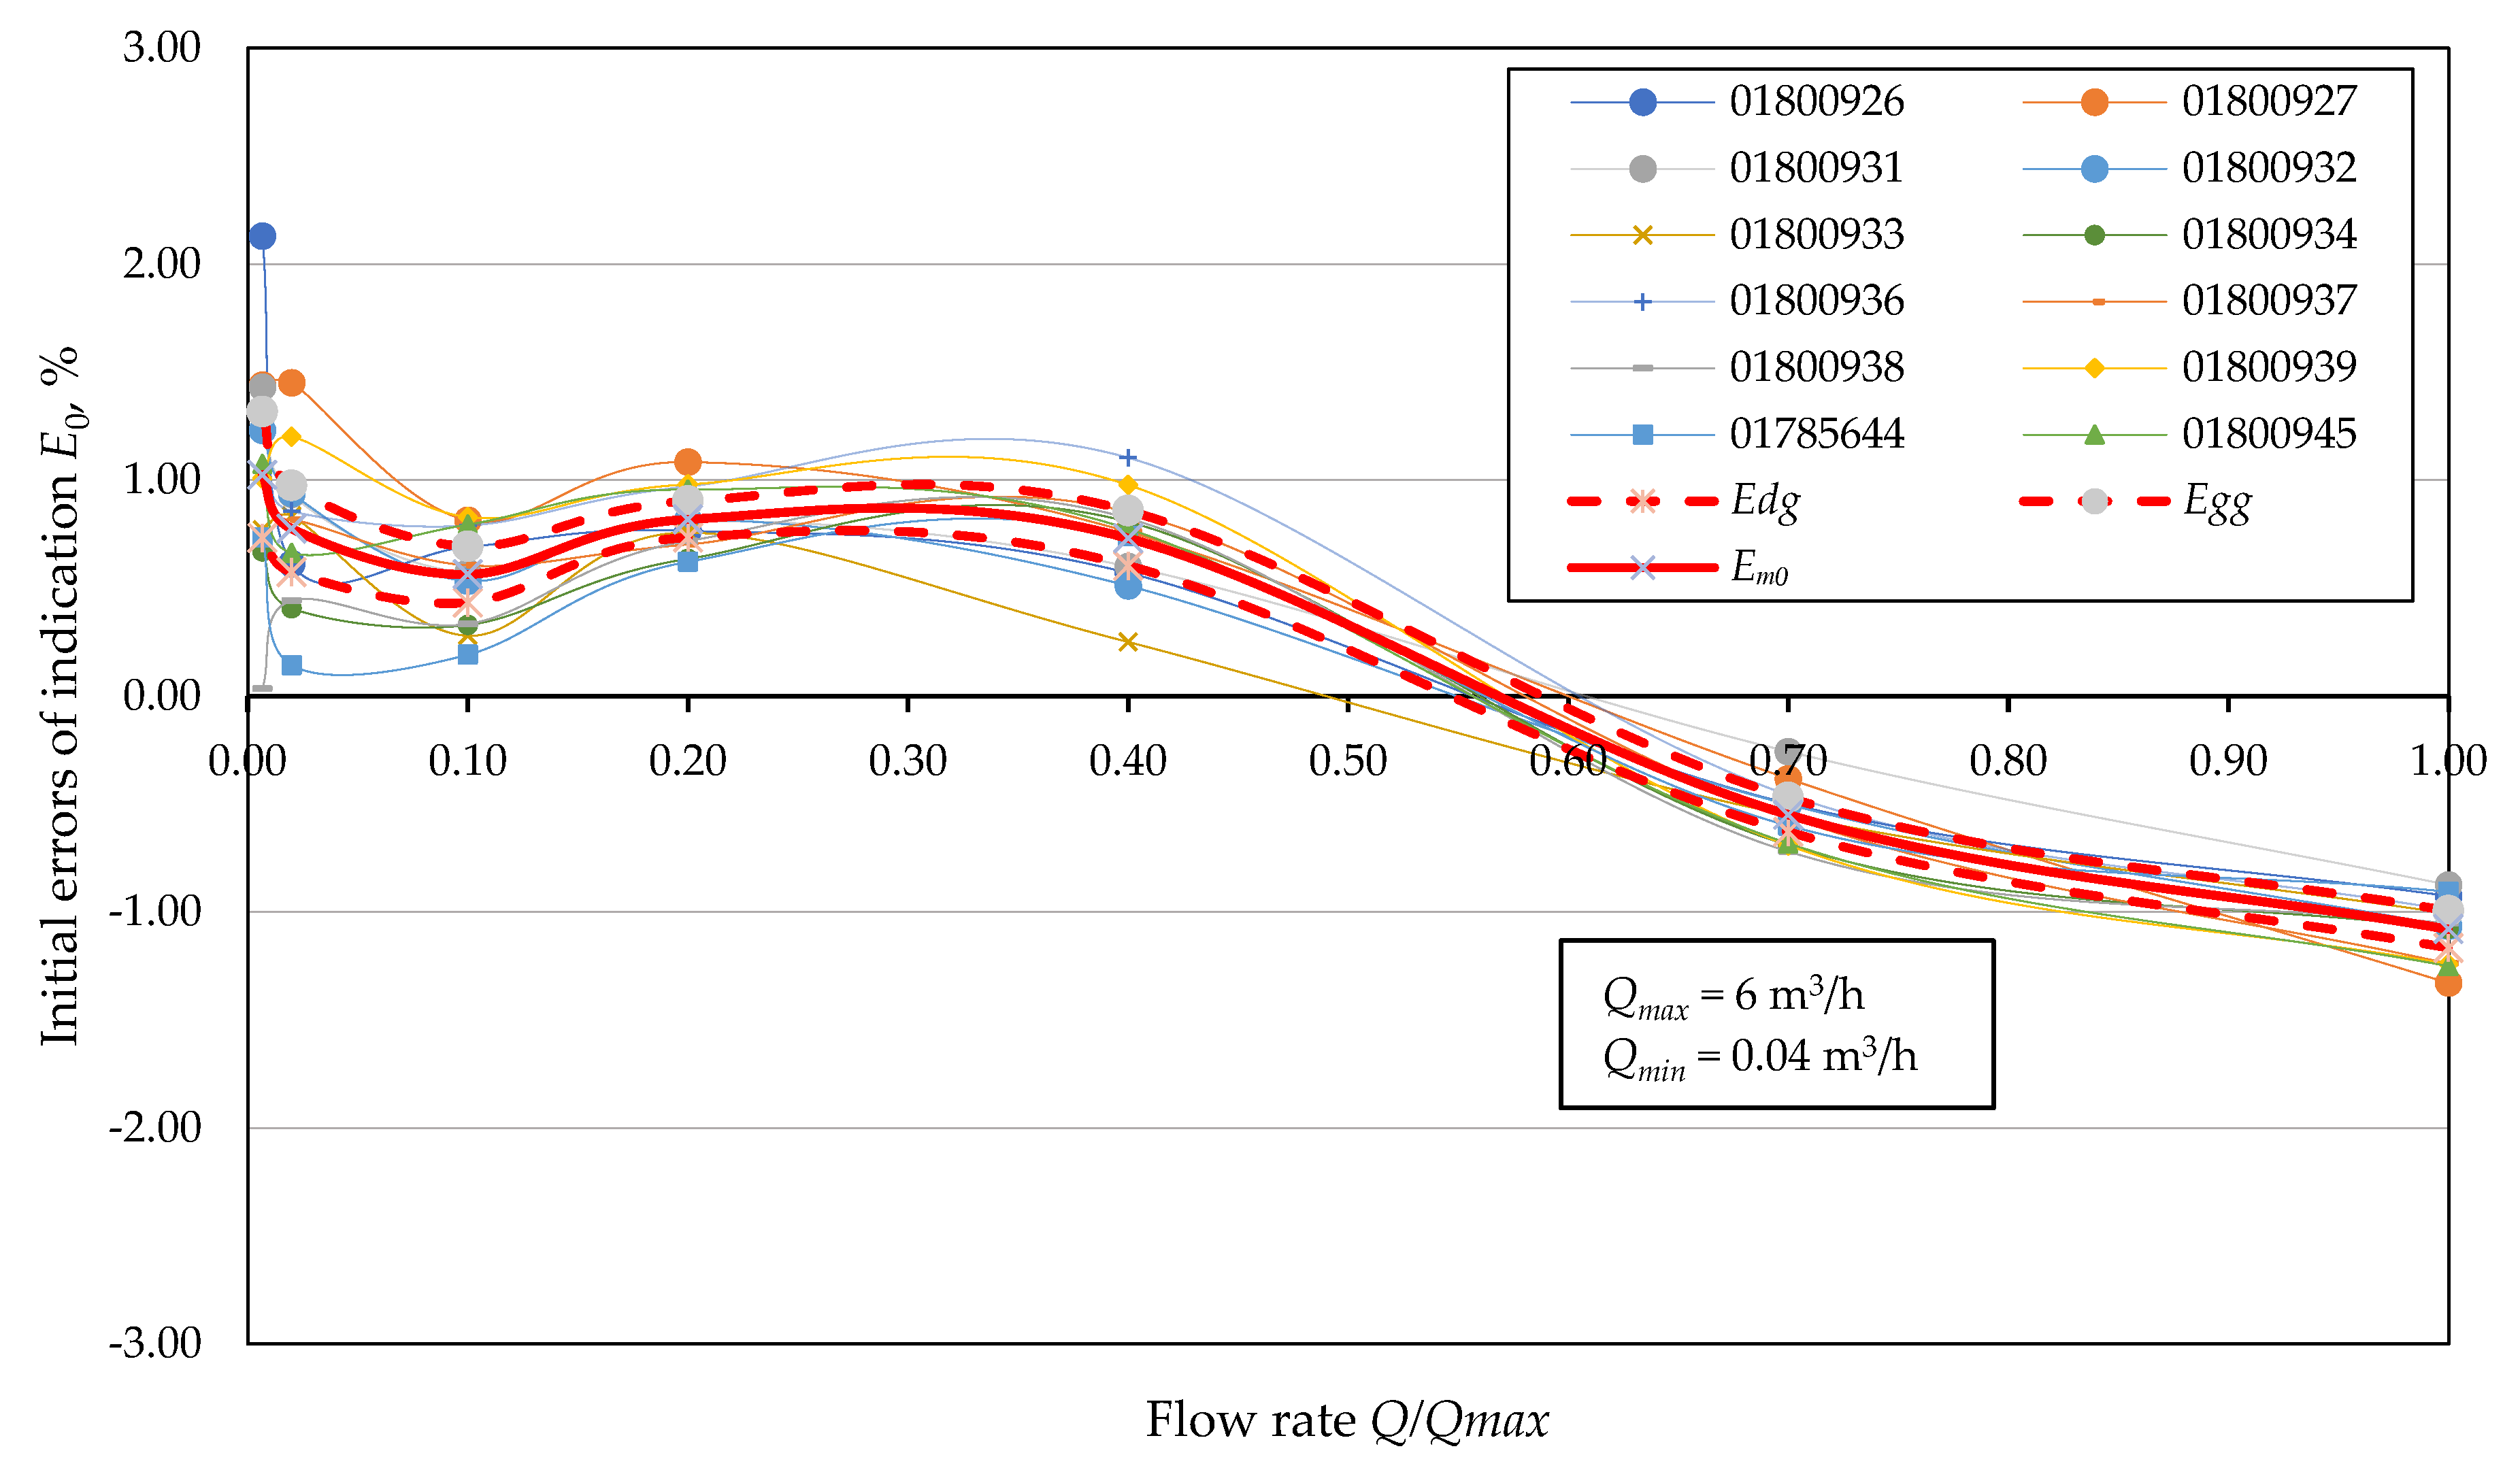
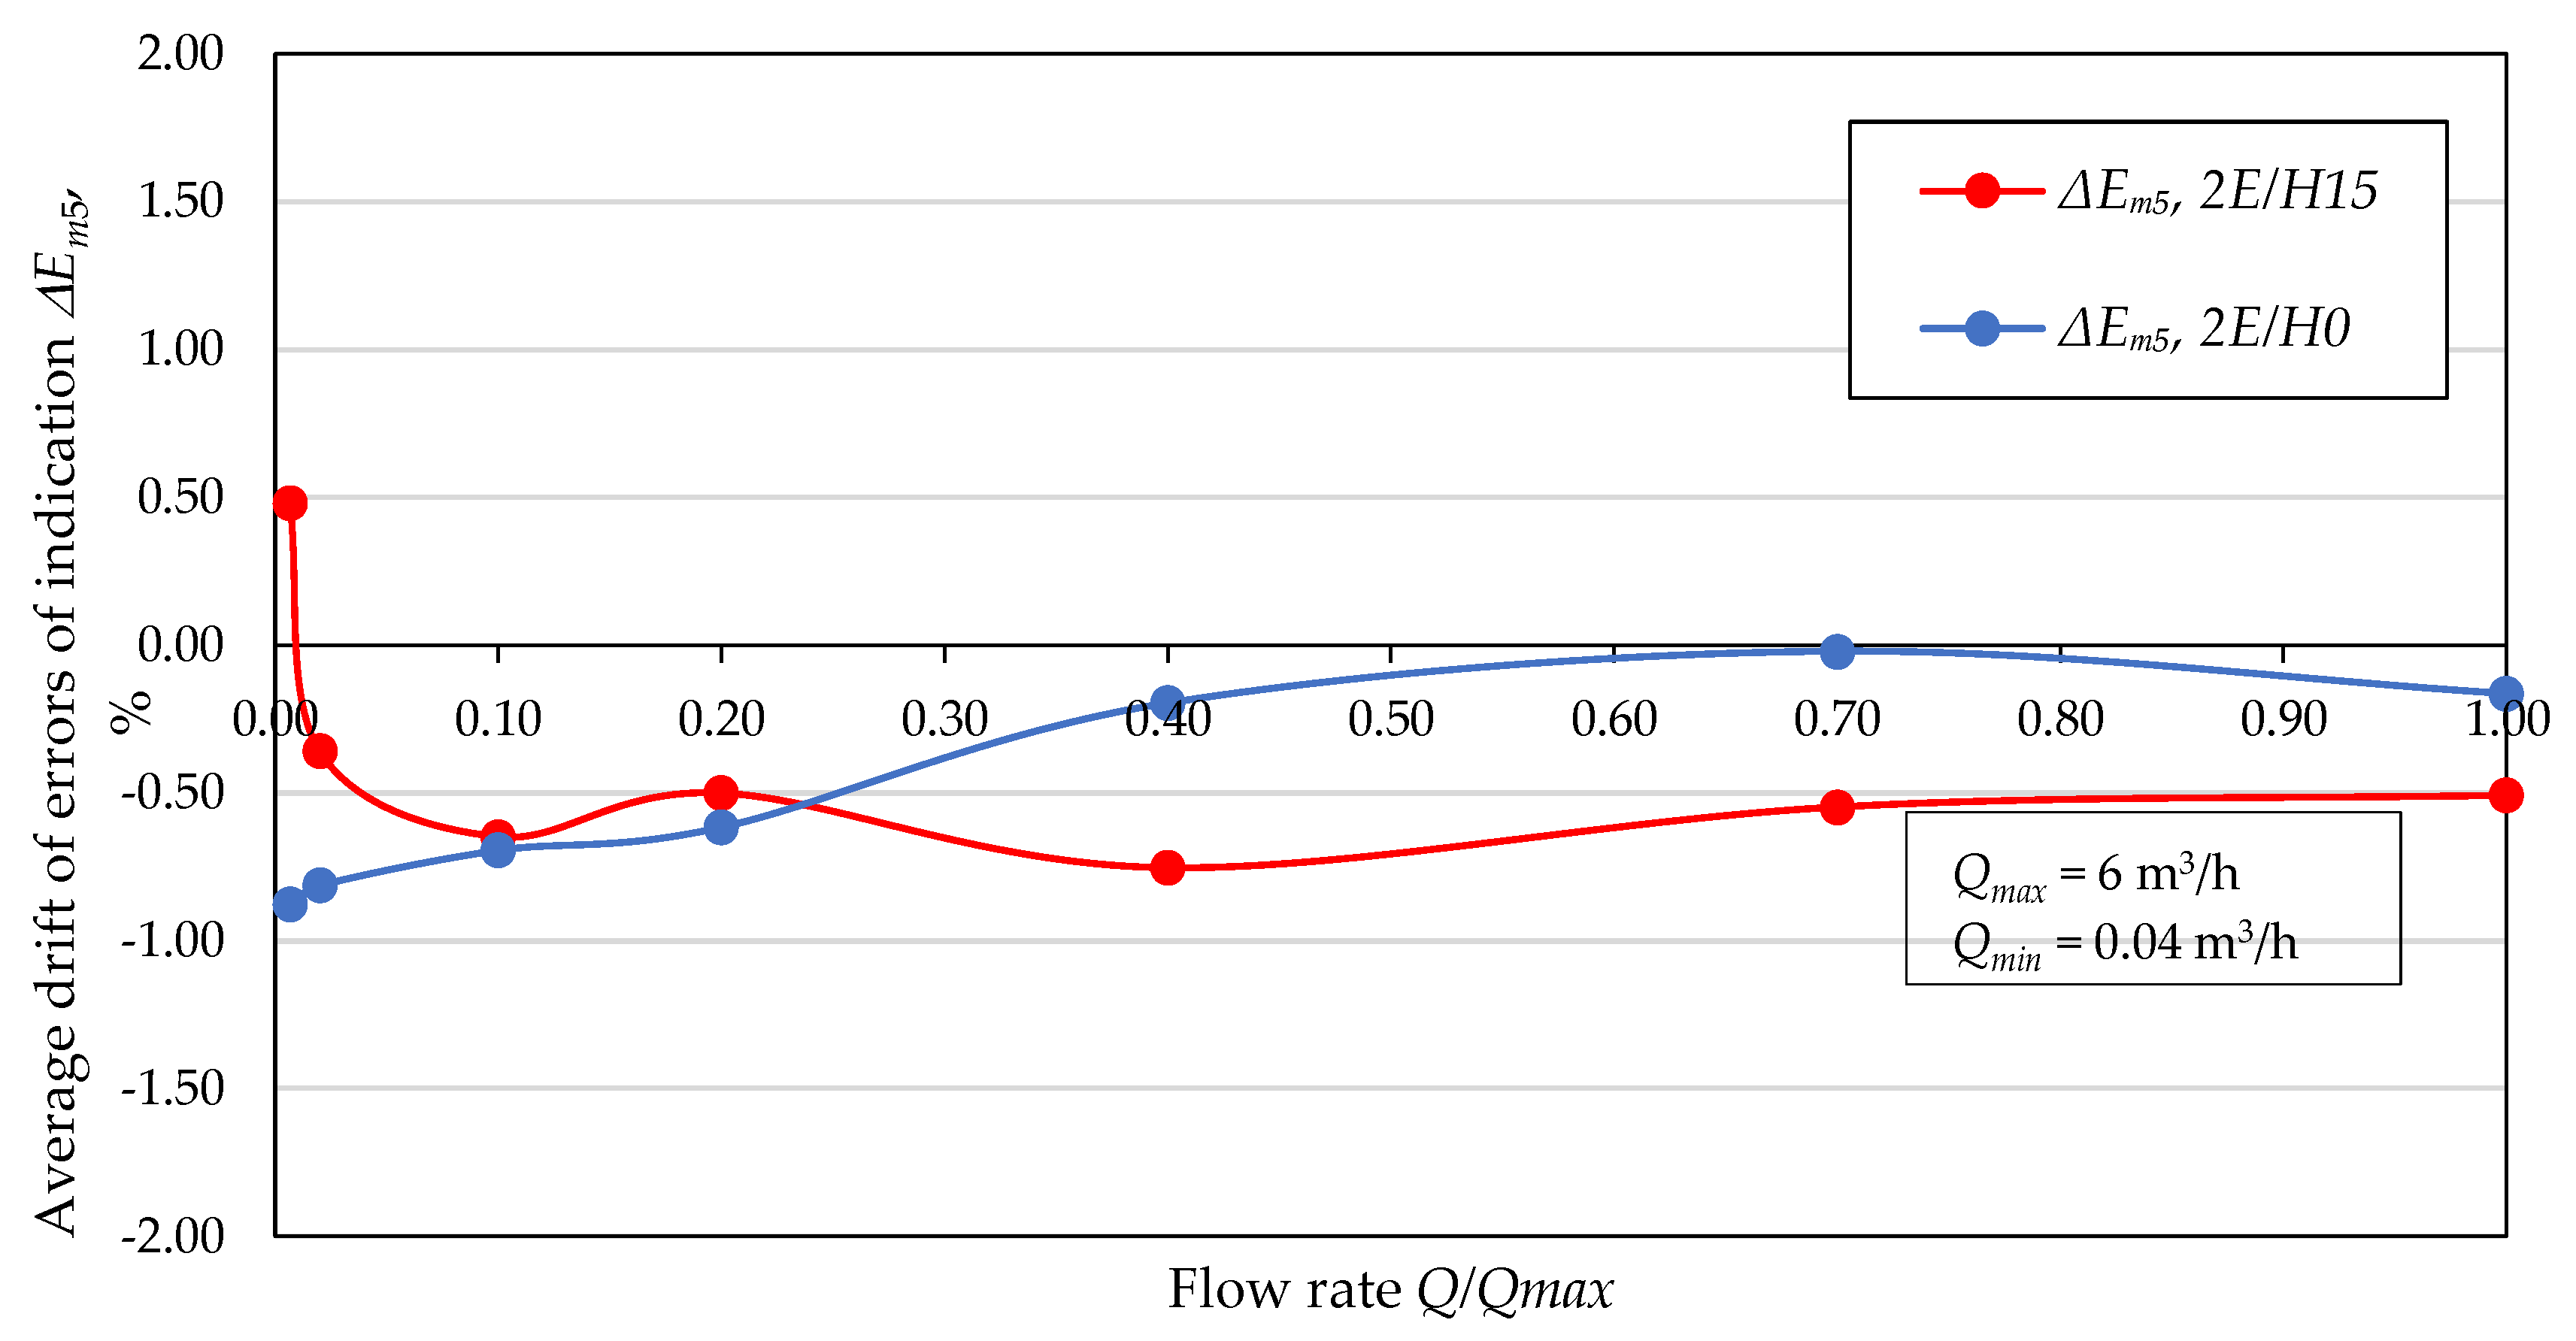
To produce appropriate gas mixtures, a gas mixing plant owned by the INIG-PIB Department of Fuel Usage was involved. The mixing plant is equipped with mass flow meters and mass regulators. It enables the preparation of gaseous mixtures, including mixtures of hydrogen gas with a maximum capacity of 7 m3/h (under working conditions 2 bars abs and 20 °C). Parameters of gas mixtures prepared were checked with an of RBM 2000 flammable gas analyzer (measurement of net or gross calorific value, Wobbe index, density, and minimum air requirement). Natural gas mixtures with hydrogen were prepared using natural gas from the distribution network and a hydrogen cylinder connected to the gas mixing plant. Then, the appropriate mixtures were brought to the test stand using an internal gas installation.
The test sample and a control sample for each type of gas meter consisted of three gas meters. The gas meters were selected based on size so as to correspond to the most frequently installed units for individual customers, also using gas fuel for heating buildings. Preliminary study pointed out the need to use gas meters of G4 size with a maximum flow rate of 6 m3/h, commonly used in gas systems for heating purposes in which higher annual gas consumption is expected.
The test sample consisted of gas meters subjected to the durability test using natural gas with the addition of hydrogen. The reference (control) sample included gas meters subjected to the durability test using high-methane natural gas from the group 2E without hydrogen addition, drawn from the distribution network of the PSG operator (marked as 2E/H0). Therefore, it was possible to establish whether the drift in errors when testing the durability of gas meters with the addition of hydrogen were different from the results obtained using natural gas without the addition of hydrogen and, thus, whether they resulted from the addition of hydrogen or from prolonged use. Before subjecting the gas meters to the durability test, after subsequent stages of the durability test and after completion of the 5000-h durability test, errors of indications and pressure loss values (in accordance with EN 1359) were determined for each gas meter, using the same test bench.
Determination of errors of indications (metrological characteristics) and pressure losses in gas meters was carried out using the methodology accredited by the Polish Centre for Accreditation (PCA) at the GH54 test bench. The equipment is located in the Laboratory of Flow Metrology at the Oil and Gas Institute – National Research Institute (INIG-PIB). It consists, among others, of DN15 and DN25 oval-circular gas meters and a NB15 wet drum gas meter with consistent measurement results. The temperature and pressure measurements of the air and ambient environment are carried out using measuring transducers (for temperature and pressure, respectively) connected to a microcontroller. The volume of air flowing through the control and test gas meters is registered in the form of pulses by the microcontroller connected with a PC-class computer. The working medium on the test bench is air, pressurized by means of a fan. The test bench is also equipped with devices for connection of the tested gas meters and regulating and switching fittings. The test bench is located in a laboratory room where appropriate environmental conditions are maintained and controlled. Measurement uncertainty in the flow rate range from 0.6 to 6 m3/h is about 0.3% and, in the range from 0.04 to 0.6 m3/h, it amounts to 0.4%. The test bench is automated and allows simultaneous testing of 5 gas meters while recording all thermodynamic parameters of the working medium. Figure 1 presents a general view of the GH54 metrological test bench and Figure 2 presents the GH54 test bench scheme.
Performing the work required construction of a bench for testing durability with the use of natural gas enriched with hydrogen. A general layout of the test bench is shown in Figure 3. The test bench consisted of three separate loops in which the durability test was carried out using 2E/H5, 2E/H10, and 2E/H15 natural gas mixtures with the addition of hydrogen. The test bench scheme for the durability test using 2E/H5, 2E/H10, and 2E/H15 natural gas mixtures with the addition of hydrogen is presented in Figure 4.
A general layout and scheme of the bench for testing gas meter durability using the 2E/H0 natural gas mixture is shown in Figure 5 and Figure 6.

3. Results

Figure 7 shows the results of tests on the initial errors of indications (E0) of type-1 gas meters. Twelve gas meters were tested (serial Nos. 01800926 to 01800945), three as the reference sample using the natural gas mixture without hydrogen addition (2E/H0) and three as a sample with the natural gas mixture with hydrogen at 5%, 10%, and 15% concentration (2E/H5, 2E/H10, and 2E/H15). Figure 7 also presents the values of the average initial errors of indications (Em0), the lower confidence interval limit of errors of indications (Edg), and the upper confidence interval limit of errors of indications (Egg) of type-1 gas meters as a function of flow rate (Q).
Table 2 and Table 3 show the average errors of indications of gas meters (Em0 ÷ Em5) subjected to the durability test using 2E/H0 and 2E/H15 gas mixtures, and average drift values are given (ΔEm0 ÷ ΔEm5) between errors in subsequent stages of the durability tests (250 h, 2000 h, 3500 h, and 5000 h) and average initial errors (Em0) for type-1 gas meters.
Figure 8 shows the average drift of errors of indications of the gas meters after a 5000-h durability test, using a 2E/H15 natural gas mixture with hydrogen (ΔEm5,2E/H15), together with the average drift of errors of indications of the gas meters tested using a 2E/H0 natural gas mixture without the addition of hydrogen (ΔEm5,2E/H0).

4. Discussion

The values of the initial errors of indication of individual gas meters presented in Figure 7 are typical for the type being tested. Near the gas meter Qmax, the errors of indication were negative and in the range from 0.2 Qmax to 0.4 Qmax; the gas meters’ indications were clearly overstated. In relation to the lowest flow rates, i.e., Qmin and 3 Qmin, the gas meters also had positive errors. In the case of other types of gas meters, it was often the case that the diaphragm meters had negative errors of indication in the lowest flow rate range.
The test results obtained were subjected to metrological assessment. The observed drift of errors of indications may have resulted from the impact of such factors as the amount of measured gas volume (which is directly related to the time of testing durability), the type of working medium used (gas with or without hydrogen at a certain concentration), or ambient temperature. Those changes may, to a small extent, also have resulted from the uncertainty of measurements.
Two criteria were applied to assess the obtained errors of gas meter indications, the first normative and the second metrological. The normative criterion resulted from the requirements of the subject standard EN 1359:1998 and stated that for gas meters subjected to the durability test:
  • Values of gas meter errors of indications determined during and after the durability test should be within the permissible maximum error limit (MPE) during the durability test;
  • Values of gas meter errors of indications determined during and after the durability test, within the flow rate range from 0.1 Qmax to Qmax may not differ by more than 2% from the corresponding initial values;
  • The maximum value of the pressure loss in a gas meter should not be greater than that given in the "after durability test" column (in the operating conditions); and
  • After the durability test, all gas meters should maintain external tightness.
Considering the normative criteria, it can be stated that all type-1 gas meters tested met the requirements provided in EN 1359:1998.
To determine the metrological criterion for assessing the impact of hydrogen content in natural gas on the drift of errors of indications (metrologically significant or metrologically insignificant), the measurement uncertainty for individual flow rates and individual types of gas meters was estimated. Then, the uncertainty in determining the difference in the average drift of errors of indications of the gas meters tested using a 2E/H5, 2E/H10, and 2E/H15 natural gas mixture with hydrogen and gas meters tested using a 2E/H0 natural gas mixture without addition of hydrogen was estimated:
U ( Δ E m H m 2 E ) = U 2 ( E m H ) + U 2 ( E m 2 E )   [ % ]
where:
  • U(ΔEmH-m2E) represents uncertainty in determining the difference in the average drift of errors of indications of the gas meters subjected to the durability test using a 2E/H5, 2E/H10, and 2E/H15 natural gas mixture with hydrogen and a 2E/H0 natural gas mixture without the addition of hydrogen [%];
  • U(EmH) is uncertainty in determining the difference in the average drift of errors of indications of the gas meters subjected to the durability test using a 2E/H5, 2E/H10, and 2E/H15 natural gas mixture with hydrogen [%]; and
  • U(Em2E) is uncertainty in determining the difference in the average drift of errors of indications of the gas meters subjected to the durability test using a 2E/H0 natural gas mixture without the addition of hydrogen [%].
If the obtained difference in the average drift of errors of indications is within the estimated uncertainty (U(ΔEmH-m2E)), it should be considered metrologically insignificant. Otherwise, it should be considered metrologically significant.
Table 4 presents the average drift of errors of indications after a 5000-h durability test for the 2E/H0 gas meter control sample and for the test sample 2E/H15 and the resulting differences in the average drift of errors of indications ΔEmH-m2E, together with the metrological assessment of the drift.
When testing type-1 gas meter durability over a period of 5000 h with a 2E/H15 natural gas mixture with hydrogen, metrologically insignificant differences in the average drift of errors of indications compared to the 2E/H0 control sample were found, in the range of flow rates from 3 Qmin to Qmax. For the flow rate Qmin, significant differences were found in the average drift of errors of indications between the 2E/H0 control sample and the 2E/H15 test sample. However, it should be noted that the allowable difference in drift was exceeded by a very small amount (0.07%).
A statistical analysis of the results obtained was also carried out. To check whether the hydrogen content in natural gas can change the average drift of errors of indications of the gas meters after being subjected to a durability test, a one-way ANOVA variance analysis was employed. The calculations were carried out using STATISTICA 9 software.
Table 5 shows the results of the one-way analysis of variance for type-1 gas meters after the 5000-h durability test using different gas mixtures (2E/H5, 2E/H10, 2E/H15, and 2E/H0).
For post hoc tests, the groups having statistical differences were pointed out. The symbol "X" means no differences, while in the case of differences, it was stated between which groups of results they occurred.
Since for flow rates from Qmin to Qmax, with the exception of flow rate 0.7 Qmax, the level of significance corresponding to the calculated value of Fisher–Snedecor (FS) statistics for the considered hydrogen concentrations in the gas exceeded the assumed value of 0.05, then the hypothesis H0 of the equality of changes in average errors of indications for the respective flow rates were assumed.
Significance levels corresponding to the calculated Brown–Forsythe statistics were greater than the assumed value of 0.05 for flow rates from Qmin to Qmax and, therefore, the hypothesis about the equality of variance in groups was adopted, which confirmed the methodological correctness of the conducted variance analysis.
Since for the flow rate of 0.7 Qmax the level of significance corresponding to the calculated value of the Fisher–Snedecor (FS) statistic for the considered hydrogen concentrations in the gas did not exceed the assumed value of 0.05, the hypothesis on the equality of changes in the average errors of indications for the flow rate 0.7 Qmax was rejected, and the one indicating that the values of the average drift of errors of indications are different was assumed instead. The difference between the average drift of errors of indications for the flow rate of 0.7 Qmax was 0.53%. Given the total uncertainty of determining the difference in average drift of errors of indications of ± 0.66%, such a difference should be considered negligible (metrologically insignificant).
Table 6 provides also the weighted mean errors (WMEs) determined in accordance with OIML Recommendations R137-1&2:2012 [45] for the gas meters tested in samples 2E/H0 and 2E/H15, before undergoing the durability test and after the 5000-h durability test.
In line with the requirements of OIML R 137-1&2: 2012 art. 5.4., the WME weighted mean error, when testing the initial errors for class 1.5, the gas meters should be within ± 0.6%. Analyzing the WME figures shown in Table 6, it should be stated that all gas meters met the WME criterion before the durability test. For errors of indications determined in use (after the durability test), no admissible WME values were determined and they were not subject to assessment. However, it can be noted that the WME values, after testing the durability of gas meters using the mixture of natural gas with hydrogen 2E/H15, were comparable to the WMEs of gas meters tested using the mixture without hydrogen 2E/H0, except for one meter, no. 01785644, whose WME after the 5000-h durability test was positive (0.06%), since, after the durability test, its errors of indication for the flow rates Qmax and 0.7 Qmax, unlike the other gas meters, shifted slightly towards the positive direction.

5. Conclusions

Implementation of the project allowed testing the durability of diaphragm gas meters for various mixtures of high-methane natural gas enriched with hydrogen. The tests were carried out for the 2E natural gas mixture with the following hydrogen concentrations: 0%, 5%, 10%, and 15% (V/V). Based on the tests carried out on new gas meters, size G4 type-1, the following conclusions can be drawn.
  • For the gas meters tested, no significant metrological difference was found between the obtained average drift of errors of indications after the durability test using natural gas mixtures with different hydrogen concentration(from 0% to 15%). However, there was a significant metrological impact of prolonged operation of the gas meters on their errors of indications, but it should not be considered as dependent on the hydrogen concentration in the gas but rather on the wear of the internal components of the gas meters during the durability test, which were indicated by the analysis of the results of the durability tests using a natural gas mixture without a hydrogen addition. The average drifts of errors of indications observed with the use of the 2E/H0 natural gas mixture were noticeable despite the lack of hydrogen addition in that mixture.
  • During the durability tests, no damage was found that would compromise operational safety. All gas meters remained airtight after the durability tests.
  • Analyzing the literature, it was found that for technologies other than diaphragm gas meters, e.g., thermal gas meters, since the addition of hydrogen to natural gas causes a change in the physicochemical properties of the gas mixture (including a change in density), this may result in exceeding the maximum permissible errors. Therefore, during the potential implementation of thermal gas meters in Poland, the above problem should be analyzed in detail and the gas meters’ suitability for measuring such gas mixtures should be verified with tests.
According to the experiences gained during the study, the method of testing the durability of gas meters using a gas mixture with hydrogen instead of testing them with air is justified. The tests conducted were limited to a pilot sample and constitute an initial proposal for further tests, e.g., by expanding the tested types of gas meters, increasing the number of tested equipment, and continuing the tests. Currently, tests of gas meters, both new and after 10 years of operation, are conducted in order to achieve 10,000 h of continuous operation.

Author Contributions

Conceptualization, J.J. and P.K.; formal analysis, P.K. and T.B.; funding acquisition, J.J.; investigation, P.K.; methodology, J.J. and P.K.; supervision, J.J. and P.K.; validation, J.J.; visualization, P.K.; writing—original draft, J.J., P.K. and T.B.; writing—review and editing, J.J. and P.K. All authors have read and agreed to the published version of the manuscript.

Funding

The research received, as a part of the statutory work commissioned by the Ministry of Science and Higher Education, order no. 0057/GM/18 and 0079/GM/19, archival numbers DK-4100-0057/18 and DK-4100-68/19.

Conflicts of Interest

The authors declare no conflict of interest.

Nomenclature

Eerror of indications of the gas meter, [%]
Emaverage errors of indications of the gas meter, [%]
Edglower confidence interval limit of errors of indications of the gas meters, [%]
Eggupper confidence interval limit of errors of indications of the gas meters, [%]
E0initial errors of indications of the gas meter, [%]
Em0average initial errors of indications of the gas meters, [%]
Em1average errors of indications of the gas meters after 250 hours of work
Em2average errors of indications of the gas meters after 1000 hours of work; [%]
Em3average errors of indications of the gas meters after 2000 hours of work; [%]
Em4average errors of indications of the gas meters after 3500 hours of work; [%]
Em5average errors of indications of the gas meters after 5000 hours of work; [%]
MPEmaximum permissible errors, [%]
ΔEm1average drift of errors of indications of the gas meters after 250 hours of work; [%]
ΔEm2average drift of errors of indications of the gas meters after 1000 hours of work; [%]
ΔEm3average drift of errors of indications of the gas meters after 2000 hours of work; [%]
ΔEm4average drift of errors of indications of the gas meters after 3500 hours of work; [%]
ΔEm5average drift of errors of indications of the gas meters after 5000 hours of work; [%]
ΔEmH-m2Edifference of the average drifts of errors of indications of the gas meters tested for durability using a 2E/H5, 2E/H10 and 2E/H15 natural gas mixture with hydrogen and a 2E/H0 natural gas mixture without the addition of hydrogen, [%]
Qflow rate, [m3/h]
UmH-m2E)uncertainty of determining the difference of the average drifts of errors of indications of the gas meters tested for durability using a 2E/H5, 2E/H10 and 2E/H15 natural gas mixture with hydrogen and a 2E/H0 natural gas mixture without the addition of hydrogen, [%],
U(EmH)uncertainty of determining the average drifts of errors of indications of the gas meters tested for durability using a 2E/H5, 2E/H10 and 2E/H15 natural gas mixture with hydrogen, [%],
U(Em2E) uncertainty of determining the average drifts of errors of indications of the gas meters tested for durability using a 2E/H0 natural gas mixture without the addition of hydrogen, [%].

Abbreviations

INiG-PIBOil and Gas Institute–National Research Institute
PSGPolska Spółka Gazownictwa Sp. z o.o.
PtG/P2GPower to Gas
OZErenewable energy sources
2Enatural gas of group E of the second gas family (high-methane) described in EN 437
2E/H02E natural gas mixture without the addition of hydrogen
2E/H52E natural gas mixture with 5% hydrogen content (V/V)
2E/H102E natural gas mixture with 10% hydrogen content (V/V)
2E/H152E natural gas mixture with 15% hydrogen content (V/V)
IRiESDDistribution Network Operation and Maintenance Manual
EUEuropean Union
KEEuropean Commission
LNGLiquefied natural gas
MIDMetering Instrument Directive

References

  1. Ustawa z dnia 10 kwietnia 1997 r. Prawo energetyczne. (Dz.U. z 2017 r., poz. 220). Art. 4 ust. 2. Available online: http://prawo.sejm.gov.pl/isap.nsf/DocDetails.xsp?id=WDU20170000220 (accessed on 8 December 2019).
  2. Polska Spółka Gazownictwa. Objectives. Available online: https://www.psgaz.pl (accessed on 8 December 2019).
  3. Energy Roadmap 2050, Communication from the Commission to the European Parliament, the Council, the European Economic and Social Committee and the Committee of the Regions; COM(2011) 885 final; European Commission, Brussels. 2011, p. 7. Available online: https://eur-lex.europa.eu/LexUriServ/LexUriServ.do?uri=COM:2011:0885:FIN:EN:PDF (accessed on 8 December 2019).
  4. A Framework Strategy for a Resilient Energy Union with a Forward-Looking Climate Change Policy, Communication from the Commission to the European Parliament, the Council, the European Economic and Social Committee, the Committee of the Regions and the European Investment Bank; COM(2015) 80 final; European Commission, Brussels. 2015, p. 11. Available online: http://eur-lex.europa.eu/resource.html?uri=cellar:1bd46c90-bdd4-11e4-bbe1-01aa75ed71a1.0001.03/DOC_1&format=PDF (accessed on 8 December 2019).
  5. Long Term Infrastructure Vision for Europe and Beyond, Communication from the Commission to the European Parliament, the Council, the European Economic and Social Committee and the Committee of the Regions; COM(2013) 711 final; European Commission, Brussels. 2013, p. 6. Available online: https://eur-lex.europa.eu/legal-content/EN/TXT/?uri=COM:2013:0711:FIN (accessed on 8 December 2019).
  6. Gruber, M.; Weinbrecht, P.; Biffar, L.; Harth, S.; Trimis, D.; Brabandt, J.; Posdziech, O.; Blumentritt, R. Power-to-Gas through thermal integration of high-temperature steam electrolysis and carbon dioxide methanation—Experimental results. Fuel Process. Technol. 2018, 181, 61–74. [Google Scholar] [CrossRef]
  7. McDonagh, S.; O’Sheaa, R.; Walla, D.M.; Deane, J.P.; Murphy, J.D. Modelling of a power-to-gas system to predict the levelised cost of energy of an advanced renewable gaseous transport fuel. Appl. Energy 2018, 444–456. [Google Scholar] [CrossRef]
  8. Salomone, F.; Giglio, E.; Ferrero, D.; Santarelli, M.; Pirone, R.; Bensaid, S. Techno-economic modelling of a Power-to-Gas system based on SOEC electrolysis and CO2 methanation in a RES-based electric grid. Chem. Eng. J. 2019, 377, 120233. [Google Scholar] [CrossRef]
  9. Becker, W.L.; Penev, M.; Braun, R.J. Production of Synthetic Natural Gas from Carbon Dioxide and Renewably Generated Hydrogen: A Techno-Economic Analysis of a Power-to-Gas Strategy. J. Energy Resour. Technol. 2019, 141. [Google Scholar] [CrossRef]
  10. EU Strategy for Liquefied Natural Gas and Gas Storage, Communication from the Commission to the European Parliament, the Council, the European Economic and Social Committee and the Committee of the Regions; COM(2016) 49 final; European Commission, Brussels. 2016. Available online: https://eur-lex.europa.eu/legal-content/EN/TXT/?uri=CELEX:52016DC0049 (accessed on 8 December 2019).
  11. Energy Storage—The Role of Electricity, Commission Staff Working Document. SWD (2017) 61 final. European Commission, Brussels. 2017, p. 3. Available online: https://ec.europa.eu/energy/sites/ener/files/documents/swd2017_61_document_travail_service_part1_v6.pdf (accessed on 8 December 2019).
  12. DVGW Forschung G 1/07/10, Management Summary. Entwicklung von modularen Konzepten zur Erzeugung, Speicherung und Einspeisung von Wasserstoff und Methan ins Erdgasnetz. 2013. Available online: https://www.dvgw.de/medien/dvgw/forschung/berichte/g1_07_10.pdf (accessed on 8 December 2019).
  13. Dolci, F.; Thomas, D.; Hilliard, S.; Guerra, C.F.; Hancke, R.; Ito, H.; Jegoux, M.; Kreeft, G.; Leaver, J.; Newborough, M.; et al. Incentives and legal barriers for power-to-hydrogen pathways: An international snapshot. Int. J. Hydrog. Energy 2019, 44, 11394–11401. [Google Scholar] [CrossRef]
  14. HyLAW project Online Database. Legal Framework: Permissions and Restrictions. Available online: https://www.hylaw.eu/database#/database/spain/gas-grid-issues/injection-of-hydrogen-at-transmission-level-for-energy-storage-and-enhancing-sustainabily/legal-framework-permissions-and-restrictions-and-ownership-constraints-unbundling (accessed on 20 May 2020).
  15. Jaworski, J.; Kukulska-Zając, E.; Kułaga, P. Wybrane zagadnienia dotyczące wpływu dodatku wodoru do gazu ziemnego na elementy systemu gazowniczego. Nafta-Gaz 2019, 10, 625–632. [Google Scholar] [CrossRef]
  16. An Energy Policy for Europe, Communication from the Commission to the European Council and The European Parliament; COM(2007) 1 final; European Commission, Brussels. 2007, p. 5. Available online: https://www.esmap.org/node/1112 (accessed on 8 December 2019).
  17. A European Strategic Energy Technology Plan (Set-Plan) ‘Towards a low carbon future’, Communication from the Commission to the European Parliament, the Council, the European Economic and Social Committee and the Committee of the Regions; COM(2007) 723 final; European Commission, Brussels. 2007, p. 13. Available online: https://eur-lex.europa.eu/legal-content/EN/TXT/?uri=CELEX%3A52008AE1199 (accessed on 8 December 2019).
  18. Towards a European Strategic Energy Technology Plan, Communication from the Commission to the European Parliament, the Council, the European Economic and Social Committee and the Committee of the Regions; COM(2006) 847 final; European Commission, Brussels. 2007, p. 13. Available online: https://eur-lex.europa.eu/legal-content/EN/TXT/?uri=CELEX%3A52006DC0847 (accessed on 8 December 2019).
  19. HyWays. The European Hydrogen Roadmap, European Commission. 2008. Available online: https://op.europa.eu/en/publication-detail/-/publication/66b2d3ee-f77c-4a5d-9c5d-1ed8c716911c/language-en (accessed on 8 December 2019).
  20. Council Regulation (EC). No 521/2008 of 30 May 2008 setting up the Fuel Cells and Hydrogen Joint Undertaking (OJ L 153, 12.6.2008); European Commission, Brussels. 2008. Available online: https://eur-lex.europa.eu/legal-content/EN/TXT/?uri=CELEX%3A32008R0521 (accessed on 8 December 2019).
  21. Energy Technologies and Innovation, Communication from the Commission to the European Parliament, the Council, the European Economic and Social Committee and the Committee of the Regions; COM(2013) 253 final; European Commission, Brussels. 2013. Available online: https://eur-lex.europa.eu/legal-content/EN/TXT/?uri=celex%3A52013DC0253 (accessed on 8 December 2019).
  22. Council Regulation (EC). No 559/2014 of 6 May 2014 establishing the Fuel Cells and Hydrogen 2 Joint Undertaking (OJ L 169/211, 7.06.2014, p. 5); European Commission, Brussels. 2014. Available online: https://eur-lex.europa.eu/legal-content/EN/TXT/?uri=CELEX%3A32014R0559 (accessed on 8 December 2019).
  23. Fuel Cells and Hydrogen Joint Undertaking (FCH JU) Multi-Annual Work Plan 2014–2020. Available online: https://www.fch.europa.eu/sites/default/files/FCH%202%20JU%20MAWP-%20final%20%28ID%204221004%29.pdf (accessed on 8 December 2019).
  24. PN-C-04753 Polska Norma. Gaz Ziemny, Jakość Gazu Dostarczanego Odbiorcom z Sieci Dystrybucyjnej; Komitet Techniczny KT 277/PK 1; Polski Komitet Normalizacji: Polska, 2011. [Google Scholar]
  25. EN ISO 15403-1 European Standard. Natural gas. Natural Gas for Use as a Compressed Fuel for Vehicles. In Designation of the Quality; Technical Committee CEN/TC 238; European Committee for Standardization: Brussels, Belgium, 2008. [Google Scholar]
  26. EN 16723-1 European Standard. Natural Gas and Biomethane for Use in Transport and Biomethane for Injection in the Natural Gas Network. In Specifications for Biomethane for Injection in the Natural Gas Network; Technical Committee CEN/TC 408; European Committee for Standardization: Brussels, Belgium, 2016. [Google Scholar]
  27. EN 16726 European Standard. Gas infrastructure. In Quality of Gas. Group H; Technical Committee CEN/TC 408; European Committee for Standardization: Brussels, Belgium, 2016. [Google Scholar]
  28. Rozporządzenie Ministra Gospodarki z dnia 2 lipca 2010 r. w sprawie szczegółowych warunków funkcjonowania systemu gazowego (Dz.U. 2010 nr 133 poz. 891, wraz z późn. zm.). Available online: http://prawo.sejm.gov.pl/isap.nsf/DocDetails.xsp?id=WDU20101330891 (accessed on 8 December 2019).
  29. Polska Spółka Gazownictwa. Instrukcja Ruchu i Eksploatacji Sieci Dystrybucyjnej, wersja 12, Warszawa lipiec 2016r. Available online: https://www.psgaz.pl (accessed on 8 December 2019).
  30. EN 437 European Standard. Test Gases. Test Pressures. Appliance Categories; Technical Committee CEN/TC 238; European Committee for Standardization: Brussels, Belgium, 2018. [Google Scholar]
  31. Schuster, T.; Holewa-Rataj, J.; Kukulska-Zając, E. Ocena jakości paliw gazowych w kontekście wprowadzania wodoru do sieci gazu ziemnego. Gaz, Woda i Tech. Sanit. 2019, 2, 42–46. [Google Scholar] [CrossRef]
  32. Kuczyński, S.; Łaciak, M.; Olijnyk, A.; Szurlej, A.; Włodek, T. Thermodynamic and Technical Issues of Hydrogen and Methane-Hydrogen Mixtures Pipeline Transmission. Energies 2019, 12, 569. [Google Scholar] [CrossRef] [Green Version]
  33. Pluvinage, G.; Capelle, J.; Hadj Meliani, M. Pipe networks transporting hydrogen pure or blended with natural gas, design and maintenance. Eng. Fail. Anal. 2019, 106. [Google Scholar] [CrossRef]
  34. Ficco, G. Metrological performance of diaphragm gas meters in distribution networks. Flow Meas. Instrum. 2014, 37, 65–72. [Google Scholar] [CrossRef]
  35. Costello, K.W. Lost and unaccounted-for gas: Challenges for public utility regulators. Util. Policy 2014, 29, 17–24. [Google Scholar] [CrossRef]
  36. Cowgill, R.M. Methane Emissions—Leakage, Sources and Unaccounted—For Gas. In IGT Asian Natural Gas Conference III 1991; IGT: Singapore.
  37. Arpino, F.; Dell’Isola, M.; Ficco, G.; Vigo, P. Unaccounted for gas in natural gas transmission networks: Prediction model and analysis of the solutions. J. Nat. Gas Sci. Eng. 2014, 17, 58–70. [Google Scholar] [CrossRef]
  38. Union, E. Directive 2014/32/EC of The European Parliament and of The Council of 26 February 2014 on the harmonisation of the laws of the Member States relating to the making available on the market of measuring instruments. Off. J. Eur. Union 2014. [Google Scholar]
  39. EN 1359 European Standard. Gas Meters—Diaphragm Gas Meters; Technical Committee CEN/TC 237; European Committee for Standardization; CEN-CENELEC: Brussels, Belgium, 1998. [Google Scholar]
  40. EN 12261 European Standard. Gas Meters—Turbine Gas Meters; Technical Committee CEN/TC 237; European Committee for Standardization; CEN-CENELEC: Brussels, Belgium, 2002. [Google Scholar]
  41. EN 12480 European Standard. Gas Meters—Rotary Displacement Gas Meters; Technical Committee CEN/TC 237; European Committee for Standardization; CEN-CENELEC: Brussels, Belgium, 2002. [Google Scholar]
  42. Kułaga, P. Trwałość gazomierzy miechowych—różne metody badania. Nafta-Gaz 2015, 8, 565–571. [Google Scholar]
  43. Kułaga, P.; Jaworski, J. Wyniki badań trwałości gazomierzy miechowych uzyskiwane z zastosowaniem różnych metodyk—Analiza porównawcza. Nafta-Gaz 2016, 8, 645–650. [Google Scholar] [CrossRef]
  44. OIML R 137-1&2 International Recommendation Gas Meters; Part 1 and Part 2. International Organization of Legal Metrology OIML. 2012. Available online: https://www.oiml.org/en/files/pdf_r/r137-1-2-e12.pdf (accessed on 8 December 2019).
  45. Wojtowicz, R. An analysis of the effects of hydrogen addition to natural gas on the work of gas appliances. Nafta-Gaz 2019, 8, 465–473. [Google Scholar] [CrossRef]
Figure 1. View of the GH54 bench for metrological tests of gas meters in the Laboratory of Flow Metrology INIG-PIB.
Energies 13 03006 g001
Figure 2. The scheme of the GH54 bench for metrological tests of gas meters in the Laboratory of Flow Metrology INIG-PIB.
Energies 13 03006 g002
Figure 3. Layout of the system for testing gas meter durability using a 2E/H5, 2E/H10, and 2E/H15 natural gas mixture with the addition of hydrogen.
Energies 13 03006 g003
Figure 4. The scheme of the test bench for the durability test using a 2E/H5, 2E/H10, and 2E/H15 natural gas mixture with the addition of hydrogen.
Energies 13 03006 g004
Figure 5. Test bench for gas meter durability using the 2E/H0 natural gas mixture without hydrogen.
Energies 13 03006 g005
Figure 6. The scheme of the test bench for durability test using a 2E/H0 natural gas mixture.
Energies 13 03006 g006
Figure 7. Initial errors of indications (E0) and average initial errors of indications (Em0) of type-1 gas meters as a function of flow rate (Q/Qmax).
Energies 13 03006 g007
Figure 8. Average drift of errors of indications (ΔEm5) for type-1 gas meters after a 5000-h durability test using 2E/H15 natural gas mixtures with hydrogen and 2E/H0 natural gas mixtures without hydrogen as a function of flow rate (Q/Qmax).
Energies 13 03006 g008
Table 1. Requirements for energy parameters of gas.
GroupWobbe Index Ws, MJ/m3Gross Calorific Value, MJ/m3
Regulation [28]
Natural gas E45.0–56.9>34.0
Natural gas Lw37.5–45.0>30.0
Natural gas Ls32.5–37.5>26.0
IRiESD [29]
Natural gas E45.0–56.9>38.0
Natural gas Lw37.5–45.0>30.0
Natural gas Ls32.5–37.5>26.0
Reference conditions: 298.15 K and 101.325 kPa-combustion, 273.15 K and 101.325 kPa-volume measurement.
Table 2. Average errors of indications and average drift of errors of indications of type-1 gas meters (Qmax = 6 m3/h) tested for durability using the 2E/H15 natural gas mixture with hydrogen.
Flow Rate Q
Qmin3 Qmin0.1 Qmax0.2 Qmax0.4 Qmax0.7 QmaxQmax
Em00.600.700.580.800.93−0.58−1.10
Em10.500.280.070.260.400.98−1.29
Em20.930.350.030.100.30−0.57−1.15
Em30.70−0.32−0.220.150.09−1.03−1.18
Em40.400.00−0.12−0.03−0.04−0.92−1.32
Em51.080.34−0.070.300.17−1.13−1.60
ΔEm1−0.10−0.42−0.50−0.53−0.52−0.40−0.20
ΔEm20.33−0.36−0.55−0.70−0.630.01−0.05
ΔEm30.10−1.03−0.80−0.64−0.84−0.45−0.09
ΔEm4−0.20−0.70−0.69−0.83−0.97−0.34−0.22
ΔEm50.48−0.36−0.65−0.50−0.75−0.55−0.51
Table 3. Average errors of indications and average drift of errors of indications of type-1 gas meters (Qmax = 6 m3/h) tested for durability using the 2E/H0 natural gas mixture.
Flow Rate Q
Qmin3 Qmin0.1 Qmax0.2 Qmax0.4 Qmax0.7 QmaxQmax
E00.940.670.600.850.83−0.66−1.13
E10.880.230.200.440.14−1.03−1.32
E20.610.17−0.14−0.120.44−0.57−1.15
E30.24−0.06−1.480.120.56−0.68−1.18
E4−0.36−0.34−0.30−0.17−0.09−0.83−1.33
E50.06−0.14−0.090.240.63−0.68−1.30
ΔE1−0.06−0.44−0.41−0.41−0.69−0.38−0.18
ΔE2−0.33−0.49−0.74−0.97−0.390.09−0.01
ΔE3−0.70−0.73−2.09−0.73−0.27−0.02−0.05
ΔE4−1.30−1.01−0.91−1.02−0.92−0.17−0.20
ΔE5−0.88−0.81−0.69−0.62−0.20−0.02−0.17
Table 4. Assessment of the average drift of errors of indications of type-1 gas meters after the 5000-h durability test with the use of a 2E/H15 natural gas mixture.
Volume Flow
Q
Average Drift of Errors of Indications after the 5000 h Test for Mixtures
[%]
Differences in Average Drift of Errors
[%]
Uncertainty in Average Drift of Errors
[%]
Permitted Difference in Drift
[%]
Metrological Assessment
ΔEm5 2E/H15ΔEm52E/H0ΔEmH-m2EU(Em)U(ΔEmH-m2E)
2E/H152E/H0
Qmax−0.51−0.17−0.34±0.20±0.32±0.76insignificant
0.7 Qmax−0.55−0.02−0.53±0.19±0.27±0.66insignificant
0.4 Qmax−0.75−0.20−0.56±0.17±0.24±0.59insignificant
0.2 Qmax−0.50−0.620.12±0.21±0.26±0.67insignificant
0.1 Qmax−0.65−0.690.05±0.15±0.21±0.52insignificant
3 Qmin−0.36−0.810.45±0.32±0.26±0.83insignificant
Qmin0.48−0.881.36±0.30±0.57±1.29significant
Table 5. Results of one-way analysis of variance for type-1 gas meters after the 5000-h durability test using different gas mixtures (2E/H5, 2E/H10, 2E/H15, and 2E/H0).
Volume Flow
Q
Brown-Forsythe Variance Homogeneity TestFisher-Snedecor Variance Equality TestTukey Post-Hoc
Test
StatisticsSignificance LevelStatisticsSignificance Level
Qmin0.8805210.4908633.0704690.090881X
3 Qmin1.2305470.3603740.5645730.653490X
0.1 Qmax0.9174150.4748620.0542620.982173X
0.2 Qmax0.4708740.7109090.0485050.984828X
0.4 Qmax1.0293910.4297391.4225130.306041X
0.7 Qmax0.2670060.8474554.0835970.049516X
Qmax0.9604930.4569052.7703440.110779X
Table 6. Weighted mean error (WME) of type-1 gas meters before and after the durability test using 2E/H15 natural gas mixtures with hydrogen and 2E/H0 natural gas mixtures without hydrogen.
Gas Meter Serial NumberWME before
Durability Test
[%]
WME after Durability Test
[%]
2E/H152E/H02E/H152E/H0
018009360.01-−0.47-
01800937−0.18-−0.91-
01800938−0.22-−0.75-
01800939-−0.15-−0.76
01785644-−0.18-0.06
01800945-−0.21-−0.47

