Article

Forced Convection of Al2O3–Cu, TiO2–SiO2, FWCNT–Fe3O4, and ND–Fe3O4 Hybrid Nanofluid in Porous Media

1
Department of Mechanical and Industrial Engineering, Ryerson University, Toronto, ON M5B 2K3, Canada
2
Department of Mathematics, College of Science, Sultan Qaboos University, Muscat 123, Oman
*
Author to whom correspondence should be addressed.
Energies 2020, 13(11), 2902; https://doi.org/10.3390/en13112902
Submission received: 27 April 2020 / Revised: 1 June 2020 / Accepted: 4 June 2020 / Published: 5 June 2020
(This article belongs to the Section A5: Hydrogen Energy)

Abstract

:
Adding nanoparticles to fluid has led to a new class of fluids named as nanofluids. Different concentrations and its effective cooling have attracted many engineering applications to test this new fluid. Lately, important heat enhancement has been observed by dispersing two distinct nanoparticles in the regular fluid. This type of hybrid nanofluid has led researchers to study its effectiveness in the cooling process. Here, we experimentally studied the forced convection of Al2O3–Cu hybrid nanofluid in porous media at a constant flow rate and heating condition. The numerical code after being calibrated with the experimental results is used to predict the effectiveness in cooling by using a set of hybrid fluid of TiO2–SiO2, MWCNT–Fe3O4, and ND–Fe3O4 at different concentrations. In the experiment, we used water and a water–ethylene glycol mixture as base fluids. The results revealed that the hybrid fluid contributed to heat enhancement levied increased pumping power. However, the index of efficiency, obtained by combining the Nusselt number and pressure drop, indicated that the best hybrid fluid for such an application is ND–Fe3O4 in the water–ethylene glycol mixture.

Graphical Abstract

1. Introduction

The advanced development of computer technologies has also developed new problems and threats, which in turn has limited the lifespan of the usage of these devices. Electrical currents pass through a series of resistors, resulting in heat generation. Thus, overheating the sophisticated electronic pieces of equipment (i.e., computer processor) while operating is one of the main challenges of computer industries. The work of Bayomy et al. [1] confirmed that the decrease in efficiency rate or complete failure of electronic devices rises exponentially with the generation of heat within it.
Bhattacharya et al. [2] experimentally determined the thermophysical properties such as effective thermal conductivity, inertial coefficient, and permeability of highly porous metal foams. Using massive junctions for circular nodes, and hexagonal geometry for the ligaments of the pore perimeter, they ultimately developed an analytical model to predict the thermal conductivity. Both of their models showed that the permeability and effective thermal conductivity significantly depends on the porosity, ratio of the cross-sections, and the fiber of the metal foams. Furthermore, the inertial coefficient determined from their analytical model coincided with the experimental data.
Xu et al. [3] numerically studied the thermal behavior of gradient metal foams by partially filling tubes under forced convection conditions. For this investigation, the authors employed both Brinkman–Darcy and local thermal non-equilibrium models. The models in question were both compared to previously collected data for validation. Four foam samples, 5 PPI-20 PPI, 20 PPI-5 PPI, 5 PPI-10 PPI, and 5 PPI-40 PPI, were considered for the simulation. The first number of these samples represents the linear pore density at the wall and the second represents the linear pore density toward the center of the tube. They observed that in the cases where the pore density increased from the inside out, so too did the velocity of the fluid. This happens due to the varying flow resistance. They further observed that the Nusselt number decreased as the linear pore density increased from the wall to the center, whereas it tended to be higher when the linear pore density decreased in a radial direction toward the center.
To determine the best performer for a heat sink in electronic cooling, Bayomy et al. [4] used aluminum foam along with air and water as test fluids in their numerical as well as experimental investigations. They noticed that at the test section, a lower average surface temperature and more uniform profile were created by water than air. In a fully developed region, it was found that a higher Reynolds number amplified the region of the thermal entry length. Bayomy and Saghir [5] experimented by varying the volume concentration of Al2O3–water nanofluid ranges from 0.1% to 0.6% for the forced convection flow in a non-Darcy porous medium. The optimal heat transfer enhancement was recorded for the 0.2% volume of Al2O3–water nanofluid.
Recent experimental and numerical works by Saghir et al. [6] and Alhajaj et al. [7] unveiled the significance of nanofluids treated as a binary as well as a hybrid mixture. They found that for heat transfer enhancement at the reduced pumping power usage of a nanofluid is an excellent choice. Furthermore, a hybrid fluid at the same concentration level of the nanoparticles exhibited a higher heat transfer rate (due to the presence of Cu) than the nanofluid at the expense of a greater friction factor that is increased pumping power.
The numerical and experimental works of Ho et al. [8] documented the impact of fluid property uncertainty on nanofluid modeling under various operating conditions. They suspended Al2O3 nanoparticles in water by varying the concentration levels ranging from 0 to 4% by volume and calculated the nanofluid properties. In our present work to model nanofluids, we used the properties obtained by Ho et al.
Sheikholeslami and Sadoughi [9] determined the fluid properties of nanoscale ferrofluids in the presence of magnetic field disturbances. In particular, the study considered the use of Fe3O4–water nanofluid. When considering only nanofluid concentrations and its effects on the streamlines of the fluid, it can be seen that the test containing only pure water had a more even distribution of streamlines with an overall higher average velocity, while the nanofluid had tighter contours with a lower average velocity. This effect is likely to be the result of the increased viscosity of the fluid within the system. When considering only nanofluids and the effect of the magnetic radiation, it was observed that the use of radiation separated the streamlines and ultimately increased the average velocity of the system. This is likely to be due to the magnetic properties of the nanoparticles employed and their tendency to move concerning the source.
As is the case with many fields of study, the number of experimental results for the fluidic behavior of nanofluids is limited as a function of cost. Due to the high cost to acquire or synthesize nanofluids, the amount of empirical data that is available are limited. Furthermore, the amount of research being done into nanofluidics is likely to be even more limited, as most of the interest surrounding nanofluids looks at their use as thermal performance enhancers. This highly focused interest has created a divide in the literature, relegating the study of fluid properties to an almost secondary task.
Soltani and Akbari [10] considered ethylene glycol-based MgO–MWCNT hybrid nanofluid and experimentally identified the impacts of temperature and particle concentration on it. They considered nanofluid concentrations of 0.1%, 0.2%, 0.4%, 0.8%, and 1% by volume and observed a nonlinear trend in the effect of increasing nanofluid concentration on viscosity. In particular, they note that at lower concentrations, the effect is notably less than that of higher concentrations. Overall, the authors observed a total increase in viscosity by 168% when going from only the base fluid to a concentration of 1%. This significant increase in effective fluid dynamic viscosity is important to note for the development of technologies that may wish to employ nanofluids for practical applications. However, the authors stated that across all of the tested temperature ranges and concentrations, the fluid did display Newtonian fluid behavior.
Moldoveanu et al. [11] conducted experiments to determine the viscosity of a nanofluid as well as a hybrid nanofluid by suspending Al2O3 and TiO2 nanoparticles separately as well as combining them as a mixture (Al2O3–TiO2) in pure water. They noted that nanofluid viscosity increased with the nanoparticle loading. The data derived from their developed correlation echoed nicely with the experimental one; however, these were out of phase with the existing data available in the open literature. They further noted that the viscosity of the alumina sample was much higher than that of titania. Finally, the non-Newtonian behavior of all of their samples challenges the well-established relations which are valid for simulating nanofluids.
Suresh et al. [12] used a hydrogen reduction technique to synthesize hybrid particles from a mixture (9:1 weight) of aluminum oxide and copper oxide powders to produce a hybrid nanofluid, dispersing them in deionized water by varying the concentration levels from 0.1% to 0.2% by vol. They experimentally showed that the hybrid nanofluid possessed higher thermophysical properties such as effective thermal conductivity and viscosity compared to the traditional nanofluids either for Al2O3–water or CuO–water. These thermophysical properties were enhanced with the increase in the nanoparticle concentration. Increased effective viscosity in a hybrid nanofluid is counterproductive as the system requires more space and pumping power. The enhancement in effective thermal conductivity is significantly higher in a hybrid nanofluid than in deionized water. They further reported that in a nanofluid, enhancement in viscosity is much higher than the corresponding enhancement in thermal conductivity. They measured a 12.11% maximum enhancement in thermal conductivity for a 2% volume concentration of nanoparticles.
To use a Al2O3–CuO/water hybrid nanofluid in electronic heat sinks, Selvakumar and Suresh [13] measured its performance at a constant volumetric flow of hybrid nanofluid and deionized water. Using a 0.1% vol concentration of hybrid nanofluid, they reported a 24.35% increase in heat transfer compared to the base fluid. They also measured a required 12.61% increase in the pumping power for 11.74% net improvement. Suresh et al. [14] and Takabi et al. [15] experimented to determine the heat transfer capability of the Al2O3–CuO/water hybrid nanofluid in a straight copper tube covered with ceramic beads. They obtained 15.56% maximum enhancement with a Nusselt number at Re = 1730 compared to the working fluid water using a 0.1% vol concentration of hybrid nanofluid. They also observed a slight increase in friction factor that was a pressure drop in the flow domain due to the presence of the hybrid composite particles in the base fluid.
A hybrid nanocomposite consisting of TiO2–SiO2 dispersed in water and ethylene glycol (EG) was studied in detail by Abdul Hamid et al. [16] and Nabil et al. [17]. Both papers belong to the same group of researchers. Accurate measurement of viscosity and conductivity of the hybrid nanofluid was the main focus of these papers. Different compositions of TiO2–SiO2 were investigated, ranging from a combination of 80:20 to 20:80 for a base fluid of 60:40 water–EG, but maintaining a 1% concentration of TiO2–SiO2 in the base fluid. The data generated were for a range of temperatures from 20 °C to 80 °C. Results revealed that the highest thermal conductivity for TiO2–SiO2 hybrid fluid was obtained for a ratio of 20:80 of TiO2-SiO2 and the maximum enhancement exceeded 16% of the base fluid. Meanwhile, the lowest thermal conductivity obtained was for a mixture of 50:50. This mixture exhibited the highest viscosity compared to the other studied mixture. Nabil et al. [17] used the same base fluid and a mixture of 50:50 for the nanoparticles, but varied the concentration of nanoparticles from 0.5% to 3%. Their conclusion suggests that the mixture of TiO2–SiO2 hybrid fluid will help in heat transfer for a concentration of more than 1.5% for a different range of temperatures. An additional finding was that this fluid behaved like Newtonian fluid for up to a 3% concentration of this mixture in the base fluid.
Sundar et al. [18,19,20,21] conducted a very accurate measurement of the thermal conductivity and viscosity of a new family of hybrid fluid consisting of MWCNTs and Fe3O4 in a water base solution and ND–Fe3O4 again in water solution. Their measurement covered a wide range of concentrations from 0.5% to 2% and a vast range of temperatures from 20 °C to 60 °C. Remarkable results were obtained with high accuracy. Furthermore, they investigated the forced convection heat transfer and friction factor for a turbulent regime. For a nanofluid of Fe3O4 in water, their findings suggest that the heat transfer coefficient was enhanced by 31% and the friction factor by 10% for a 0.6% volume concentration compared to the flow of water. Later, when using the hybrid fluid of MWCNT and Fe3O4, the results indicated a maximum of 31% enhancement for the Nusselt number with a penalty of 1.8 times increase in pumping power for the particle of 0.3% in a turbulent regime. Similar work was repeated for ND–Fe3O4 hybrid mixtures at different concentrations. The results indicate that the thermal conductivity enhancements were 17.8%, 13.4%, 13.6%, and 14.6%, whereas the corresponding viscosity enhancements were 1.72 times, 2.19 times, 1.5 times, and 1.79 times respectively, compared to the data produced by using the Fe3O4–water nanofluid.
In the present paper, an attempt was made to categorize the best hybrid fluid for heat enhancement. The experimental approach consisted of measuring the temperature distribution in forced convection in porous media for different heat fluxes and flow rates and was compared with the numerical code. Thus, the calibration of the numerical code leads to an accurate investigation of the performance of different types of hybrid fluids. Section 2 presents the experimental setup. Once the model was calibrated, different types of fluids were tested numerically for the same setup. Section 3 explains the numerical model, solution technique, and convergence criteria. Section 4 presents the cases studied and the results obtained. Finally, Section 5 presents the conclusions, highlighting the findings obtained.

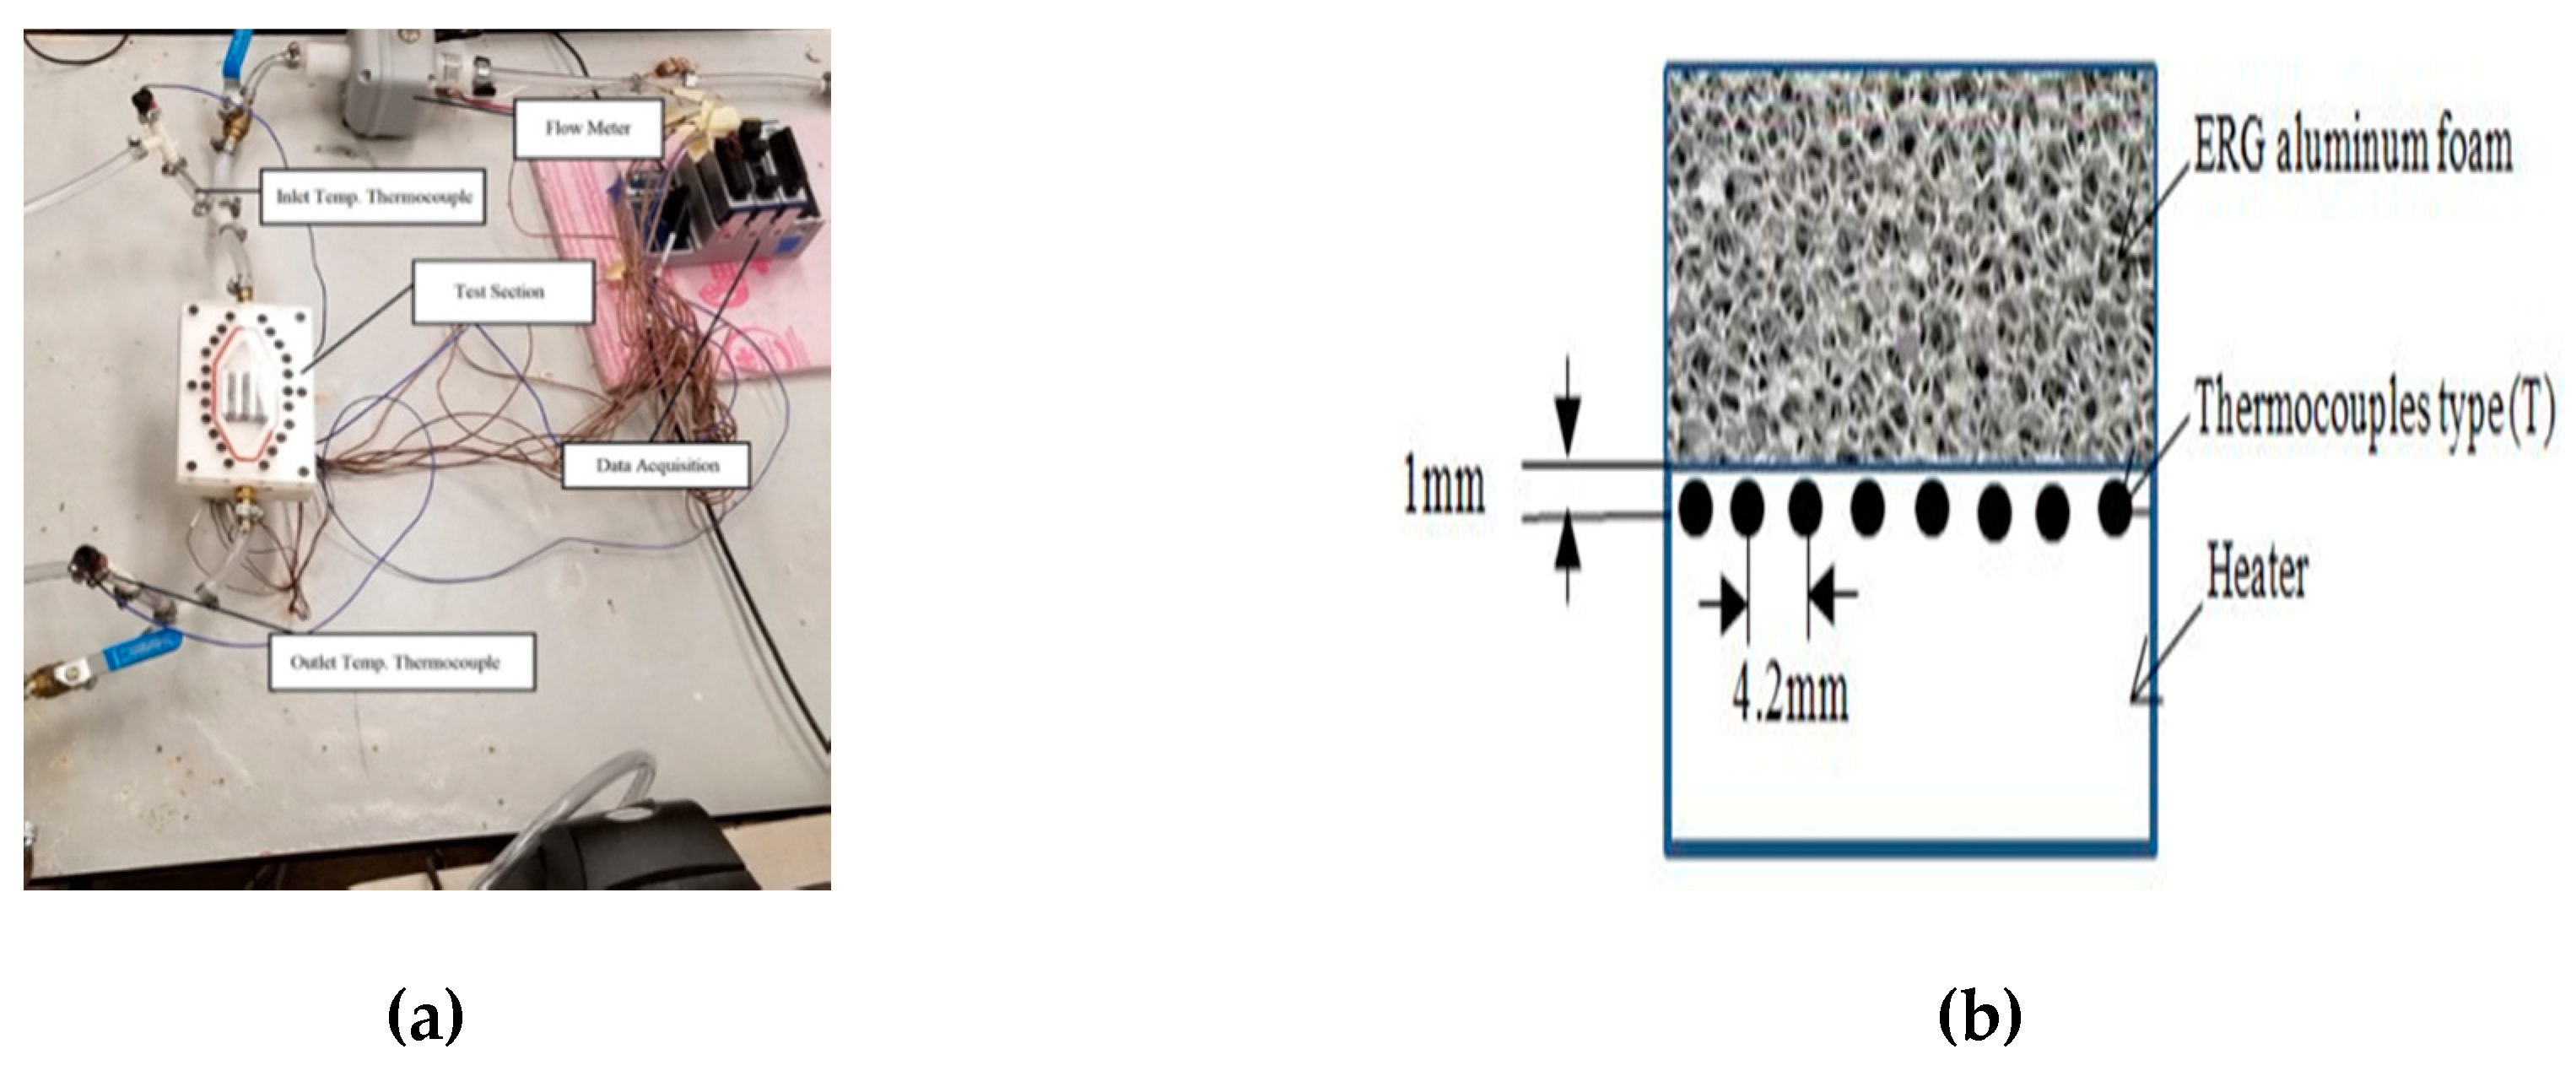
2. Experimental Description

Figure 1a displays the necessary apparatus: a pump, nine T-type thermocouples, a helical heat exchanger for temperature stabilization, a constant temperature water bath, and a flow meter for experimenting. We designed a test section with a hot area equal to an I7 internal processor (CPU) area. We used a voltmeter and ammeter to measure the heat flux and power applied to the test section, respectively. Briefly, we used a plate containing a square shape (side 37.5 mm) porous block (height 12.75 mm) filled with the 0.1% vol Al2O3–distilled water nanofluid to analyze the heat enhancement in it. We further mounted the porous block (Figure 1d) on an aluminum block that was heated from below. Following the approach of Welsford et al. [22], we applied a thin layer of thermal paste between the aluminum and porous blocks, which facilitates heat transfer between the heated block and the test section and further limits any error arising from their thermal contact resistances (Figure 1c). To construct the porous medium, we used vendor-supplied 6061-T6 aluminum with a permeability of 9.54788 × 10⁻⁷ m2 or 10 pores per linear inch with 0.91 porosity. More details about the experimental setup can be found in [22].

2.1. Experimental Procedure

The synthesized hybrid fluid was pumped at a constant rate through the porous block, allowing it to extract heat from the hot bottom wall of the channel. In our experiment, we varied the flow rates from 0.1 US Gallon Per Minute (USGPM) (i.e., 6.310 × 10⁻⁶ m3/s) to 0.22 USGPM (i.e., 1.3882 × 10⁻⁵ m3/s) whereas heat fluxes were from 35,000 W/m2 to 108,000 W/m2 (approx.) First, we circulated the nanofluid without imposing heat fluxes through the apparatus until the water bath and inlet of the test section reached a steady-state temperature. After achieving the equilibrium thermal state, we turned on the heat flux to the system until it further reached a steady-state. The steady-state was achieved through data acquisition (DAQ) recording the reading from the thermocouple at the test section over time; the voltage, flow rate, current, temperature along the test section, inlet, and outlet temperatures. Inline, evenly placed seven T-type thermocouples 1 mm beneath the surface (Figure 1b) measured the temperature along the test section. The steady-state was measured by tallying the total run time for the trial with the data from the DAQ system, which measured the temperature from the thermocouples. This value was then used as an indicator to record the experimental value for a particular test case. However, it was very difficult to obtain an identical iteration for each test case due to the variability of the steady-state inlet temperature in trails. Thus, the steady-state output from the DAQ was acceptable. For consistency of the results, all experimental data were recorded in a single instance.

2.2. Measurement Error Analysis

The uncertainty measurement is essential for collecting any empirical data. Error propagation through the local Nusselt number (Nu) for the thermocouples can measure the uncertainty present in the apparatus, which follows Taylor’s uncertainty approach:
δ Nu = ( Nu x     δ x ) 2 + + ( Nu y     δ y ) 2 + + ( Nu z     δ z ) 2
where x ,   y , and z are the corresponding directional coordinates system for each of the terms. It can be calculated combining the approach of Welsford et al. [22] and the manufacturer’s specifications. In the experiment, the used T-type thermocouples’ accuracy was 0.75%, while the flow meter uncertainty was 0.44%. The uncertainty of these devices was determined using the manufacturer supplied integrated calibration software for the DAQ device. For details, see Welsford et al. [22].

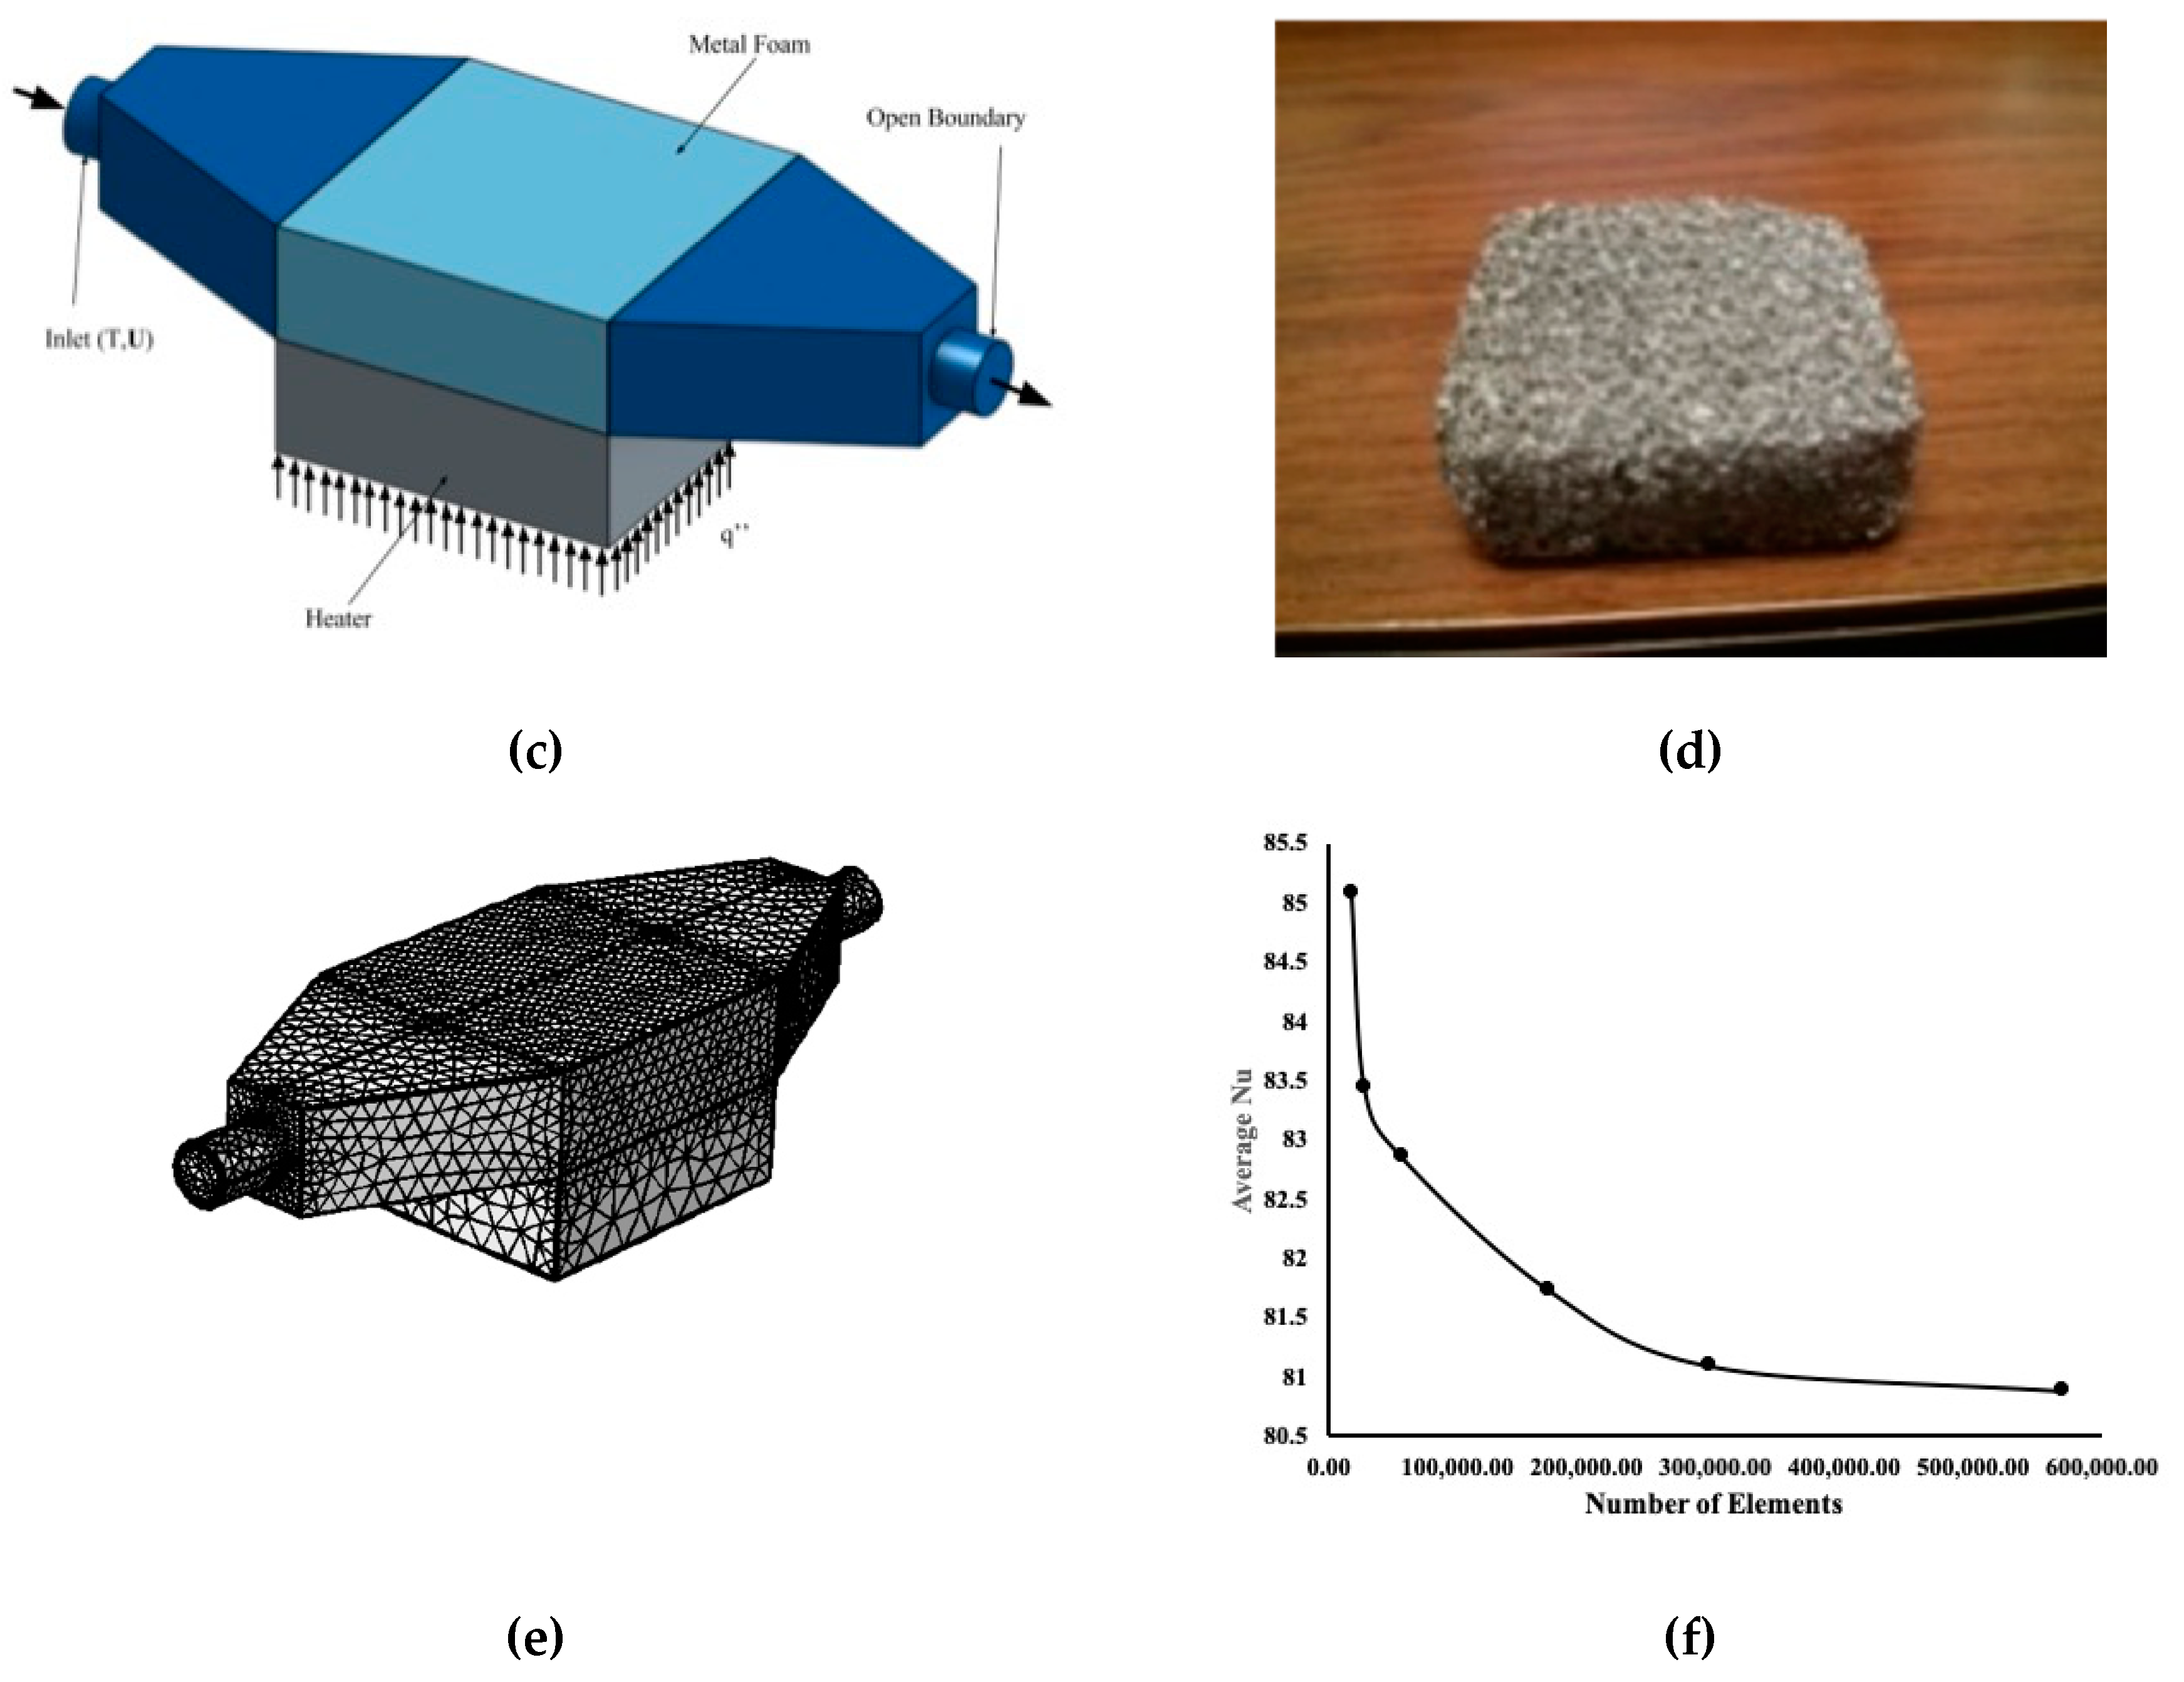
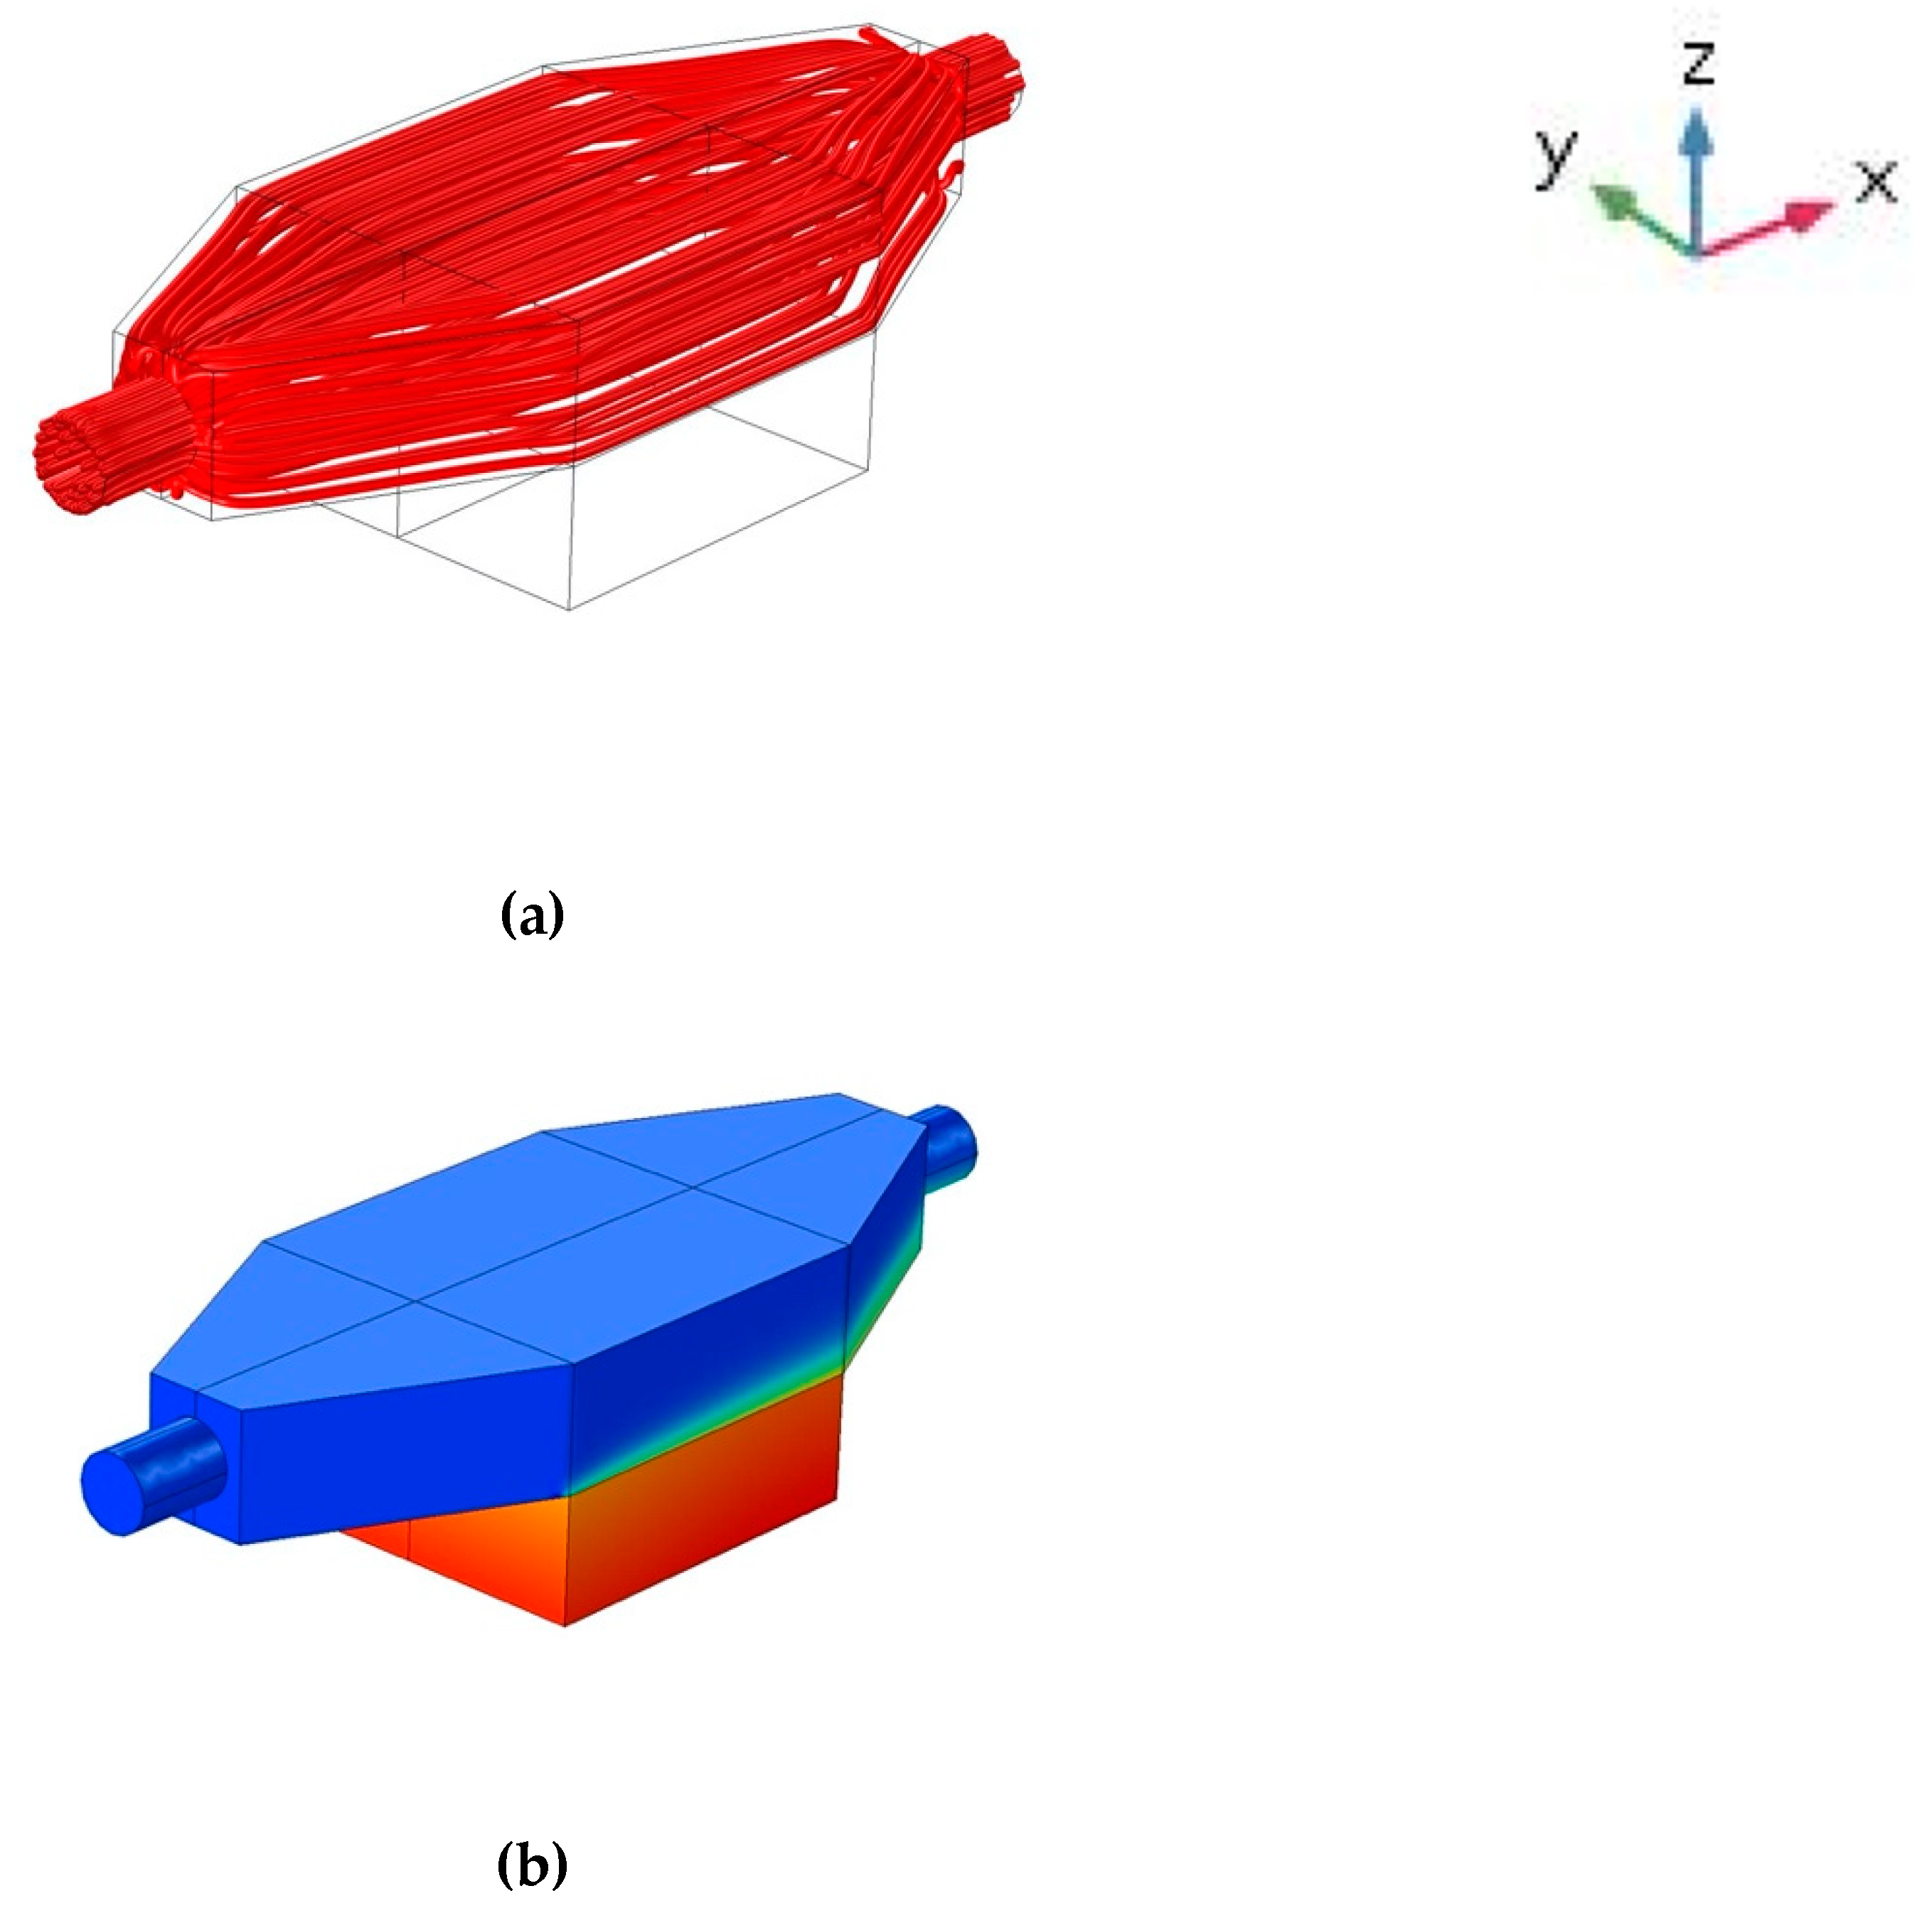
3. Finite Element Analysis

In this paper, we solved the steady-state full Navier–Stokes and energy equations for flow and heat transfer at the entrance and exit of a porous cavity. For flow and heat transfer in the porous block, we used the Darcy–Brinkman model along with the energy equation by considering the effective thermal conductivity.

3.1. Governing Equations and Boundary Conditions

The present problem combines the flow and heat transfer in a porous and clear medium. Thus, 3D Navier–Stokes equations in connection with the Darcy–Brinkman formulation, energy, and continuity equations are therefore applicable.

3.1.1. Fluid Flow Model

The conservation equations for mass, momentum, and energy in Cartesian coordinates are given by [23]:
Continuity equation
( u x + v y + w z ) = 0
x- momentum equation
ρ hnf ( uu x + vu y + wu z ) = p x + μ hnf ( u xx + u yy + u zz )
y-momentum equation
ρ hnf ( uv x + vv y + wv z ) = p y + μ hnf ( v xx + v yy + v zz )
z-momentum equation
ρ hnf ( uw x + vw y + ww z ) = p z + μ hnf ( w xx + w yy + w zz ) + ρ hnf g
Energy equation
( ρ cp ) hnf ( uT x + vT y + wT z ) = k hnf   ( T xx + T yy + T zz )
Here, μ hnf , ρ hnf ,   k hnf ,   cp hnf are dynamic viscosity, density, thermal conductivity, and specific heat of the mixture, respectively.

3.1.2. Darcy–Brinkman Model

The flow rate with the system was low and the porosity of the metal form was 0.91, thus the Darcy–Brinkman model is applicable, which is as follows:
Along the x-axis:
μ hnf κ u = p x + μ hnf ( u xx + u yy + u zz )
Along the y-axis:
μ hnf κ v = p y + μ hnf ( v xx + v yy + v zz )
Along the z-axis:
μ hnf κ w = p z + μ hnf ( w xx + w yy + w zz ) + ρ hnf g
Energy equation:
( ρ hnf c p hnf ) eff ( uT x + vT y + wT z ) = ( k hnf ) eff ( T xx + T yy + T zz )
The symbols carry their usual meanings where κ is the permeability of the porous media, and ( k hnf ) eff is the effective thermal conductivity of the mixture. A constant heat flux   q   was set beneath the first aluminum block. An inlet boundary condition for fluid flow and temperature was imposed on the first cylinder. At the outlet, an open boundary condition was applied. We compared and analyzed any properties applied to this metal foam with the experimental one. Other undefined surfaces were assumed to be thermally insulated and considered as walls for flow simulation. At the intersection of the blocks of metal foam and heater, we applied a 0.00015 m thick thermal resistance layer, which ensured proper heat transfer from the heating block to the metal foam. For the aluminum block, the energy equation of heat conduction was used.

3.2. Mesh Sensitivity Analysis

We calculated the local Nusselt number 1 mm below the surface at the locations of the thermocouples conducting mesh sensitivity analysis to determine the optimum mesh model for the numerical simulations. Our 3D model consisted of different types of mesh elements such as tetrahedral, pyramid, prism, triangular, quadrilateral, vortex, and edge. Figure 1e shows a typical 3D finite element mesh for numerical simulation. Figure 1f further displays the variation of average Nusselt number evaluated at the location of the thermocouples versus the number of mesh elements ranging from 18,000 to 570,000. It was found that changes in the average Nusselt number dropped from 5% to less than 1% with the increased mesh numbers. Thus, the use of 300,000 elements guaranteed the mesh independent solutions for numerical simulation.

3.3. Convergence Criteria

To obtain a convergent solution, we used the default solver “segregated” built in COMSOL Multiphysics. At every iteration, we calculated the average relative errors of the unknowns u, v, w, p, and T using
R c = 1 n   .   m i = 1 i = m j = 1 j = n | ( F i , j s + 1 F i , j s ) F i , j s + 1 |
where F represents the unknown function; s is the iteration number; and (i, j) are the coordinates on the grid. A convergent solution is recorded when R c 1.0 × 10 6 for all the unknowns in two successive iterations.

4. Results and Discussion

The main concern of the current investigation was to identify the most prominent hybrid fluid to be used in cooling the computer chip size devices. The hybrid fluids were mainly a combination of two nanoparticles or a single particle composed of two materials mixed in water. A typical heat flux of 75,000 W/m2 heat flux was adopted in this model with a fixed flow rate of 0.15 USGPM (i.e., equivalent to a velocity at the entrance of the pipe of 0.2086 m/s. The flow was Newtonian and laminar. Figure 1c presents the model in three dimensions. The upward arrows mimic the heat flux applied at the bottom of the aluminum block. The flow enters the cylinder and penetrates the porous block and leaves from the other end. The temperature at the inlet was measured experimentally and identified as Tin. The experiment was conducted with a nanofluid with a concentration of 0.1% Al2O3 in water. Using COMSOL, the model was three-dimensionally generated and all physical properties were assumed to be constant (see Table 1).

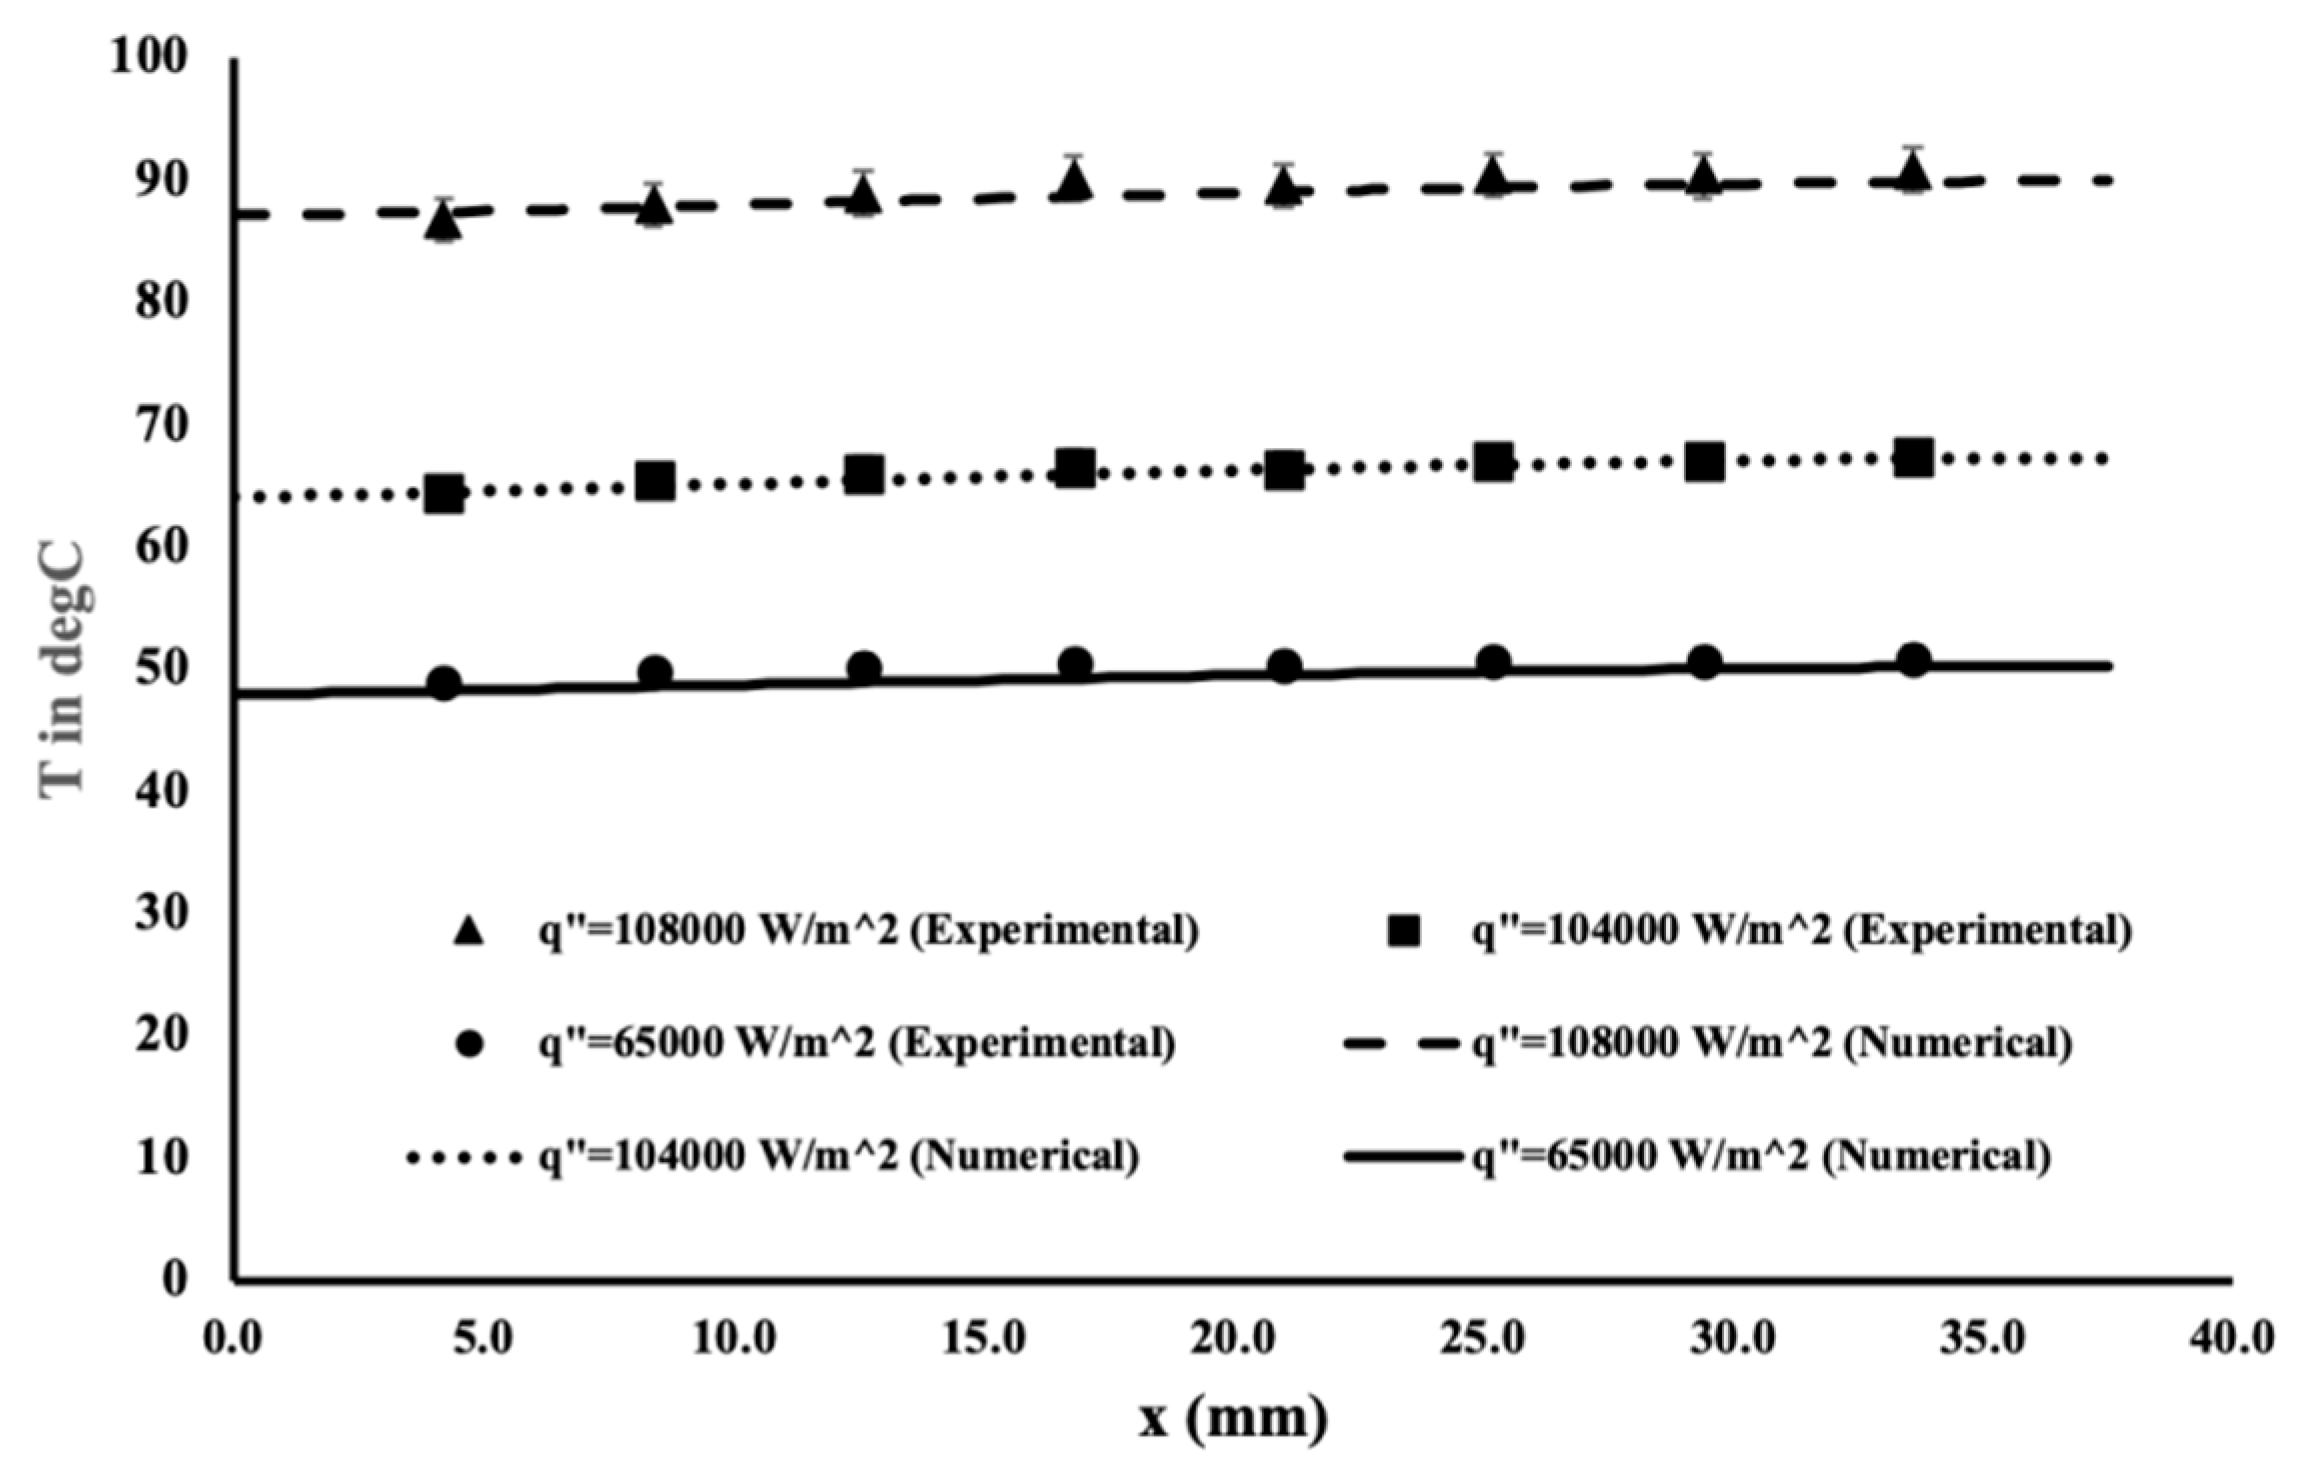
4.1. Experimental Measurement of Heat Enhancement

The experiment consisted of a flow of Al2O3 nanofluid in the porous block. As indicated earlier, the temperature was measured 1 mm below the porous block in the aluminum block. Thus, there were no disturbances of the flow in the test section. Numerically, COMSOL was used to solve the problem and to compare the results with the measured data. The physical properties of the nanofluid were taken from Ho et al. [8], who experimentally measured the properties of this nanofluid at a temperature of 24 °C. Table 1 displays the used physical properties where the subscript nf stands for nanofluid.
Figure 2 presents a comparison between the experimental data measured using the apparatus explained earlier with the numerical results. Three different heat fluxes were applied at a constant flow rate of 0.15 USGPM (i.e., 9.463 × 10⁻⁶ m3/s). As expected, an almost flat temperature distribution was obtained, indicating a uniformity of the temperature. An excellent agreement between the experimental data and the numerical results was observed. The temperature slope along the flow was positive, but the magnitude was very small. As the heat flux increased, it was obvious to notice a temperature increase. Thus, the good agreement of these results provided us with good confidence in the numerical model. Hence, the model will be used to predict the heat enhancement for a different hybrid mixture. Additional measurements were conducted with the nanofluid for different flow rates and heat fluxes and not presented here. The paper by Welsford et al. [22] depicts the results for different Al2O3/water mixtures.

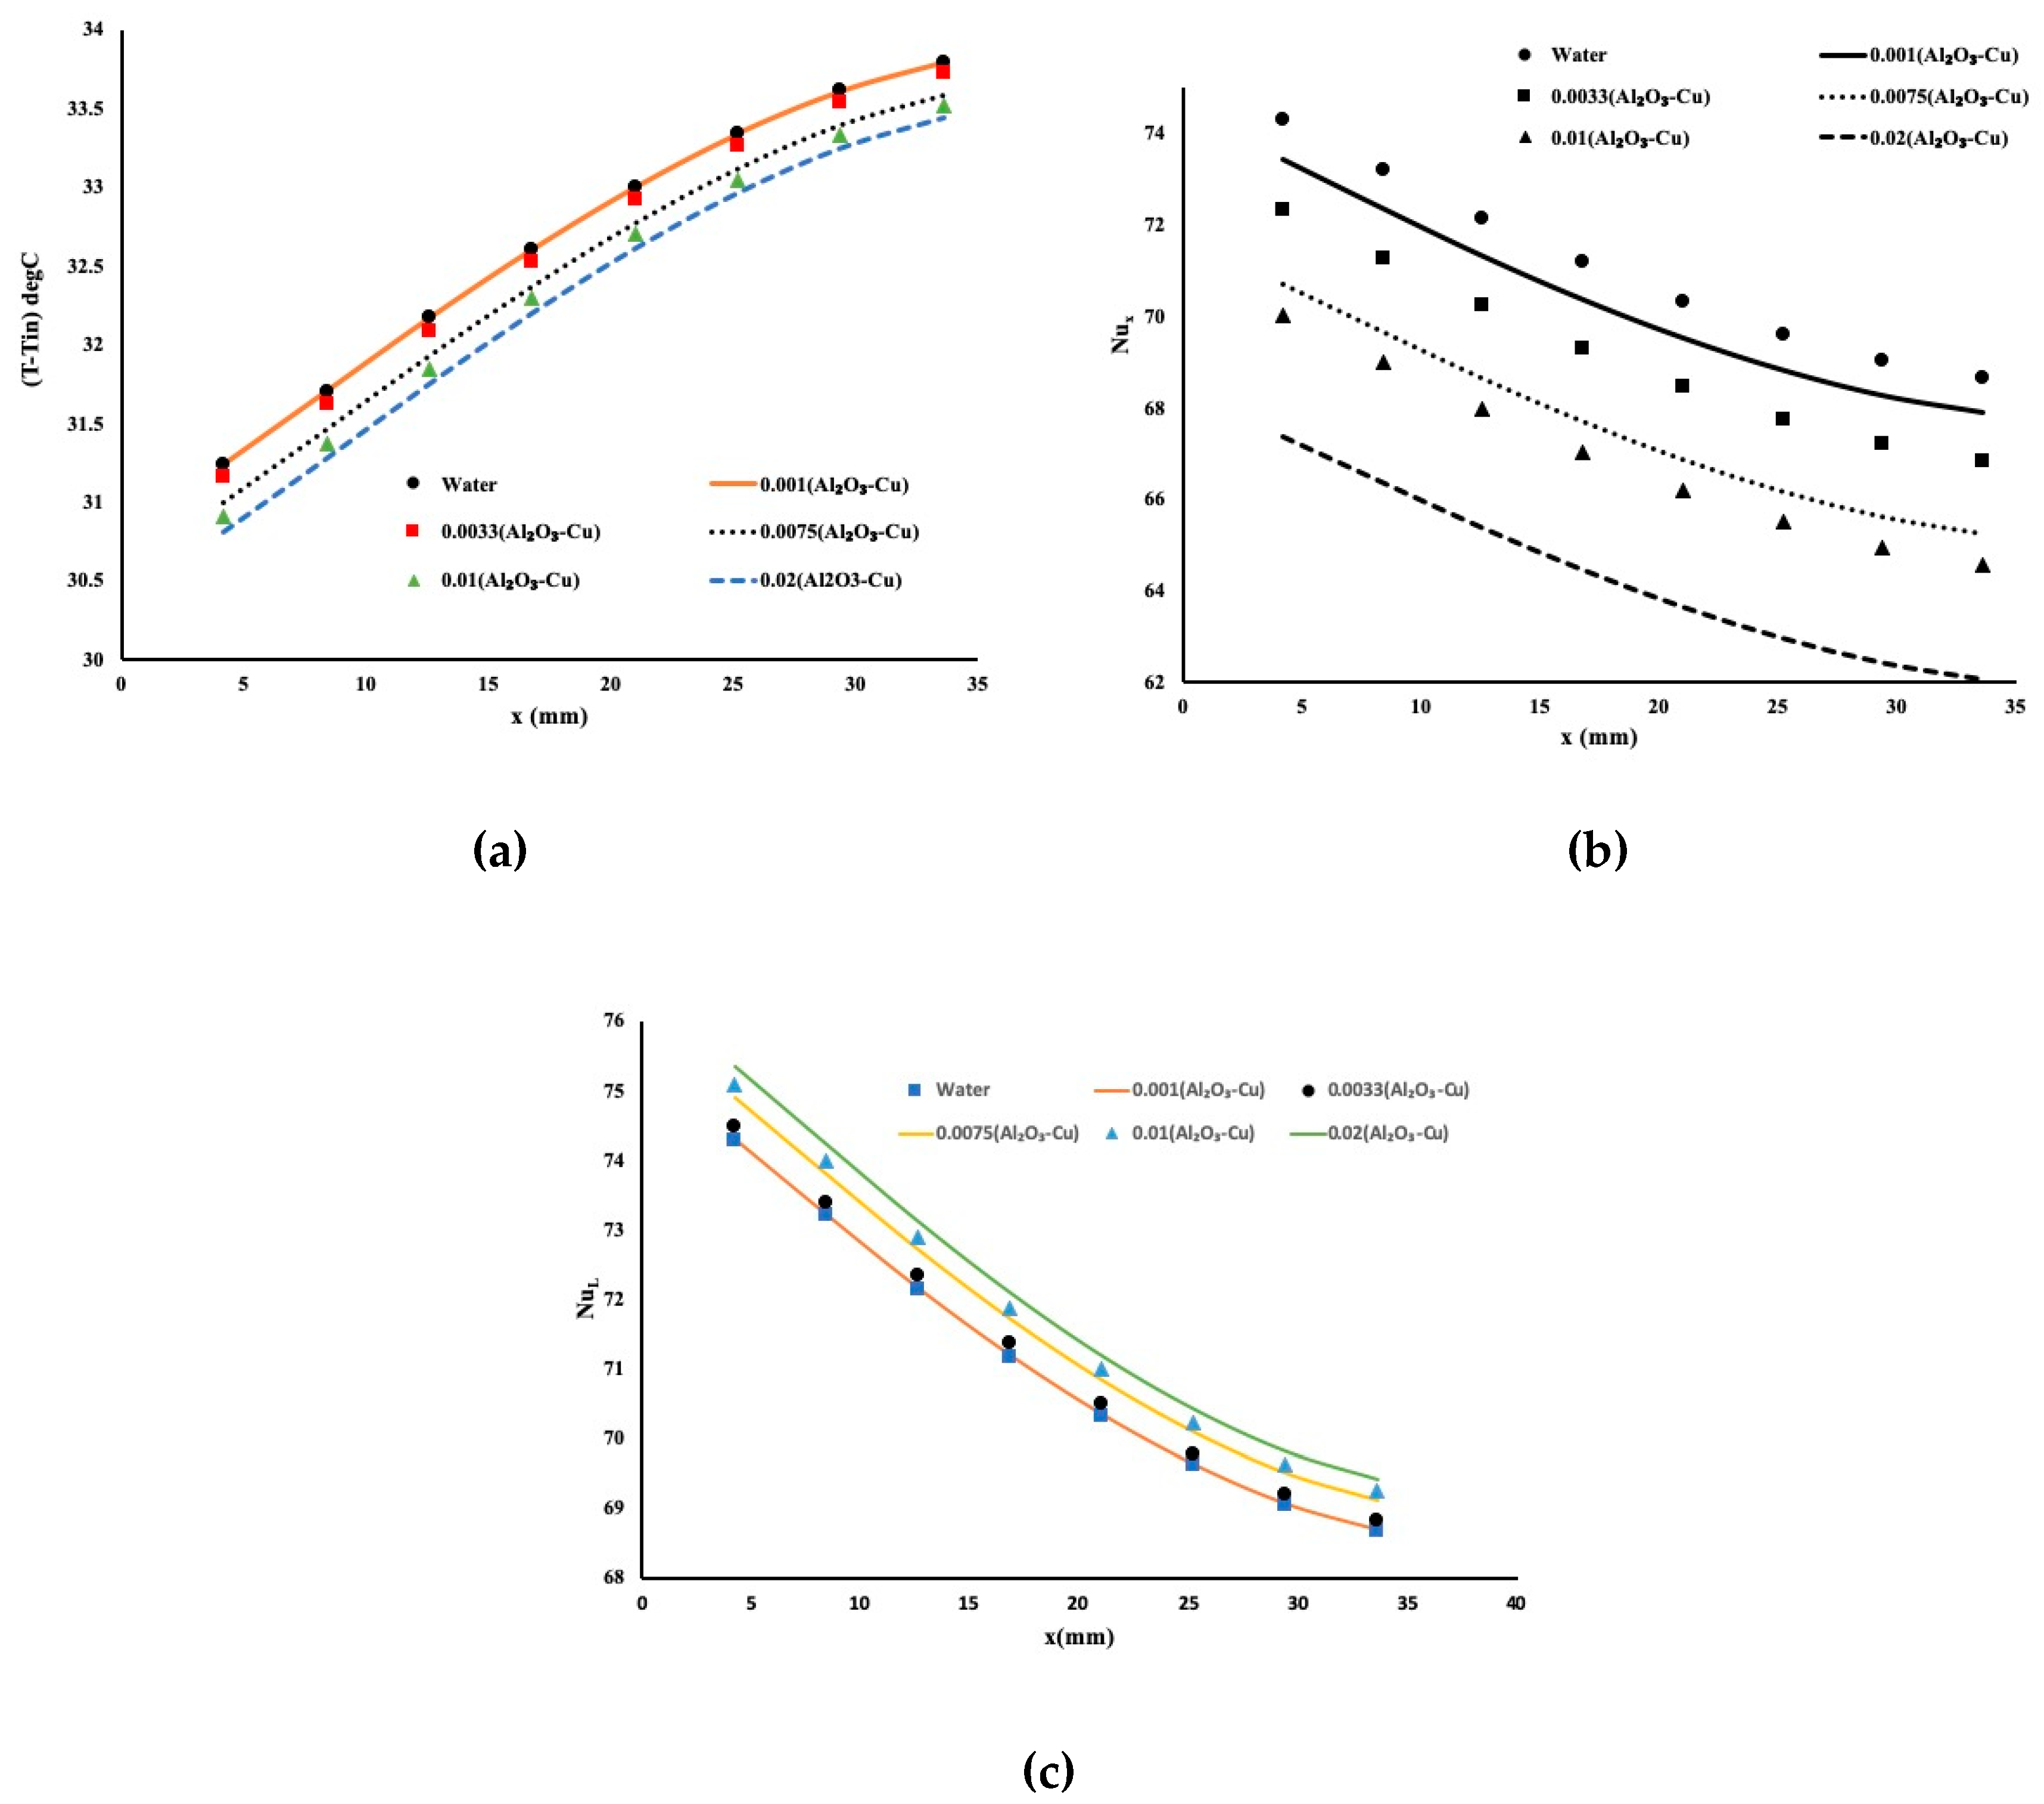
4.2. Heat Enhancement with Hybrid Al2O3–Cu Fluid: Experimental and Numerical Approach

Plant et al. [23] experimented with a porous channel filled with a 0.1% vol of Al2O3–Cu/water hybrid nanofluid in the presence of variable heat flux to determine the thermal performance in terms of Nusselt number and index of performance by varying the pressure of the hybrid nanofluid. The size of the used hybrid nanoparticles was 28   ±   11 nm. They reported a remarkable 6–11% thermal enhancement compared to the commercial Al2O3–water nanofluid even in the presence of a 0.0001% weight of Cu concentration in the hybrid nanofluid. The presence of a negligible amount of Cu nanoparticles astonishingly enhanced the local Nusselt number, which indicates a larger heat removal. Their numerical data further matched those of the experimental one with an error of less than 5%.
The work by Plant et al. [23] has been extended numerically by taking into consideration five different concentrations of Al2O3–Cu: 0.1%, 0.33%, 0.75%, 1%, and 2%. All physical properties were obtained from the experimental work of Selvakumar and Suresh [13] as well as from the paper by Takabi et al. [15]. The physical properties were measured at 30 °C. Table 2 presents the physical properties of this hybrid fluid where the subscript hnf stands for hybrid fluid.
As seen in Table 2, as the concentration of nanoparticles increased, the Prandtl number increased accordingly when compared to the Al2O3/water nanofluid. The heat flux applied was constant and equal to q” = 75,000 W/m2 and the inlet temperature was set constant as equal to Tin = 20 °C.
Figure 3 presents the heat enhancement for this hybrid mixture. With a constant flow rate and constant heat flux, Figure 3a exhibits the temperature variation obtained in the aluminum block 1 mm below the flow in the porous block. It is evident from the results that the excellent performance of this hybrid fluid as the concentration of copper and aluminum oxide particles increased. More heat was extracted from the hot plate even with such a short travelling distance. The temperature slope was positive, indicating that as the flow pushes the fluid toward the exit of the test cavity, heat is accumulated in the fluid. Another approach to investigate the heat extraction is presented in Figure 3b, which is the local Nusselt number Nux along with the flow. Here, the local Nusselt number is defined as
Nu x = h x ×   De k hnf
where De is the hydraulic diameter of the porous block equal to 0.019 m; k hnf is the conductivity of the hybrid fluid; and h x is the local heat convection coefficient known as the ratio of the applied heat flux of 75,000 W/m2 over the temperature difference presented in Figure 3a. In Figure 3b, the local variation of the Nusselt number showed a pronounced value for water and very low value in general for the highest composition of the hybrid fluid. However, by using a common value for conductivity, in this case, water conductivity, Figure 3c shows a more realistic local Nusselt number, identified as NuL, for different hybrid mixtures. Here, the local Nusselt number, NuL, is defined as the ratio of the local heat convection multiplied by the hydraulic diameter and divided by the conductivity of the water. As expected and in accordance with our findings in Figure 3a, the highest composition of Al2O3–Cu showed the most favorable mixture for heat extraction. One may conclude from this finding that the presence of the copper had an effect on heat extraction due to the high conductivity of the copper. Other aspects need to be examined such as the friction factor and the pressure drop, which will be discussed later.

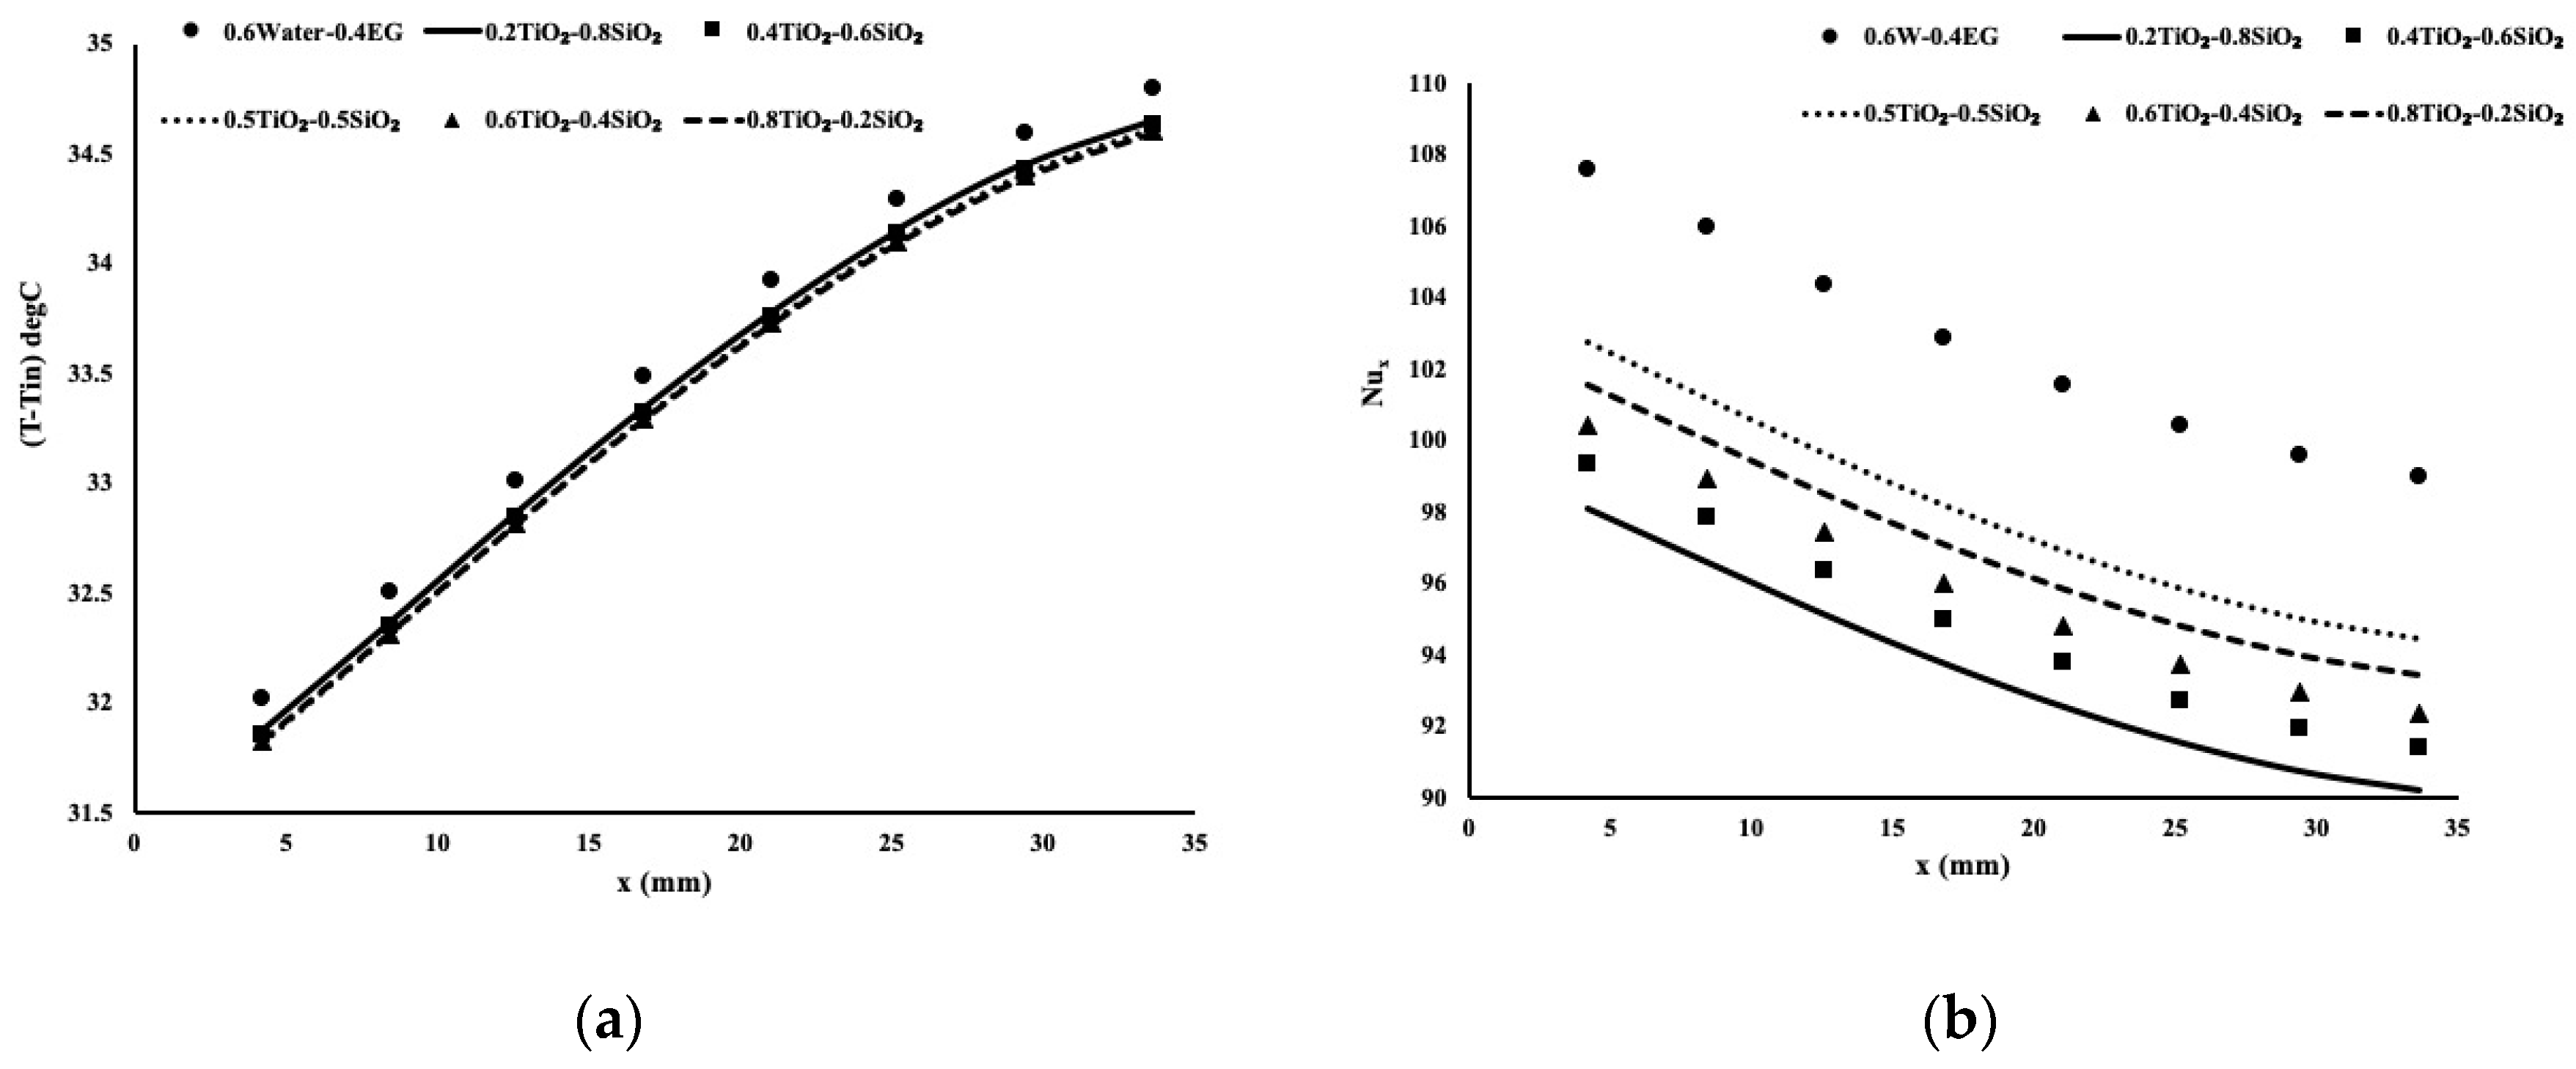
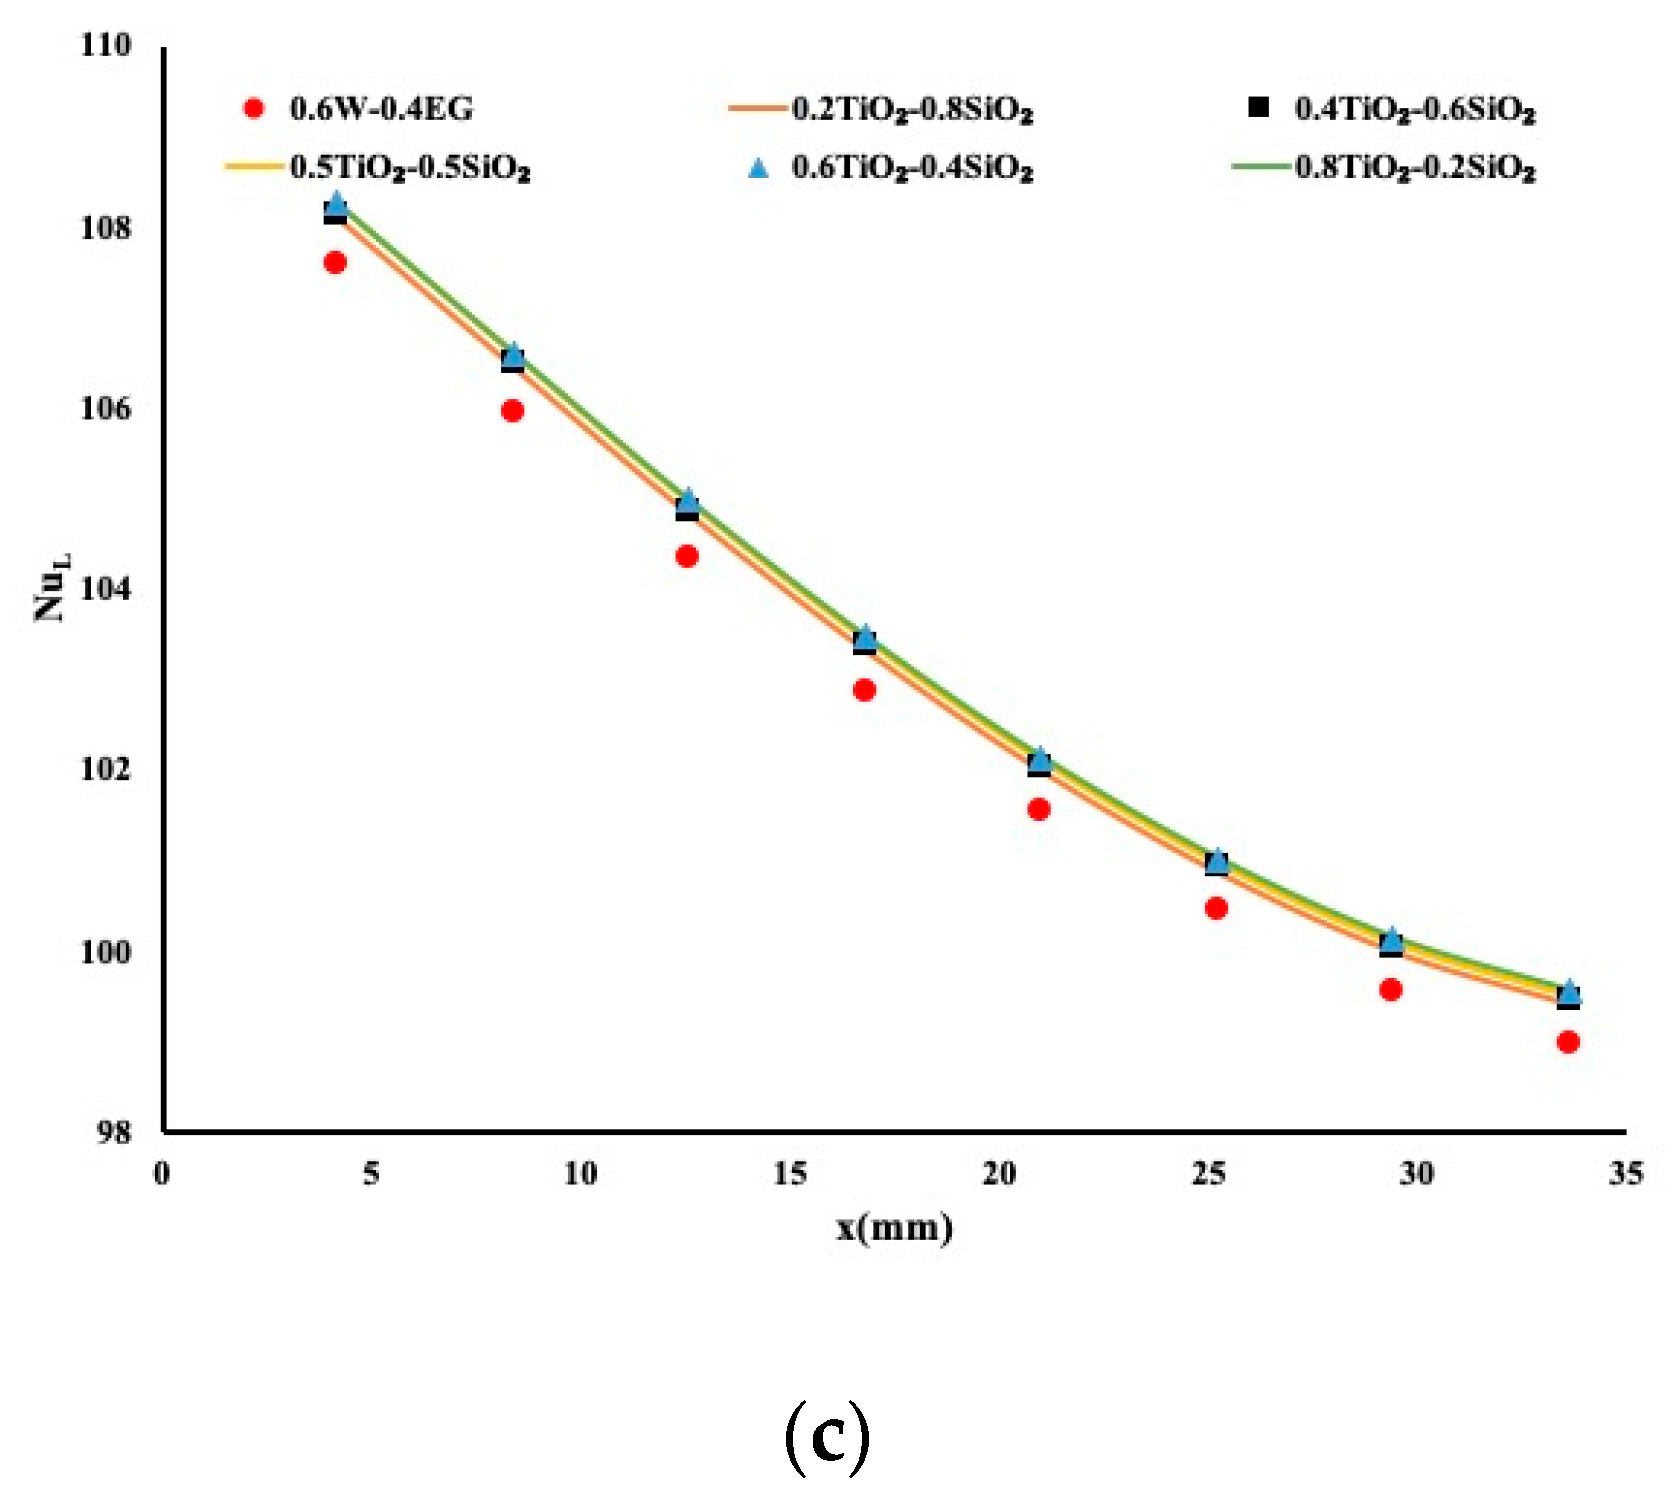
4.3. Heat Enhancement with Hybrid TiO2–SiO2 Fluid: Numerical Approach

Abdul Hamid et al. [16], then Nabil et al. [17] conducted a very accurate and detailed measurement of the physical properties of the TiO2–SiO2 hybrid fluid. The base fluid, in this case, was a mixture of water and ethylene glycol. The composition was composed of 60% water and 40% ethylene glycol. Different compositions of TiO2–SiO2 have been proposed and their viscosities and thermal conductivities were obtained for a range of temperatures from 30 °C to 80 °C. The authors concluded that heat enhancement was obtained when the TiO2–SiO2 mixtures were 40:60 or 80:20. These mixtures provided better heat enhancement than the other compositions, which were 20:80, 50:50, and 60:20. It appears that the less performed mixture was the composition 50:50.
Here, we conducted the study of forced convection with all mixtures of 20:80, 40:60, 50:50, 60:80 of TiO2–SiO2 with a base fluid composed of 60% water and 40% ethylene glycol. Table 2 presents the physical properties of the mixtures. Identical heat flux was applied at 75,000 W/m2 and the inlet temperature was set at 20 °C as in the previous case. In addition to the mixtures explained earlier, a mixture of 60% water and 40% ethylene glycol was computed and results compared with the hybrid mixture. Figure 4a presents the temperature distribution 1 mm below the porous block in the aluminum block. A positive slope of temperature in the direction of the flow can be observed. The higher temperature at the exit location was obvious due to the accumulated heat along the porous block. Higher temperatures for 60% water–40% EG indicated a lower performing fluid when compared to 80% TiO2–20% SiO2, which agrees with the observations by Abdul Hamid et al. [16] and Nabil et al. [17]. A 50:50 mixture showed poor performance. Figure 4b exhibits the local Nusselt number for each mixture whereas Figure 4c presents the local Nusselt number common to all mixtures. It is very obvious and evident that a mixture of 80% TiO2–20% SiO2 demonstrated the optimum mixtures for heat enhancement. The mixture of 60% water and 40% EG with no nanoparticles showed very poor performance. Thus, it is useful to have metallic nanoparticles in the mixture.

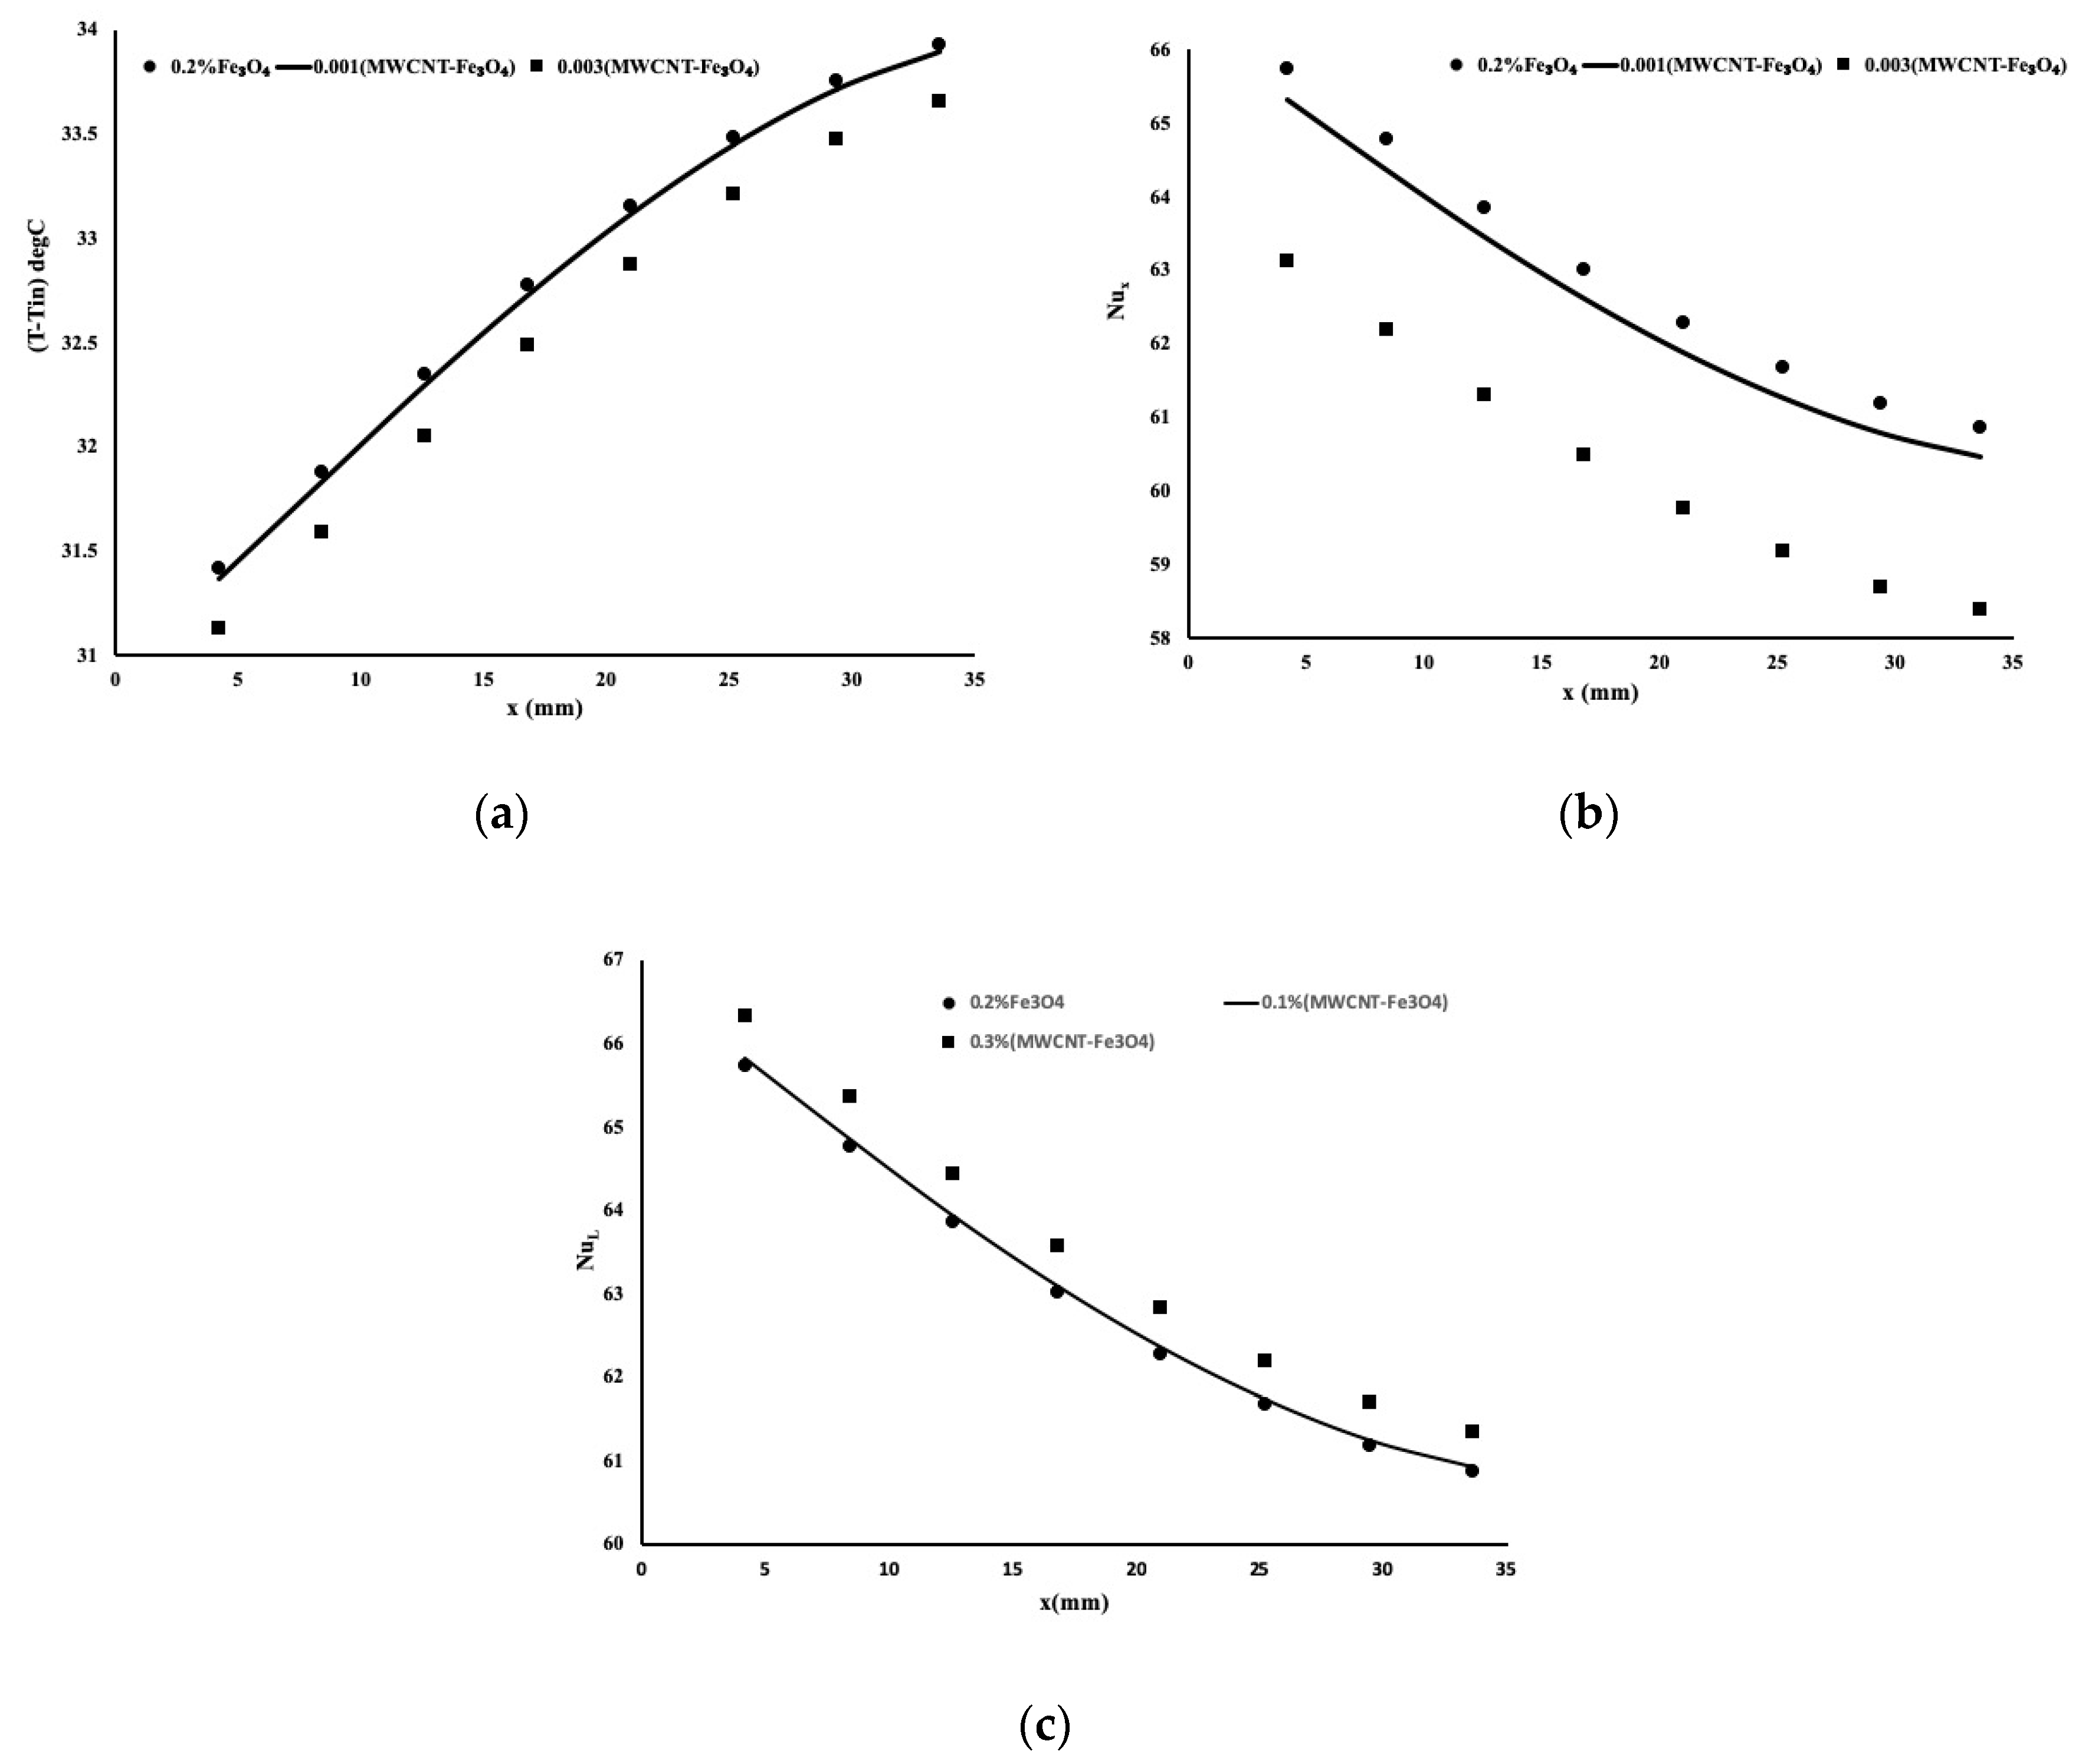
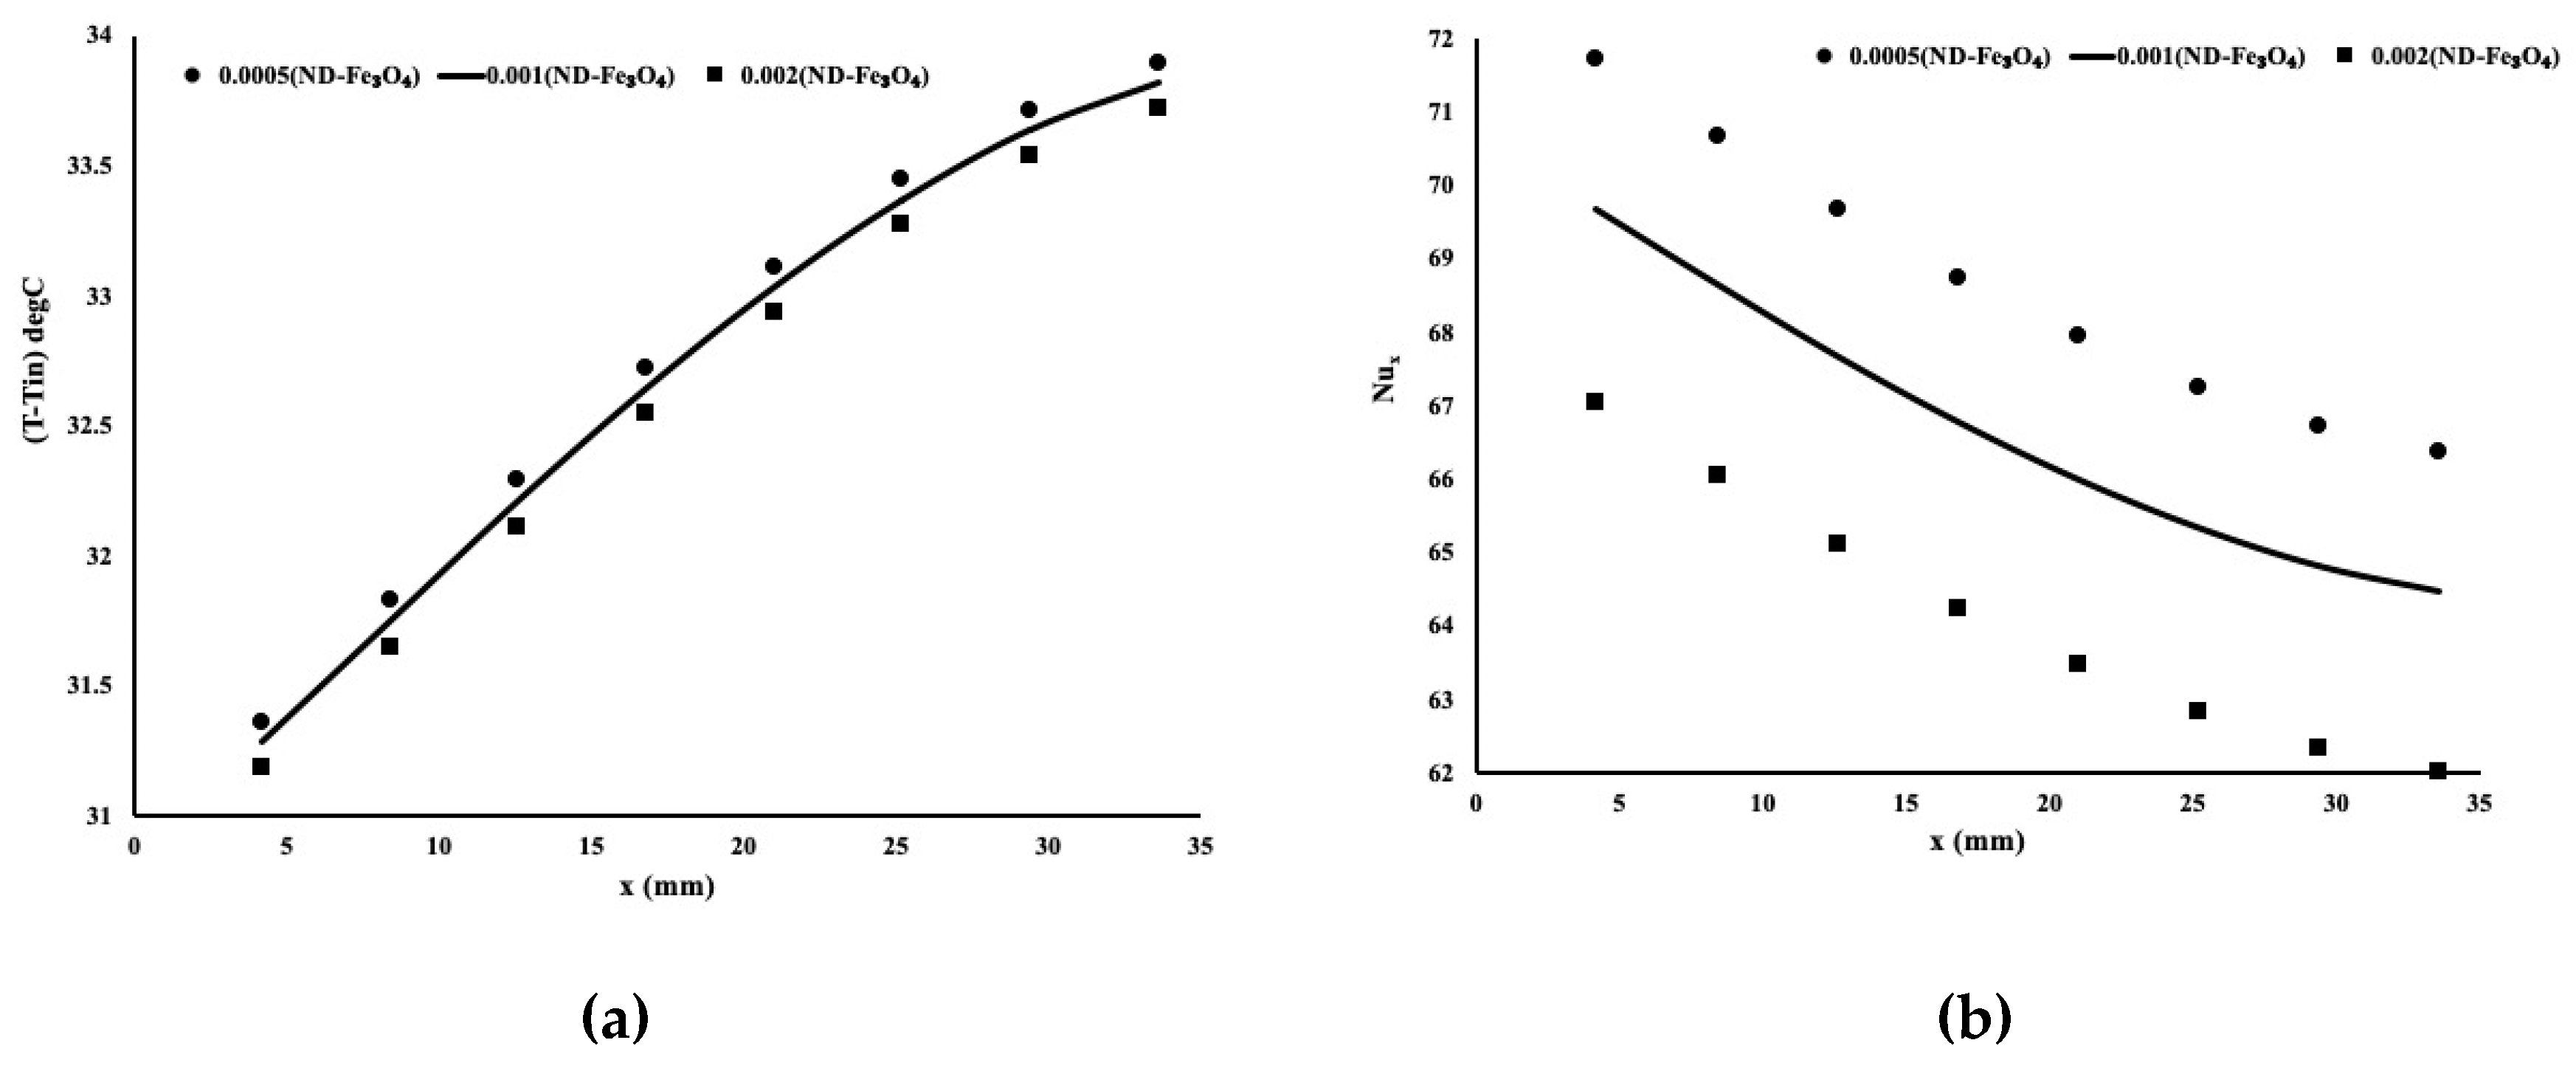
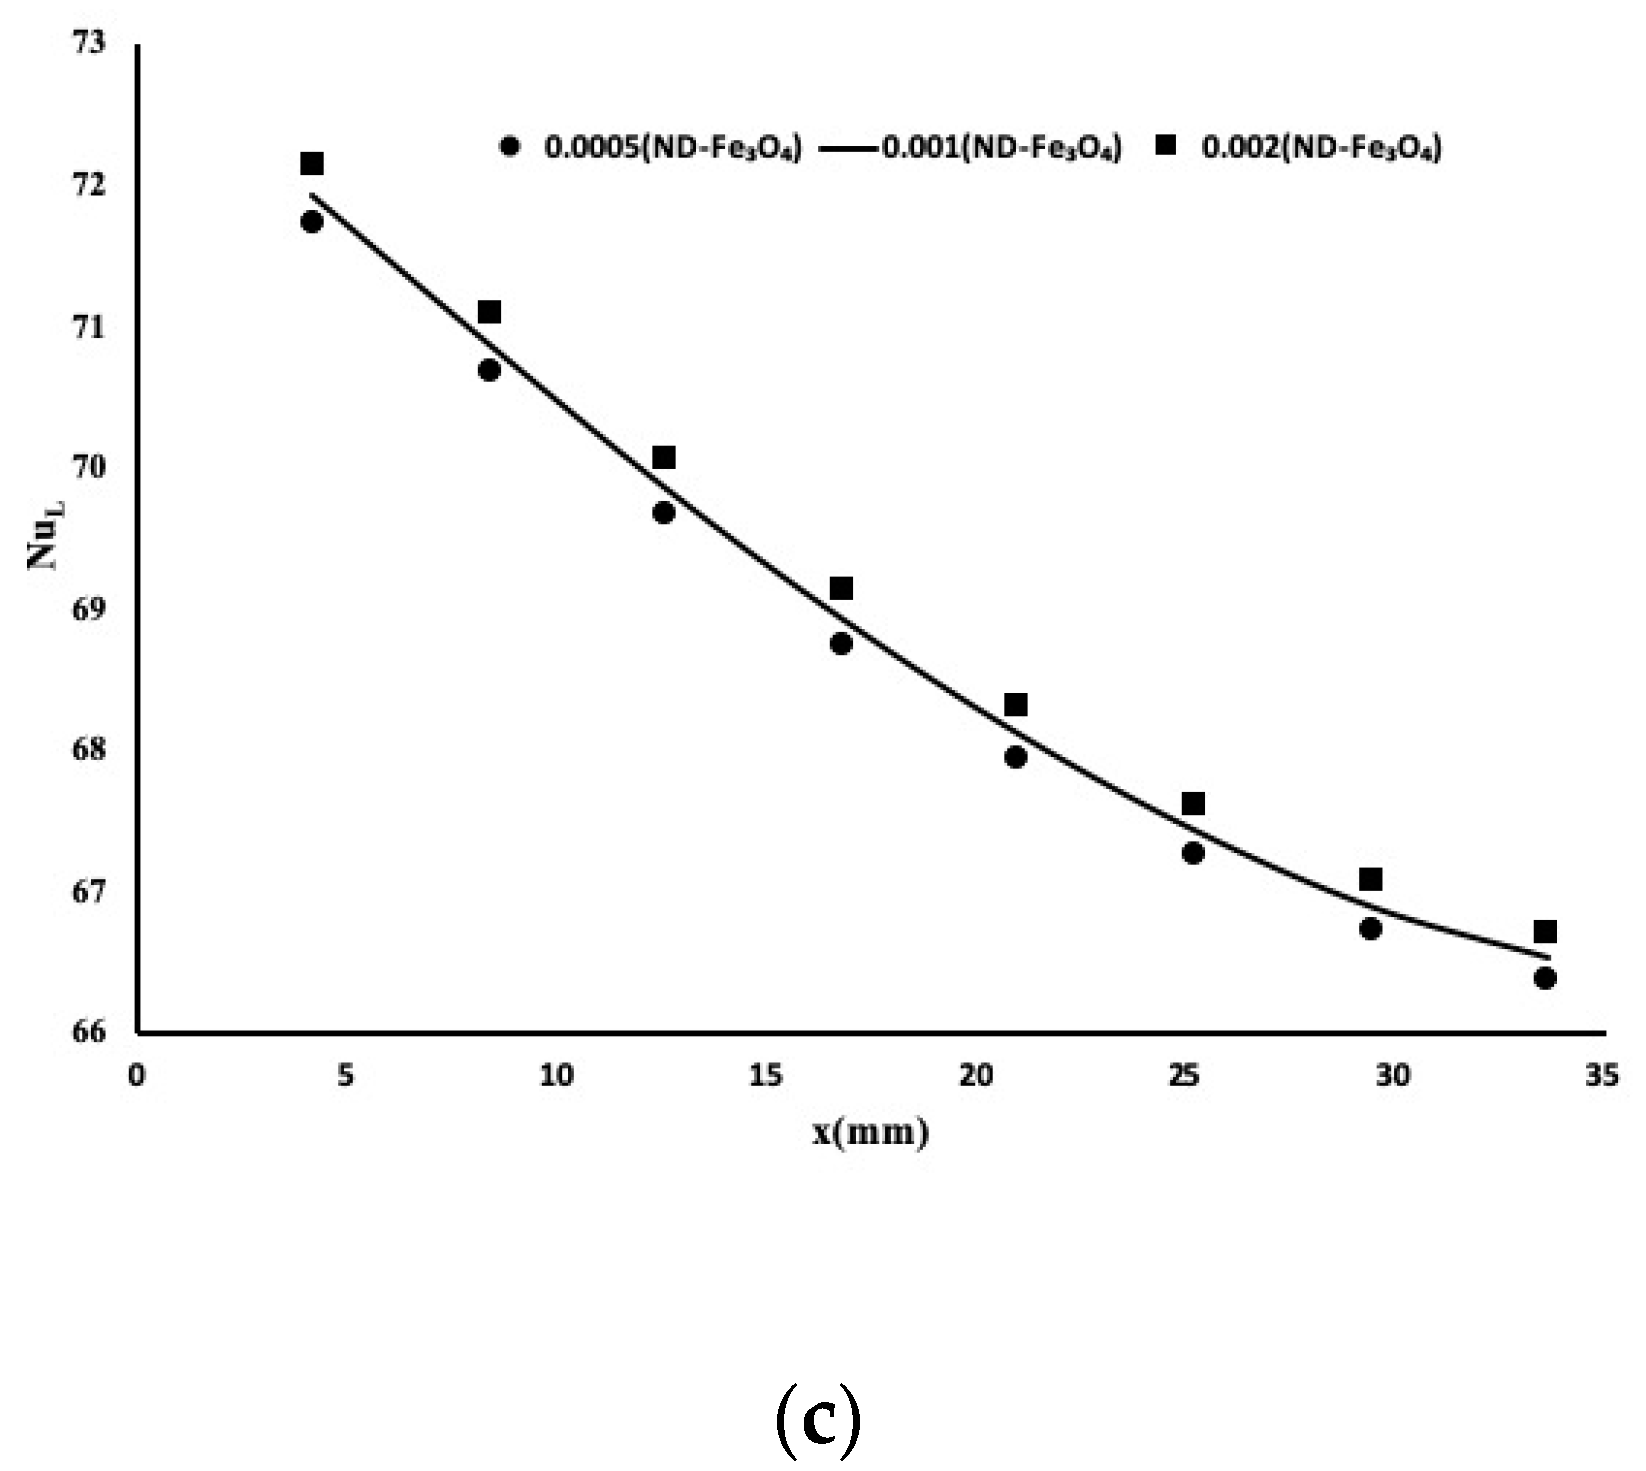
4.4. Heat Enhancement with Hybrid MWCNT–Fe3O4 and ND–Fe3O4: Numerical Approach

Additional hybrid mixtures were investigated with the aim to find the most suitable cooling fluid for electronic devices. This new mixture contained a mix of Multi-Walled Carbon Nanotubes (MWCNTs) with magnetic ferrous ferric oxide (Fe3O4) nanoparticles in water. Two different concentrations of these nanoparticles of 0.1% and 0.3% were investigated. Furthermore, another mixture of nanoparticles composed of nano-diamond (ND) particles mixed with Fe3O4 nanoparticles was also studied in water. Three different compositions were investigated with a concentration of 0.05%, 0.1%, and 0.2%, respectively. Table 2 presents the physical properties of these two new classes of hybrid fluids. These physical property data were measured accurately by Syam Sundar et al. [18,19,20,21] at a different range of temperatures.
With identical initial and boundary conditions, the two above mixtures were studied in a porous block under a forced convection scenario. An additional nanofluid of Fe3O4 in water was also studied to be used as a reference point to the other mixtures. Figure 5 presents a comparison of the temperature calculated at 1 mm below the porous block for the three mixtures of the MWCNT–Fe3O4 nanofluid. Figure 5a displays the temperature variation where it is obvious that the highest concentration of 0.3% MWCNT–Fe3O4 led to the best heat enhancement. However, the temperature profile for the three different mixtures was identical to the previous cases. Two local Nusselt numbers were calculated for this case and are shown in Figure 5b,c. The most interesting is shown in Figure 5c, where the local Nusselt number proved that the high concentration of MWCNT–Fe3O4 provided the most suitable mixture for heat extraction. If one examines the physical properties of this mixture, the viscosity is very low, which may indicate a lower pressure drop along with the flow. This finding will be discussed later.
The numerical experiment was repeated with the nano-diamond–Fe3O4 nanoparticles in water for three different concentrations. Figure 6a displays the temperature variation along with the flow. It is evident from Figure 6a that the highest composition of nanoparticles provided the best cooling fluid and Figure 6b,c highlights the local Nusselt number. As indicated, the best mixtures gave the lowest Nusselt number, therefore, justifying the temperature profile obtained in Figure 6a.
To visualize the flow pattern and the temperature distribution in 3D, Figure 7 displays the flow field and the heat transfer variation over the entire test cell. In Figure 7a, one can observe that the flow is moving along the entire block, which is mainly due to the laminar flow regime set for this experiment. The temperature variation is shown in Figure 7b and the positive slope of the temperature measured is obvious when examining the temperature variations along with the flow.

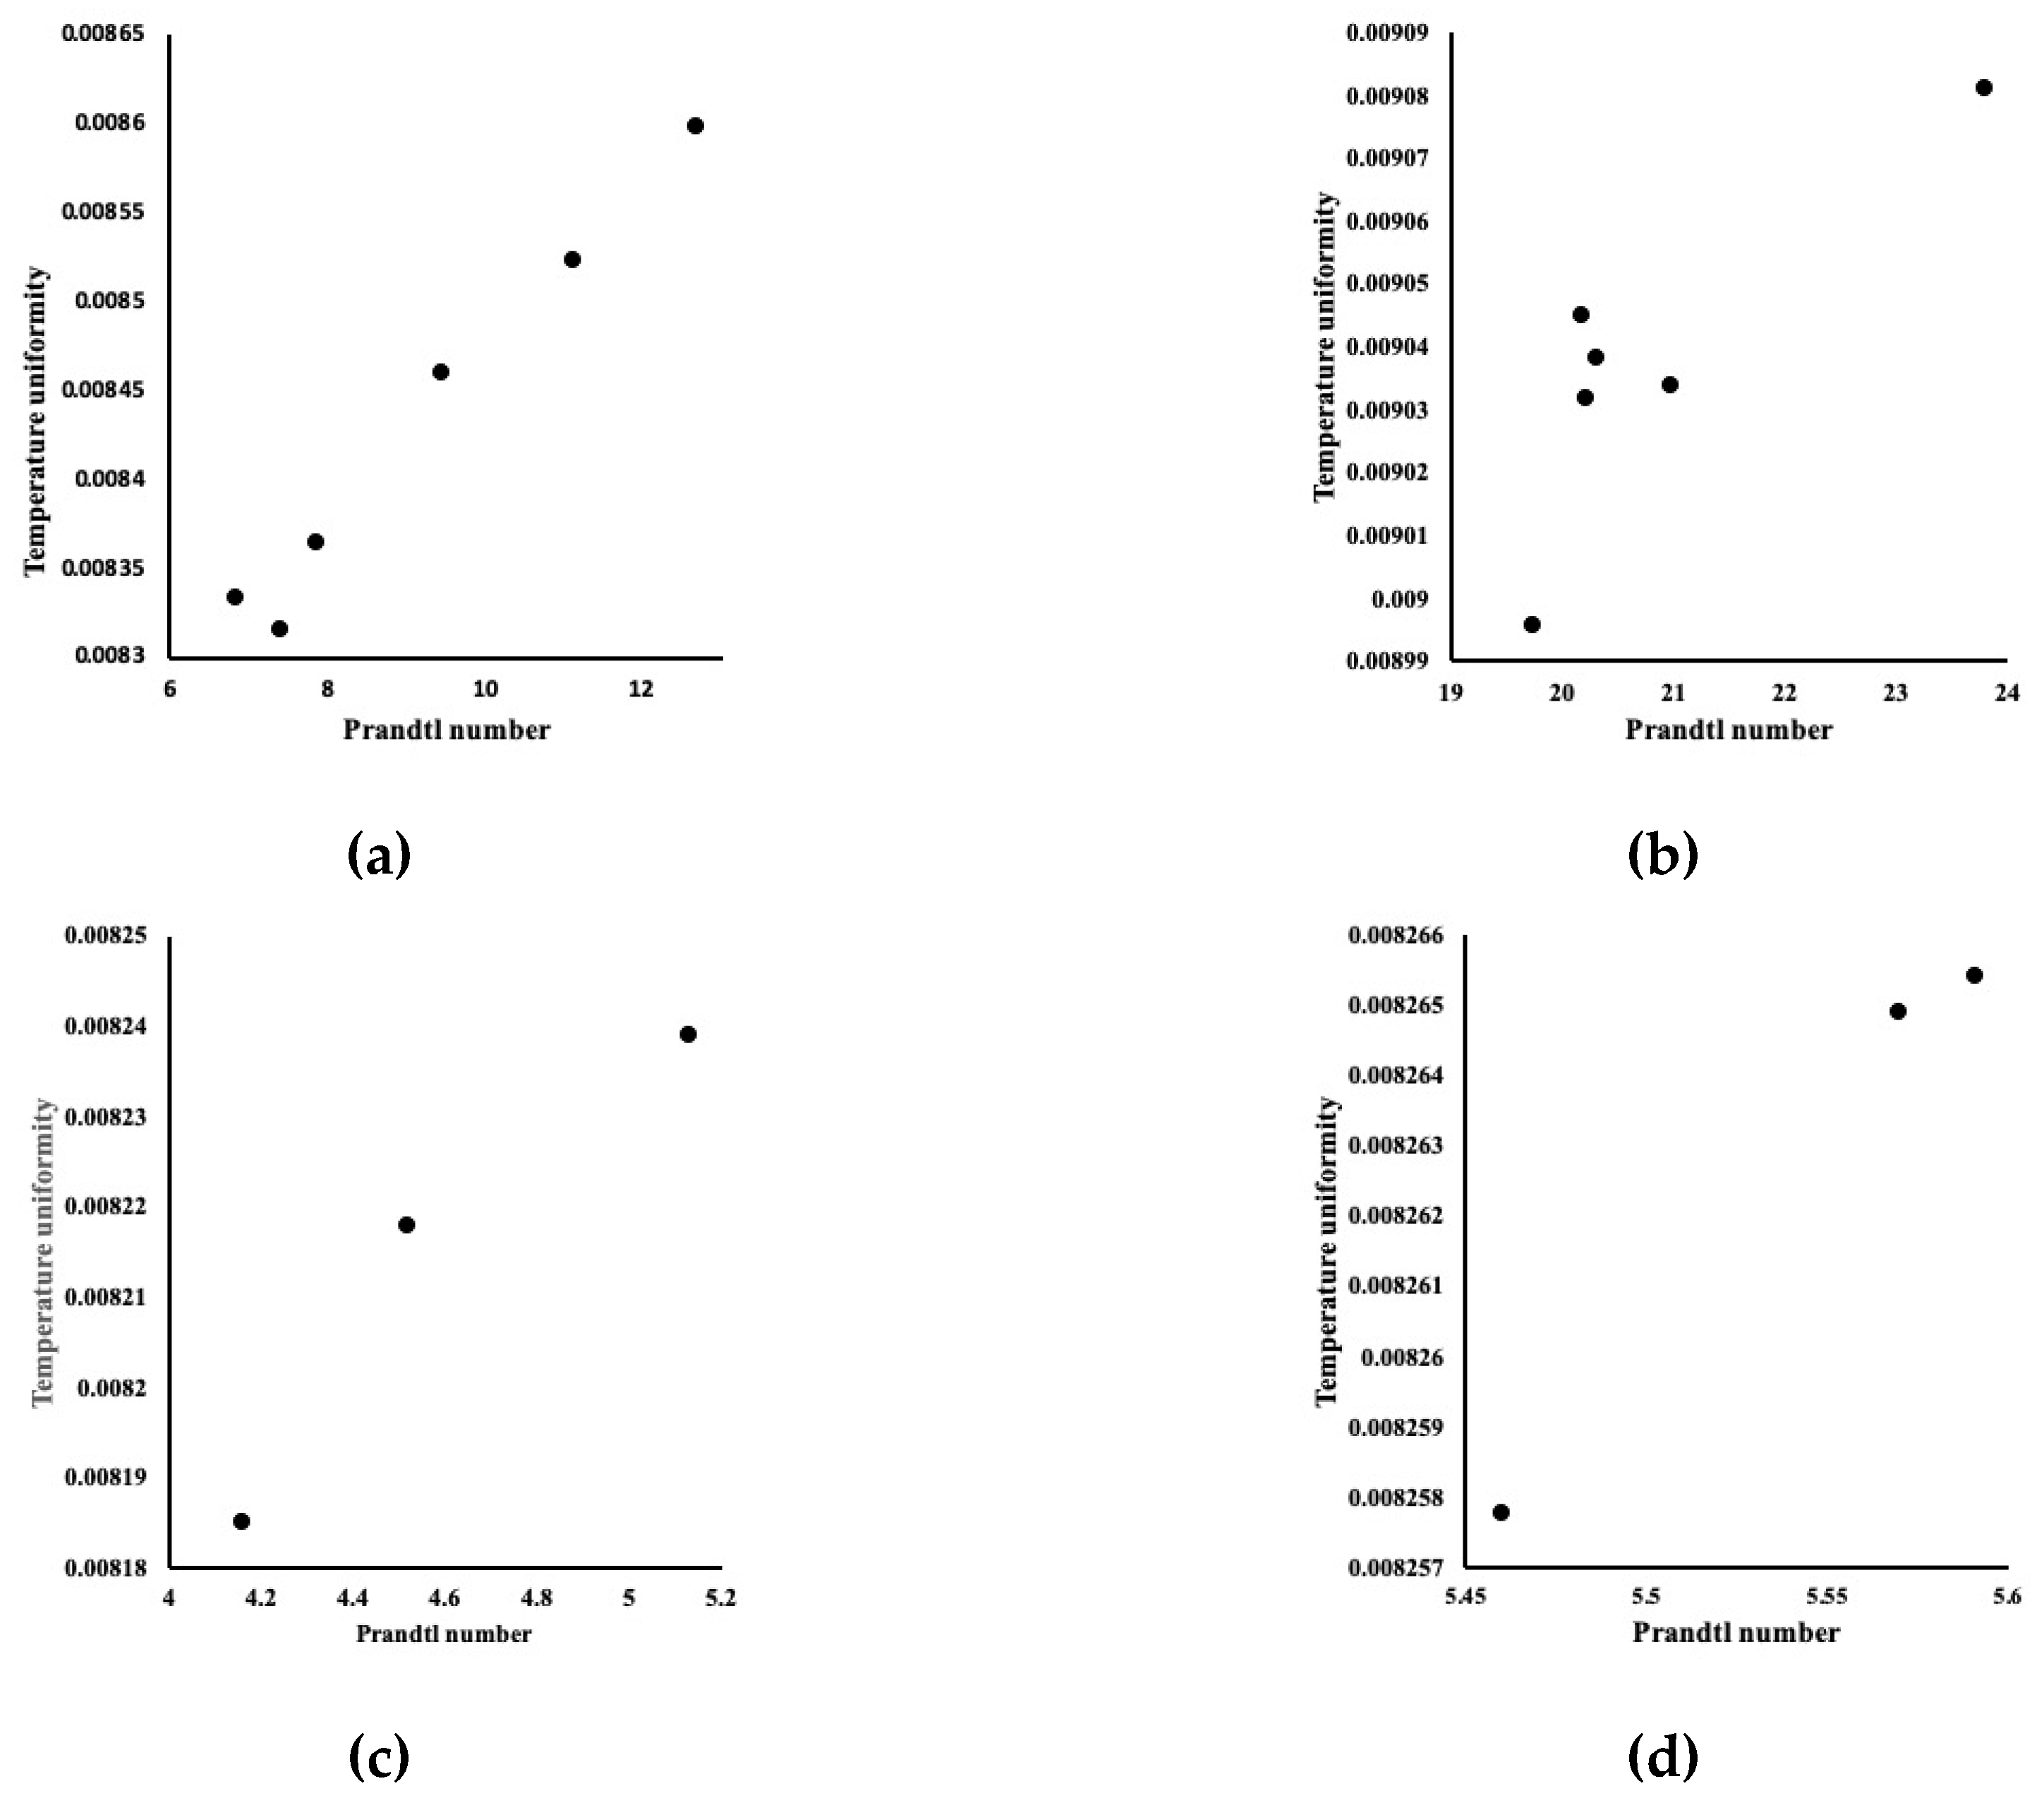
4.5. Temperature Uniformity

From an electronic cooling viewpoint, it is more important to measure the local surface temperature rather than the average surface temperature. To control the overall efficiency of the electronic devices, it is important to have a uniform temperature on their surfaces. To ensure the surface temperature uniformity (or so-called temperature lift), we calculated the following uniformity index;
Temperature   uniformity = T max T min T max
where Tmax and Tmin are the maximum and minimum temperatures calculated 1 mm below the porous block in degrees Kelvin. A zero or near zero value of uniformity index represents a perfect uniform temperature profile. Figure 8 presents the uniformity for all mixtures. Different mixtures were identified by their corresponding Prandtl number. It is noticeable that all mixtures provided an excellent temperature uniformity at the surface, which is also evident in Figure 7b. This finding is of great importance as in electronic cooling, the reliability and operating speed of the transistors depend on the surface temperature uniformity. Non-uniform temperature in a region of electronic component prolongs gate delay, which can affect its performance.

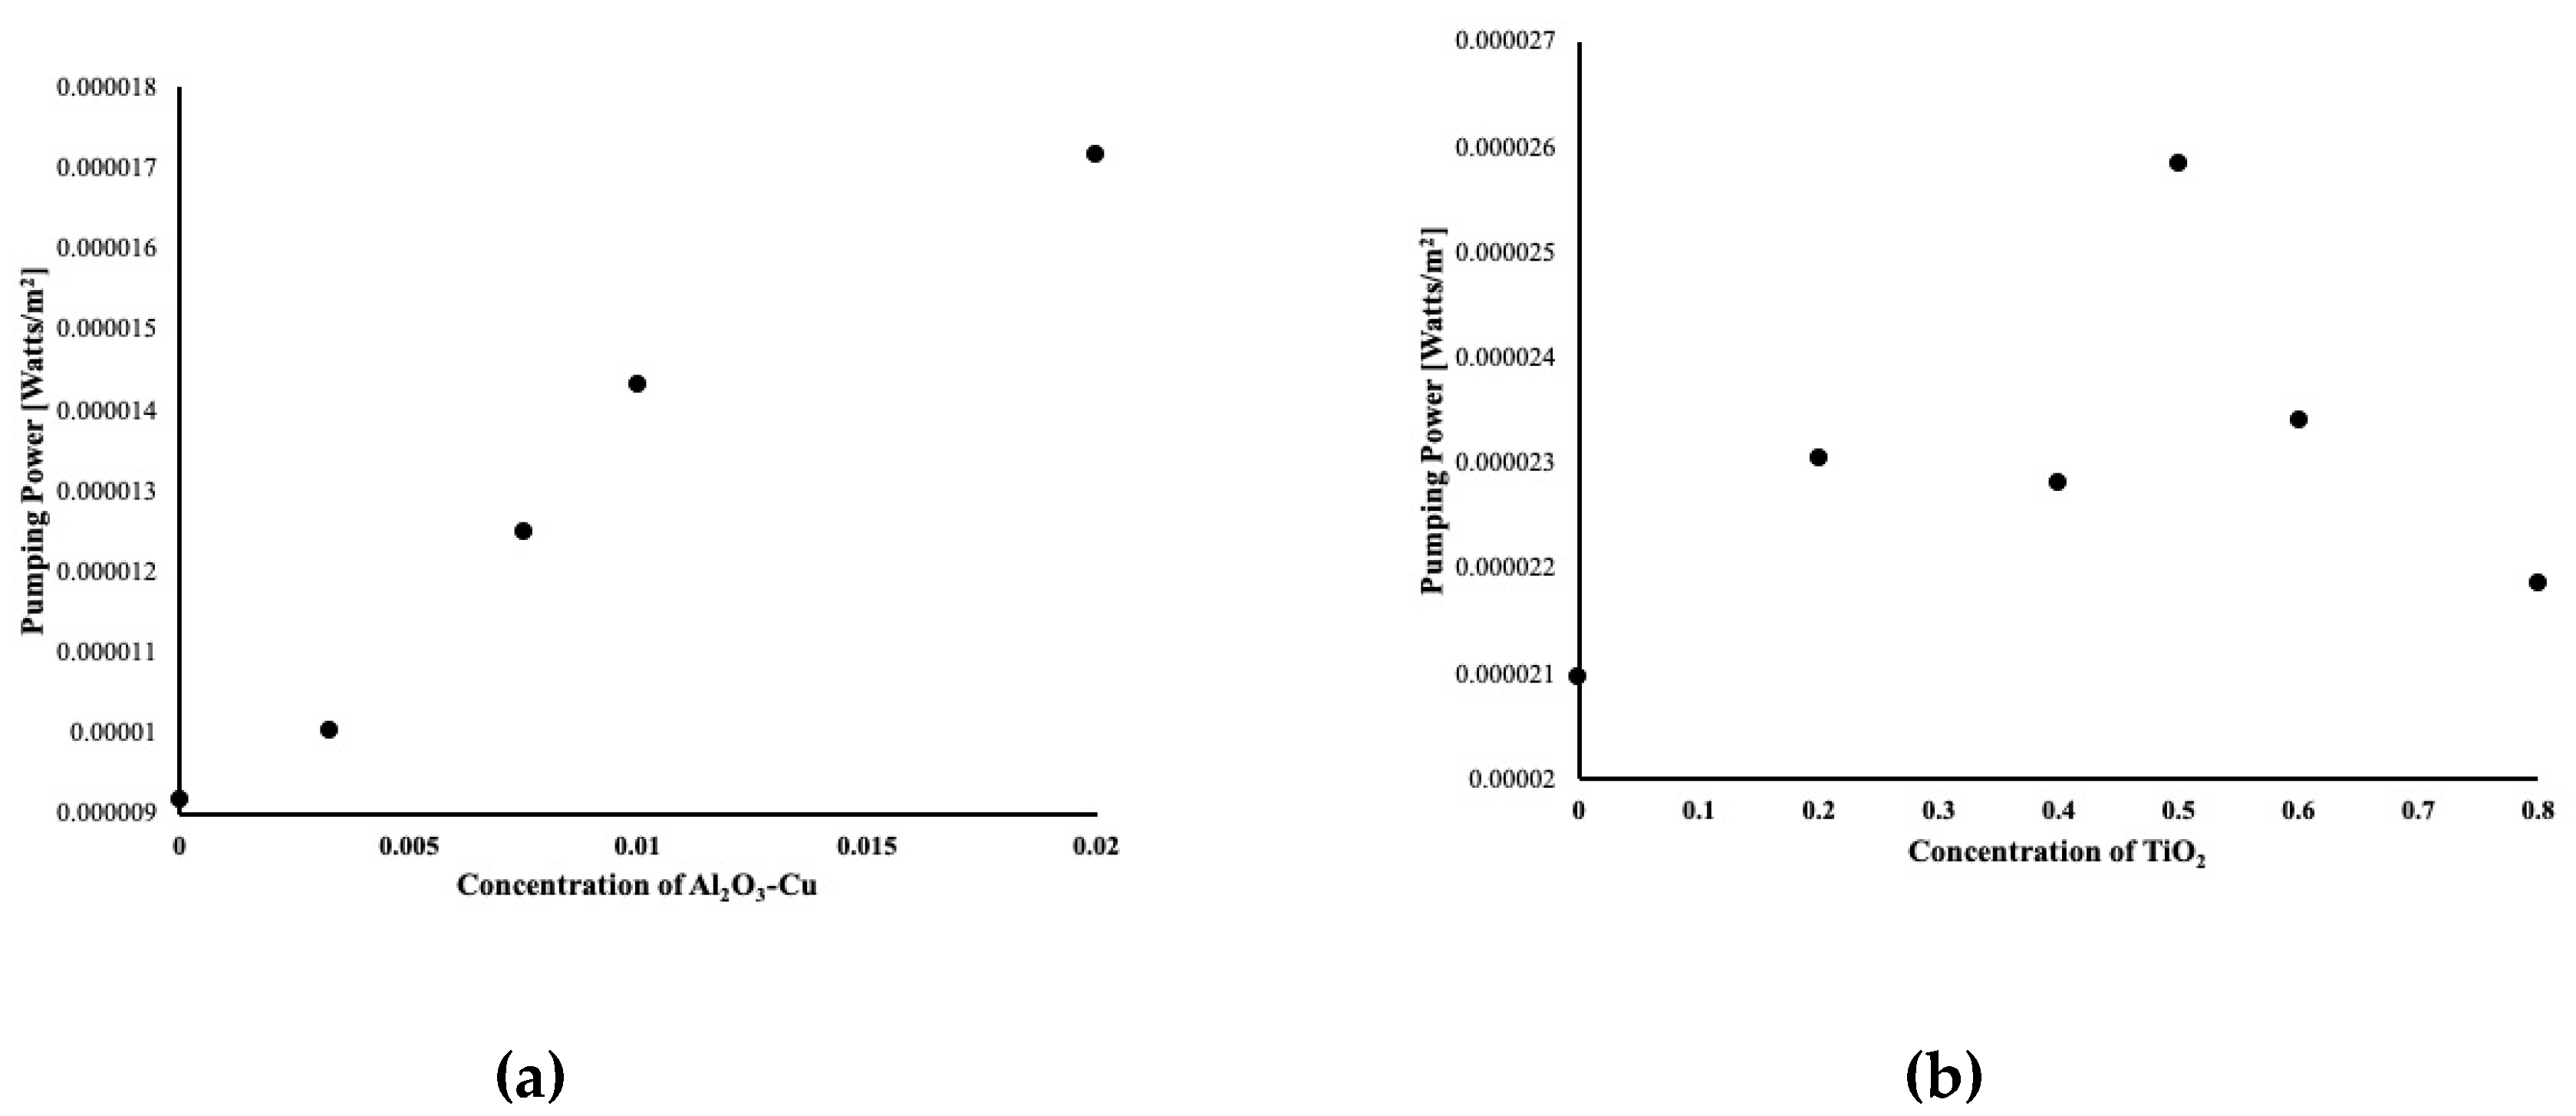
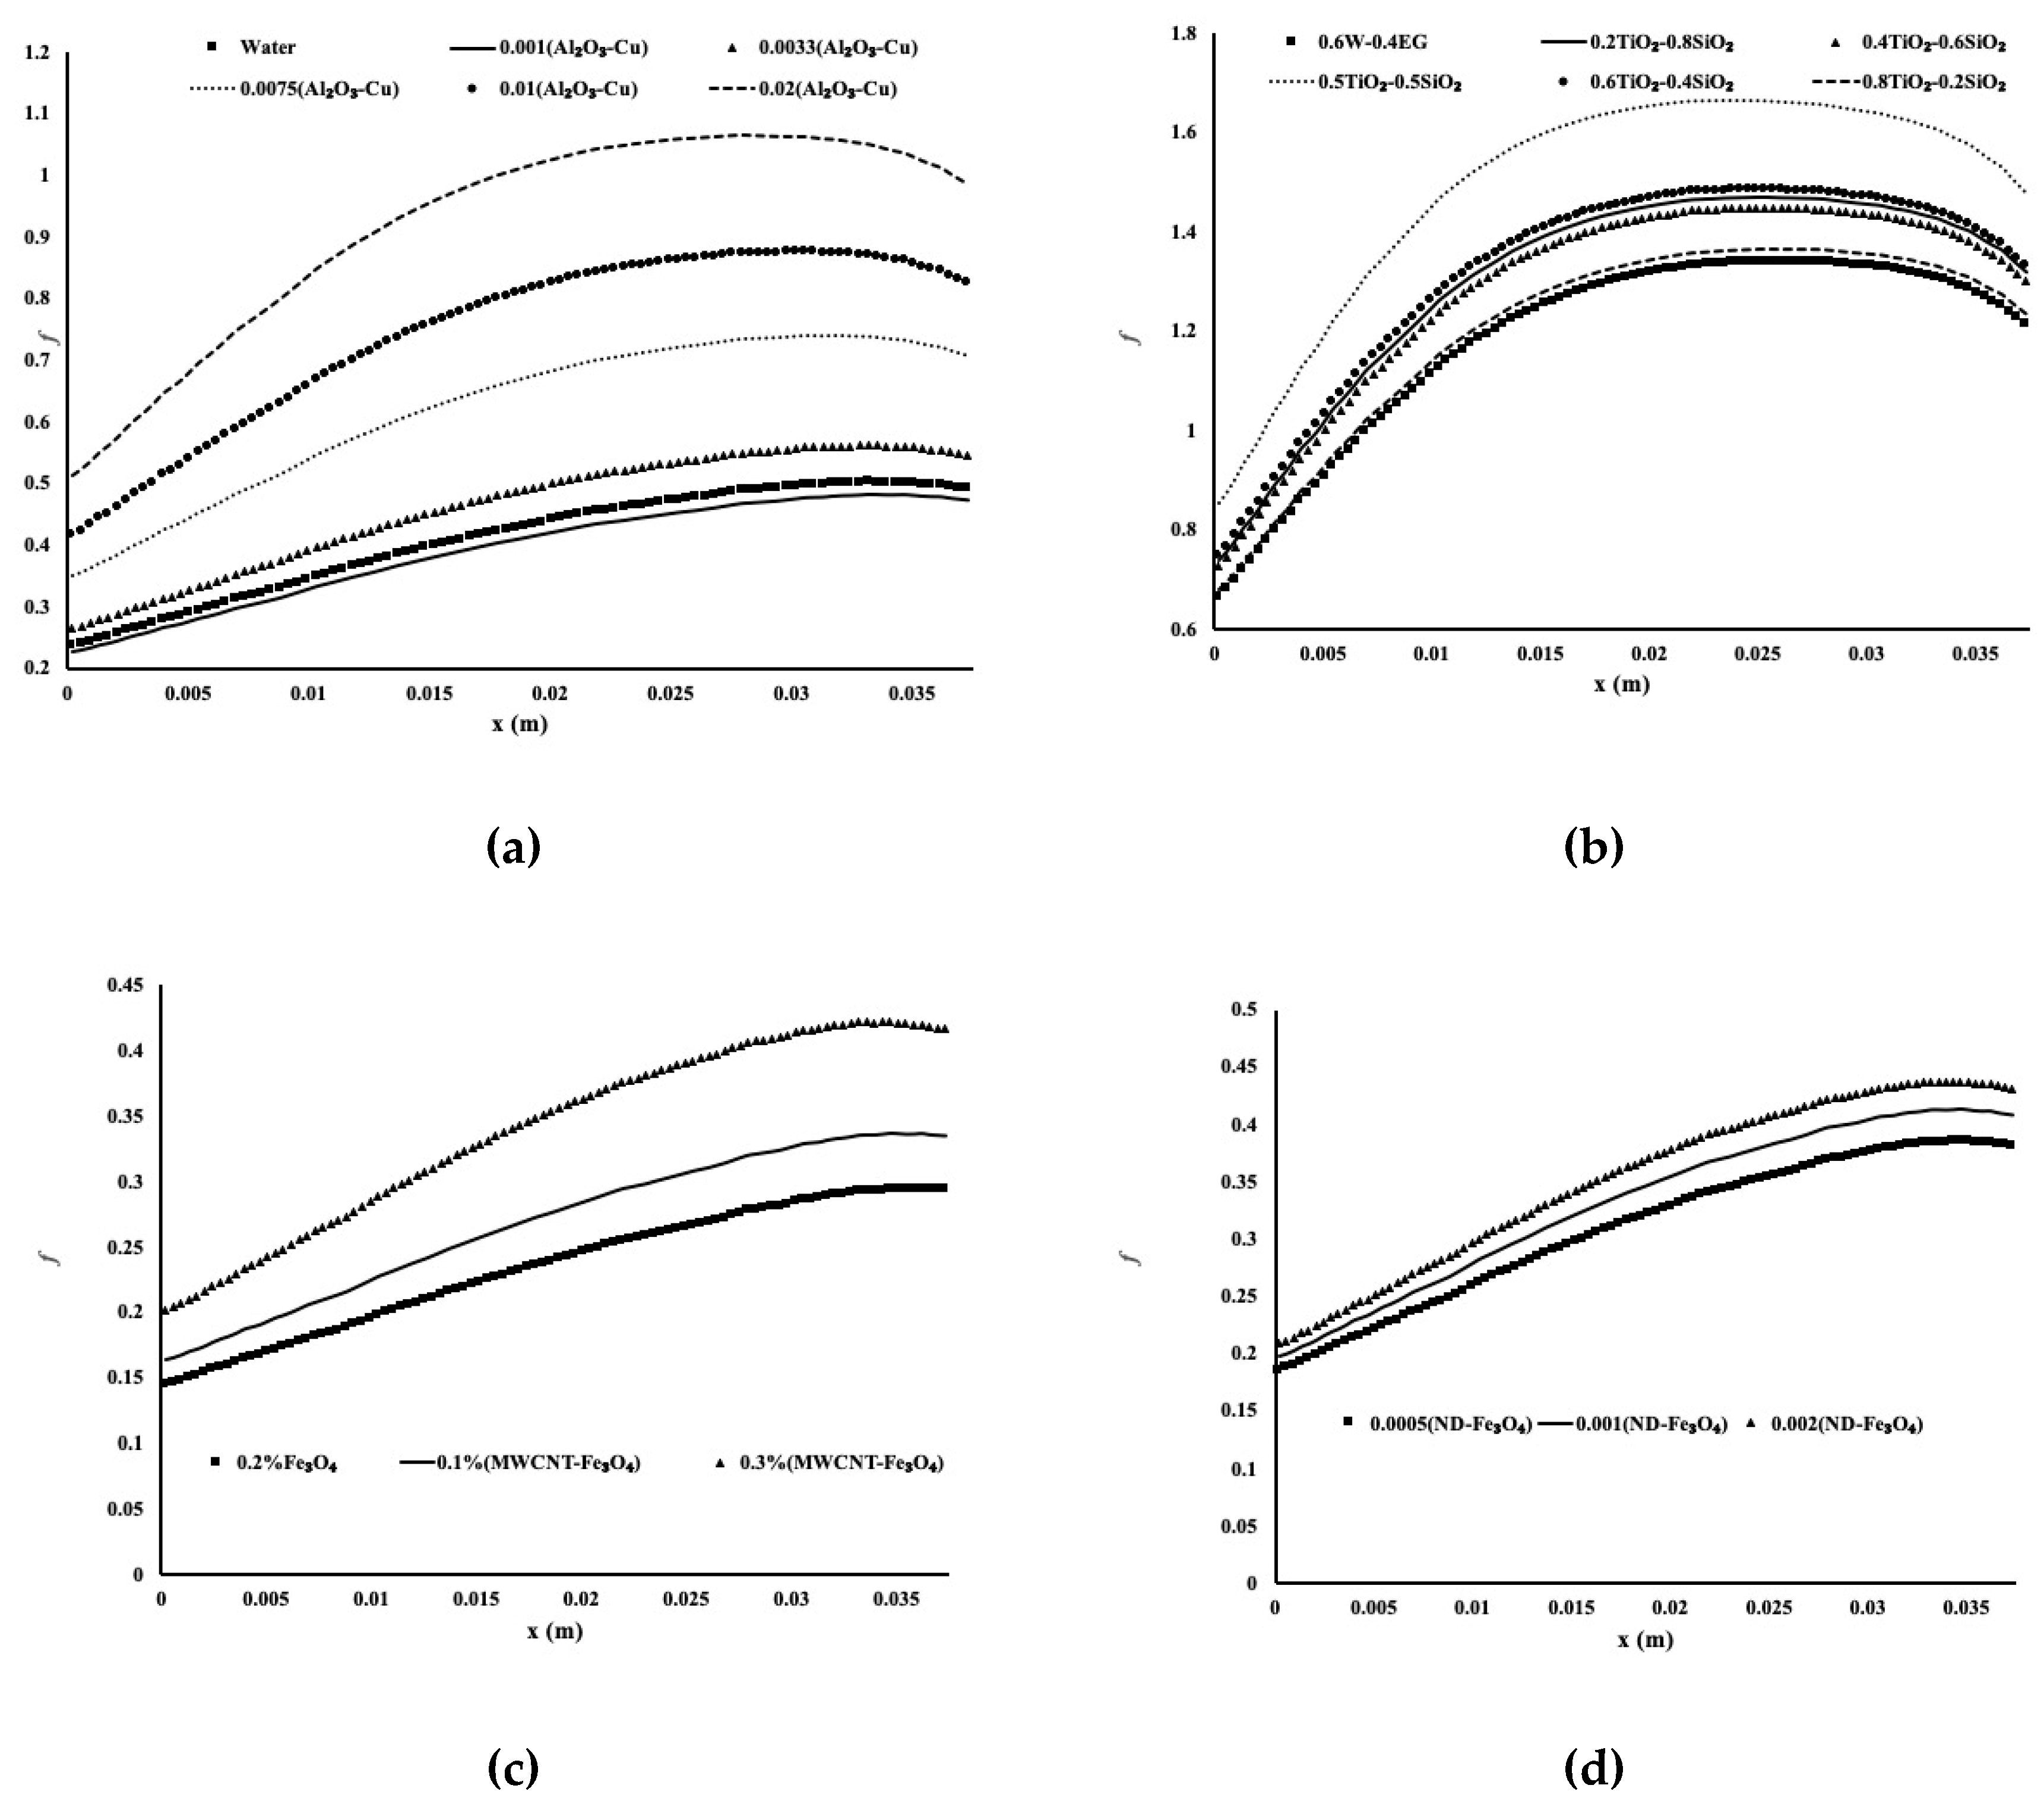
4.6. Friction Factor, Pumping Power, and Thermal Efficiency

Fanning friction factor (f) is a non-dimensional quantity and an important tool to measure the required pressure drop in a heat exchanger. For aluminum foam, it is calculated as follows:
f = Δ p 4 ( L De ) · ( ρ f U 2 2 )
where L is the channel length; De is the channel hydraulic diameter; ρ hnf is the mixture density; and U is the fluid velocity. The friction factor of aluminum foam along the flow direction for all mixtures is presented in Figure 9.
It is very noticeable that the mixture containing Fe3O4 had the lowest friction coefficient and thus pressure drop. Figure 10 and Table 3 display the pumping power for all mixtures. It is evident that the highest concentration of Al2O3–Cu (Figure 10) requires higher pumping power. However, it is the most suitable mixture for heat enhancement. Contrary to the TiO2–SiO2 mixture, it is shown that the mixture with the highest Nusselt number had the lowest pumping power requirement. Thus, a mixture of 0.8TiO2–0.2SiO2 is the most suitable for heat enhancement. Table 3 presents the same results for the mixtures with Fe3O4 nanoparticles. It is apparent that the increased concentration of particles led to an increase in pumping power.
The thermal efficiency index combining heat transfer rate and pressure drop can be obtained as follows:
I efficiency   = Nu Lavg · L f · H
where f is the Fanning friction factor of the aluminum foam; L is the channel length; H is the porous block height equal to 12.75 mm; and NuLavg is the average local Nusselt number. The thermal efficiency index evaluates the performance of the present heat sink concerning how much it transfers heat and the required pumping power. The thermal efficiency index along the flow is presented in Figure 11 for the best mixtures for each category. It was observed that the most suitable hybrid fluid for this application was a 0.2% concentration of nano-diamonds with Fe3O4, followed by the multiwall–Fe3O4 mixtures.

5. Conclusions

In the present paper, an attempt was made to investigate the optimum hybrid fluid performance for heat enhancement. Different types of hybrid nanofluids were studied in detail in a forced convection mode through a porous media block. The base fluid was either water or a mixture of water and ethylene glycol. A comparison between the experimental data of the Al2O3–water nanofluid fluid and numerical model provided good confidence in the numerical code. Numerical predictions of the forced convection in a porous block with the Al203–Cu hybrid fluid, TiO2–SiO2 hybrid fluid in water–ethylene glycol, multiwalled carbon nanotubes and ferric oxide (MWCNT–Fe3O4) hybrid nanofluid in water; and nano-diamond–Fe3O4 hybrid nanofluid in water were studied in detail in preparation for the experiments. The results revealed the following:
  • Hybrid nanofluids provide attractive heat enhancement at the expense of higher pressure drop and pumping power.
  • The effectiveness of cooling is noticeable for all of the studied hybrid nanofluids.
  • Temperature uniformity across the cooling surface was found to be excellent for all four hybrid nanofluids. The MWCNT–Fe3O4 hybrid nanofluid was found to be the best amongst the different mixtures.
  • Index of efficiency combining the average Nusselt number with the pressure drop and pumping power was found to be a good measure of hybrid nanofluid optimum performance. The hybrid nanofluid of 0.2% ND–Fe3O4 was found to be the best hybrid fluid to be used for the cooling process.

Author Contributions

Conceptualization, M.Z.S.; Methodology, M.M.R. and M.Z.S.; Software, M.Z.S.; Validation, M.Z.S. and M.M.R.; Formal analysis, M.Z.S.; Investigation, M.Z.S.; Resources, M.Z.S.; Data curation, M.Z.S.; Writing—original draft preparation, M.Z.S. and M.M.R.; Writing—review and editing, M.Z.S. and M.M.R.; Visualization, M.Z.S. and M.M.R.; Supervision, M.Z.S.; Project administration, M.Z.S.; Funding acquisition, M.Z.S. and M.M.R. All authors have read and agreed to the published version of the manuscript.

Funding

This research was funded by the National Science and Engineering Research Council Canada, Faculty of Engineering and Architecture, Ryerson University, the Qatar Foundation (grant number NPRP12S-0123-190011), and Sultan Qaboos University (grant number IG/SCI/MATH/20/03).

Acknowledgments

Authors acknowledge the financial support of NSERC, Ryerson University, Qatar Foundation and Sultan Qaboos University.

Conflicts of Interest

The authors declare no conflicts of interest.

References

  1. Bayomy, A.; Saghir, M.Z.; Yousefi, T. Electronic cooling using water flow in aluminum metal foam heat sink: Experimental and numerical approach. Int. J. Therm. Sci. 2016, 109, 182–200. [Google Scholar] [CrossRef]
  2. Bhattacharya, A.; Calmidi, V.V.; Mahajan, R.L. Thermophysical properties of high porosity metal foams. Int. J. Heat Mass Transf. 2002, 45, 1017–1031. [Google Scholar] [CrossRef]
  3. Xu, H.; Gong, L.; Huang, S.; Xu, M. Flow and heat transfer characteristics of nanofluid flowing through metal foams. Int. J. Heat Mass Transf. 2015, 83, 399–407. [Google Scholar] [CrossRef]
  4. Bayomy, A.; Saghir, M. Experimental and numerical study of the heat transfer characteristics of aluminum metal foam (with/without channels) subjected to steady water flow. J. Sci. Tech. 2017, 25, 221–246. [Google Scholar]
  5. Bayomy, A.; Saghir, M.Z. Experimental study of using γ-Al2O3–water nanofluid flow through aluminum foam heat sink: Comparison with numerical approach. Int. J. Heat Mass Transf. 2017, 107, 181–203. [Google Scholar] [CrossRef]
  6. Saghir, M.Z.; Welsford, C.; Thanapathy, P.; Bayomy, A.; Delisle, C. Experimental measurements and numerical computation of nano heat transfer enhancement inside a porous material. J. Therm. Sci. Eng. Appl. 2020, 12, 011003. [Google Scholar] [CrossRef]
  7. Alhajaj, Z.; Bayomy, A.M.; Saghir, M.Z.; Rahman, M.M. Flow of nanofluid and hybrid fluid in porous channels: Experimental and numerical approach. Int. J. Thermofluids 2020, 1-2, 100016. [Google Scholar] [CrossRef]
  8. Ho, C.; Chen, W. An experimental study on thermal performance of Al2O3/water nanofluid in a minichannel heat sink. Appl. Therm. Eng. 2013, 50, 516–522. [Google Scholar] [CrossRef]
  9. Sheikholeslami, M.; Sadoughi, M.K. Numerical modeling for Fe3O4 -water nanofluid flow in porous medium considering MFD viscosity. J. Mol. Liq. 2017, 242, 255–264. [Google Scholar] [CrossRef]
  10. Soltani, O.; Akbari, M. Effects of temperature and particles concentration on the dynamic viscosity of MgO-MWCNT/ethylene glycol hybrid nanofluid: Experimental study. Phys. E 2016, 84, 564–570. [Google Scholar] [CrossRef]
  11. Moldoveanu, G.M.; Minea, A.A.; Iacob, M.; Ibanescu, C.; Danu, M. Experimental study on viscosity of stabilized Al2O3, TiO2 nanofluids and their hybrid. Thermochim. Acta 2018, 659, 203–212. [Google Scholar] [CrossRef]
  12. Suresh, S.; Venkitaraj, K.; Selvakumar, P.; Chandrasekar, M. Synthesis of Al2O3–Cu/water hybrid nanofluids using two step method and its thermo physical properties. Colloids Surf. A Physicochem. Eng. Asp. 2011, 388, 41–48. [Google Scholar] [CrossRef]
  13. Selvakumar, P.; Suresh, S. Use of Al2O3–Cu/water hybrid nanofluid in an electronic heat sink. IEEE Trans. Compon. Packag. Manuf. Technol. 2012, 2, 1600–1607. [Google Scholar] [CrossRef]
  14. Suresh, S.; Venkitaraj, K.P.; Selvakumar, P.; Chandrasekar, M. Effect of Al2O3–Cu/water hybrid nanofluid in heat transfer. Exp. Therm. Fluid Sci. 2012, 38, 54–60. [Google Scholar] [CrossRef]
  15. Takabi, B.; Shokouhmand, H. Effects of Al2O3–Cu/water hybrid nanofluid on heat transfer and flow characteristics in turbulent regime. Int. J. Mod. Phys. C 2015, 26, 155047. [Google Scholar] [CrossRef]
  16. Abdul Hamid, K.; Azmi, W.H.; Nabil, M.F.; Mamat, R.; Sharma, K.V. Experimental investigation of thermal conductivity and dynamic viscosity on nanoparticle mixture ratios of TiO2-SiO2 nanofluids. Int. J. Heat Mass Trans. 2016, 116, 1143–1152. [Google Scholar] [CrossRef]
  17. Nabil, M.F.; Azmi, W.H.; Abdul Hamid, K.; Mamat, R.; Hagos, F.Y. An experimental study on the thermal conductivity and dynamic viscosity of TiO2-SiO2 nanofluids in water: Ethylene glycol mixtures. Int. Commun. Heat Mass Transf. 2017, 86, 181–191. [Google Scholar] [CrossRef]
  18. Sundar, L.S.; Sharma, K.V.; Singh, M.K.; Sousa, A.C.M. Hybrid nanofluids preparation, thermal properties, heat transfer and friction factor—A review. Renew. Sustain. Energy Rev. 2017, 68, 185–198. [Google Scholar] [CrossRef]
  19. Sundar, L.S.; Singh, M.K.; Sousa, A.C.M. Enhanced heat transfer and friction factor of MWCNT-Fe3O4/water hybrid nanofluids. Int. Commun. Heat Mass Transf. 2014, 52, 73–83. [Google Scholar] [CrossRef]
  20. Sundar, L.S.; Naik, M.T.; Sharma, K.V.; Singh, M.K.; Reddy, T.C.S. Experimental investigation of forced convection heat transfer and friction factor in a tube with Fe3O4 magnetic nanofluid. Exp. Therm. Fluid Sci. 2012, 37, 65–71. [Google Scholar] [CrossRef]
  21. Sundar, L.S.; Ramana, E.V.; Graca, M.P.F.; Singh, M.K.; Sousa, A.C.M. Nanodiamond-Fe3O4 nanofluids: Preparation and measurement of viscosity, electrical and thermal conductivities. Int. Commun. Heat Mass Transf. 2016, 73, 62–74. [Google Scholar] [CrossRef]
  22. Welsford, C.A.; Delisle, C.S.; Plant, R.D.; Saghir, M.Z. Effects of nanofluid concentration and channeling on the thermal effectiveness of highly porous open-cell foam metals: A numerical and experimental study. J. Therm. Anal. Calorim. 2019, 140, 1507–1517. [Google Scholar] [CrossRef]
  23. Plant, R.D.; Hodgson, G.K.; Impellizzeri, S.; Saghir, M.Z. Experimental and numerical investigation of heat enhancement using a hybrid nanofluid of Copper Oxide/Alumina nanoparticles in water. J. Therm. Anal. Calorim. 2020, in press. [Google Scholar] [CrossRef]
Figure 1. Experimental and numerical setup. (a) Experimental setup, (b) Location of the thermocouple, (b) Location of the thermocouple, (d) Metal foam block, (e) Finite element model, (f) Mesh sensitivity.
Energies 13 02902 g001aEnergies 13 02902 g001b
Figure 2. Experimental measurement and numerical computation (0.1% Al2O3–water nanofluid).
Energies 13 02902 g002
Figure 3. Heat enhancement using the Al2O3–Cu in water mixture. (a) Temperature variation along the flow, (b) Nusselt number of each individual mixture, (c) Nusselt number using standard definition.
Energies 13 02902 g003
Figure 4. Heat enhancement using TiO2–SiO2 in the ethylene glycol (EG)–water mixture. (a) Temperature variation along the flow, (b) Nusselt number of each individual mixture, (c) Nusselt number using standard definition.
Energies 13 02902 g004aEnergies 13 02902 g004b
Figure 5. Heat enhancement using the MWCNT– Fe3O4 in water mixture. (a) Temperature variation along the flow, (b) Nusselt number of each individual mixture, (c) Nusselt number using standard definition.
Energies 13 02902 g005
Figure 6. Heat enhancement using ND–Fe3O4 in water mixture. (a) Temperature variation along the flow, (b) Nusselt number of each individual mixture, (c) Nusselt number using standard definition.
Energies 13 02902 g006aEnergies 13 02902 g006b
Figure 7. Heat transfer and fluid flow displacement in the model. (a) Flow along the model, (b) Temperature distribution in the model.
Energies 13 02902 g007
Figure 8. Temperature uniformity for all mixtures. (a) Al2O3–Cu mixtures, (b) SiO2–TiO2 mixtures, (c) MWCNT–Fe3O4 mixtures, (d) ND–Fe3O4 mixtures.
Energies 13 02902 g008
Figure 9. Fanning friction factor for all mixtures. (a) Al2O3–Cu mixtures, (b) SiO2–TiO2 mixtures, (c) MWCNT–Fe3O4 mixtures, (d) ND–Fe3O4 mixtures.
Energies 13 02902 g009
Figure 10. Pumping power for two mixtures. (a) Al2O3–Cu mixtures, (b) SiO2–TiO2 mixtures.
Energies 13 02902 g010
Figure 11. Optimum performance of the hybrid mixtures.
Energies 13 02902 g011
Table 1. Physical properties of the nanofluid at T = 24 °C [8]. Reproduced from [8], Elsevier: 2013.
Mixtures/Properties μ n f   ( kg / m / s ) ρ n f   ( kg / m 3 ) C p n f   ( J / kg / K ) k n f   ( W / mK ) Prnf
Water0.001002998.241820.6136.835
0.001Al2O3–0.999 Water0.0010071000.8024169.7086550.6148176.8306128
Table 2. Physical properties of hybrid fluids at T = 30 °C [12,16,17,18]. Reproduced from [12], Elsevier: 2011; Reproduced from [16], Elsevier: 2016; Reproduced from [17], Elsevier: 2017; Reproduced from [18], Elsevier: 2017.
Mixtures/Properties μ h n f   ( kg / m / s ) ρ h n f   ( kg / m 3 ) C p h n f   ( J / kg / K ) k h n f   ( W / mK ) Prhnf
0.001(Al2O3-Cu)–0.999 Water0.000971001.34176.830.62016.56
0.0033(Al2O3-Cu)–0.9967Water0.001101006.644143.51840.63127.22
0.0075(Al2O3-Cu)–0.9925Water0.001391017.374095.50.64918.75
0.01(Al2O3-Cu)–0.99 Water0.001601023.754067.4150.657279.92
0.02(Al2O3-Cu)–0.98 Water0.001941049.253958.6230.6856511.21
60%Water–40%EG0.00241055.393497.28480.4129720.31
0.01[20% TiO2, 80% SiO2 in (60% water,40% EG)]0.002651071.083469.33190.4551220.18
0.01[40% TiO2, 60% SiO2 in (60% water,40% EG)]0.002611075.083469.30190.4494720.21
0.01[50% TiO2, 50% SiO2 in (60% water,40%EG)]0.00298461077.093469.28690.435123.8
0.01[60% TiO2, 40% SiO2 in (60% water,40% EG)]0.002690310803469.27190.4450620.97
0.01[80% TiO2, 20% SiO2 in (60% water,40% EG)]0.00250261083.123469.24190.4401219.73
0.001(MWCNT-Fe3O4)–0.999Water0.00075999.14181.160.69434.52
0.003(MWCNT-Fe3O4)–0.997Water0.000891006.84182.490.72415.13
0.002(Fe3O4)–0.998 Water0.0006871006.564174.9760.6894.16
0.0005(ND-Fe3O4)–0.999Water0.0008261000.064180.891670.63245.46
0.001(ND-Fe3O4)–0.997Water0.000871001.924179.120.65265.57
0.002(ND-Fe3O4)–0.997Water0.0009111005.634175.590.68045.59
Table 3. Pumping power.
MixturePumping Power in W/m2
0.002(Fe3O4)–0.998Water6.30694 × 10−6
0.001(MWCNT-Fe3O4)–0.999Water6.89378 × 10−6
0.003(MWCNT-Fe3O4)–0.997Water8.1499 × 10−6
0.0005(ND-Fe3O4)–0.999Water7.58929 × 10−6
0.001(ND-Fe3O4)–0.997Water7.98727 × 10−6
0.002(ND-Fe3O4)–0.997Water8.35572 × 10−6

