1. Introduction
Air conditioning is widely used in the construction sector, both in residential and in commercial buildings: it plays a key-role in ensuring the achievement and permanence of comfort conditions for the occupants of an environment, thus contributing to the health and well-being of people. The thermal comfort of indoor environments is generally produced by conventional Heating, Ventilation and Air Conditioning (HVAC) systems, which are highly energy-intensive and contribute significantly to making buildings responsible for around 20–40% of global energy consumption in developed countries, surpassing in many cases other important sectors such as industry and transport. Within the building sector, HVAC systems are the largest consumers of energy, representing alone around 50% of the total energy consumption of the sector, equivalent to around 10–20% of global energy consumption [
1]. Furthermore, the global market for HVAC systems has grown significantly in recent years as a result of the globalization of the demand for thermal comfort, particularly in emerging countries.
Overall, refrigeration and air conditioning are responsible for around 20% of global electricity consumption according to estimations by the International Institute of Refrigeration; this figure varies widely from one country to another, depending on the level of development and local climatic conditions. For example, while air conditioning is almost absent in the least developed countries, it can weigh around 14% of the total electricity consumption in the USA and 40% in the Indian city of Mumbai. The Intergovernmental Panel on Climate Change estimates that the demand for energy for air conditioning in the residential sector during the summer season is expected to increase by 13 times between 2000 and 2050 and by more than 30 times by 2100, taking into account the climate change scenario during this period [
2]. Therefore, the rapid growth of the building air conditioning sector, and therefore of the demand for energy for this purpose, represents an aggravating factor of the global energy and environmental crisis. Energy saving policies, improvements in the energy efficiency of systems and promotion of the use of energy from renewable sources are the three key tools to alleviate these crises. Consequently, the energy efficiency of HVAC systems has become a priority objective for energy policies, as evidenced for example by the increasingly restrictive efficiency requirements for these systems in the construction sector, by the development of classification and energy certification schemes for buildings, by the standardization of inspection and maintenance operations for these systems. In addition, the policies regarding the use of energy in the building sector aim to encourage the use of renewable sources as clearly stated in the European Directive on renewable sources and established by the so-called “green building” standards. Renewable energies currently meet about 14% of the global energy demand [
3]; among the renewable energy sources of interest in the construction sector, geothermal energy is a vast and promising source of energy. In 2013, the geothermal energy source guaranteed over 15 thermal GW for air conditioning in the European Union, equivalent to more than 4 million tons of oil per year (Mtep); of these, geothermal systems contribute largely.
The technological challenge is mainly to develop innovative solutions for the energy requalification of existing buildings, both for residential and office use, employing systems that are simple to install and efficient at low temperatures; in particular, a significant increase in the European geothermal market is expected in the coming years thanks to the introduction and consolidation of surface geothermal systems [
4].
The thermal energy of the Ground, in addition to the production of electricity in thermal plants, can be used, for the purposes of air conditioning, typically directly in three ways [
5]:
In the first case, the building, which can be partially or completely buried, is in direct contact with the ground and thermally interfaces with it. In the second case, the secondary fluid of the heat pump, typically a mixture of water and antifreeze, flows through underground pipes horizontally or vertically in closed loop circuits to exchange heat with the soil. Finally, as a typical use of the geothermal source in the air conditioning sector, there are ground-to-air heat exchangers. An GAHX is a passive system, an unconventional technology that essentially consists of a network of pipes buried in the ground at a depth that guarantees that the soil temperature remains almost constant throughout the year. The GAHX system can be used both for cooling and for preheating the indoor air during the summer and winter seasons respectively: during the winter, in fact, the temperature of the ground is higher than that of the outdoor ambient air; and the opposite happens in the summer.
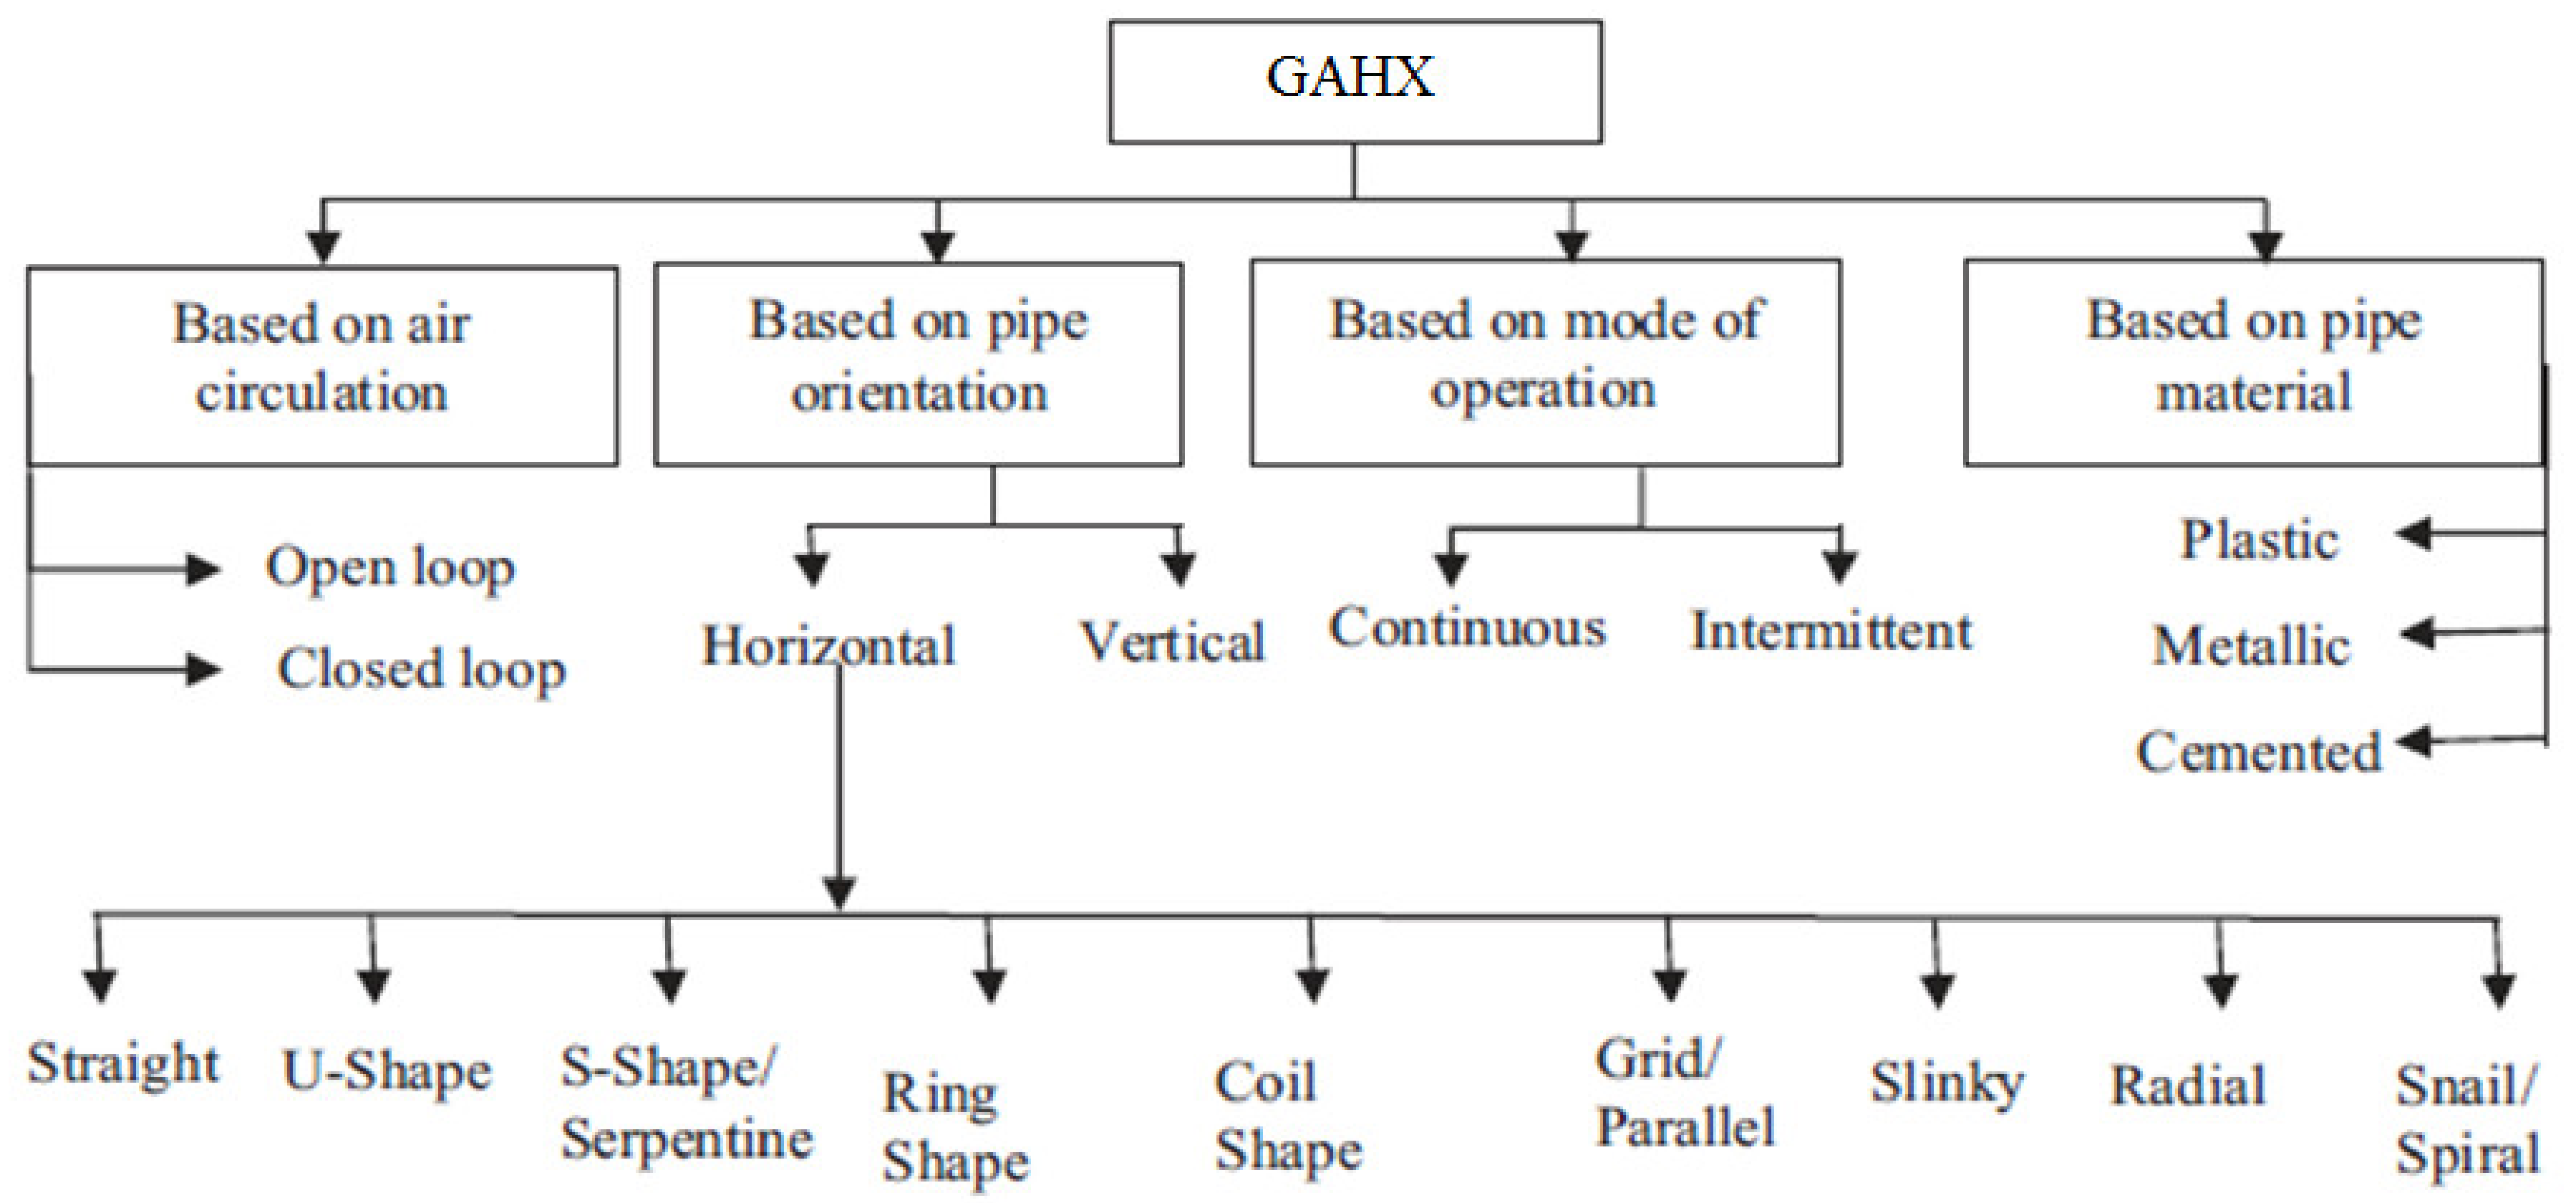
The ground-to-air exchangers can be used in a large number of configurations, which differ from each other based on the system layout, the geometry of the exchanger, the number of pipes and their arrangement, etc. Ground-to-air heat exchangers can be classified according to numerous criteria.
Figure 1 shows a schematic representation of a possible classification [
6] of ground-to-air heat exchangers, drawn basing on some studies carried out by scientific community. Ground-to-air heat exchangers can be open/closed-loop based systems. In the open loop system, a continuous supply of external air is pumped inside the buried pipe where it is treated thanks to the interaction with the soil and no recirculation systems are envisaged. On the other side, in the closed loop the air flowing into the tube cyclically re-circulates into the system from the building to the GAHX and the other way around. An GAHX based system can be designed with both vertical and horizontal tubes, and the number of pipes could typically varies depending on different factors, such as the available installation space, the required volumetric airflow rate and thermodynamic optimization factors. The vertical-pipes GAHXs usually require higher installation and maintenance costs than the horizontal-pipes ones. The choice of the appropriate configuration for the application of interest must therefore be made downstream of numerous considerations: technical aspects, availability of materials, energy, air-conditioned building size-based, economic considerations and last but not least the climatic conditions of the area where the GAHX is installed. Lin et al. [
7] studied the influence of the soil moisture on the long-term energy performances of an GAHX system at dry, partially and fully saturated conditions, through an analytical approach. The computational method was validated experimentally for a condition of a middle saturation. A very small impact of soil moisture content was detected in the air flows with low velocity but a strong difference up to 40% between dry and fully saturated conditions on long-term energy performances of the system was appreciated, specifically if the air flux reaches the turbulent flow. Therefore, they prescribed that the maximum recommended air velocity should not be greater than 4.0 m s
−1.
All over the world scientists investigated the performances of Ground-to-Air Heat eXchangers by means of different numerical models or computational methods, in a wide number of distinguished scenarios: the results carried out are well summarized by Bordoloi e al. in their review [
8] where all the main GAHX-based systems are classified and compared up to the year 2018. The energy performances of the GAHX system are mainly affected by the design parameters and working conditions: length, diameter and material of the pipes, the air blowing velocity and the depth at which they are buried. Ahmed et al. [
9] introduced an intense parametric investigation where, through a numerical model of a horizontal pipes GAHX, they observed the impact of the above mentioned design and working parameters. They asserted that air velocity, pipe length and diameter noticeably affect the thermal performance of the system. Moreover they underline the different aspects of optimization of the GAHX performances: from a thermodynamical point of view, 1.5 m s
−1 as air velocity, 60.0 m as pipe length, 0.062 m as pipe diameter with 0.003 m as thickness, buried at 8.0 m depth, represent the most efficient configuration. On the other side, the choice of these parameters does not also ensure the optimal performance in terms of energy savings, for which an optimum length and air velocity are required to be selected.
The most common applications of the ground-to-air heat exchanger identifies it as a pre-heating or pre-cooling component of the outside air to be directly introduced into the building (by a mechanical ventilation system). So, the energy savings related to the GAHX inserted upstream of a mechanical ventilation system were often evaluated by comparing this solution to a simple mechanical ventilation system without GAHX [
10]. Li et al. [
11] introduced an evaluation of the annual performances of a mechanical ventilation system provided with an GAHX and an air-to-air heat recovery unit (the two exchangers are in series) compared to a heat pump coupled to a primary air-handling unit. The analysis was conducted in severe cold regions, and energy, economic and environmental aspects were evaluated. The authors detected that the innovative system carries a considerable economic and environmental benefit compared to the traditional solution. Specifically, the static and dynamic payback periods when using the system with the GAHX were about 2.1 and 2.4 years when the return rate was 8%; from the point of view of greenhouse gas emissions, there was a reduction of 17%. In this article [
11], the depth of two buried pipes was 2.5 and 5 m and a sensitivity analysis was carried out by spacing the pipes both at 2 m and at 5 m, showing that the useful effect is greater the more the two pipes are distant. Another strategy consists in inserting the GAHX in a hybrid air conditioning system [
8,
12]. However, the configuration with the GAHX upstream of the Air Handling Unit (AHU) was rarely analyzed in the previous literature works. Other studies investigated the benefits that GAHX brings to a building in relation to different climatic conditions [
13,
14] or based on the type of soil [
15] without specifying how this system was integrated into the HVAC system. The performances of the ground-to-air heat exchanger were sometimes analyzed by comparing it with the air-to-air heat exchanger, highlighting also in this case significant energy savings against higher economic costs [
16,
17]. About this kind of comparison (between the GAHX and the air-to-air heat recovery), also the research results reported in [
18] and [
19] can be useful. Zeng et al. [
18] showed that the air-to-air heat exchanger coupled to an AHU leads to considerable energy savings. Furthermore, Kalbasi et al. [
19] demonstrated how by coupling an air-to-air heat exchanger to an AHU, the cooling power decreases between 27% and 36% and the total required power decreases up to 11%.
The present paper aims to compare the energy performances carried out by of an investigation conducted on a HVAC system, for an office building, supposed to be placed in different worldwide climatic areas according to the Köppen climate classification. The Köppen climate classification is widely recognized to categorize worldwide climatic zones on the basis of temperature and vegetation criteria [
20]. The principal zones are: tropical or equatorial climates (zone A), dry climates (zone B), mild temperature climates (zone C), continental climates (zone D) and polar climates (zone E). The system under investigation is composed by an air handling unit for the primary air coupled with a horizontal-pipes GAHX and fan-coil units. The GAHX is constituted by a number of circular horizontal buried pipes (for air flowing) installed at 2.5 m deep. The distance between two adjacent pipes is 2.5 m, chosen to avoid the thermal interaction between the two elements. The model, extensively two-dimensionally designed, is constituted by one circular horizontal buried pipe of the GAHX surrounded by a ground volume 20 m deep, and then the problem is solved with finite element method. The model is also validated through experimental data on GAHX systems published in open literature. The results introduced in this paper are carried out by the simulations on the GAHX, performed by varying the length of the pipes and the air flow velocities; thus, also the number of tubes forming the GAHX is varied since the volumetric flow rate to be provided to the AHU must be kept constant. Once the temperatures of the air at the exit of the buried tube have been assessed, the GAHX is thermodynamically connected with the AHU, i.e. the external air pre-heated or pre-cooled by the geothermal heat exchanger is not directly introduced into the building but it is sent to the AHU. Subsequently the energy performances of the above-mentioned HVAC system are analyzed, both in summer and in winter operation modes. Specifically: the reduction of the power of the heating and cooling coils in the AHU due to the pre-treatment of the air operated by the GAHX, the efficiency of the GAHX and the inlet-outlet temperature span are evaluated through a sensitivity analysis in which the length of the GAHX pipes and the air-blowing velocity are varied.
Indeed, considering the previously mentioned state of the art, with particular reference to the progresses concerning the development of hybrid solutions of mechanical ventilation or air conditioning systems coupled with GAHX, the investigation introduced in the present paper shows the following main elements of innovations:
the coupling of a double approach, i.e. the rigorous solution of the heat transfer problem related to the GAHX (through the development and experimental validation of a two-dimensional numerical model based on the finite elements method), and a more practical approach tending to evaluate the benefits obtaining for the air conditioning system;
the positioning of the GAHX upstream of the AHU, which represents a system configuration rarely analyzed in the previous literature works [
14,
16,
17]. In this way, the GAHX is not a simple pre-treatment of the air to be introduced into the building by means of a mechanical ventilation system, but a component inserted in the air conditioning system;
the evaluation of the power saving associated to the HVAC system heating and cooling coils, deriving to the placement of the GAHX upstream of the air-handling unit (with consequent significant decrease of the overall energy consumption).
As far as the authors are aware, these three aspects are not present in the available literature mainly considering all them together and making in comparison the different Köppen worldwide climatic areas.
In the next sections the paper is organized as follows:
2. Analysis
In the present paper the energy performance of an ground-air heat exchanger in different climate zones has been evaluated. The investigation has been conducted on a HVAC system for an office building, reported in
Figure 2, that has a rectangular shape and that extends over two floors for a total area of 260 m
2 and a volume of 910 m
3.
The system is composed by an air handling unit for the primary air coupled with a horizontal-pipes GAHX and fan-coil units.
The GAHX is constituted by different circular horizontal buried pipes (for air flowing) installed at 2.5 m deep. The distance between two adjacent pipes is 2.5 m, chosen to avoid the thermal interaction between the two elements. The two-dimensional model is constituted by one circular horizontal buried pipe surrounded by the ground. The simulations on the GAHX are performed by varying the length of the pipes and the air flow velocity. Thus, since the volumetric flow rate to be provided to the AHU must be kept constant, the number of pipes varies between 5 and 8.
Once the outlet temperatures of the air at the exit of the buried tube have been assessed, the GAHX is thermodynamically connected with the AHU, i.e. the external air pre-heated or pre-cooled by the geothermal heat exchanger is not directly introduced into the building but it is sent to the AHU. Subsequently the energy performances of the above-mentioned HVAC system are analysed, both in summer and in winter operation modes. Specifically: the reduction of the thermal power of the heating and cooling coils in the AHU due to the pre-treatment of the air operated by the GAHX, the efficiency of the GAHX and the inlet-outlet temperature span are evaluated at different climatic zones.
2.1. Mathematical Model of the GAHX
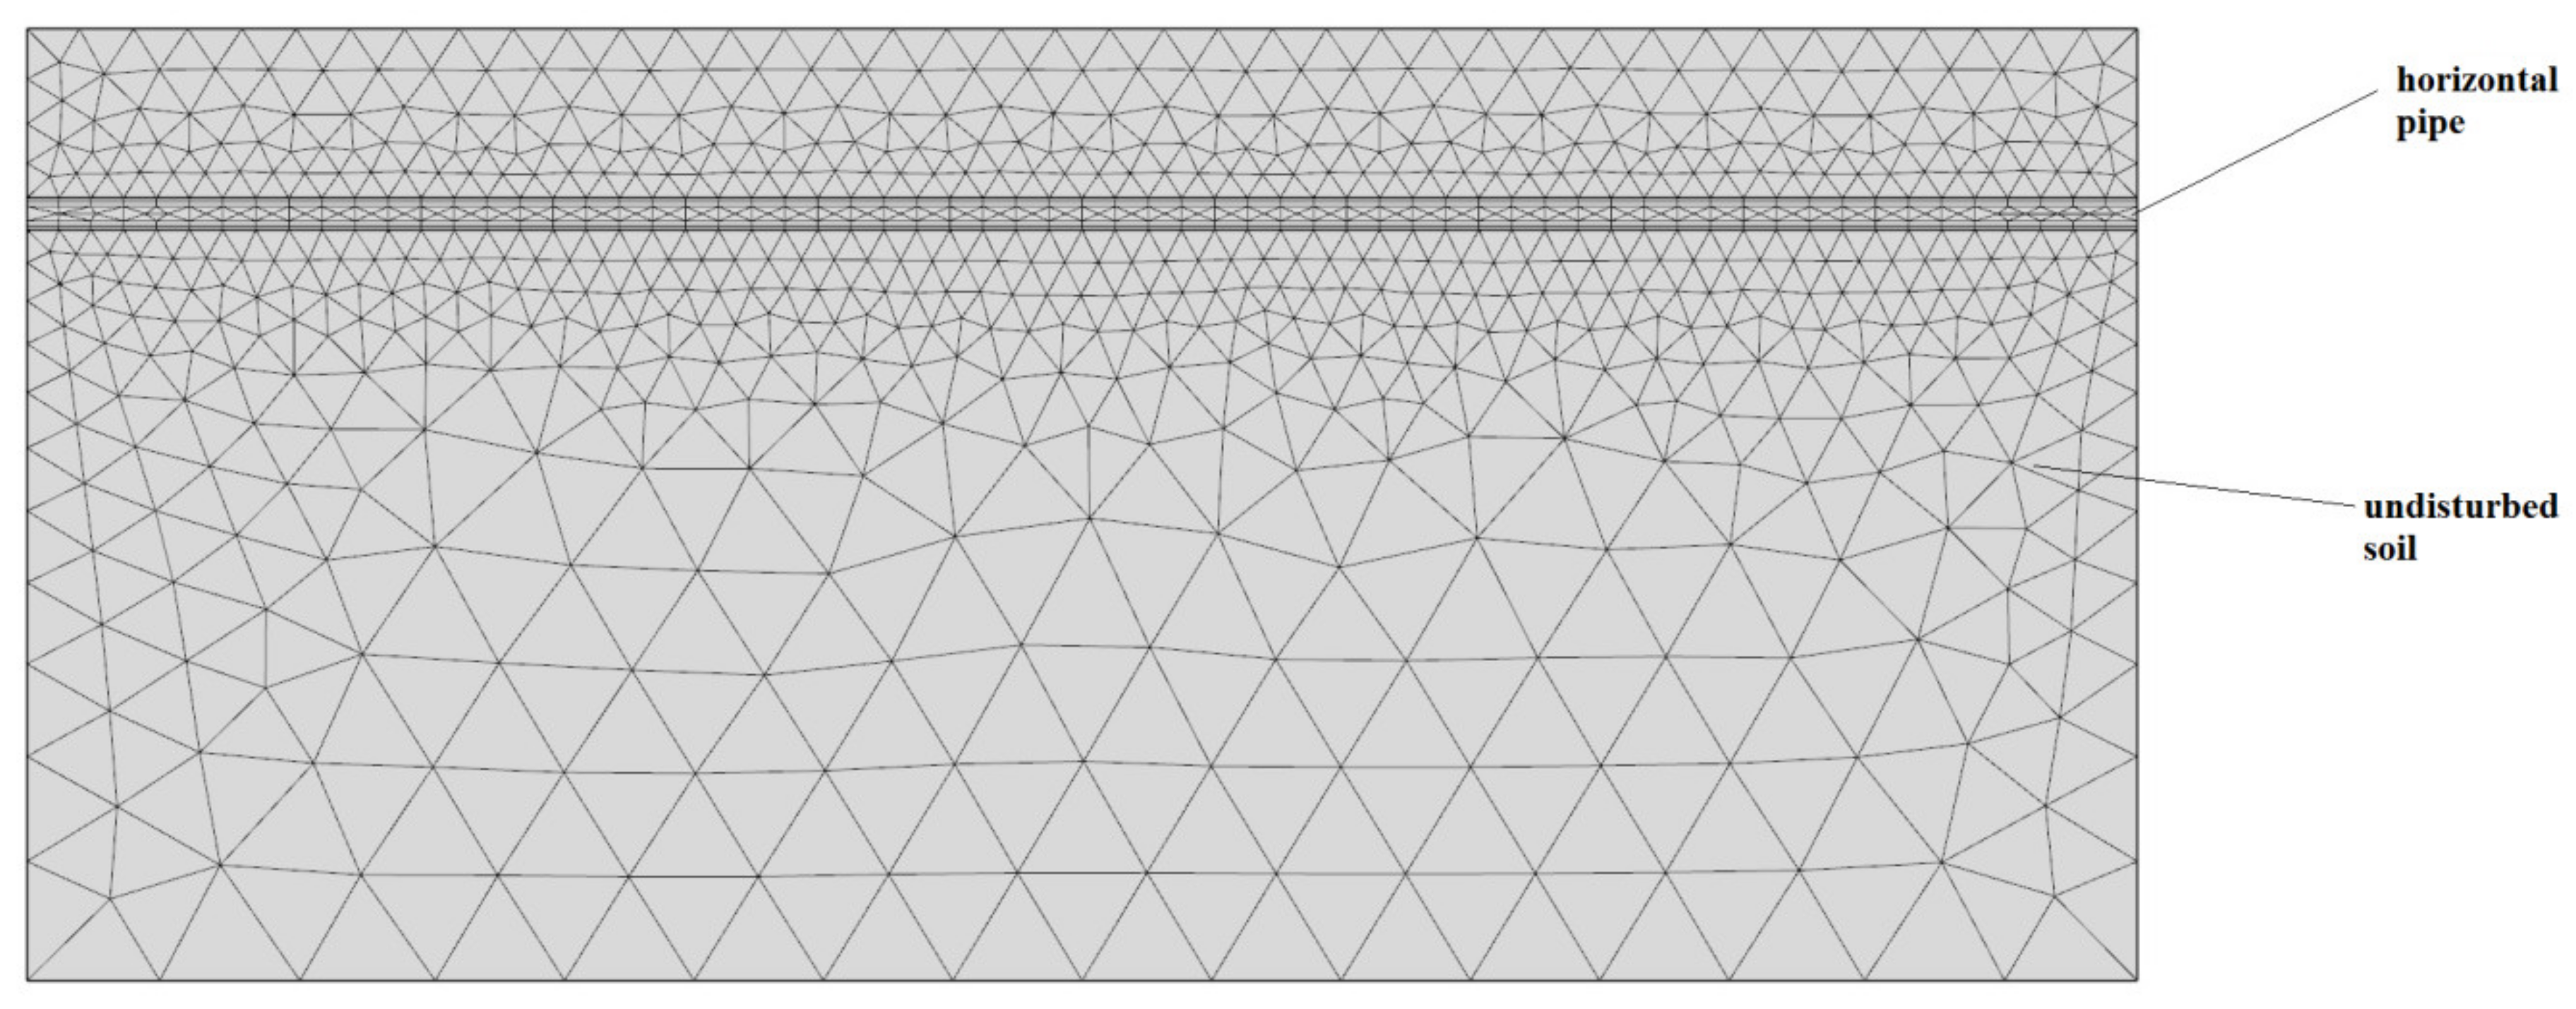
To evaluate the influence of the ground-to-air heat exchanger, it was extensively designed and modeled two-dimensionally and then the analysis was solved with finite element method. The GAHX with horizontal-pipes has been chosen as the vertical-pipes GAHXs usually require higher installation and maintenance costs. The computational domain of the model is constituted by one circular horizontal buried pipe (for air flowing) of the GAHX surrounded by a ground volume 20 m deep. According to literature studies [
21,
22], this value was chosen to ensure at this deepness the ground results undisturbed. The pipes are in PVC with a thermal conductivity equal to 0.16 W m
−1 K
−1. The distance
d between two adjacent pipes is 2.5 m, chosen to avoid the thermal interaction between the two elements.
As shown in
Figure 3, a buried pipe horizontally oriented is installed at 2.5 m in the soil because, in agreement with other investigations [
23], for deepness more than 2 m below the surface, the soil temperatures are about constant and close to the annual mean values of the external air. Clearly although the yearly temperature excursion decreases with the depth, on the other hand the excavation costs increase. Therefore, interring the pipe between 2 m and 3 m is a good compromise [
24,
25]. The pipe has a diameter
D and a length
L. The modeled GAHX is open-loop, therefore the air entering the tube, with a velocity vector
, has temperature and relative humidity proper of the external air. Since the model is solved with finite element method, in
Figure 2 is shown also the computational mesh whose shape is triangular.
The study aims to investigate the conjugate heat transfer between solid (soil) and fluid (humid air); the velocities that the fluid flows with, ensure the full turbulent flow. Therefore, the equations governing the domain are reported below. The air entering the model is humid air. Indeed, the model is able to provide punctually the typical parameters characterizing a humid air flow (dry and wet bulb temperature; relative and specific humidity) and the flow rate of the water, eventually condensed.
The mass conservation equation of the humid air is:
where
is a negative term that represents the mass of water vapor condensed.
The momentum conservation of the air flow is guaranteed by the Navier-Stokes equations for turbulent flow:
where
is the turbulent viscosity modeled as:
with
= 0.09, that is one of the constants of the
K-
model for turbulent flow [
26].
The energy equation for the air flow is:
where
is the effective conductivity defined as the sum of the conventional thermal conductivity of the fluid (
) and the thermal conductivity of the turbulent flow (
) and thus modeled as:
The energy equation solved in the soil domain becomes:
The soil domain is treated as virtual solid, indeed without considering any fluid flowing through porous media. The porosity was taken into account since, assuming a certain value, the soil properties were weighted balanced according to the solid and the liquid properties as follows:
The associated thermal boundary conditions are:
2.2. Validation of the Model with Experimental Data
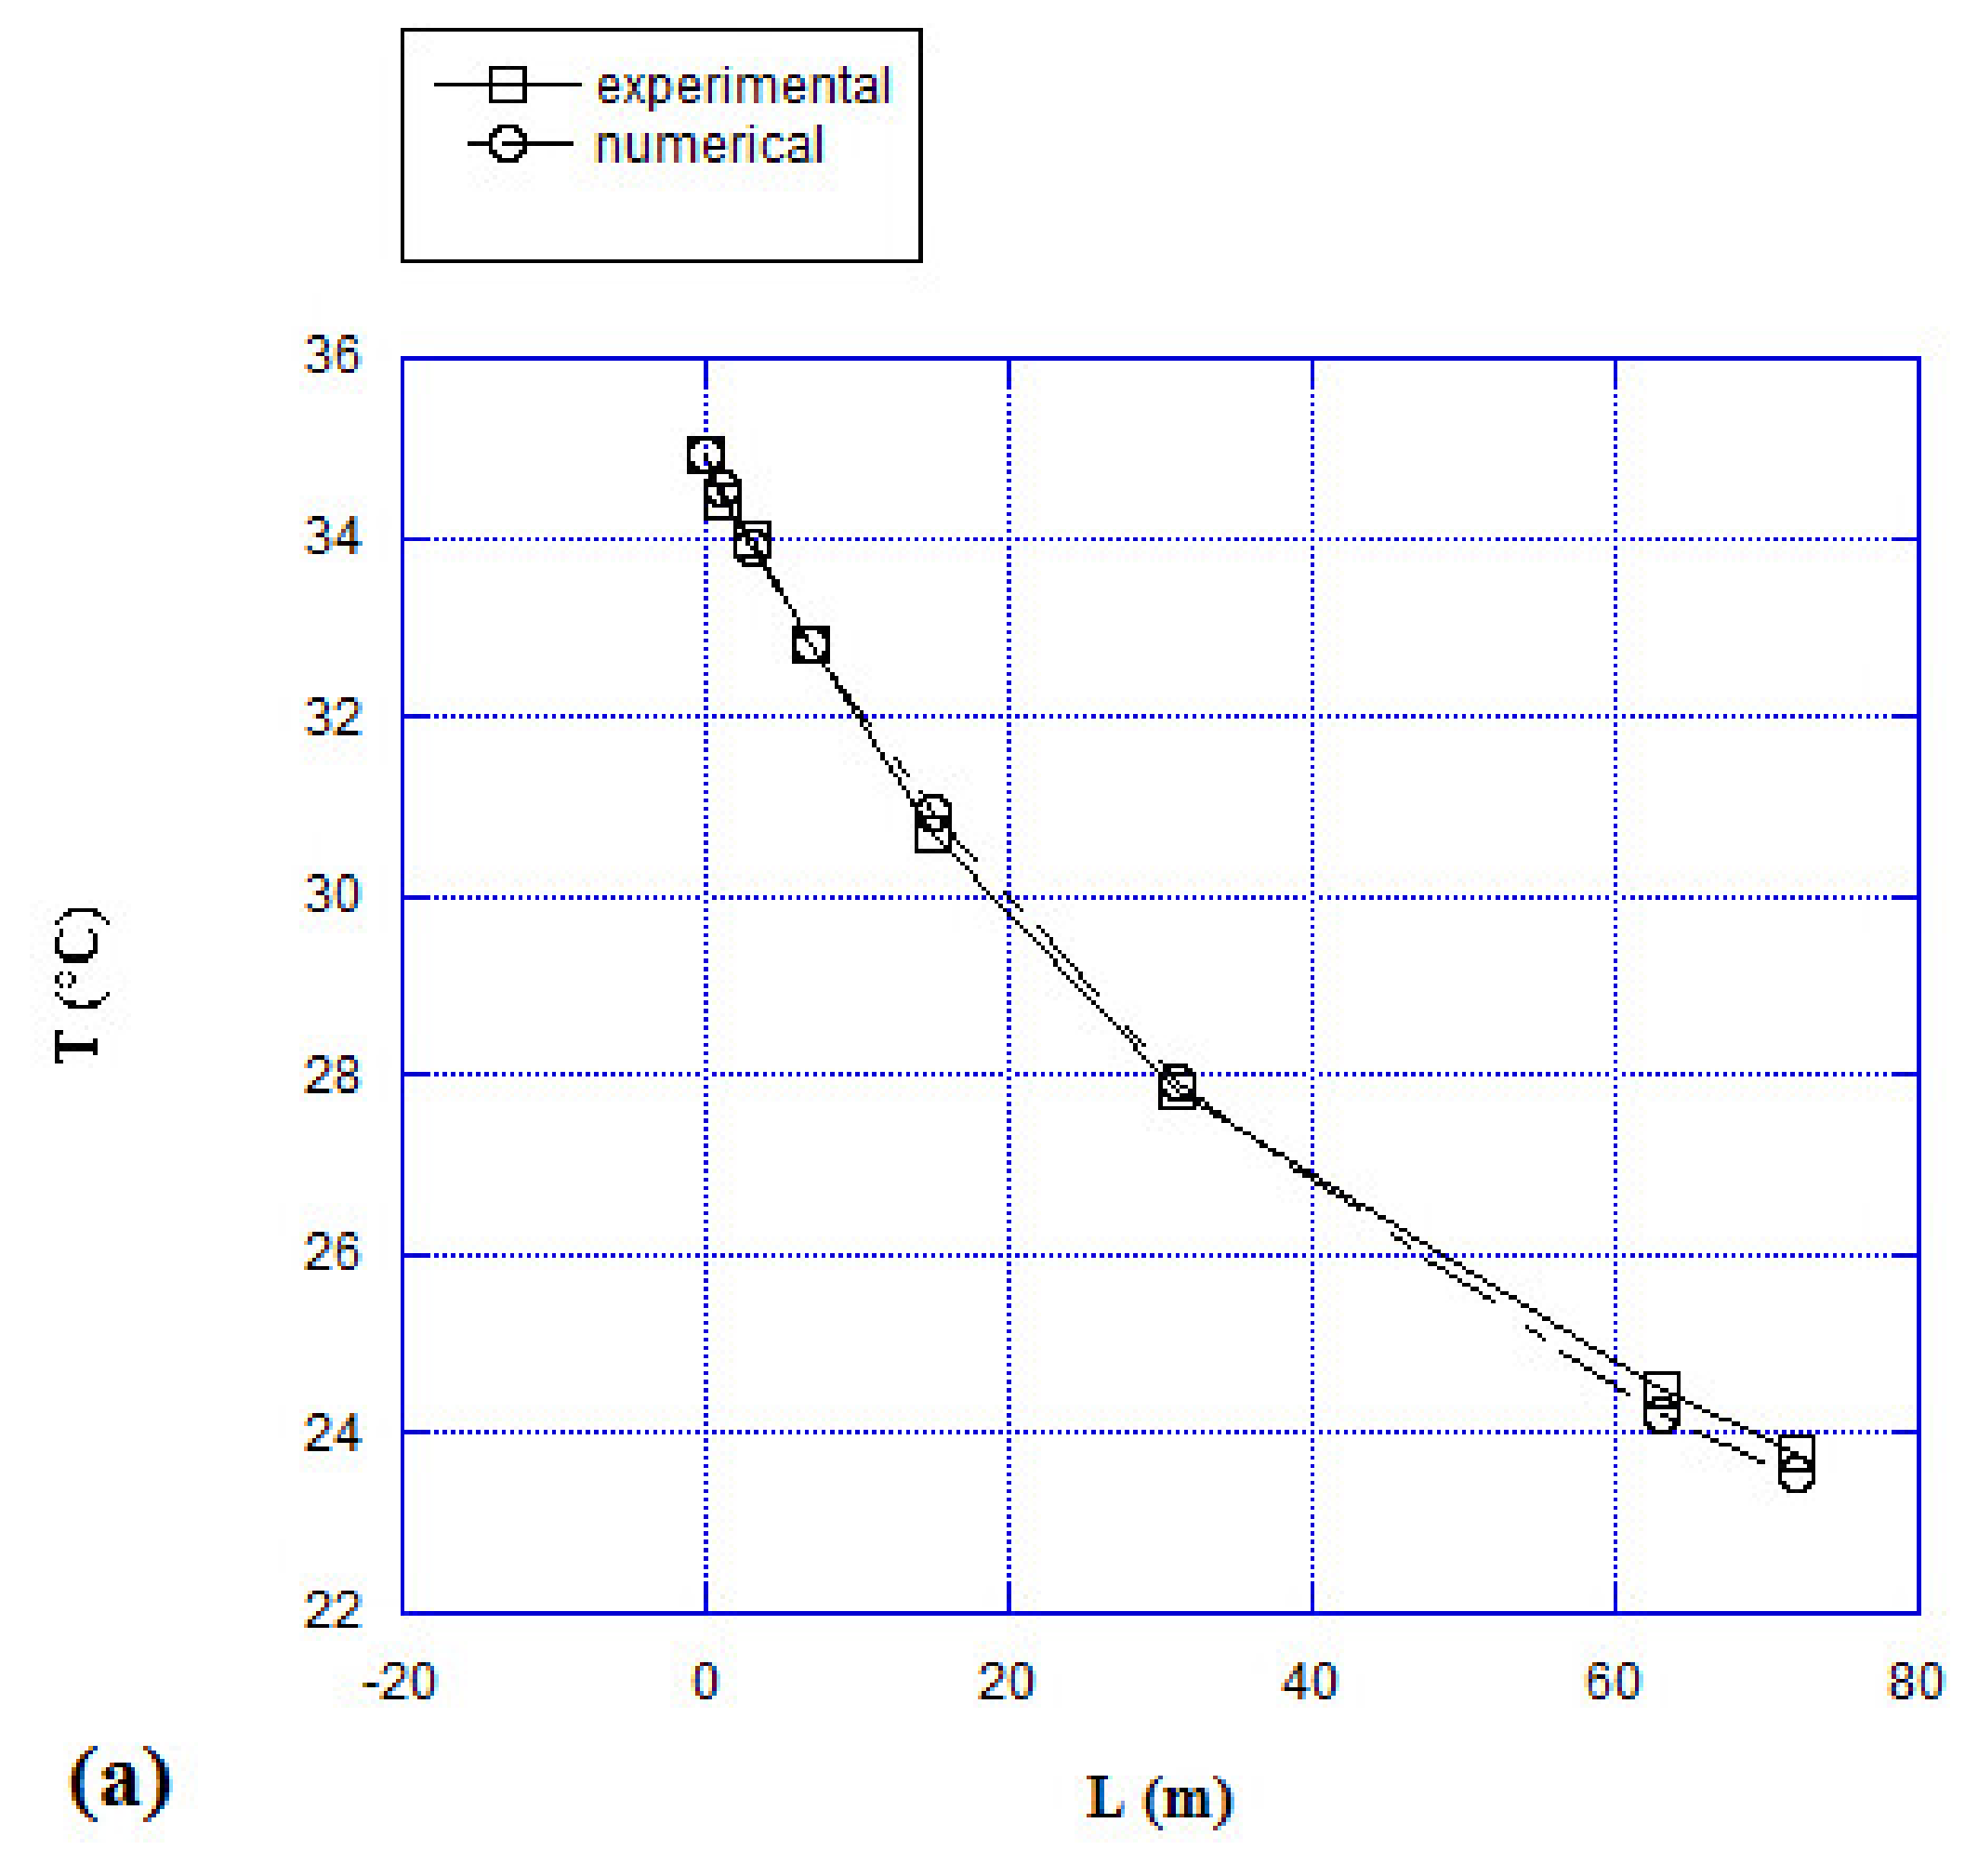
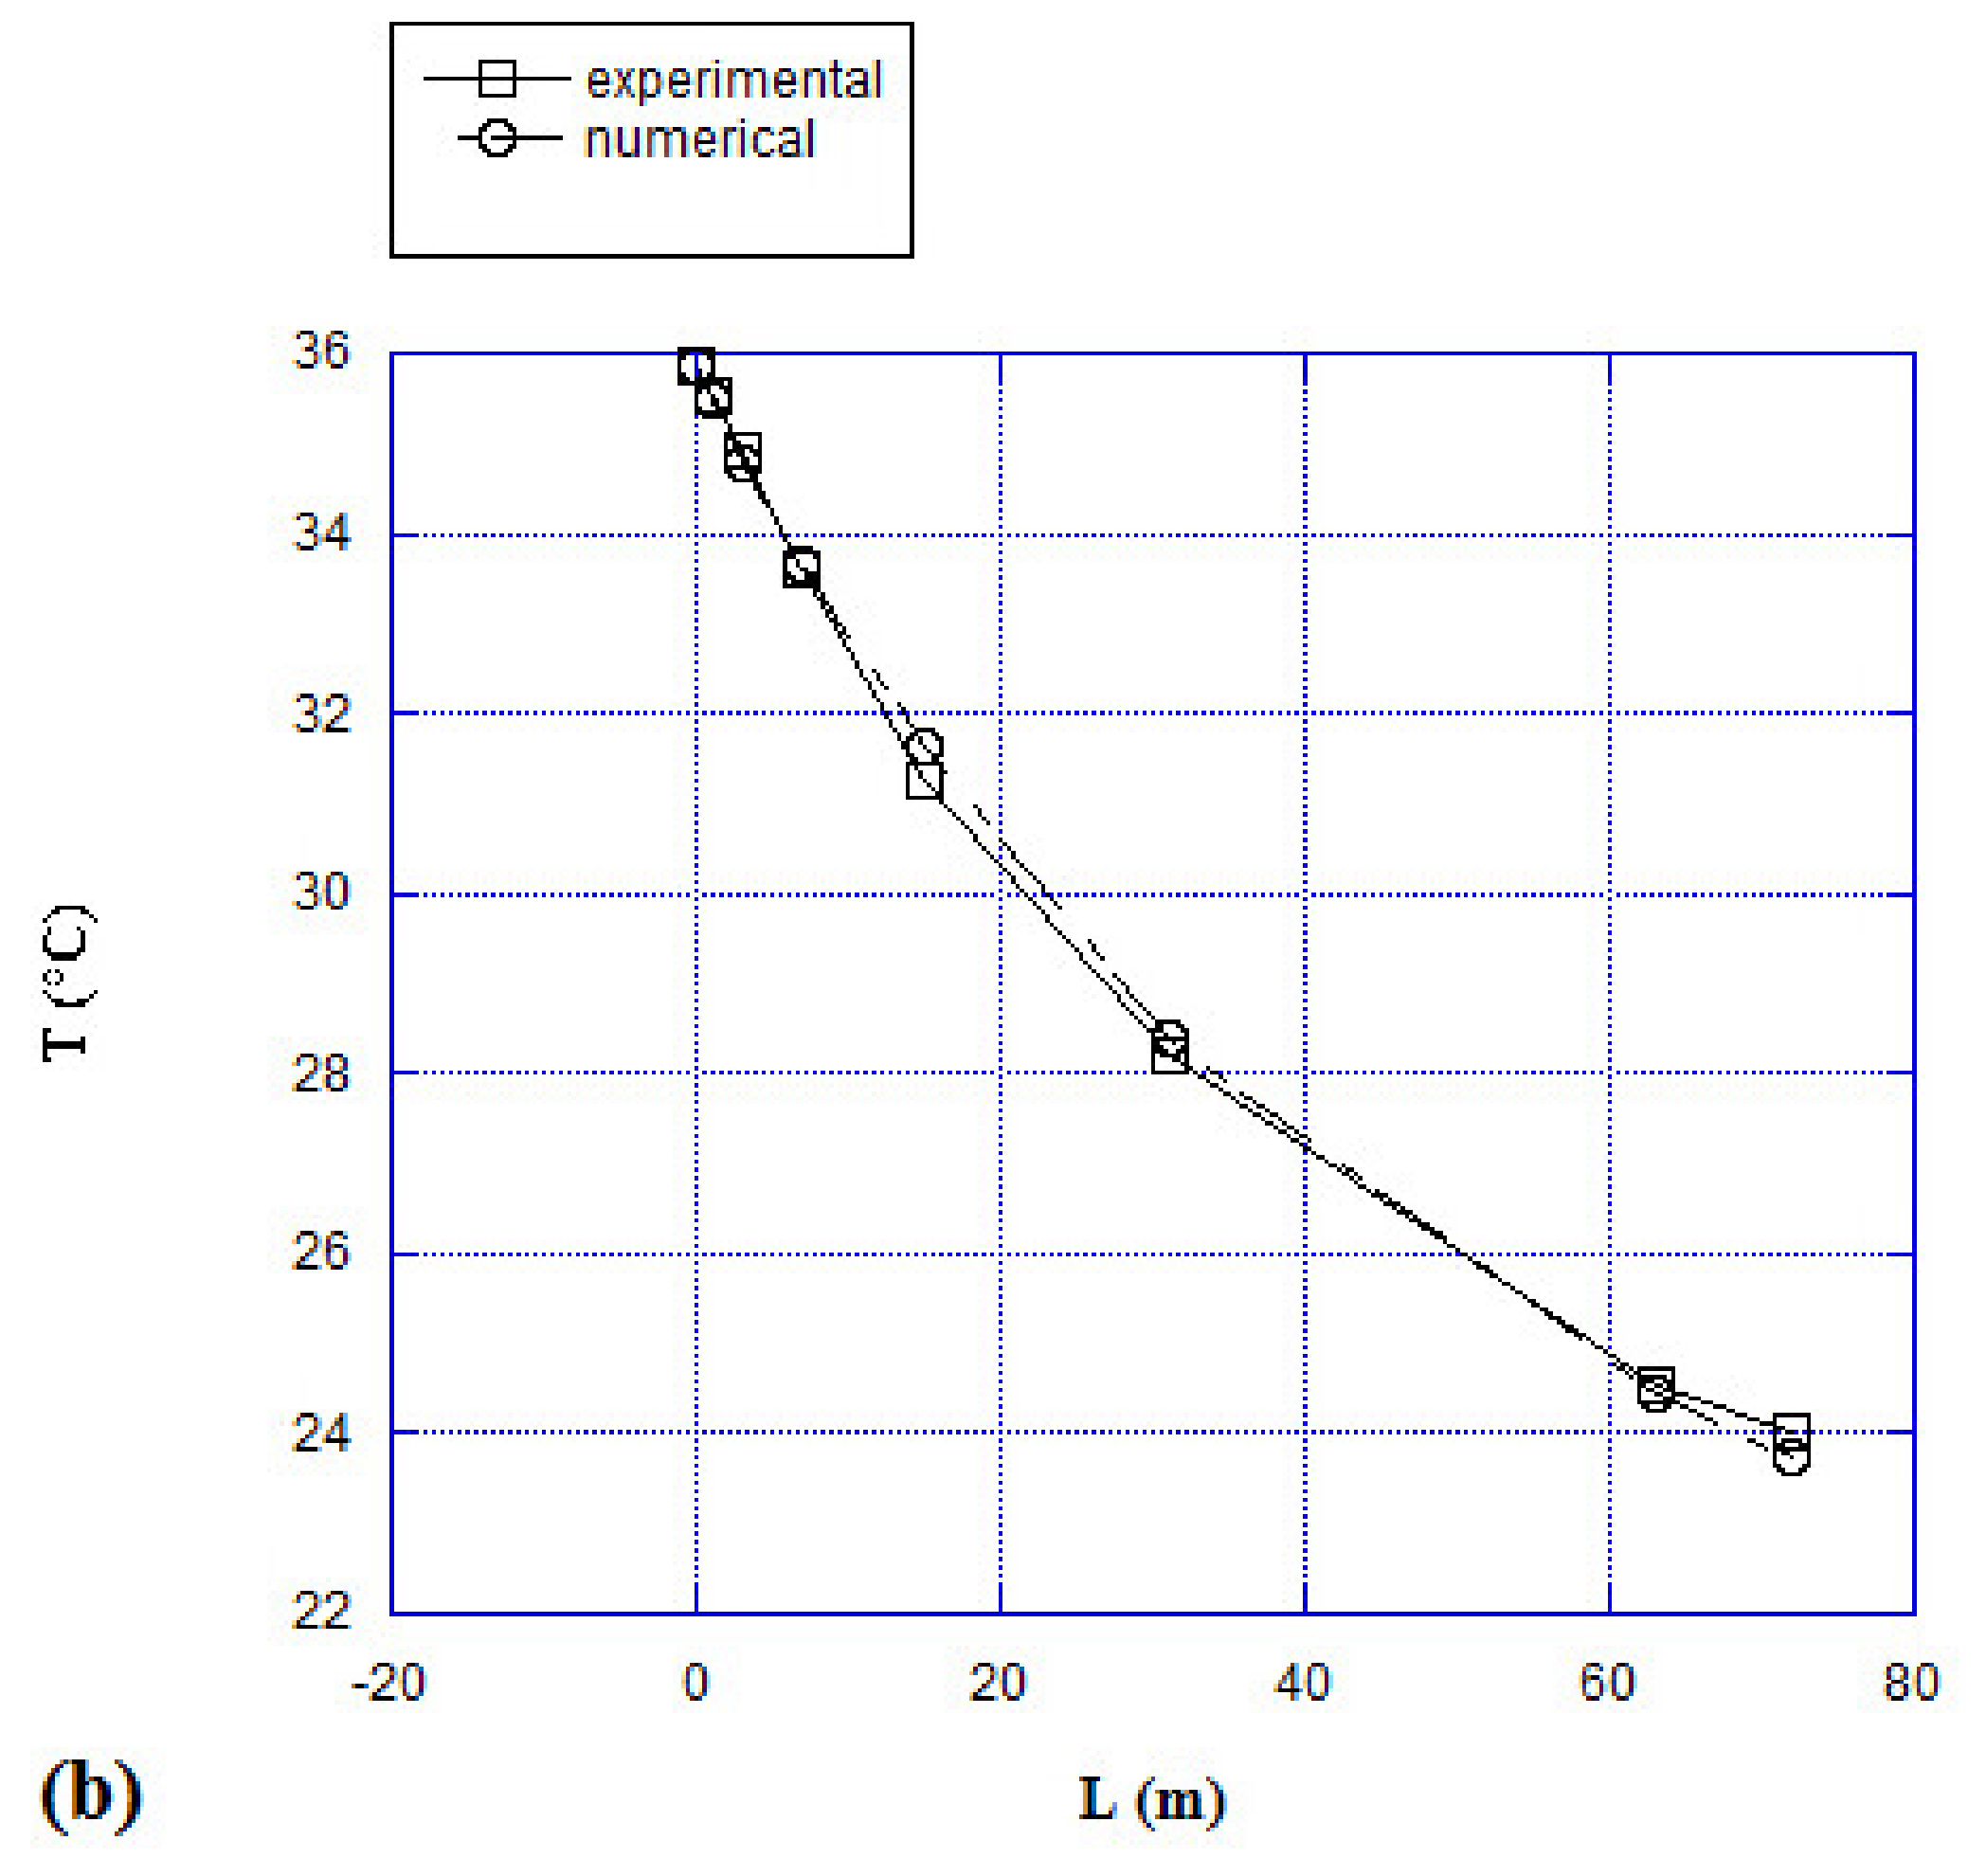
The GAHX model introduced in this paper was validated through experimental data published in open literature. Specifically the model was validated comparing the results with the experimental data published by Khabbaz et al. [
28] obtained for an ground-to-air heat exchanger system located in Marrakech (Morocco) (Latitude 31°38′02″ N, Longitude –7°59′59″ E), city that is characterized by hot semi-arid climate.
The experimental GAHX system is formed by three horizontal parallel pipes, made of PVC. Each pipe has a length of 72 m, a 15 cm inside diameter and it is buried between 2.2 and 3.2 m depth.
The comparison was performed with the air entering the pipes at 5 m s−1 as velocity and at two different temperatures (34.9 °C and 35.9 °C). The corresponding Reynolds number (4.55104) ensures that the air flowing could be treated as full turbulent.
Figure 4 reports a comparison between the experimental results published by Khabbaz et al. [
28] and the results carried out by the model introduced in this paper, considering the same geometrical, thermodynamical and boundary conditions of the experimental system. The comparison was carried out considering the air inlet temperature of 34.9 °C (
Figure 4a) and 35.9 °C (
Figure 4b). The comparison reveals that the medium error values are 0.59% and 0.56% for the test with the inlet temperature of 34.9 °C and 35.9 °C, respectively, whereas the maximum error values are 1.2% and 1.1%. The accordance between experimental and numerical results could be considered acceptable.
2.3. The HVAC System
The HVAC system is based on a condensing boiler coupled to an electrical air-cooled chiller. These components are responsible for producing hot and cold water connected to an air handling unit (for primary air treatment) and fan-coil units located in each room of the building. The design thermo-hygrometric conditions to be guaranteed inside each room are:
- -
indoor air temperature: 20 °C for winter and 26 °C for summer;
- -
relative humidity of 50% for both winter and summer;
- -
supply primary air temperature: 20 °C for winter and 15 °C for summer.
The design external airflow to be conveyed in the AHU of the building is 1300 m
3 h
−1 (11 dm
3 person
−1) based on UNI 10339 [
29].
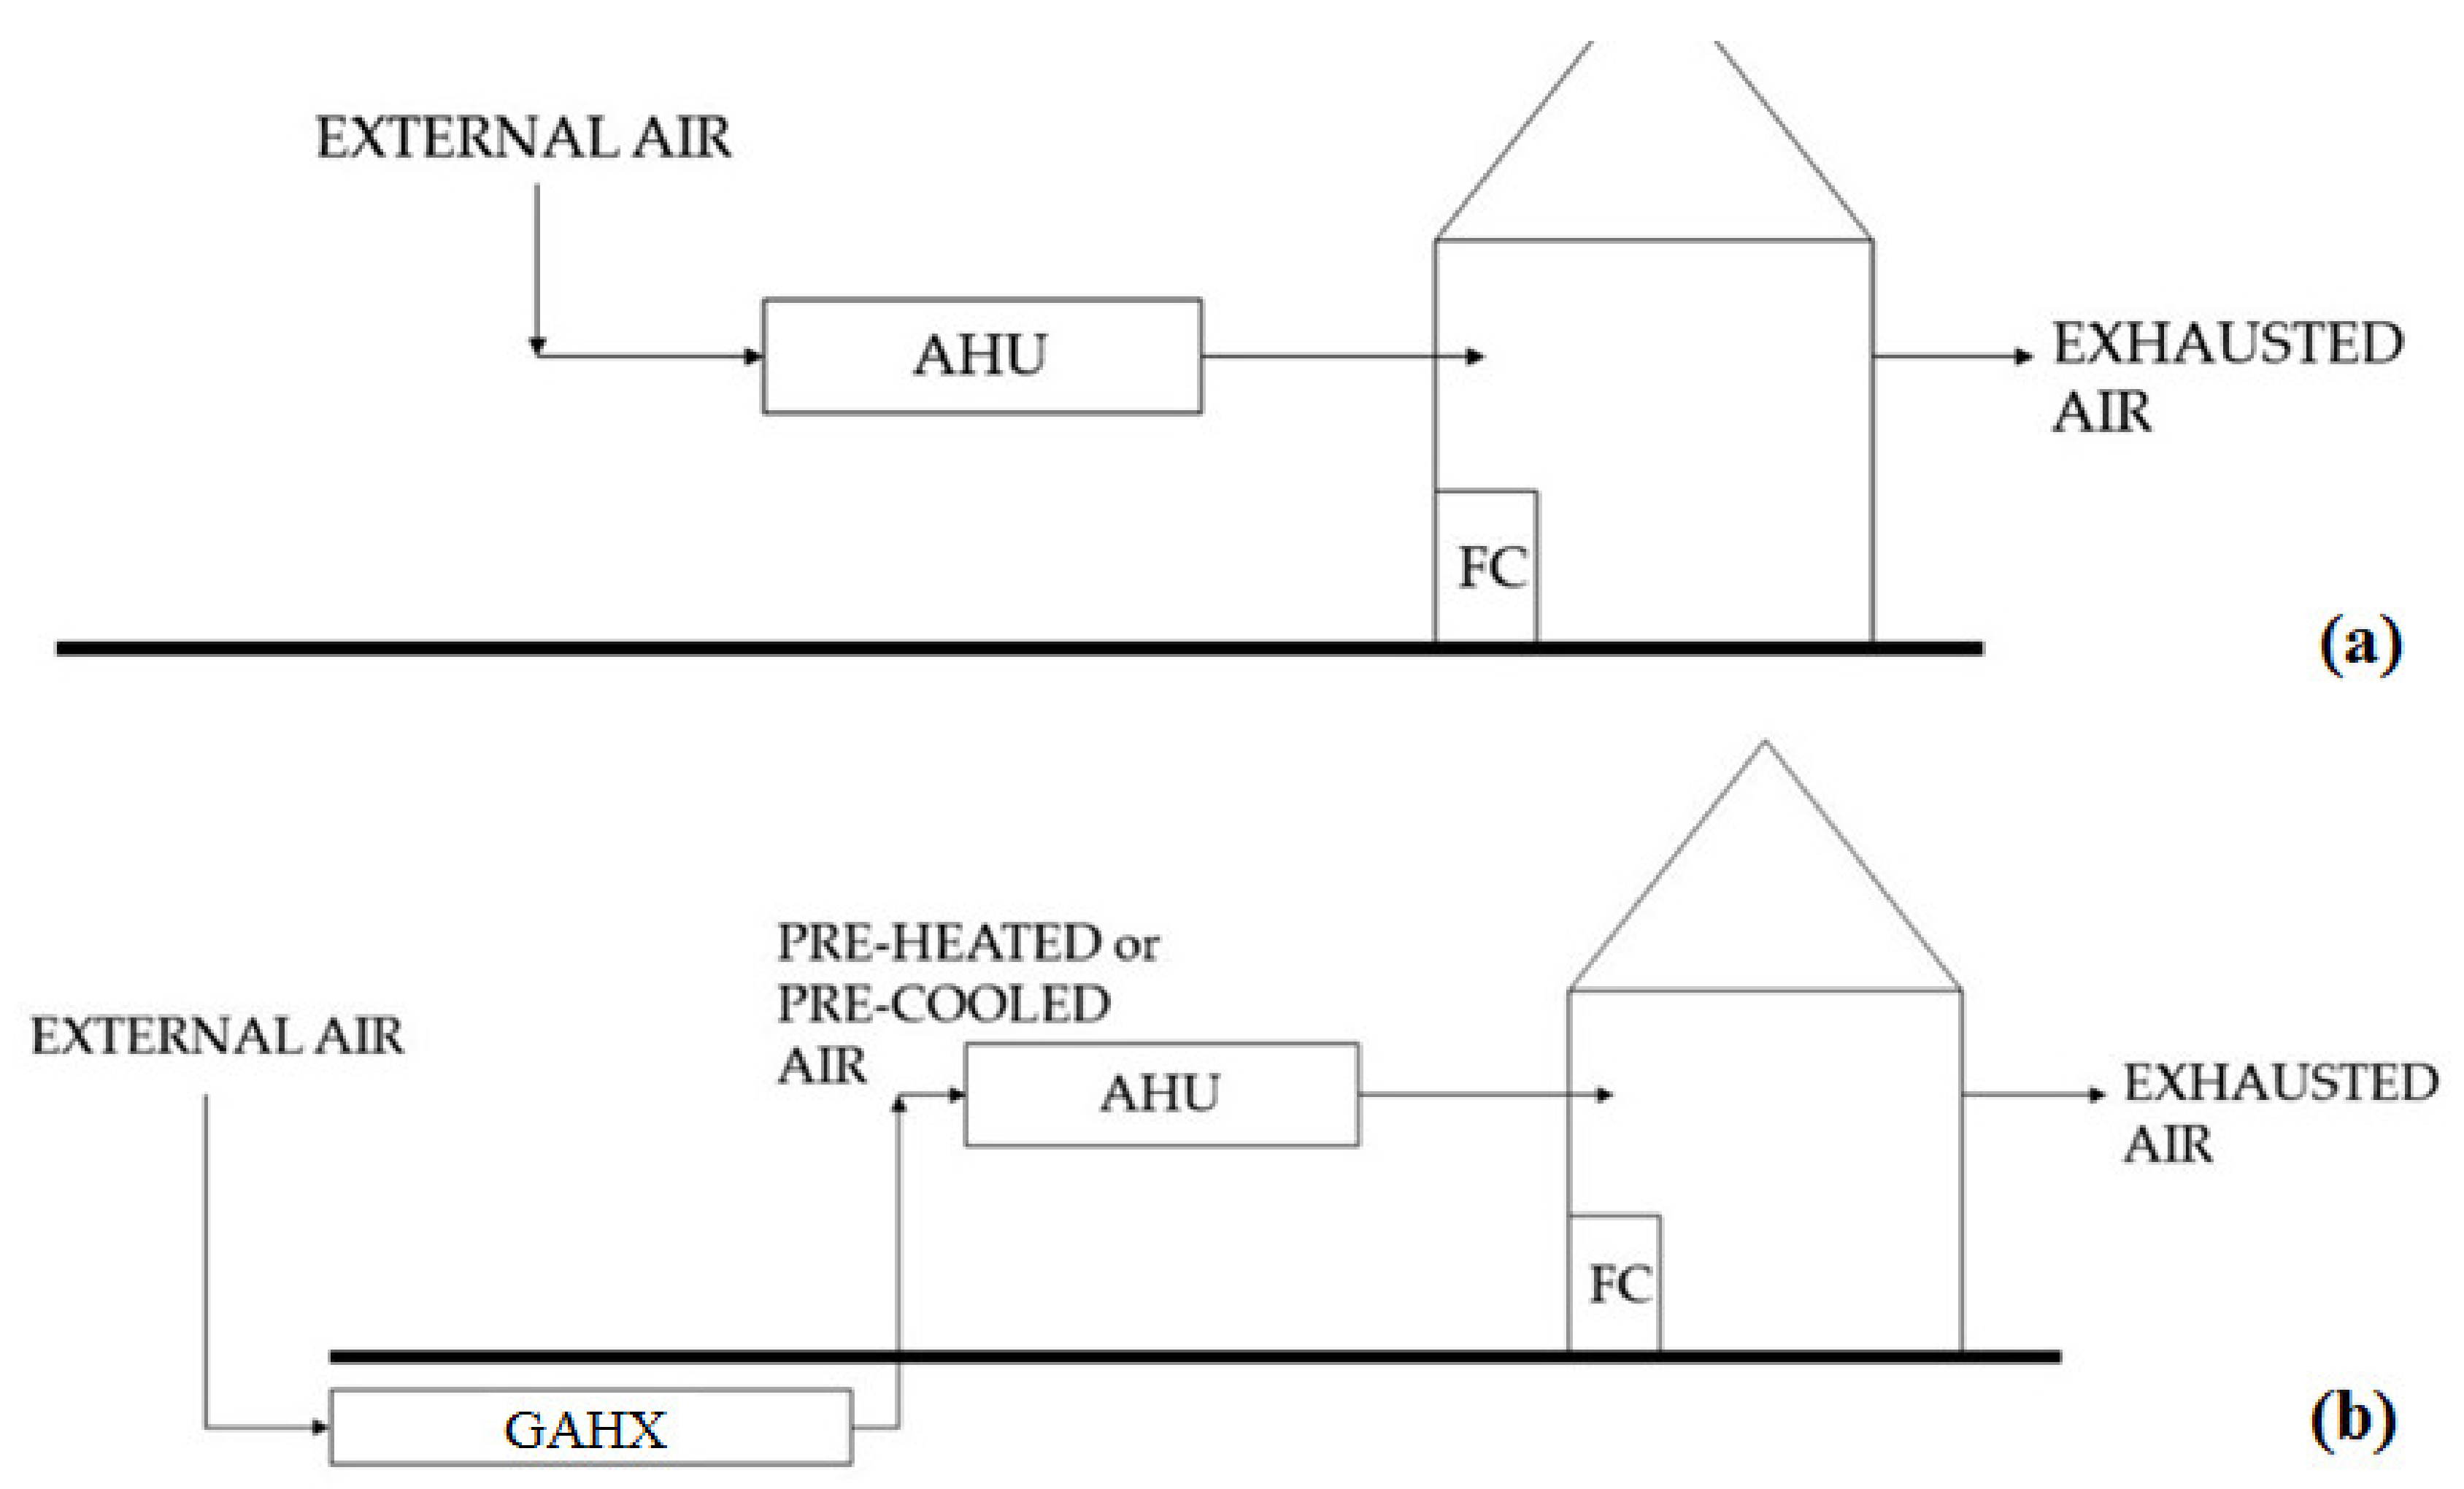
In this paper, two HVAC system configurations are proposed for the analyzed building (
Figure 5): the common solution (
Figure 5a) in which the air, introduced into the AHU, is directly the external air; the proposed configuration (
Figure 5b) consists in sending the pre-heated or pre-cooled air from the GAHX to the AHU.
As for the air handling unit, the system is composed of the following main elements:
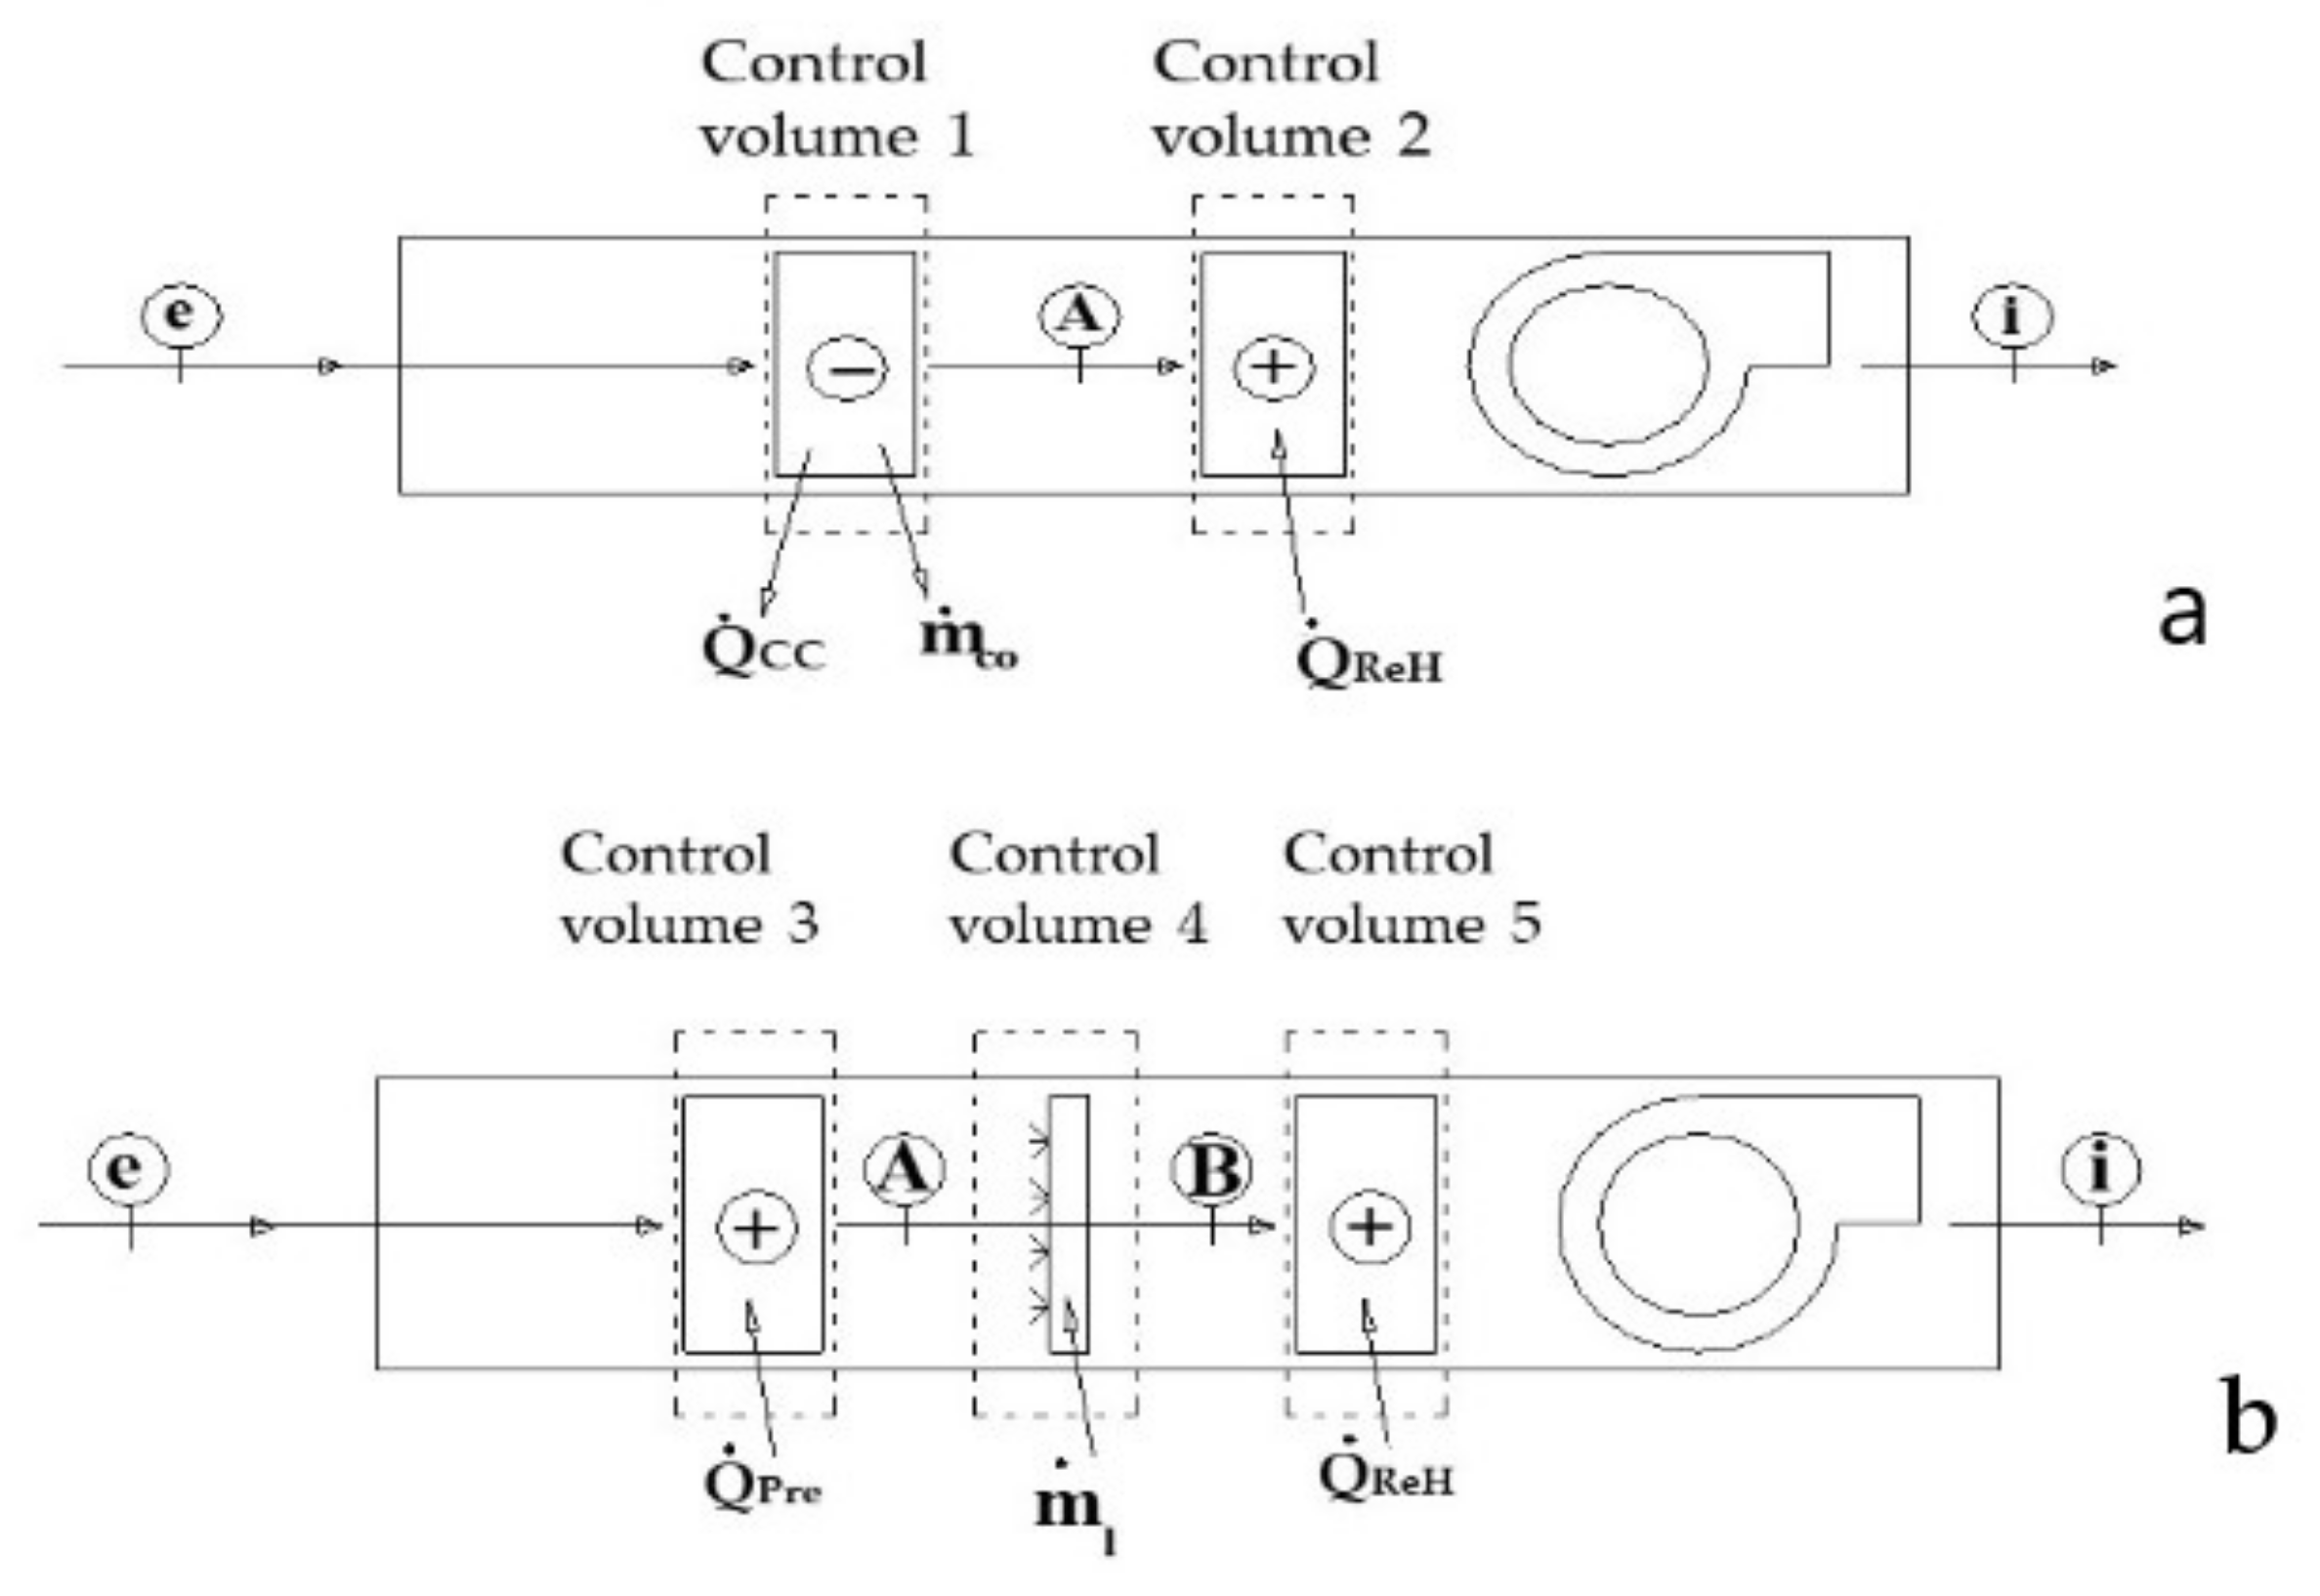
The capacity of the coils is assessed by means of mass and energy balances on the control volumes coinciding with the volume of the coils. As schematized in
Figure 6a, during the summer season the components of the HVAC system that are in operation are the cooling coil and the re-heating coil, whereas during winter (
Figure 6b) the active components are the heating coil, the humidifier with liquid water and the re-heating coil.
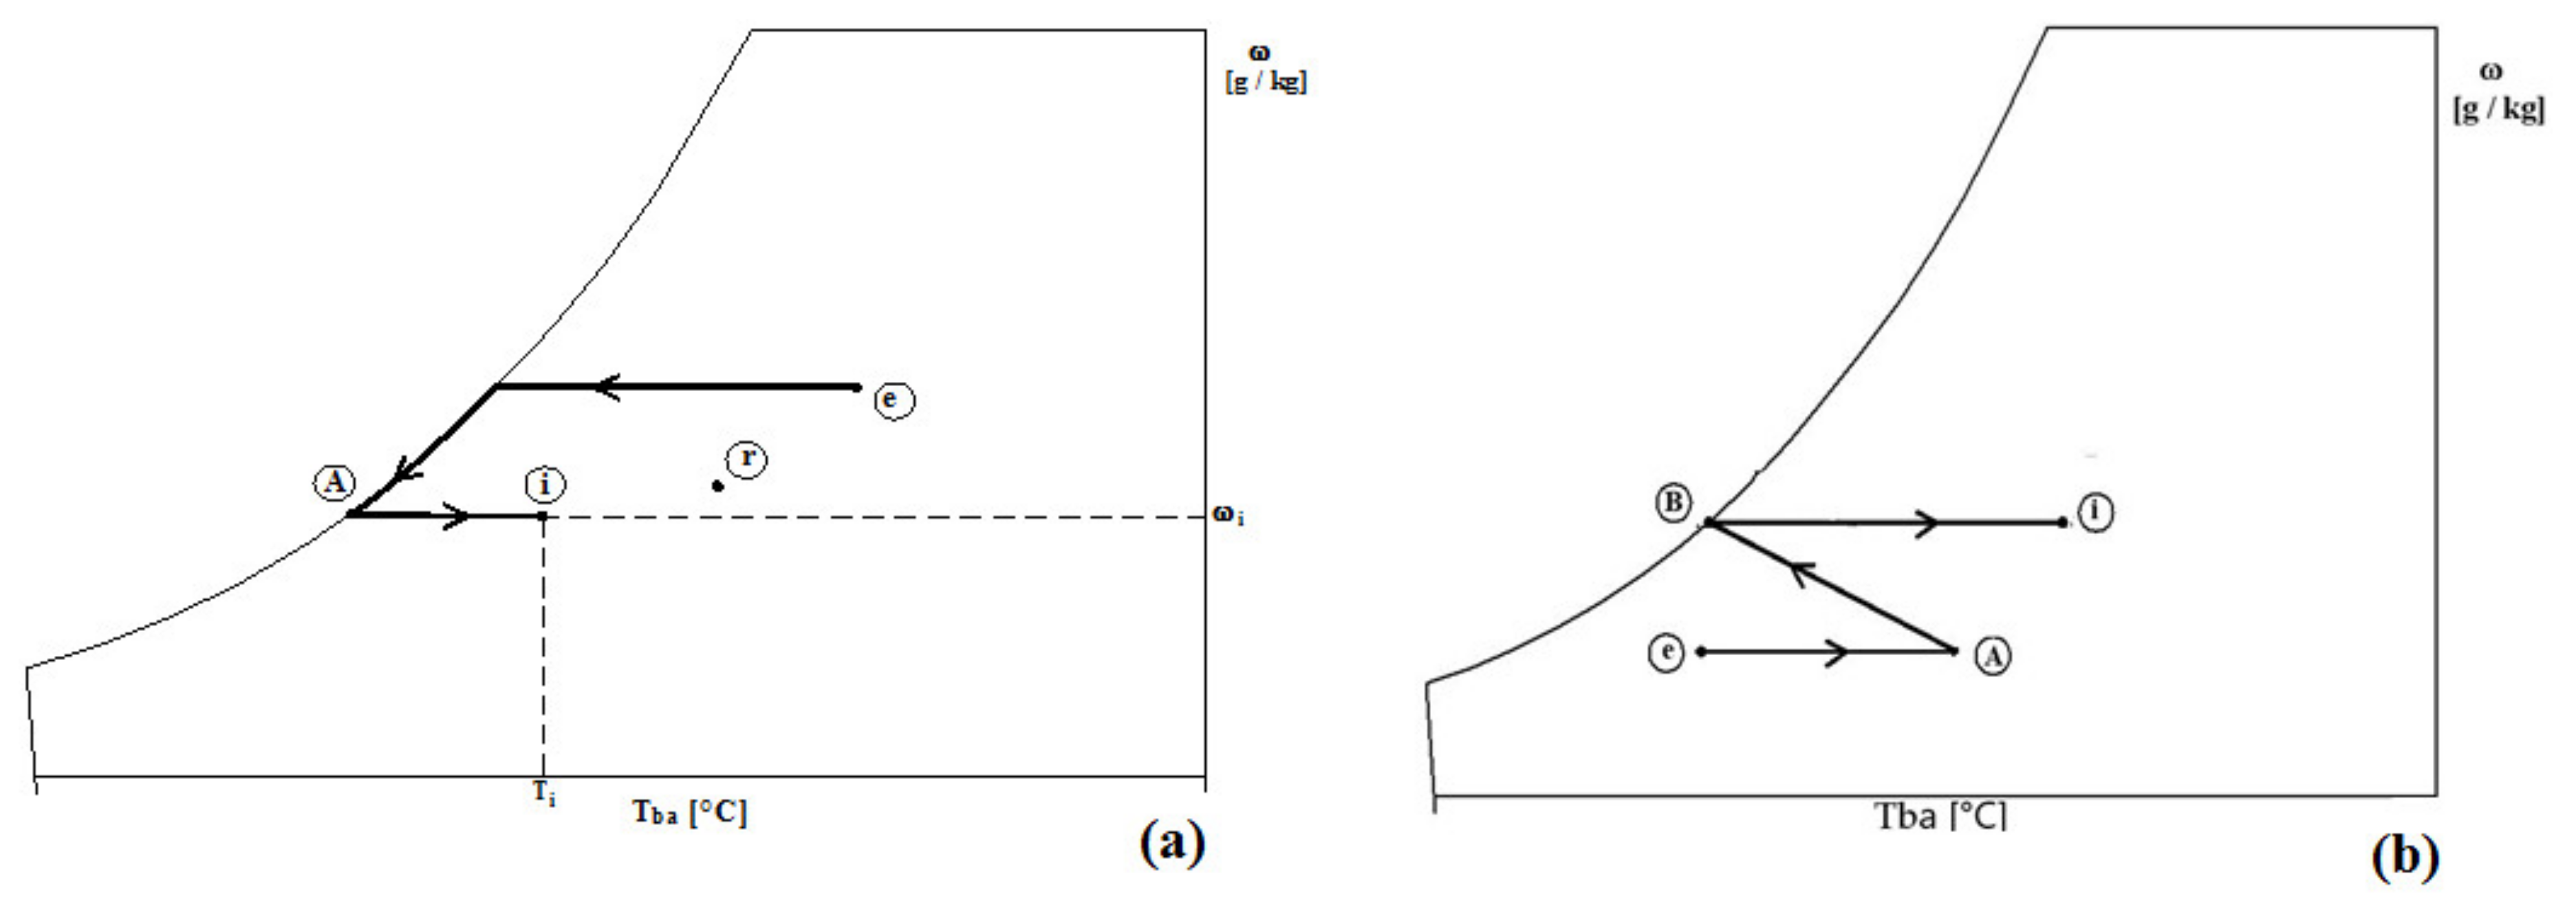
With reference to the summer season, as shown in
Figure 7a, the processes that the humid air undergoes are cooling and dehumidification (ϕ = 100%) from point
e (external air conditions) to point
A and subsequent re-heating from point
A to point
i (supply or introduction conditions). During winter, as clearly visible in
Figure 7b, the processes of humid air are pre-heating from point
e to point
A, humidification with liquid water from point
A to point
B and re-heating from point
B to point
i.
Both the cooling coil (bypass factor equal to zero) and humidifier (saturation efficiency equal to 100%) are considered as ideal components.
Below are reported the energy balance equations for calculating coil thermal power when AHU operates in cooling mode (summer). Cooling coil power (control volume 1 of
Figure 6):
Re-heating coil thermal power (control volume 2 of
Figure 6):
Below are the balance equations for calculating coil power when AHU acts in heating mode (winter). Pre-heating coil power (control volume 3 of
Figure 6):
Mass flowrate of humidification water (control volume 4 of
Figure 6):
Re-heating coil thermal power (control volume 5 of
Figure 6):
In the configuration of the HVAC system with GAHX (
Figure 7b), the point
e, which in the psychrometric chart of the
Figure 7 represents the design thermo-hygrometric conditions of the external air, is replaced with a new point characterized by the temperature of the air exiting from the GAHX, evaluated through the numerical model solved with the finite element method.
Once the thermo-hygrometric conditions of this new point are obtained, the reduced power of the AHU coils is calculated both for summer and winter in the configuration with GAHX. Subsequently, the percentage reduction of the power of the coils resulting from the introduction of the GAHX compared to the usual AHU without GAHX is evaluated through the Equation (15):
in which the term
indicates the thermal power of each coil present in the AHU or of all the coils together.
The reduction in the power of the coils is assessed considering both each coil separately (pre-heating coil in winter and cooling coil in summer) and the total power of these coils (total power reduction taking into account both summer and winter operation).
The investigation was performed for different lengths of the GAHX pipes:
The tube diameter was fixed at 0.2 m. Indeed, a previous analysis [
30] has shown that decreasing the tube diameter the heat exchange becomes more efficient because the air velocity increases enhancing the convection heat transfer coefficient. On the other hand, since the required volumetric flow rate to be conveyed in the building should be constant at 1300 m
3 h
−1, the number of tubes in parallel increases with the decrease of the tube diameter. Therefore, a diameter 0.2 m is a good compromise. The inlet air flow velocity was also varied keeping the Reynolds number in turbulent flow regime:
Since the total air mass flow rate
at the GAHX inlet should remain constant, the number of tubes in parallel configuration should vary with the air flow velocity. For each air velocity the Reynolds number and the number N
t of tubes in parallel configuration (with the air properties evaluated at a reference temperature of 20 °C) were calculated and reported in
Table 1.
The efficiency of the GAHX could be evaluated as the difference of the temperature of the air exiting and entering the GAHX on the maximum useful temperature span:
2.4. Analysis of the Different Climate Zones
For this analysis, the Köppen climate classification [
20] was used to categorize global climatic zones. It was developed by the climatologist and botanist Wladimir Köppen in 1884, then modified and enhanced throughout the years. This system is based on evaluation of the local vegetation in each zone, since it was known from the first publication in 19th century that the vegetation that grows in a certain region is dependent on the temperature and precipitation there. Köppen classification subdivides the Ground into five main climatic zones on the basis of temperature criteria, apart from the second zone (B) in which it is assumed that the key factor for vegetation’s growth is the dryness of the region. The principal zones are identified with a capital letter as follows:
Zone A: tropical or equatorial climates (minimum monthly value of temperature throughout the year is equal or greater than 18 °C).
Zone B: dry climates (annual mean value of precipitation is less than a specific limit).
Zone C: mild temperate climates (monthly average temperature of the warmest month is equal or greater than 10 °C, monthly average temperature of the coldest month ranging from –3 °C to 18 °C).
Zone D: continental climates (monthly average temperature of the warmest month is equal or greater than 10 °C, monthly average temperature of the coldest month is equal or lower than –3 °C).
Zone E: polar climates (monthly average temperature of the warmest month is less than 10 °C).
Each main zone can be further subdivided into subzones, adding a second letter and, if necessary, a third letter to the first capital letter. The first subdivision is based on a precipitation criterion (except for the E zone), while the second subdivision, where appropriate, refers to a further temperature criterion. The subdivisions are:
Zone A: this zone includes the warmest climates; the subdivision is based on monthly and annual precipitation.
Af = Tropical rainforest climate
Am = Tropical monsoon climate
Aw or As = Tropical wet and dry or savannah climate
Zone B: this zone includes deserts and steppes. The second letter refers to an annual precipitation limit, the third letter refers to a threshold on the average annual temperature (h indicates that the average annual temperature is equal or greater than 18 °C, k that it is less than this limit).
BWh = Hot desert climate
BWk = Cold desert climate
BSh = Hot semi-arid climate
BSk = Cold semi-arid climate
Zone C: The second letter w indicates dry winters; s defines a threshold on the precipitation in driest month of summer, f means significant precipitation distributed in all seasons. The third letter a indicates that the warmest month average temperature is above the limit of 22 °C; b indicates that the warmest month average temperature is below the previous limit but with at least four months above 10 °C; c indicates that one to three months average temperature is above 10 °C, but the warmest month is below 22 °C.
Cfa = Humid subtropical climate
Cfb = Temperate oceanic climate
Cfc = Subpolar oceanic climate
Cwa = Monsoon-influenced humid subtropical climate
Cwb = Subtropical highland climate
Cwc = Cold subtropical highland climate
Csa = Hot-summer Mediterranean climate
Csb = Warm-summer Mediterranean climate
Csc = Cold-summer Mediterranean climate
Zone D: The second letters have the same meaning of zone C; the third letters have the same meaning of zone C, with letter d that refers to the average temperature of the coldest month, which is inferior than –38 °C.
Dfa = Hot-summer humid continental climate
Dfb = Warm-summer humid continental climate
Dfc = Subarctic climate
Dfd = Extremely cold subarctic climate
Dwa = Monsoon-influenced hot-summer humid continental climate
Dwb = Monsoon-influenced warm-summer humid continental climate
Dwc = Monsoon-influenced subarctic climate
Dwd = Monsoon-influenced extremely cold subarctic climate
Dsa = Mediterranean-influenced hot-summer humid continental climate
Dsb = Mediterranean-influenced warm-summer humid continental climate
Dsc = Mediterranean-influenced subarctic climate
Dsd = Mediterranean-influenced extremely cold subarctic climate
Zone E: the belonging to the two subgroups is discriminated by the average temperature in the warmest month being above or below the threshold of 0 °C.
ET = Tundra climate
EF = Ice cap climate
Four cities (Rio de Janeiro, Dubai, Naples, Ottawa) belonging to the different climate zones (A, B, C, D) were considered in this analysis. Zone E has been excluded because it corresponds to polar climates. The weather data considered in the present investigation were identified through ASHRAE climatic data [
31]. In
Table 2 and
Table 3, for each locality, different design conditions are specified in terms of temperature, relative humidity of the air and solar irradiation for summer and winter season, respectively.
For each city of the analysis the thermal properties of the soil have been evaluated according to the parameters summarized in
Table 4 where the soil properties have been obtained by a balanced combination of the solid and liquid (water) contributions.
The temperature of the undisturbed soil is evaluated, as mentioned in the previous section, through the equation of Kusuda [
27] and for this evaluation the weather data, identified through ASHRAE climatic data [
31] and listed in
Table 5, were used.
3. Results and Discussion
The energy performances of the system, where the GAHX pre-treating unit is coupled to AHU compared to the system without GAHX, were evaluated for four cities (Rio de Janero, Dubai, Naples, Ottawa) belonging to different climate zones according to Köppen climate classification [
20]. Consequently, the GAHX was tested, both for winter and summer, with the external air entering the pipe according to the design parameters (temperature, relative humidity) listed in
Table 2 and
Table 3.
As introduced in
Section 2, the simulations on the GAHX were performed by varying the air flow velocity and the length of the pipes keeping the volumetric flow rate of the air entering the building at the constant value of 1300 m
3 h
−1.
Each test was performed in transient mode and the duration of each simulation was chosen according to let the GAHX reaching the steady state operation mode. Once the latter condition was reached, the outlet air temperature, efficiency of the GAHX, reduction of the power of the heating and cooling coils in the AHU due to the pre-treatment of the air operated by the GAHX were evaluated both in winter and summer season.
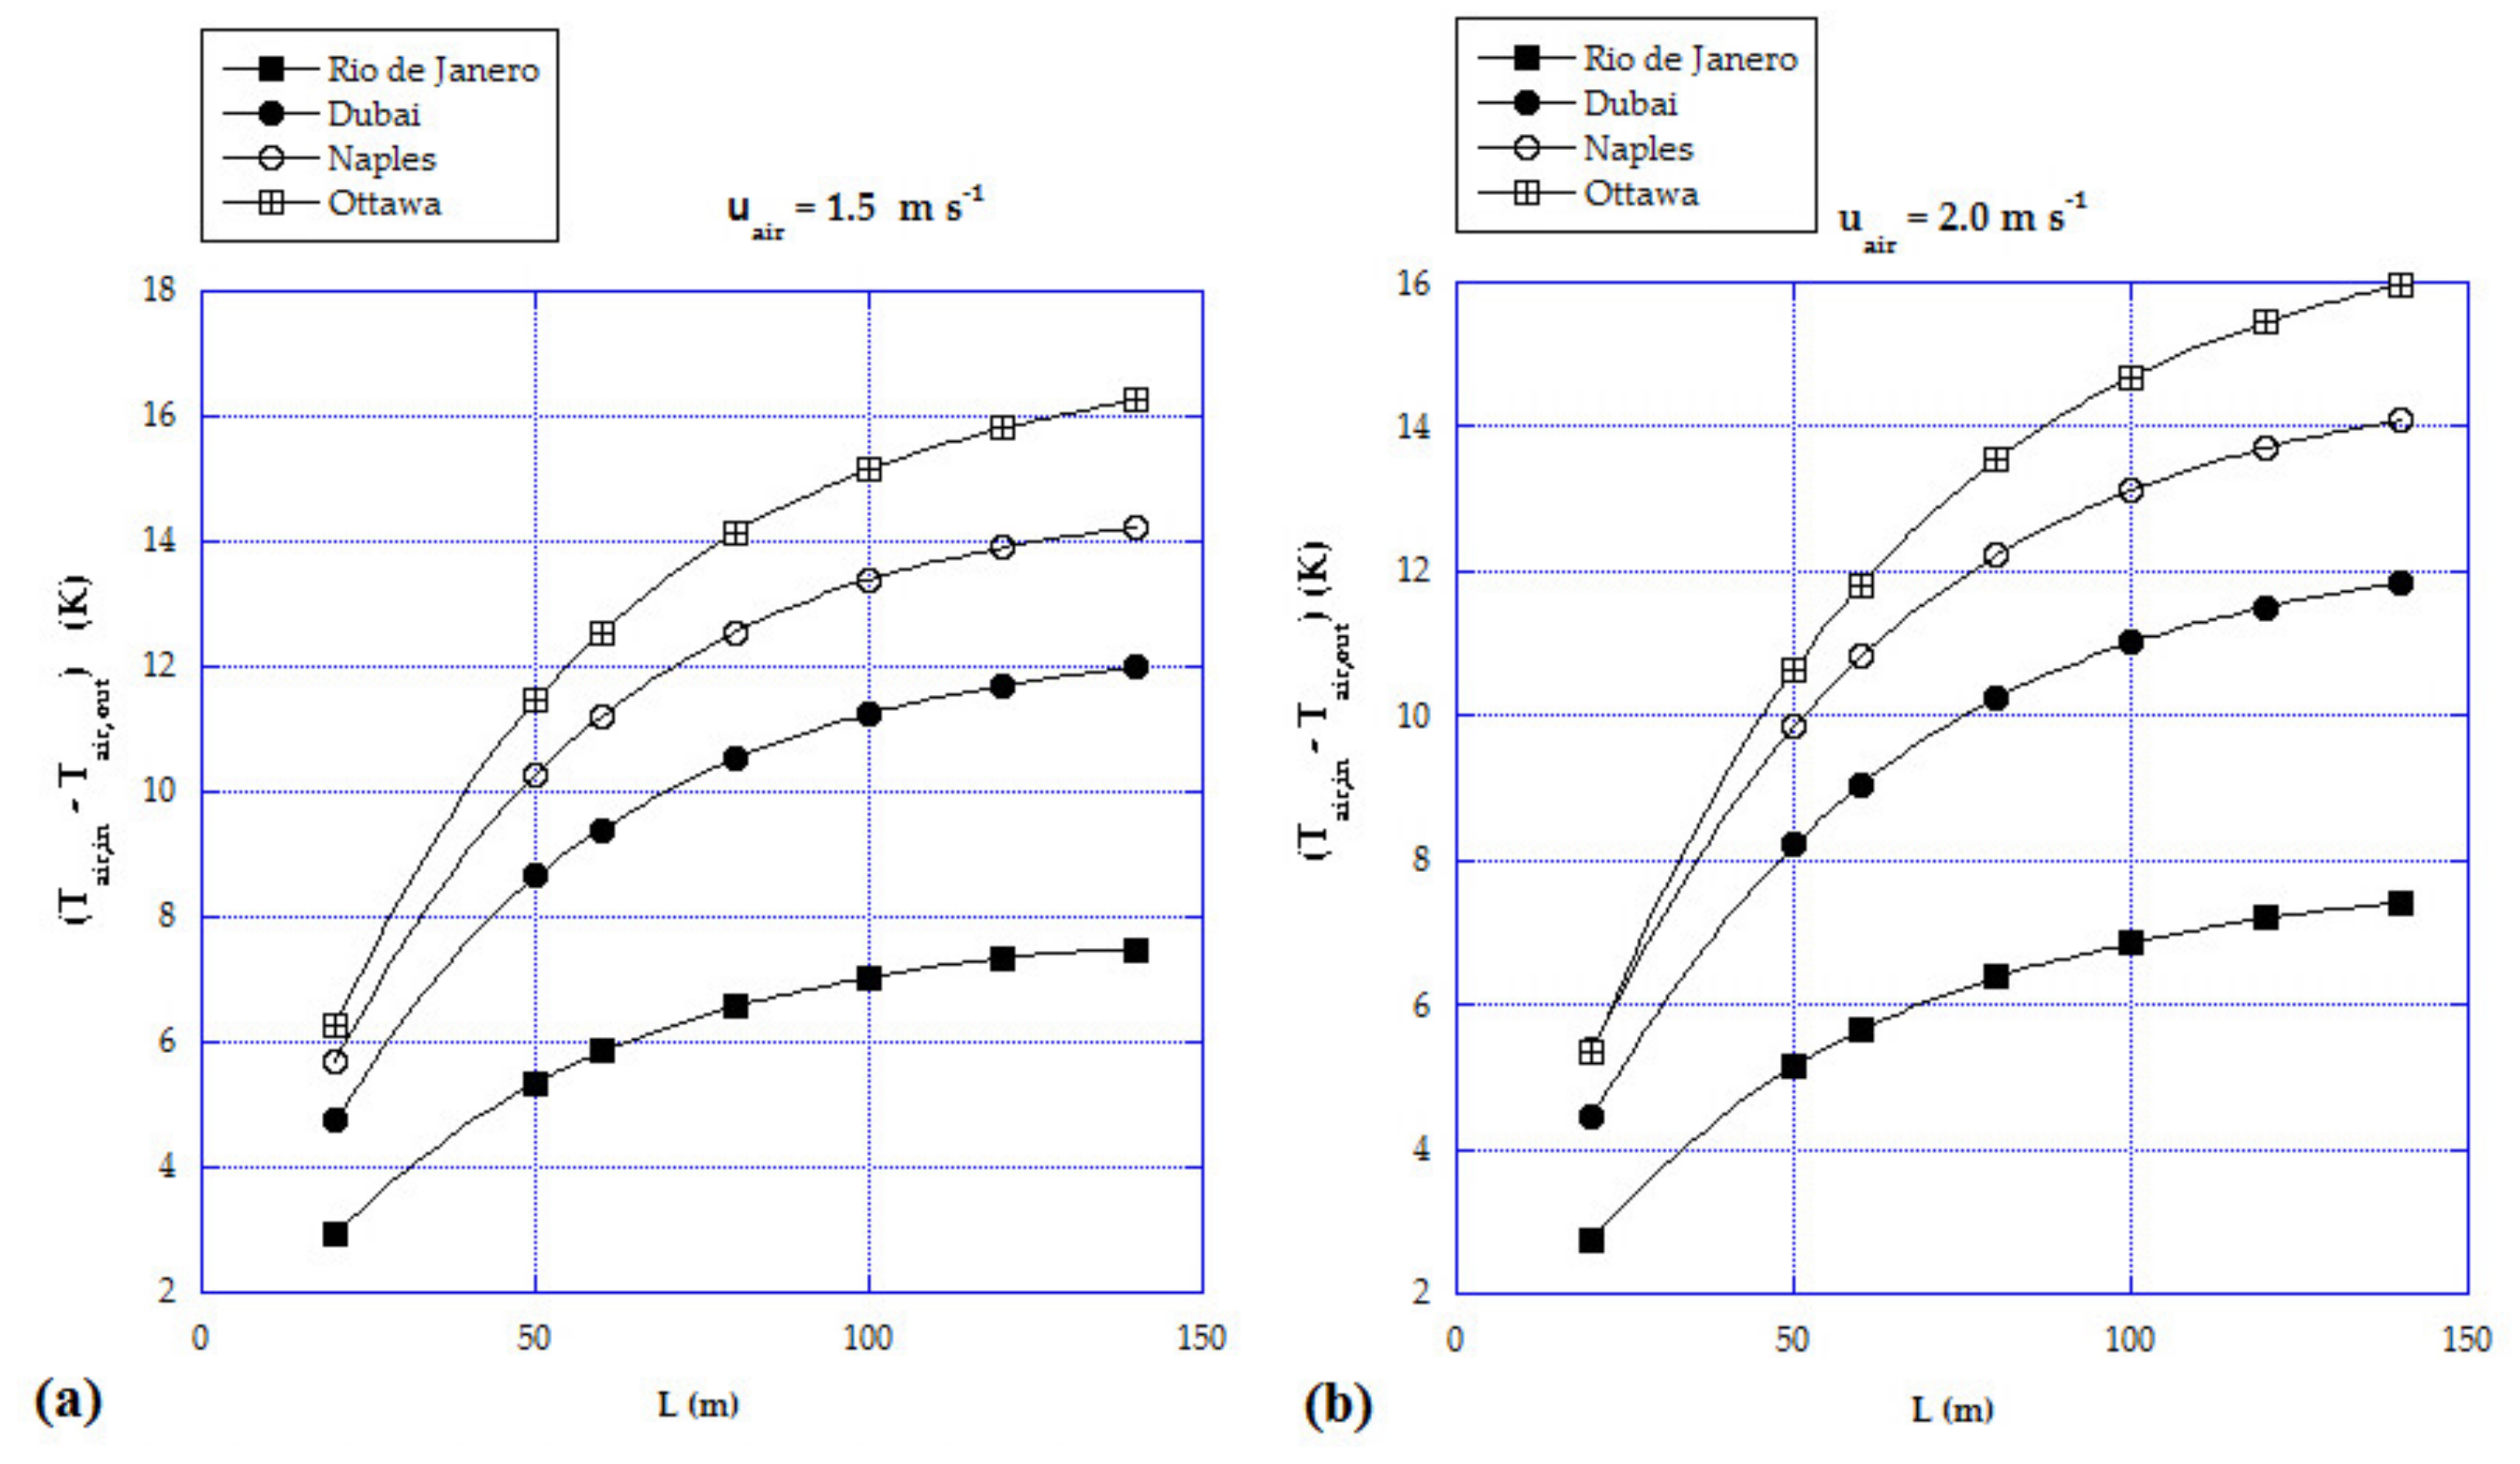
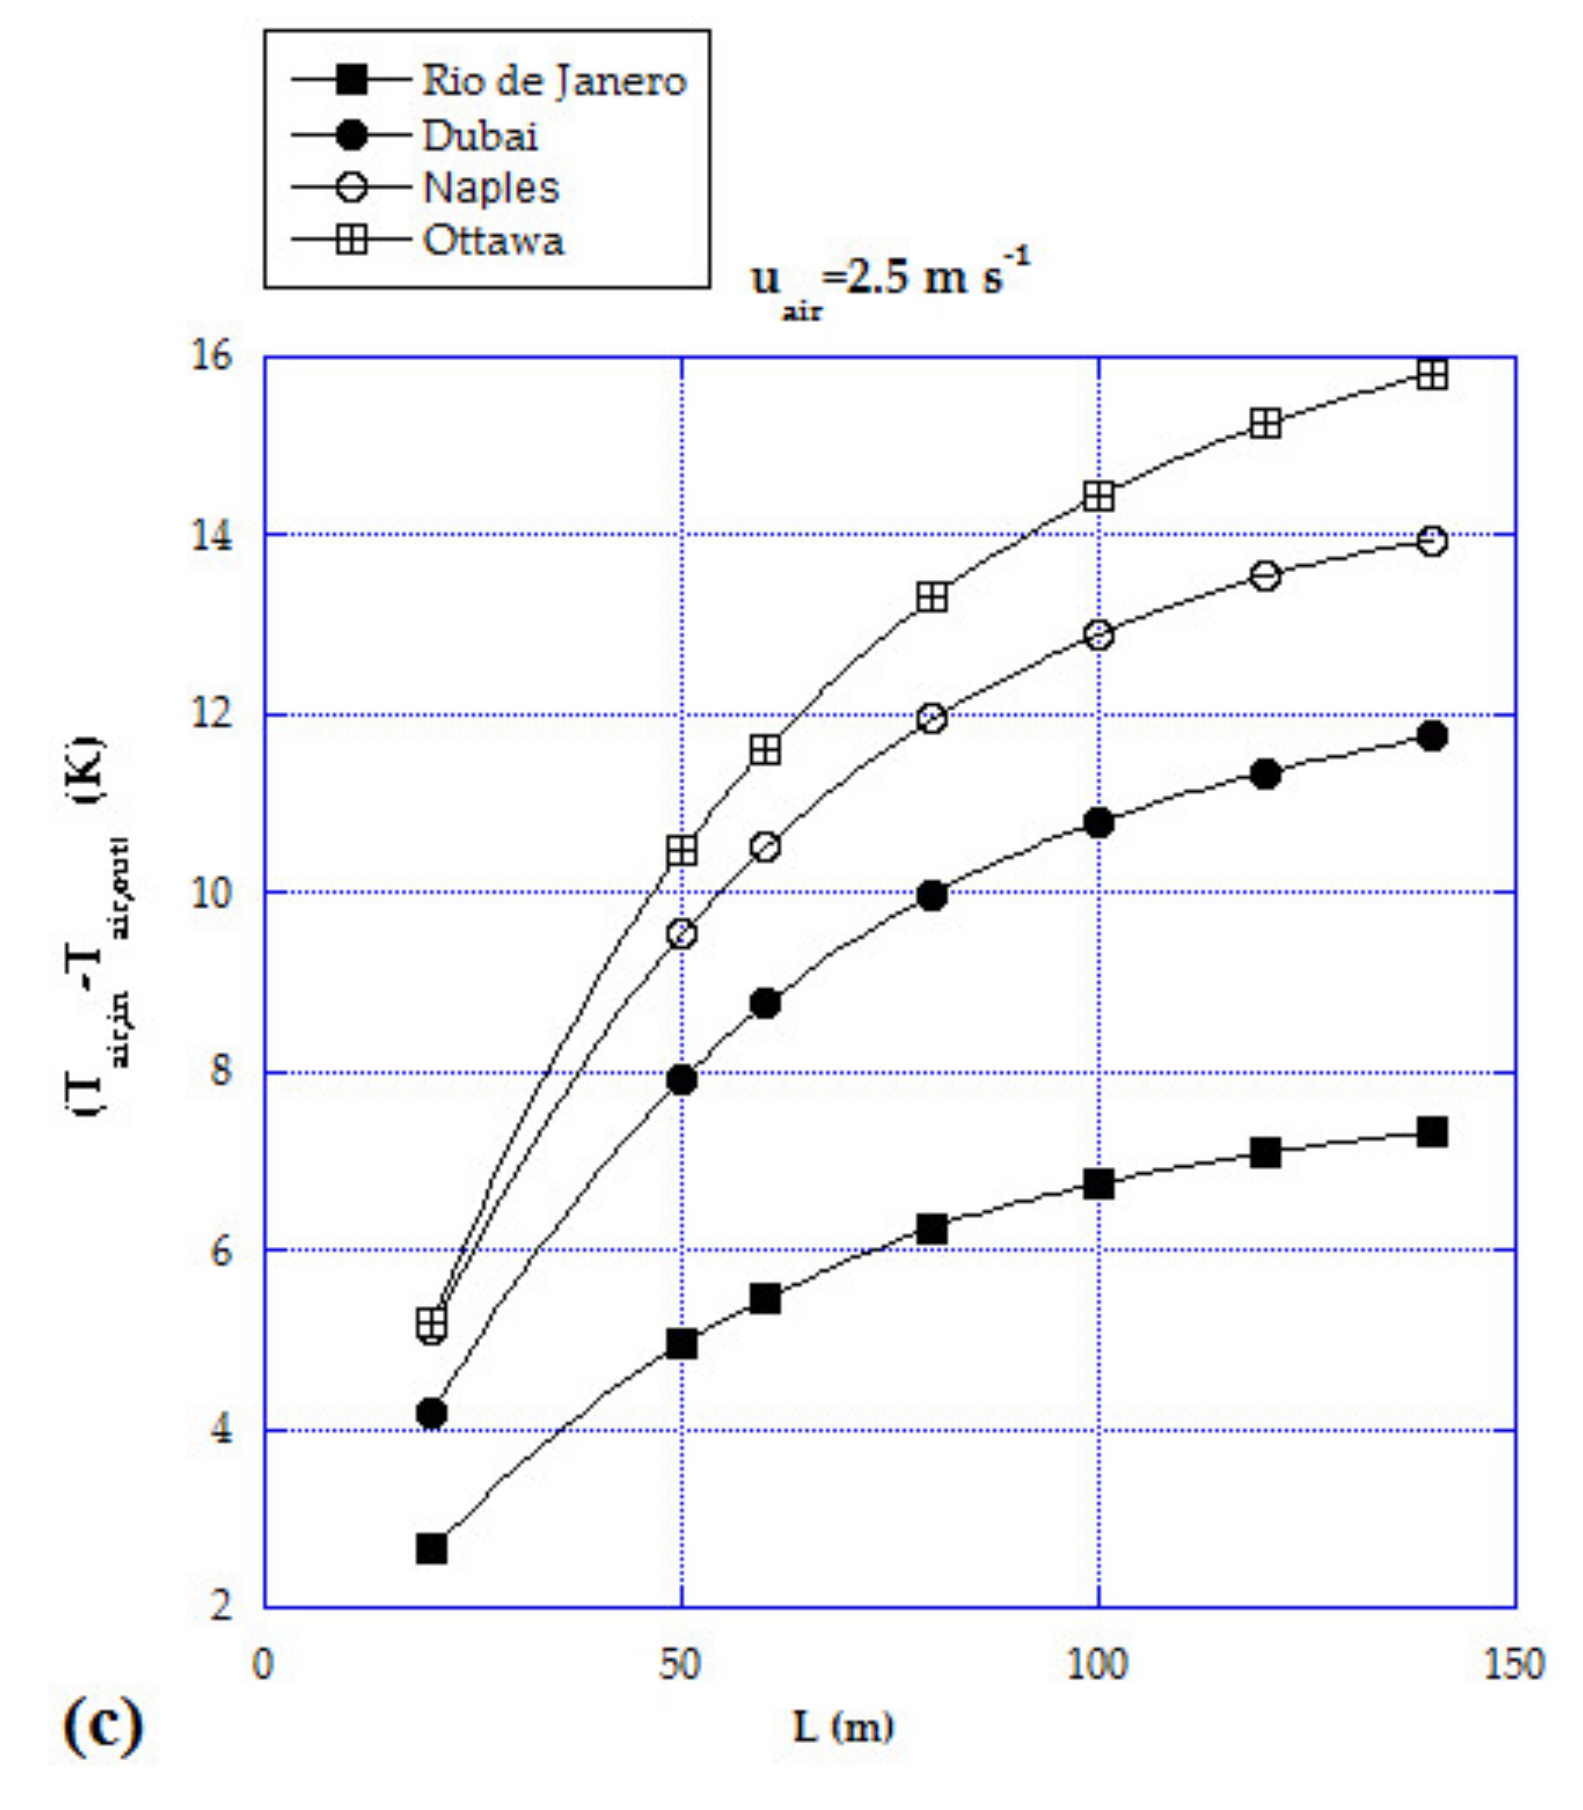
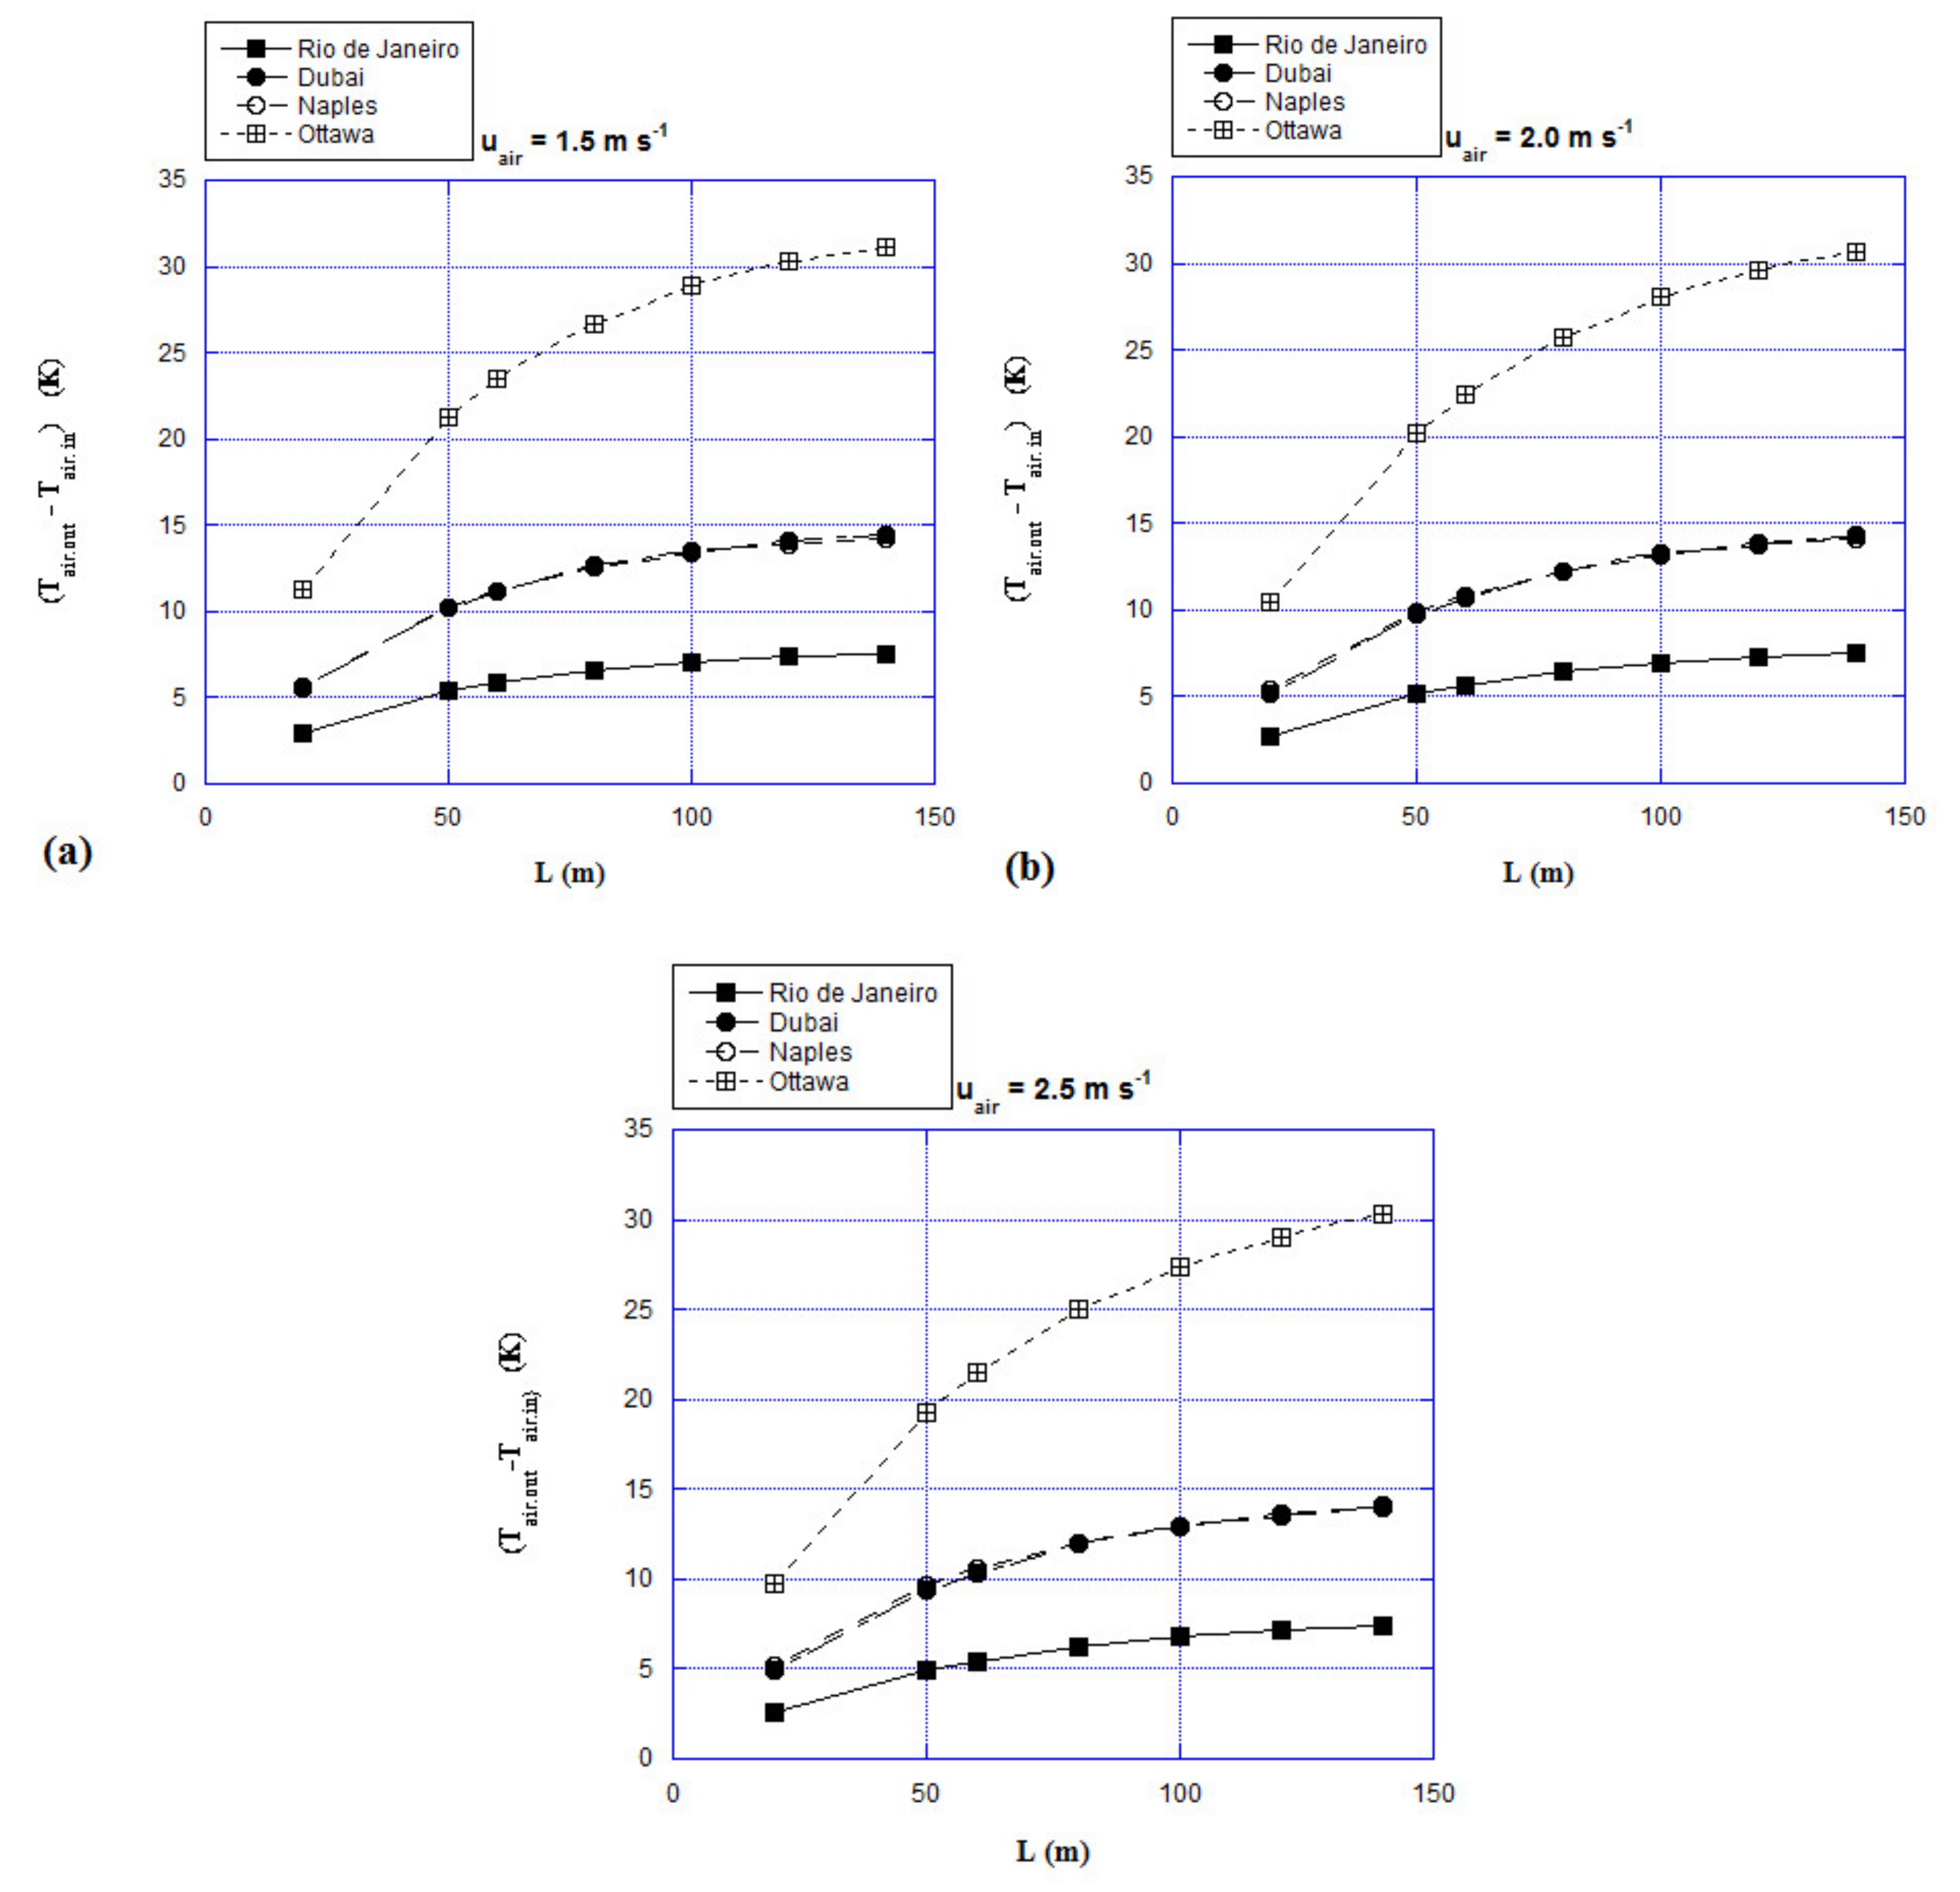
The inlet-outlet temperature spans of the air flowing in the GAHX as a function of the tube length for the four cities for each air flow velocity are reported in
Figure 8a–c in summer season and in
Figure 9a–c in winter season. From a quick comparison, one can appreciate a not very significant variability of the temperature span trends with air flow velocity if the comparison is done, for each city, at fixed length and season. This data found correspondence in literature in the review provided by Bordoloi e al. [
8]. Temperature span slightly increases with the decrease of the flow velocity (within ± 1 K). Indeed, all the three values of the air flow velocity ensure fully developed turbulent flow. A significant emerging data is the remarkable difference existing between the summer and winter temperature span in the city of Ottawa: specifically, with respect to the variation of the pipe length, ΔT belongs to 6 ÷ 16 K in summer and to 11 ÷ 32 K in winter. This is proper of the continental climate zone to which Ottawa belongs that it is characterized by the warm- humid summer, significant precipitations distributed in all seasons, and really cold winter. On the other side for the city of Naples, belonging to mild temperate climates with hot Mediterranean-summers and mild winters, the evaluated temperature spans oscillate among the same values both in summer and in winter (5 ÷ 14 K).
From
Figure 8, with reference to summer season, one can notice that:
the greatest values of temperature variation are those pertaining to Ottawa, with maximum values up to 16 K;
the lowest values are those pertaining to Rio (with maximum values lower than 8 K).
From
Figure 9, with reference to winter season, one can notice that:
the greatest values of temperature variations are those pertaining to Ottawa (with maximum values greater than 30 K);
the temperature variations that can be obtained in GAHX in Naples are similar to those that can be obtained in Dubai);
the lowest values are obtained in Rio de Janeiro (with maximum values lower than 8 K).
Since the plotted air temperature spans between GAHX inlet and outlet are, on equal length, quite comparable for the three different velocity values, we can suppose to work with 2.5 m s
−1 as air flow velocity in order to build the system with a minimized number of parallel pipes. As a matter of fact, as specified in
Table 1, with the specific of keeping constant at 1300 m
3 h
−1 the volumetric flow rate of the air supplied to the building, the number of parallel tubes must vary with the air flow velocity, and for 2.5 m s
−1 five parallel tubes are required. This solution ensures lower installation costs both in terms of materials and labor; moreover, a smaller number of pipes makes it possible to install the GAHX even for cases with a smaller surface area.
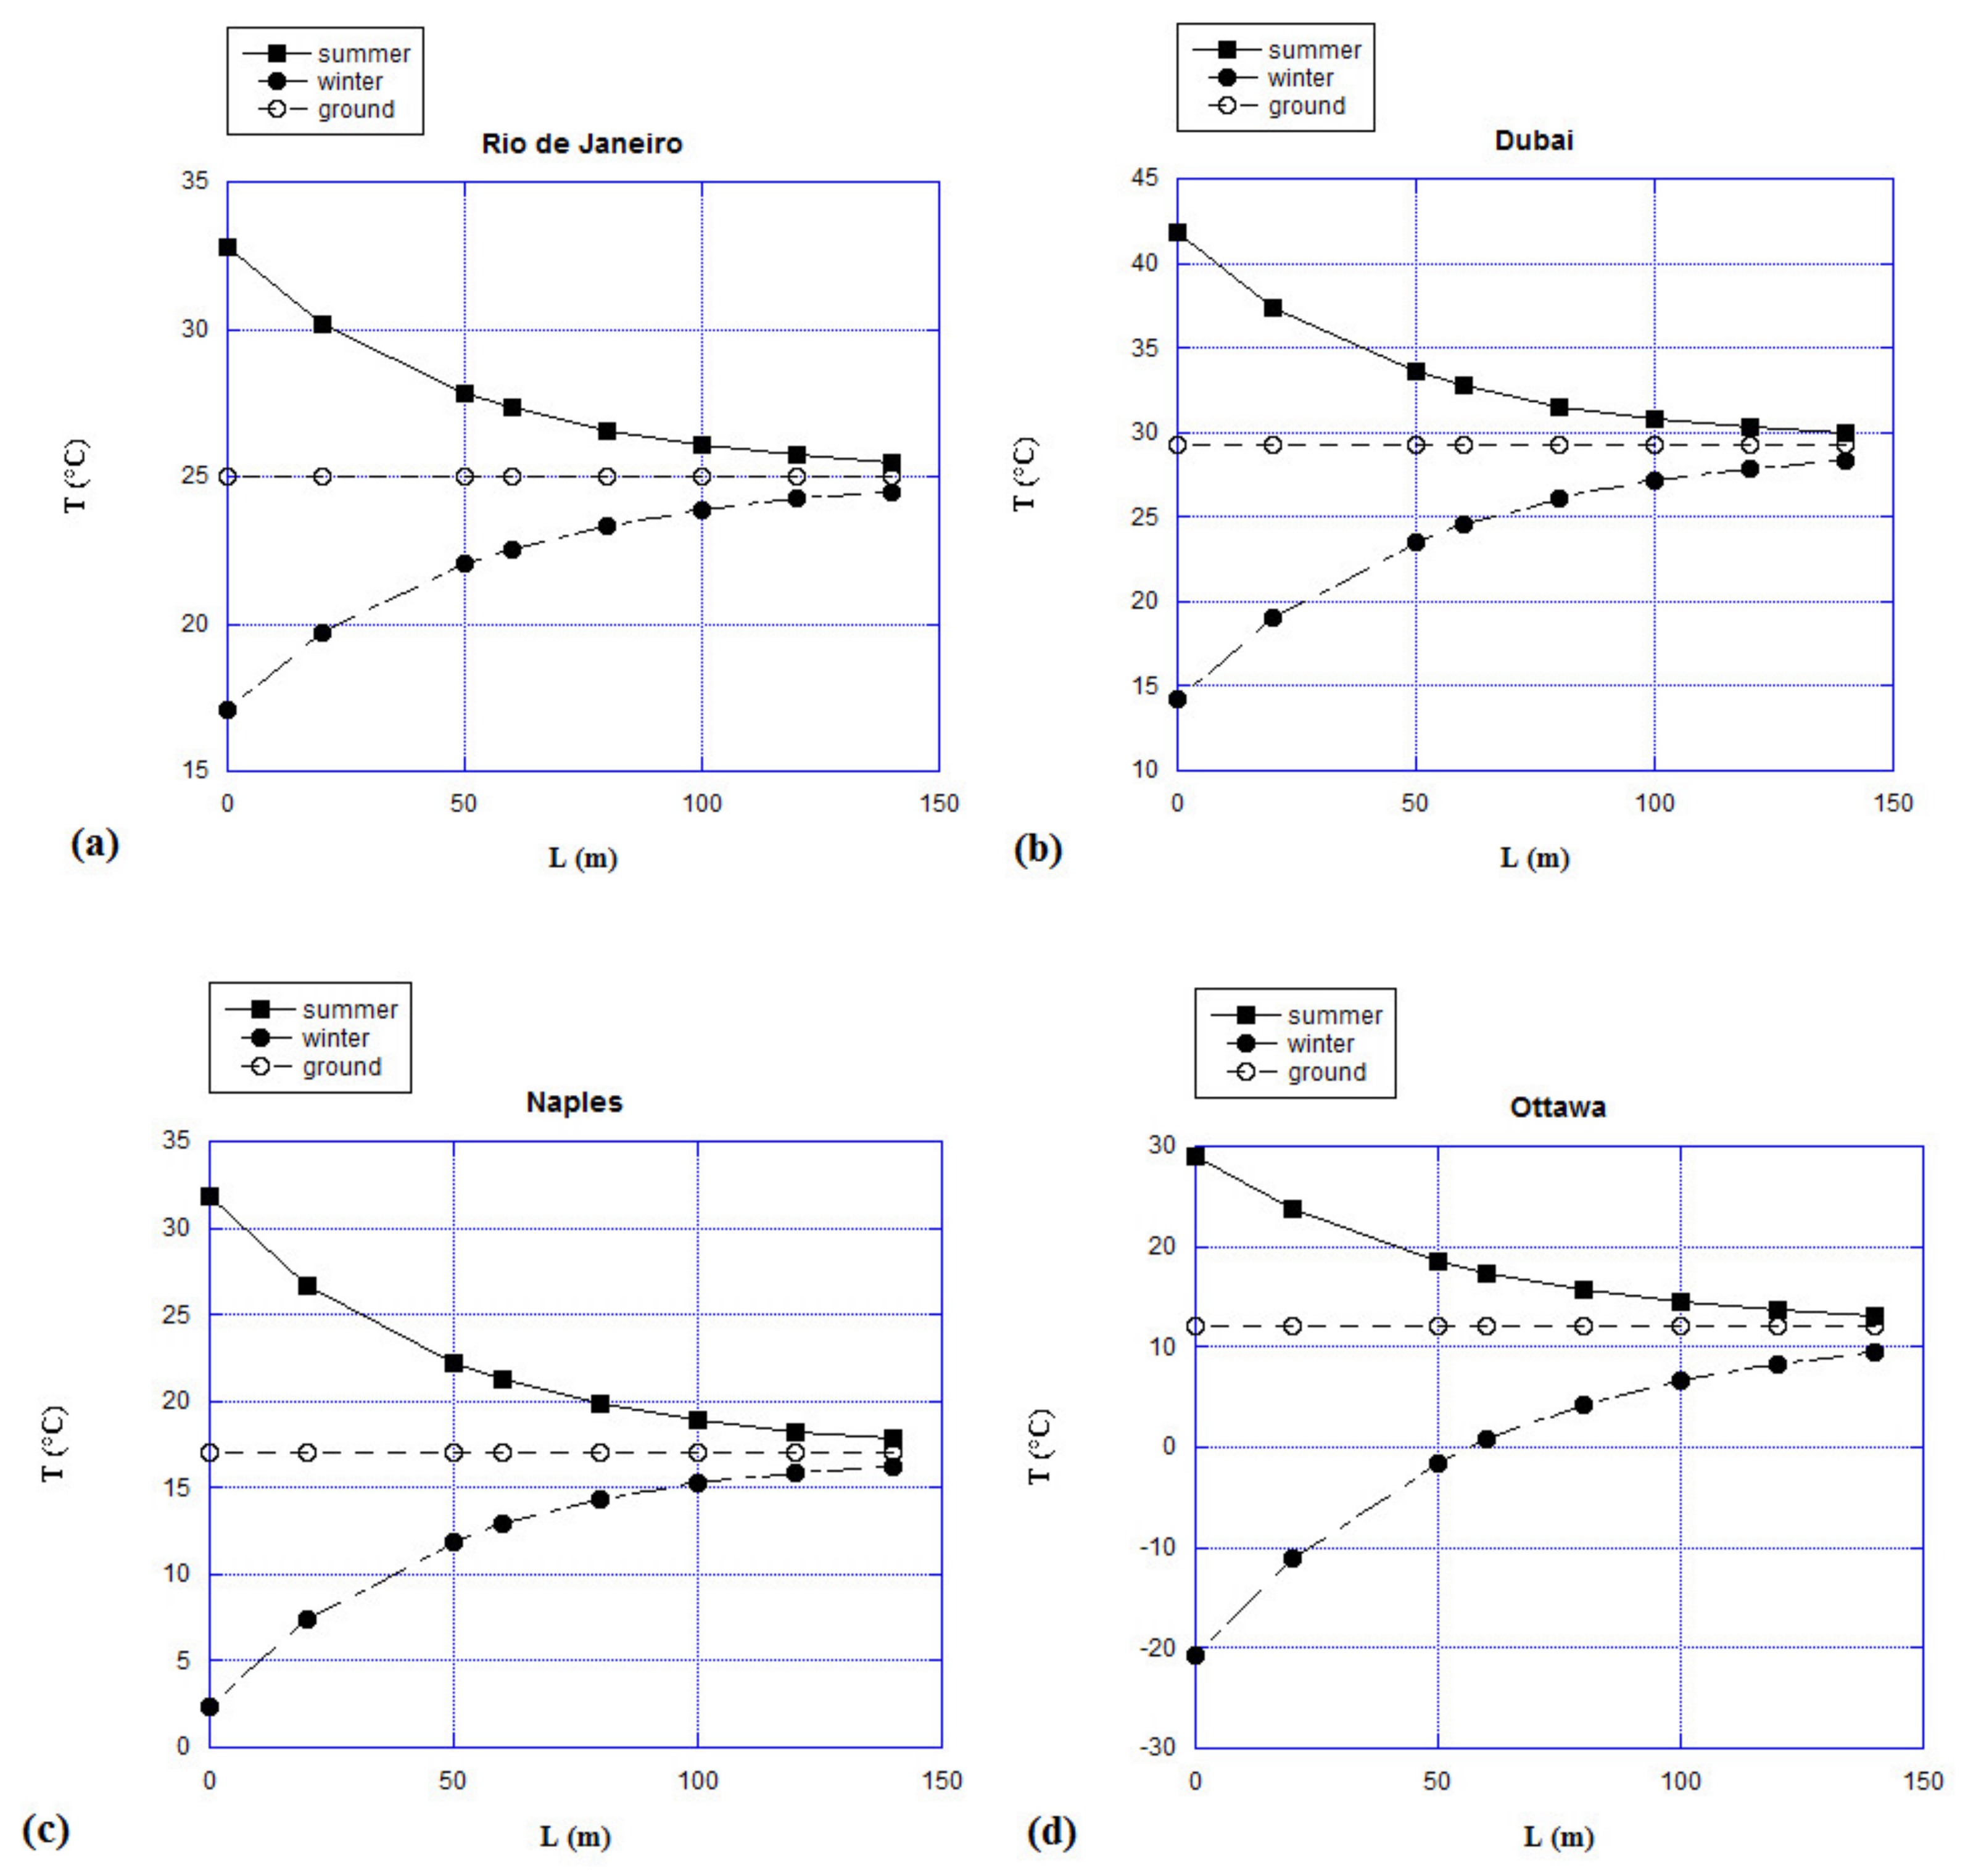
To exhaustively represent the temperature changes in the GAHX for the cities under investigation, belonging to very different climatic zones, in
Figure 10 is reported the air temperature at the outlet of the GAHX tubes flowing with 2.5 m s
−1, as a function of tube length in summer and winter for the four cities: (a) Rio de Janeiro; (b) Dubai; (c) Naples; (d) Ottawa. From the figure remarkable are the amplitudes of the temperature excursions between summer and winter for external air (visible at
L = 0 m), as well as the progressive convergence to the ground temperature, with respect to the pipe length, of the air flowing into the GAHX. To the cities with greater temperature excursions are associated larger temperature spans (as confirmed by
Figure 8 and
Figure 9).
The undisturbed soil temperature is about constant and close to the annual mean values of the external air. Therefore, the soil temperature in D or C zone is lower than that of A or B. The heat exchange between the soil and the air passing through the buried pipe is governed by the temperature difference between soil and air up to a great extent. Thermal performance of simple GAHX system significantly depends on the ground temperature of the place in which it is installed. The high value of the thermal diffusivity of the soil in Rio de Janeiro scarcely affects the heat transfer process. Indeed, a lower thermal diffusivity influences the air outlet temperature because of the heat accumulation and thermal saturation of the soil only, that happens during continuous running operation.
Figure 10 also clearly shows that, for each climatic zone, the heat exchange is very pronounced up to 100 m: for longer lengths, air temperature gradually approaches an asymptotic value. Therefore, a 100 m pipe length is a good compromise to enhance the GAHX thermal performances and minimize the costs. This data found correspondence with the investigations reviewed by Bordoloi et al. [
8].
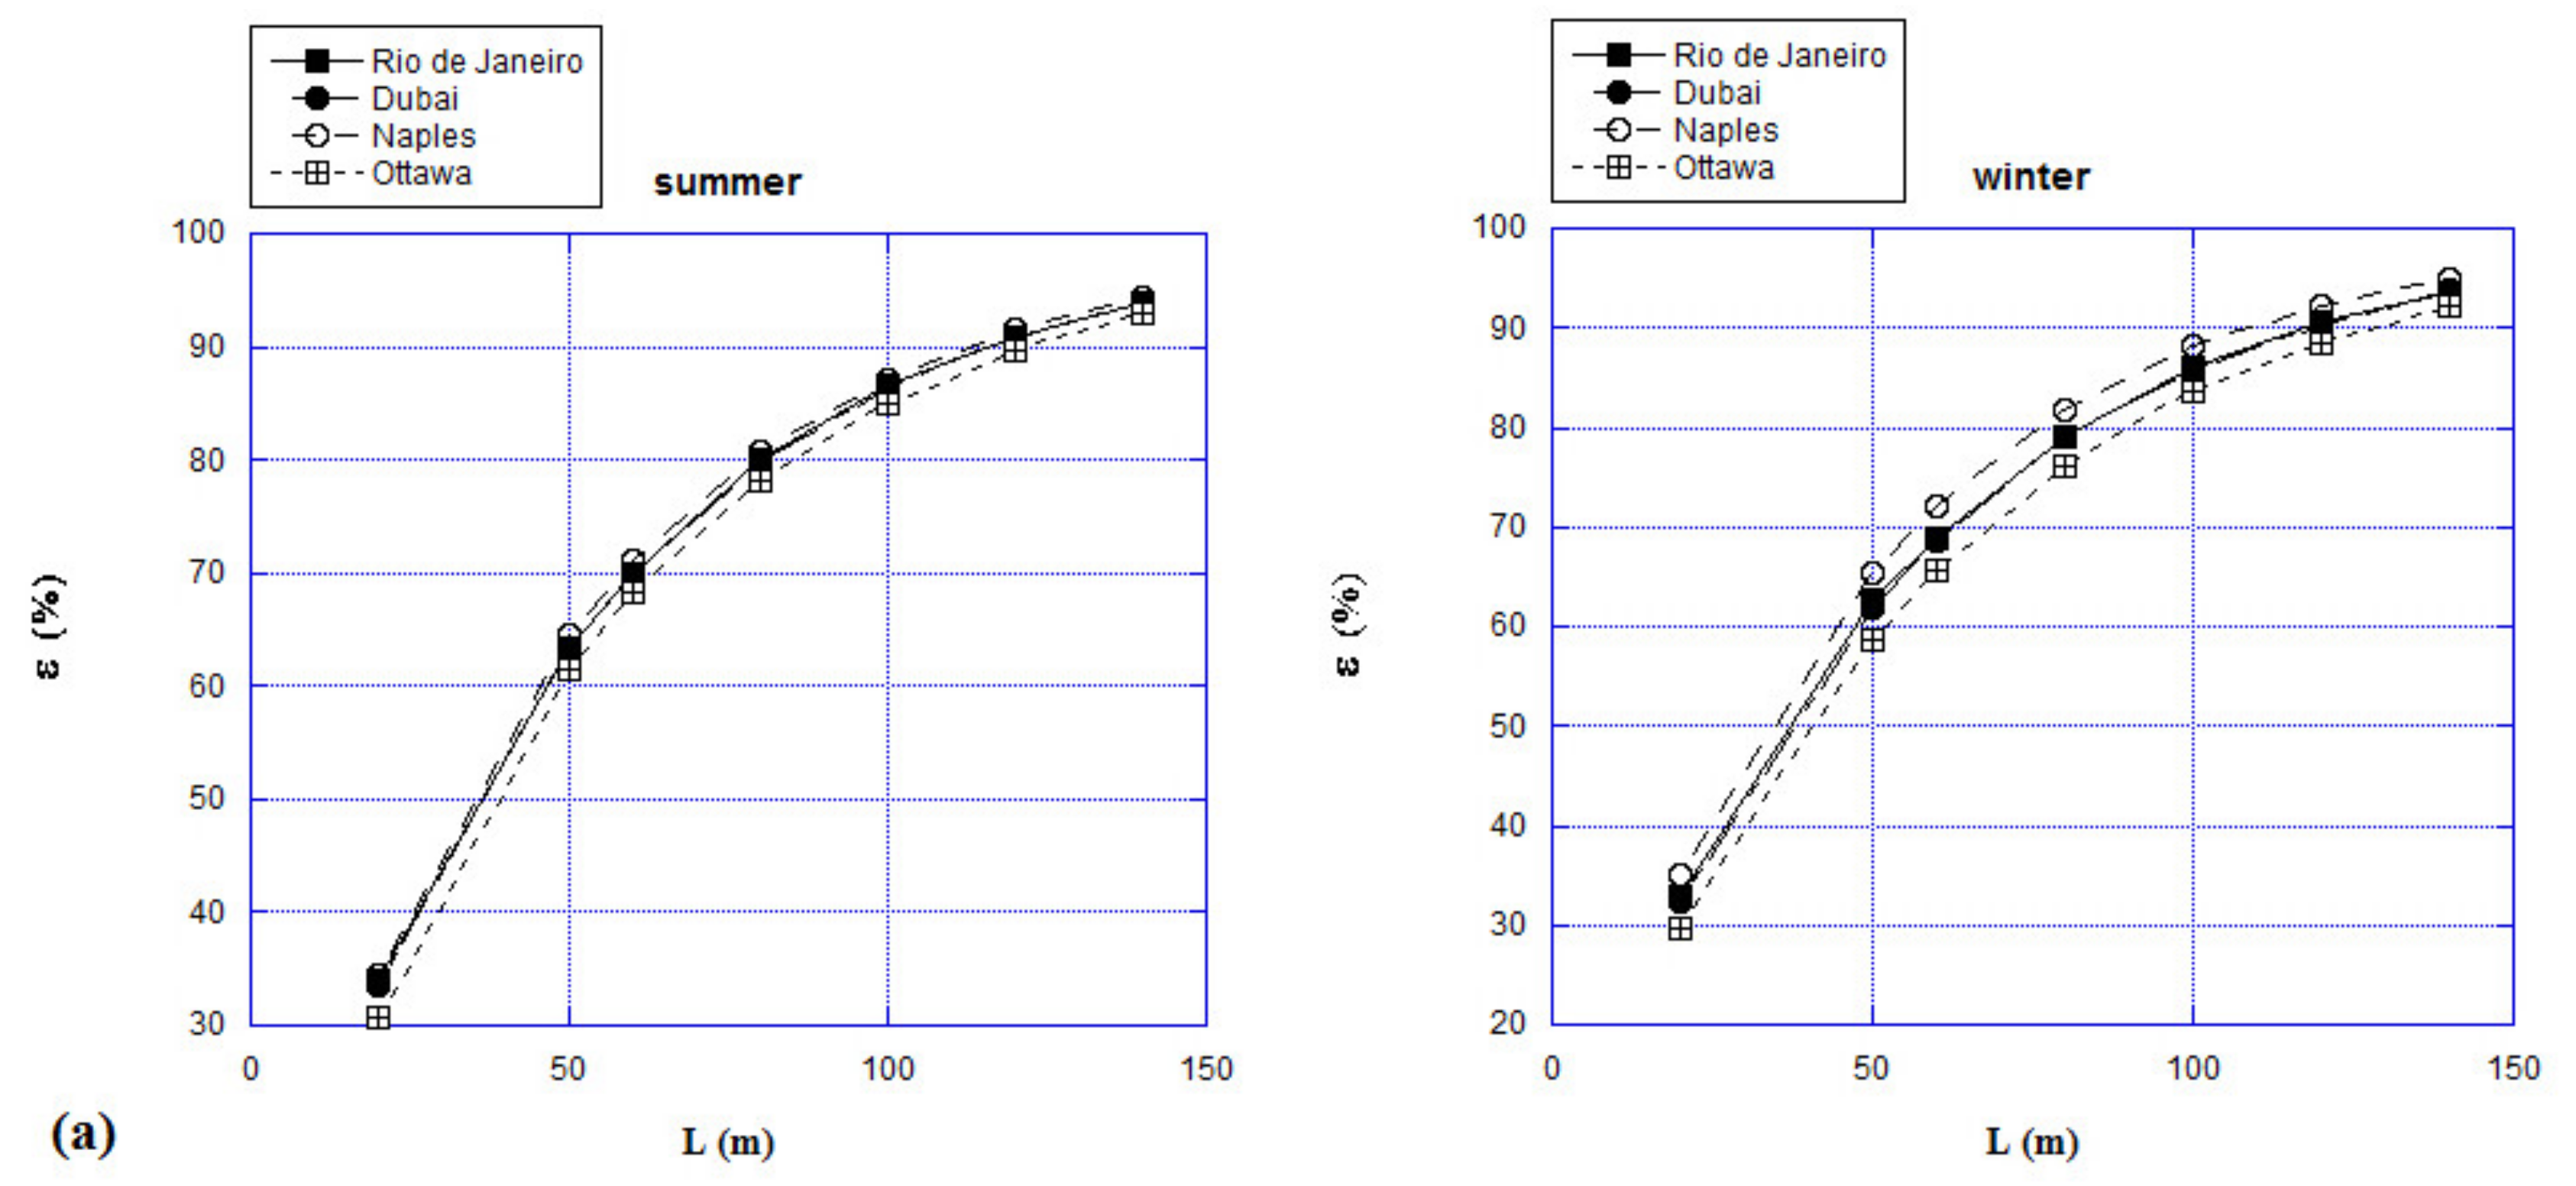
In
Figure 11a,b is reported the efficiency in summer and winter season respectively, of the GAHX as a function of the tube length for the four cities when the air flow velocity is 2.5 m s
−1. Form the figures, the relevant emerging data is the strong comparability of the efficiency values of the four cities, on equal length. Indeed, 100 m as length of each pipe also ensures the achievement of satisfactory efficiency values that settle around 86% for all four cities. This is an important result also when considering the comparison between an air-to-air heat exchanger and an ground-to-air heat exchanger. In fact, the efficiency of the first technology settles around a value of 70% or less [
18,
19,
35,
36].
In
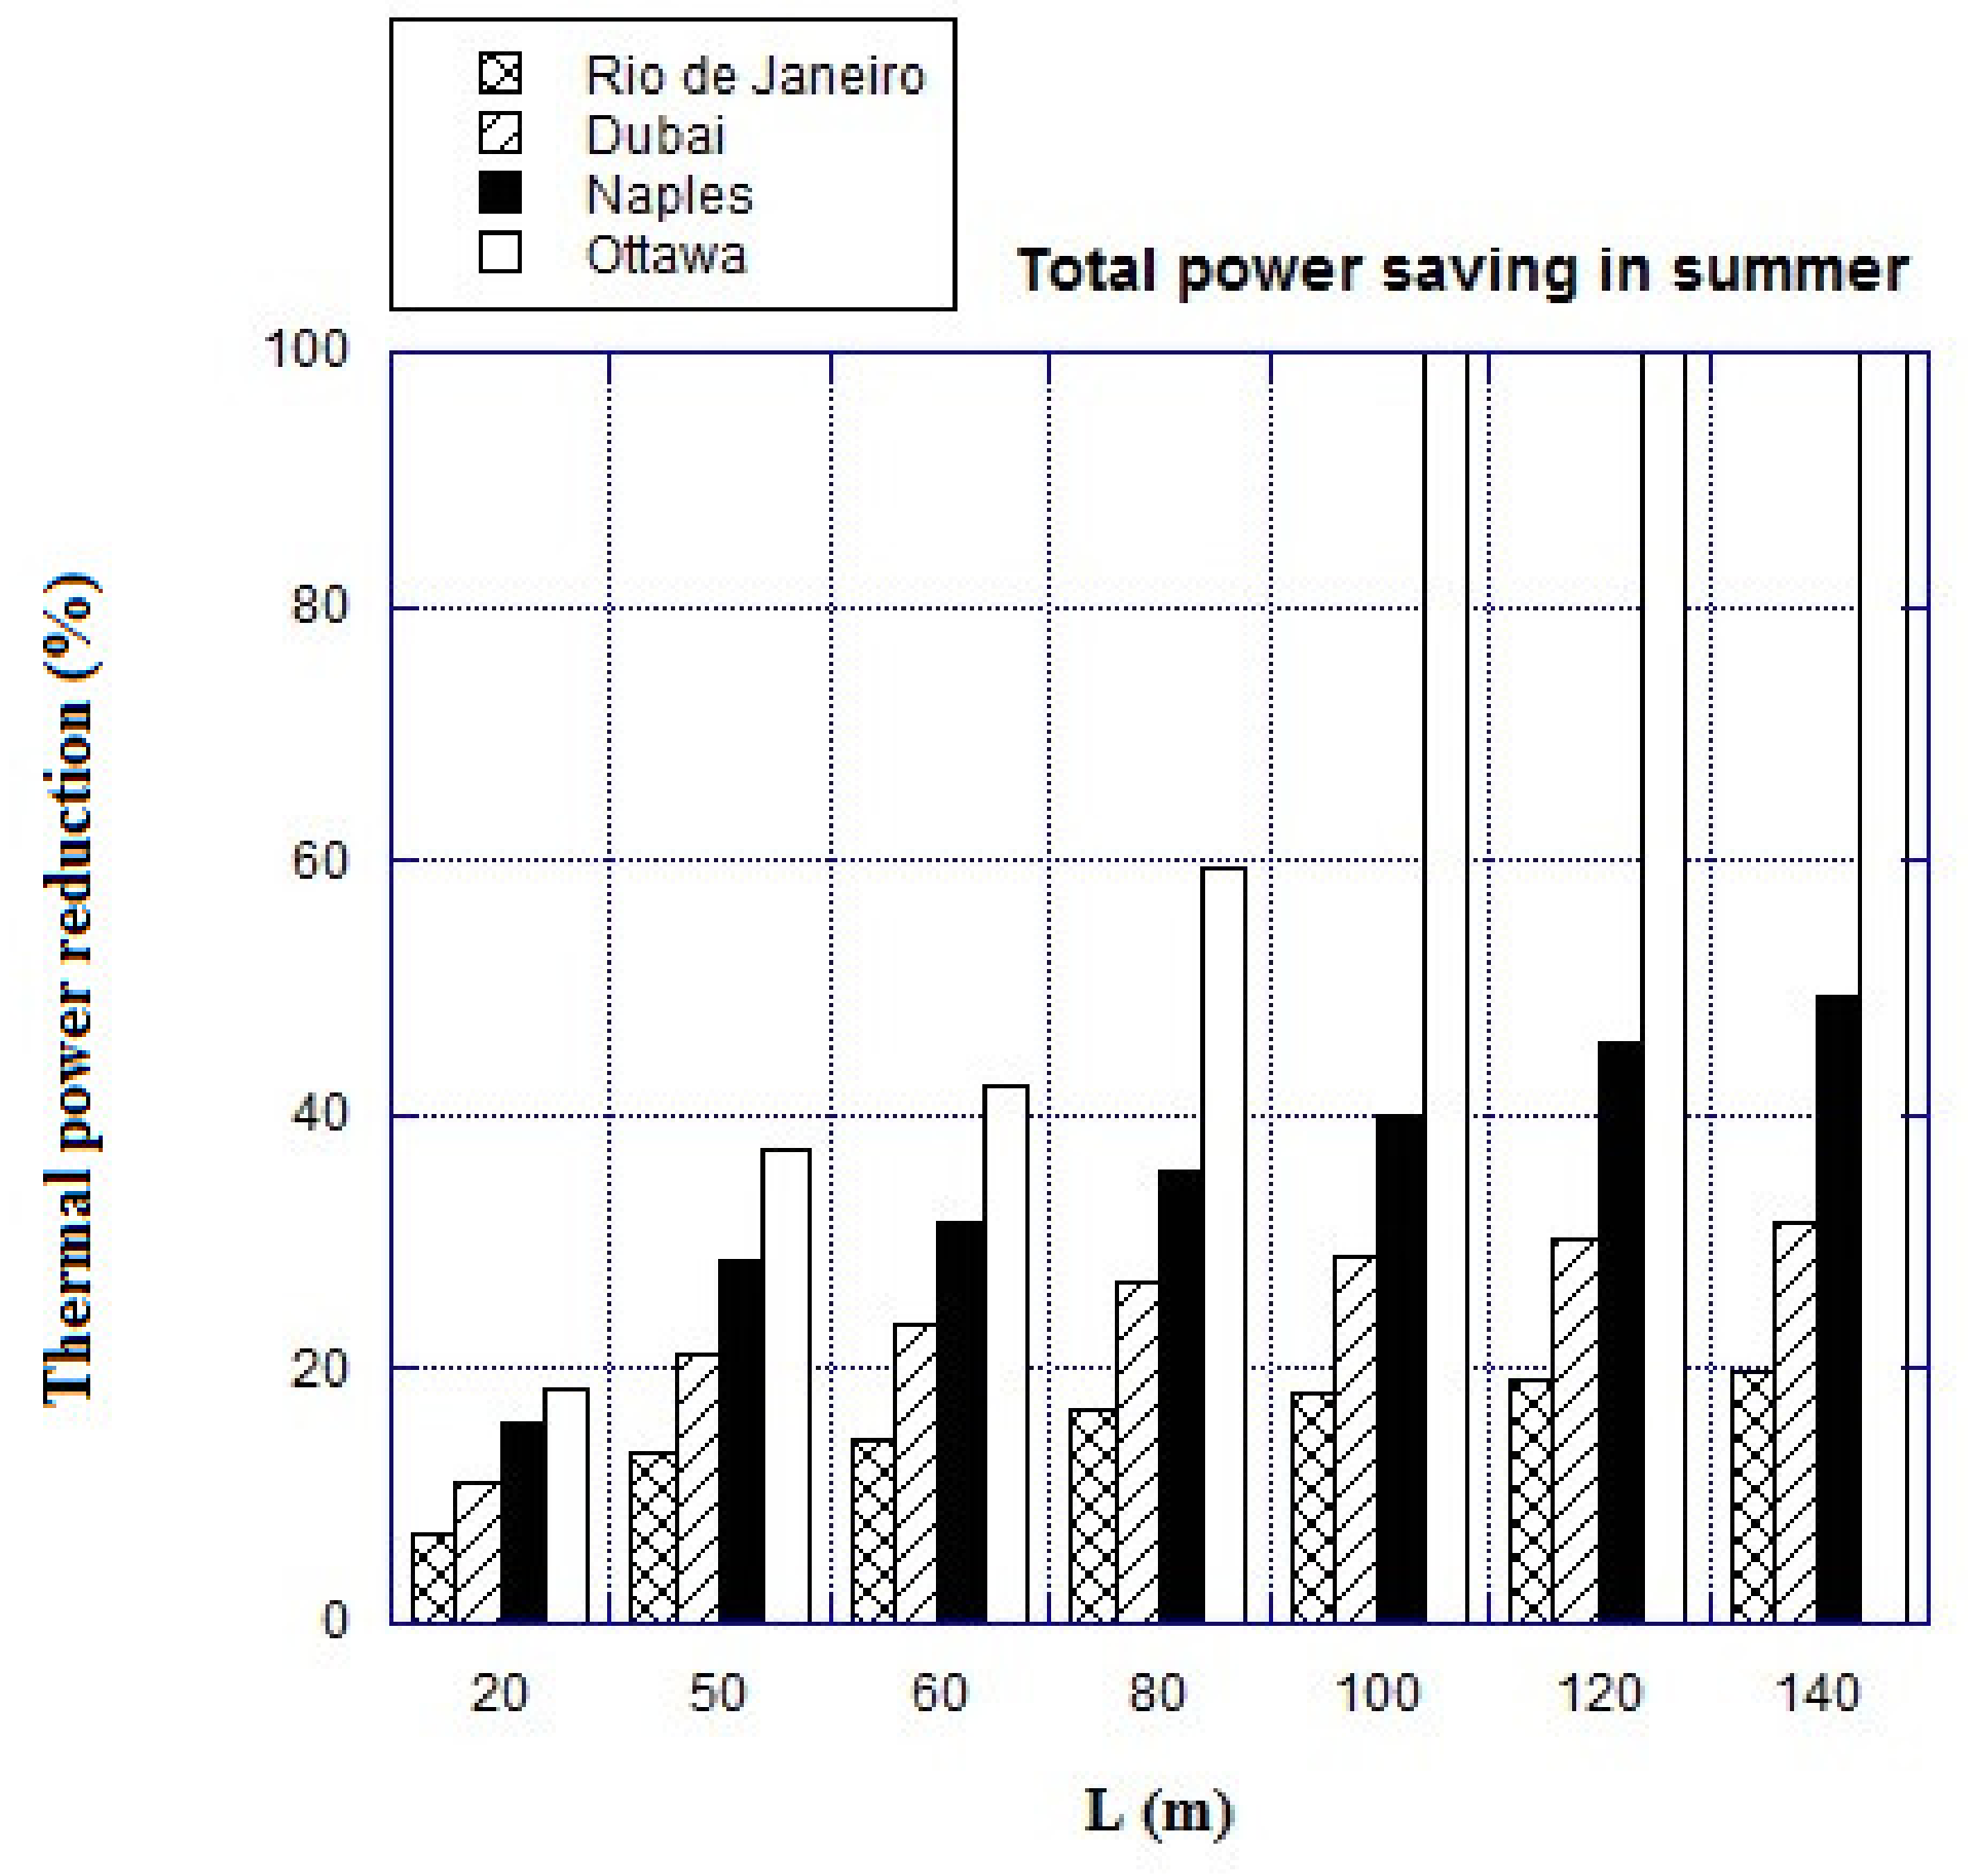
Figure 12,
Figure 13 and
Figure 14 the total thermal power reduction of the coils in the AHU during summer, winter and accounting both the seasons are, respectively, reported for the four cities by varying the length of the buried pipes of the GAHX and fixing the air flow velocity to 2.5 m s
−1.
From
Figure 12 one can notice that the highest power reductions were registered in Ottawa with a 100% value in summer for GAHX whose pipes length is 100 m. Worth of note about the data plotted in
Figure 12 (referred to summer conditions) are the following aspects:
in the city of Naples, for lengths from 100 m, the temperature of the air exiting the pipes is lower than the dew point temperature, equal to 19.4 °C; therefore, the air is dehumidified and the outlet specific humidity ω decreases up to [13.75, 13.19; 12.86] g kg−1 respectively for [100; 120; 140] m pipe lengths. Clearly, to guarantee the thermo–hygrometric comfort the air flow exiting the GAHX undergoes a further process of cooling and dehumidification, by means of the cooling coil component of the AHU, up to 8.95 g kg−1. The corresponding mass flow rate of the condensed water at the outlet of GAHX is [0.15; 0.40; 0.55] g s−1, respectively for [100; 120; 140] m pipe lengths;
in the city of Ottawa, for lengths from 60 m, the temperature of the air exiting the pipes is lower than the dew point temperature, equal to 17.6 °C; therefore, the air is dehumidified and the outlet specific humidity ω decreases up to [12.49, 11.19; 10.37; 9.85; 9.49] g kg−1 respectively for [60; 80; 100; 120; 140] m pipe length. The corresponding mass flow rate of the condensed water at the outlet of GAHX is [0.06; 0.63; 0.99; 1.23; 1.38] g s−1 respectively for [60; 80; 100; 120; 140] m pipe lengths. In this city for a tube length greater than 100 m the GAHX is able to produce air at comfortable temperature and specific humidity and therefore there is no need of further cooling and dehumidification in the AHU. Therefore, the simple GAHX system works in stand–alone mode during summer, with a power reduction in summer season of 100% if the length of the tubes is equal or greater than 100 m.
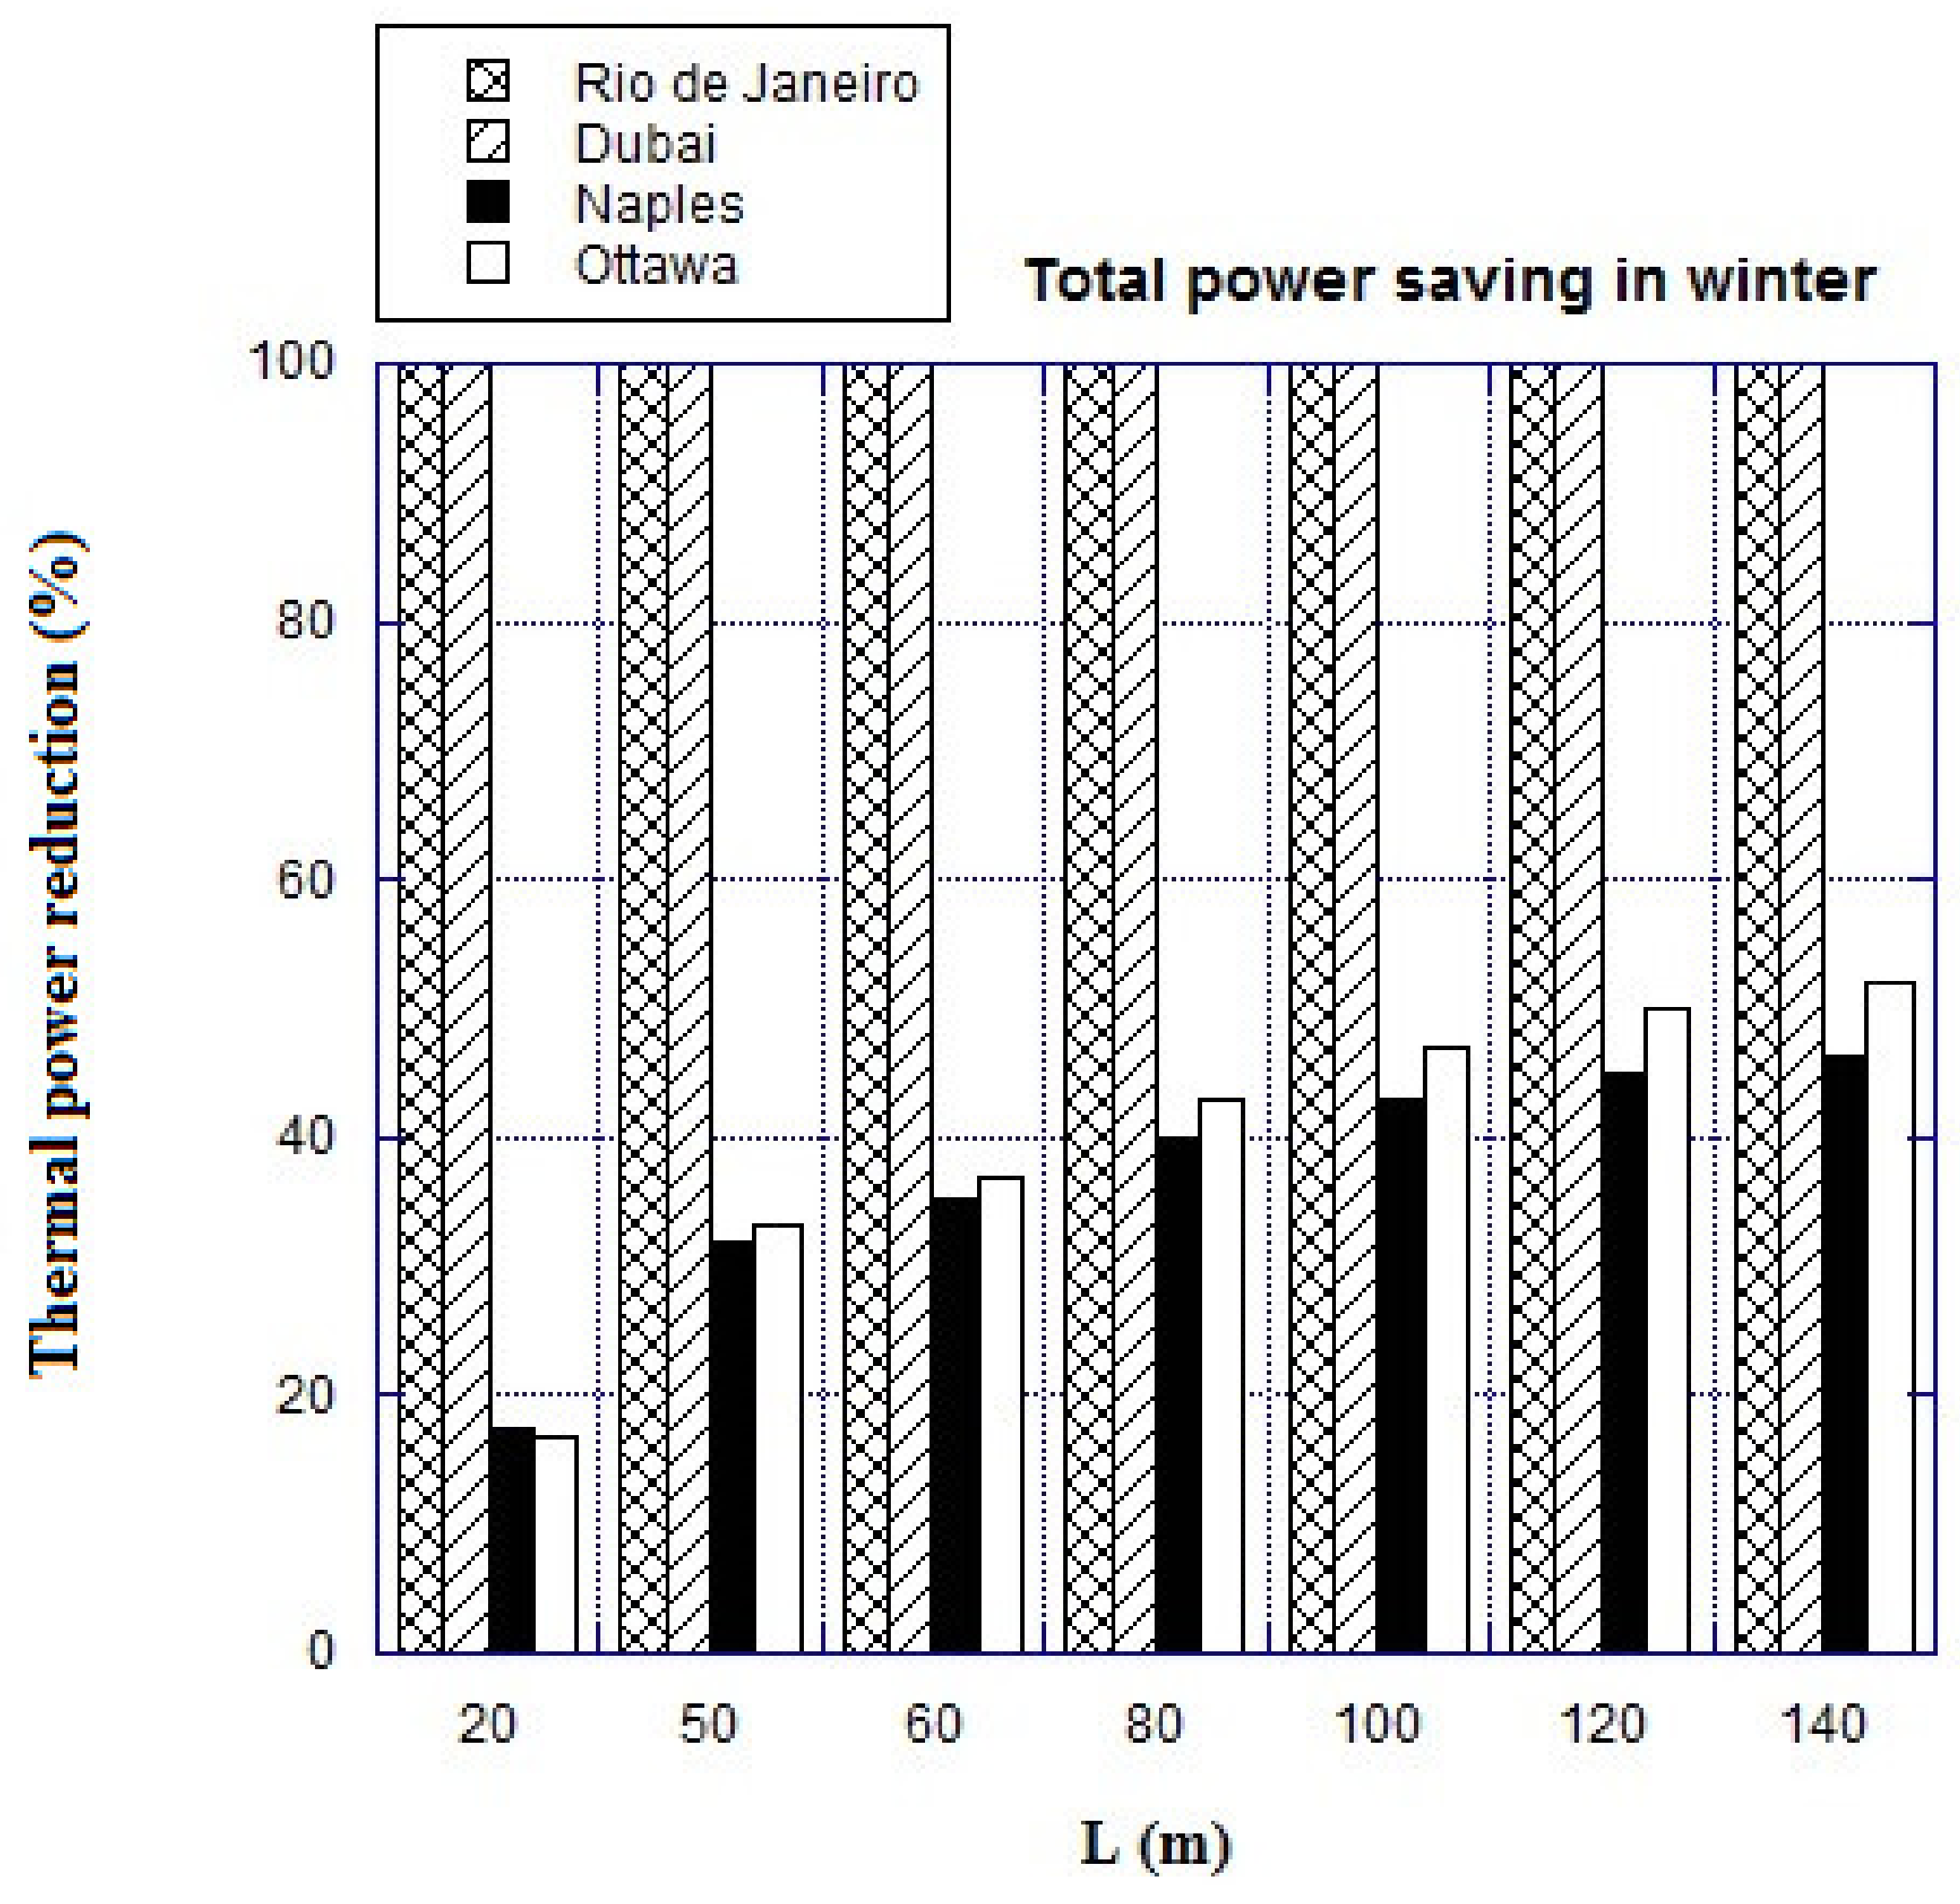
Figure 13 reveals a number of remarkable aspects about the total power percentage reduction calculated for the winter season:
in the city of Rio de Janeiro, as reported in
Figure 10a the temperature of the air flow exiting the GAHX from 20 m is greater than 20 °C, the minimum value required to guarantee the indoor thermo–hygrometric comfort. Moreover, the coupled values of specific humidity at the GAHX outlet is 9.18 g kg
−1, that is very close to the desired comfort point. Indeed, the employment of GAHX system allows to not operate with the air conditioning system in winter mode, since the air exiting the GAHX could be directly entered in the building, only after a filtering operation to prevent the spread of viruses. Consequently, the total power reduction in AHU operating in heating mode is 100%;
also in the city of Dubai, as reported in
Figure 10b the temperature of the air flow exiting the GAHX from 20 m is greater than 20 °C, the minimum value required to guarantee the indoor thermo–hygrometric comfort. Additionally, the coupled values of specific humidity at the GAHX outlet is 4.37 g kg
−1, that could be considered close to an acceptable comfort point. Indeed, the employment of GAHX system allows to not operate with the pre– and post– heating coils of the air conditioning system in winter mode. Indeed, as it happens for the case of Rio de Janeiro, the air exiting the GAHX could be directly entered in the building (always after a filtering operation to prevent the spread of viruses), where it could be anyhow locally adiabatically humidified, not affecting the power reduction resulting from not using the heating coils. Consequently, also in Dubai the total power reduction in AHU operating in heating mode is 100%.
in the city of Naples the total power reduction in winter goes from 17.5% up to 46% respectively for 20 m and 140 m. The power reduction registered in Ottawa touches a maximum of 52% at 140 m. The power reduction values registered for these two cities are satisfying and usually higher than what would be obtained with an air–to–air heat exchanger (around 11%, according to [
19]).
From
Figure 14, that reports the overall power reduction calculated considering both the summer and winter operation mode, one can conclude that the employment of an ground-to-air system is convenient for all the cities. Specifically, the remarkable emerging data is that for smaller pipe lengths (lower than 80 m) the maximum total energy reduction are registered in Dubai, whereas longer tubes are required in Ottawa to become the city, among the four investigated, where the total power reductions are the greatest. For a tube length greater than 100 m, Napoli and Dubai show similar results. The lower values of power reduction are those pertaining to Rio de Janeiro.
It is important to underline how these thermal power reductions are directly related to economic savings. Particularly for some of the analyzed cities, when using the GAHX in heating or cooling mode the cost of the system would be decidedly reduced compared to a HVAC system with an usual AHU without the ground tube. However, further research activity will assess the actual technical-economic convenience, through the Discounted Payback Period index.
4. Conclusions
This paper reports the energy performances carried out by an investigation conducted on a HVAC system, composed by an air handling unit for the primary air coupled with a horizontal-pipes GAHX and fan-coil units, for an office building, supposed to be placed in four cities (Rio de Janeiro, Dubai, Naples, Ottawa) belonging to four different worldwide climatic areas according to the Köppen climate classification. The investigation is performed by means of a two-dimensional numerical model of an ground-to-air heat exchanger constituted by a variable number of circular horizontal buried pipes (for air flowing) installed at 2.5 m deep. The model has been experimentally validated with literature data [
28] and a good agreement between numerical and experimental results was verified.
The results introduced in this paper are carried out by the simulations on the GAHX, performed by varying the length of the pipes and the air velocities; thus, also the number of tubes forming the GAHX is varied since the volumetric airflow rate to be provided to the AHU must be kept constant.
Once the outlet temperatures of the air at the exit of the buried tubes have been assessed, the GAHX is thermodynamically connected with the AHU, i.e. the external air pre-heated or pre-cooled by the geothermal heat exchanger is not directly introduced into the building but it is sent to the AHU. Subsequently the energy performances of the above-mentioned HVAC system are analyzed, both in summer and in winter operation modes. From the investigation the following conclusions could be drawn:
the air flow velocity is a parameter that does not confer significant variability of the GAHX temperature span trends, if the comparison is done, for each city, at fixed length and season;
for each climatic zone, the heat exchange is very pronounced up to 100 m: for longer lengths, air temperature gradually approaches an asymptotic value. Therefore, a 100 m pipe length is a good compromise to enhance the GAHX thermal performances and minimize the costs;
there is a strong comparability of the GAHX efficiency values for the four cities, on equal length, both in winter and in summer operation modes. Indeed, 100 m as length of each pipe also ensures the achievement of satisfactory efficiency values that settle around 86% for all four cities;
the introduction of the GAHX allows to not utilize the pre and re heating coils during winter in Rio de Janeiro and Dubai (with a reduction of 100% on the heating power);
the introduction of GAHX allows to not utilize cooling coils during summer in Ottawa, if the tube length is equal or greater than 100 m, (with a reduction of 100% on cooling power of the HVAC system);
the best value of thermal power reduction (61.5%) for a 100 m pipe-length ground-to-air heat exchanger is obtained in Ottawa, a city belonging to continental climate zone (D Zone);
the worst results in terms of thermal power reduction are registered in Rio de Janeiro, a city belonging to the tropical or equatorial climates (A Zone), that for a 100 m pipe-length ground-to-air heat exchanger is 23.9%.
These results lead to say that this system (GAHX for the geothermal pre-treatment of the air to be introduced into the AHU), is energetically very convenient; it is competitive if compared to the usual solution based on the air-to-air heat exchanger (which is also less suitable for the spread of coronavirus and similar viruses). Furthermore, authors are aware that the results presented in this paper constitute only one of the points of investigations of a much wider global analysis. Indeed, future works will deepen: (i) the analysis of the performance of the system in dynamic conditions, using daily climatic data; (ii) the investigation on the economic convenience of the GAHX employment for the different analyzed climatic conditions; (iii) an analysis of the system optimization considering both thermal-energetic performances and an economic analysis.

 ,
, 


