Article

Hydrothermal Carbonization as a Strategy for Sewage Sludge Management: Influence of Process Withdrawal Point on Hydrochar Properties

1
Department of Civil, Environmental and Mechanical Engineering, University of Trento, via Mesiano 77, 38123 Trento, Italy
2
Department of Biological and Environmental Engineering, Cornell University, 226 Riley-Robb Hall, Ithaca, NY 14853, USA
3
Faculty of Science and Technology, Free University of Bolzano, Piazza Università 5, 39100 Bolzano, Italy
4
Faculty of Engineering and Architecture, University of Enna Kore, Cittadella Universitaria, 94100 Enna, Italy
*
Author to whom correspondence should be addressed.
Energies 2020, 13(11), 2890; https://doi.org/10.3390/en13112890
Submission received: 29 April 2020 / Revised: 23 May 2020 / Accepted: 1 June 2020 / Published: 5 June 2020
(This article belongs to the Special Issue Hydrothermal Carbonization)

Abstract

:
Conventional activated sludge systems, still widely used to treat wastewater, produce large amounts of solid waste that is commonly landfilled or incinerated. This study addresses the potential use of Hydrothermal Carbonization (HTC) to valorize sewage sludge residues examining the properties of hydrochars depending on HTC process conditions and sewage sludge withdrawal point. With increasing HTC severity (process residence time and temperature), solid yield, total Chemical Oxygen Demand (COD) and solid pH decrease while ash content increases. Hydrochars produced from primary (thickened) and secondary (digested and dewatered) sludge show peculiar distinct properties. Hydrochars produced from thickened sludge show good fuel properties in terms of Higher Heating Value (HHV) and reduced ash content. However, relatively high volatile matter and O:C and H:C ratios result in thermal reactivity significantly higher than typical coals. Both series of carbonized secondary sludges show neutral pH, low COD, enhanced phosphorous content and low heavy metals concentration: as a whole, they show properties compatible with their use as soil amendments.

Graphical Abstract

1. Introduction

In 1991, the European Union (EU) Directive 91/271/EEC set new benchmarks for the collection, treatment and monitoring of wastewater in urban areas [1]. In 2000, the EU produced over 10 million dry tons of sewage sludge (latest available official EU data [2]). Since then, production has steadily increased, increasing burdens on municipal wastewater treatment systems [3]. In 2017, the global sewage sludge production reached approximately 45 million of dry tons per year [4]. In Italy alone, over 1100 kilotons of dry sludge matter were produced in 2010, with almost 40% going to landfills and less than 30% used in agricultural applications [2]. In 2016, the European Commission reported that the 1991 directive was successful in terms of current improvements seen in EU water quality despite an increasing population growth. However, the European Commission also underlined the need to develop “innovative solutions to increase resource efficiency, such as solutions for energy recovery, nutrient recovery, and processing to marketable products and water re-use” [5]. Beyond the EU, global urbanization and the growth of the middle class, combined with stricter environmental regulations, have forced municipalities to re-examine their sludge management practices—transitioning away from traditional disposal via incineration, landfilling, or discharge to oceans/waterways—to favor beneficial reuse [6,7].
Sludge is a complex, heterogeneous mixture comprised of organic compounds such as proteins, peptides, polysaccharides, phenols, aliphatic, aromatic and furan compounds, as well as inorganic materials such as nutrients (phosphorous, potassium, nitrogen), silica, and heavy metals [8] and pathogens and other microbiological pollutants [9]. In a typical wastewater treatment process, primary sludge is characterized as the sludge following mechanical processing (screening, grit removal, sedimentation) containing between 93 and 99.5 wt% water, with a high content of suspended and dissolved organics. Secondary sludge (also known as Waste Activated Sludge, WAS) follows from biological treatment and contains a high amount of microbial cells with a total solids concentration ranging between 0.8 and 1.2 wt% depending on the type of process used [10].
Anaerobic Digestion (AD) is the most widely used sludge management technique. AD converts the organic solids to biogas (predominantly CH4 and CO2) via hydrolysis, acidogenesis, acetogenesis, and methanogenesis [11,12]. Despite its popularity, a considerable amount of solid remains after AD; as little as 20–30 wt% of the total organic matter is mineralized [9]. While these solids were once thought to be environmentally benign, their use into the soil may well be a potentially large source of greenhouse gas emissions and point pollutant sources for mercury, lead, cadmium, and copper on arable land, contributing to environmental acidification [13] and posing a toxicological risk in terms of pathogens present [9]. The microbiological processes occurring on land-applied sludge (mainly anaerobic decomposition, nitrification, and denitrification) lead to considerable emissions of methane and nitrous oxide, as well as ammonia and nitrate. While land application of sludge offsets the use of industrial nitrogen-containing fertilizers and represents a considerable net reduction of N2O, NH3, and NO3 emissions, CH4 emissions are still estimated to be 6.3 kgton−1 of applied sludge [13]. As such, direct land application of secondary sludge may not be the optimal nutrient recovery pathway and may well represent a waste of a renewable energy source.
Hydrothermal Carbonization (HTC) is a process to concentrate the carbon in a given biomass, occurring in water at elevated temperatures in the range of 160–280 °C [14], above saturated vapor pressure, where water’s dielectric constant decreases so drastically that it catalyzes the carbonization of biomass while acting as an organic solvent [15,16]. HTC proceeds via a series of mechanisms, including hydrolysis, dehydration, decarboxylation, decarbonylation, and demethanation. HTC is performed in 80–95 vol% water [17,18,19,20], making it an ideal processing pathway for wet biomasses [21,22] such as sewage sludge. As well recognized in the literature, HTC not only leads to reduced volume and energy densification of the solid residue, considerably improving its dewaterability [23,24], but also significantly increases its solid fuel properties while stabilizing and disinfecting the sludge [25,26]. Interestingly, HTC of sludge enhances NO + NH3 reactions during solid combustion, significantly reducing NOx emissions across combustion modes [27].
While multiple studies focused on nutrients recovery such as phosphorous [28,29,30] or probed the impact of processing conditions on the solid and energy yields of hydrochars produced from the HTC of sludge from one withdrawal point in the wastewater treatment (WWT) process [23,31,32,33,34,35,36,37,38,39], the impact of upstream WWT processes on hydrochars is often not part of the experimental design. Thus, a primary goal of the present work was to determine the most viable point in the WWT process to employ HTC for sludge treatment from a solid fuel production and potential nutrient recovery standpoint. There are two sets of variables of interest in the present work: (1) feedstock withdrawal point from the WWT process; (2) hydrothermal reaction conditions on the composition and oxidation properties of resulting hydrochars. While some research has been done to quantify the environmental and economic benefits of using HTC to treat sewage sludge, understanding the impact of both feedstock and processing conditions on resulting hydrochars is critical to enable better optimization of this waste-to-energy conversion pathway [40].

2. Materials and Methods

Three kinds of samples were collected at different process points from the municipal Wastewater Treatment Plant (WWTP) of Trento, Italy, which uses a Conventional Activated Sludge (CAS) and Membrane BioReactor (MBR) system (more information about CAS/MBR systems in recent prior works in the field: [41,42]). The primary sludge extracted from the primary settler is sent to a static thickener and mixed with secondary sludge coming from the MBR system (Pipe 1 of Figure 1). The thickened sludge exiting the static thickener (Pipe 3) is the first sample taken for the present work. The secondary sludge coming from the CAS system is sent to a dynamic thickener (Pipe 2). After thickening, both streams are sent to the anaerobic digester. Anaerobic digestion lasts 21 days at 33 °C, after which the digested sludge (Pipe 4) is sent to a dewatering system. The effluent from Pipe 4 is the second sample taken for this work. To the digested sludge from Pipe 4 polyelectrolyte is added; this stream is sent to the dewatering system (centrifuge) where it reaches about 25 wt% solids content to enable solid handling. This dewatered sludge after the centrifuge (Pipe 5) is the third sample used in this work. Each of the three samples taken was characterized and stored in a fridge at 4 °C until use.

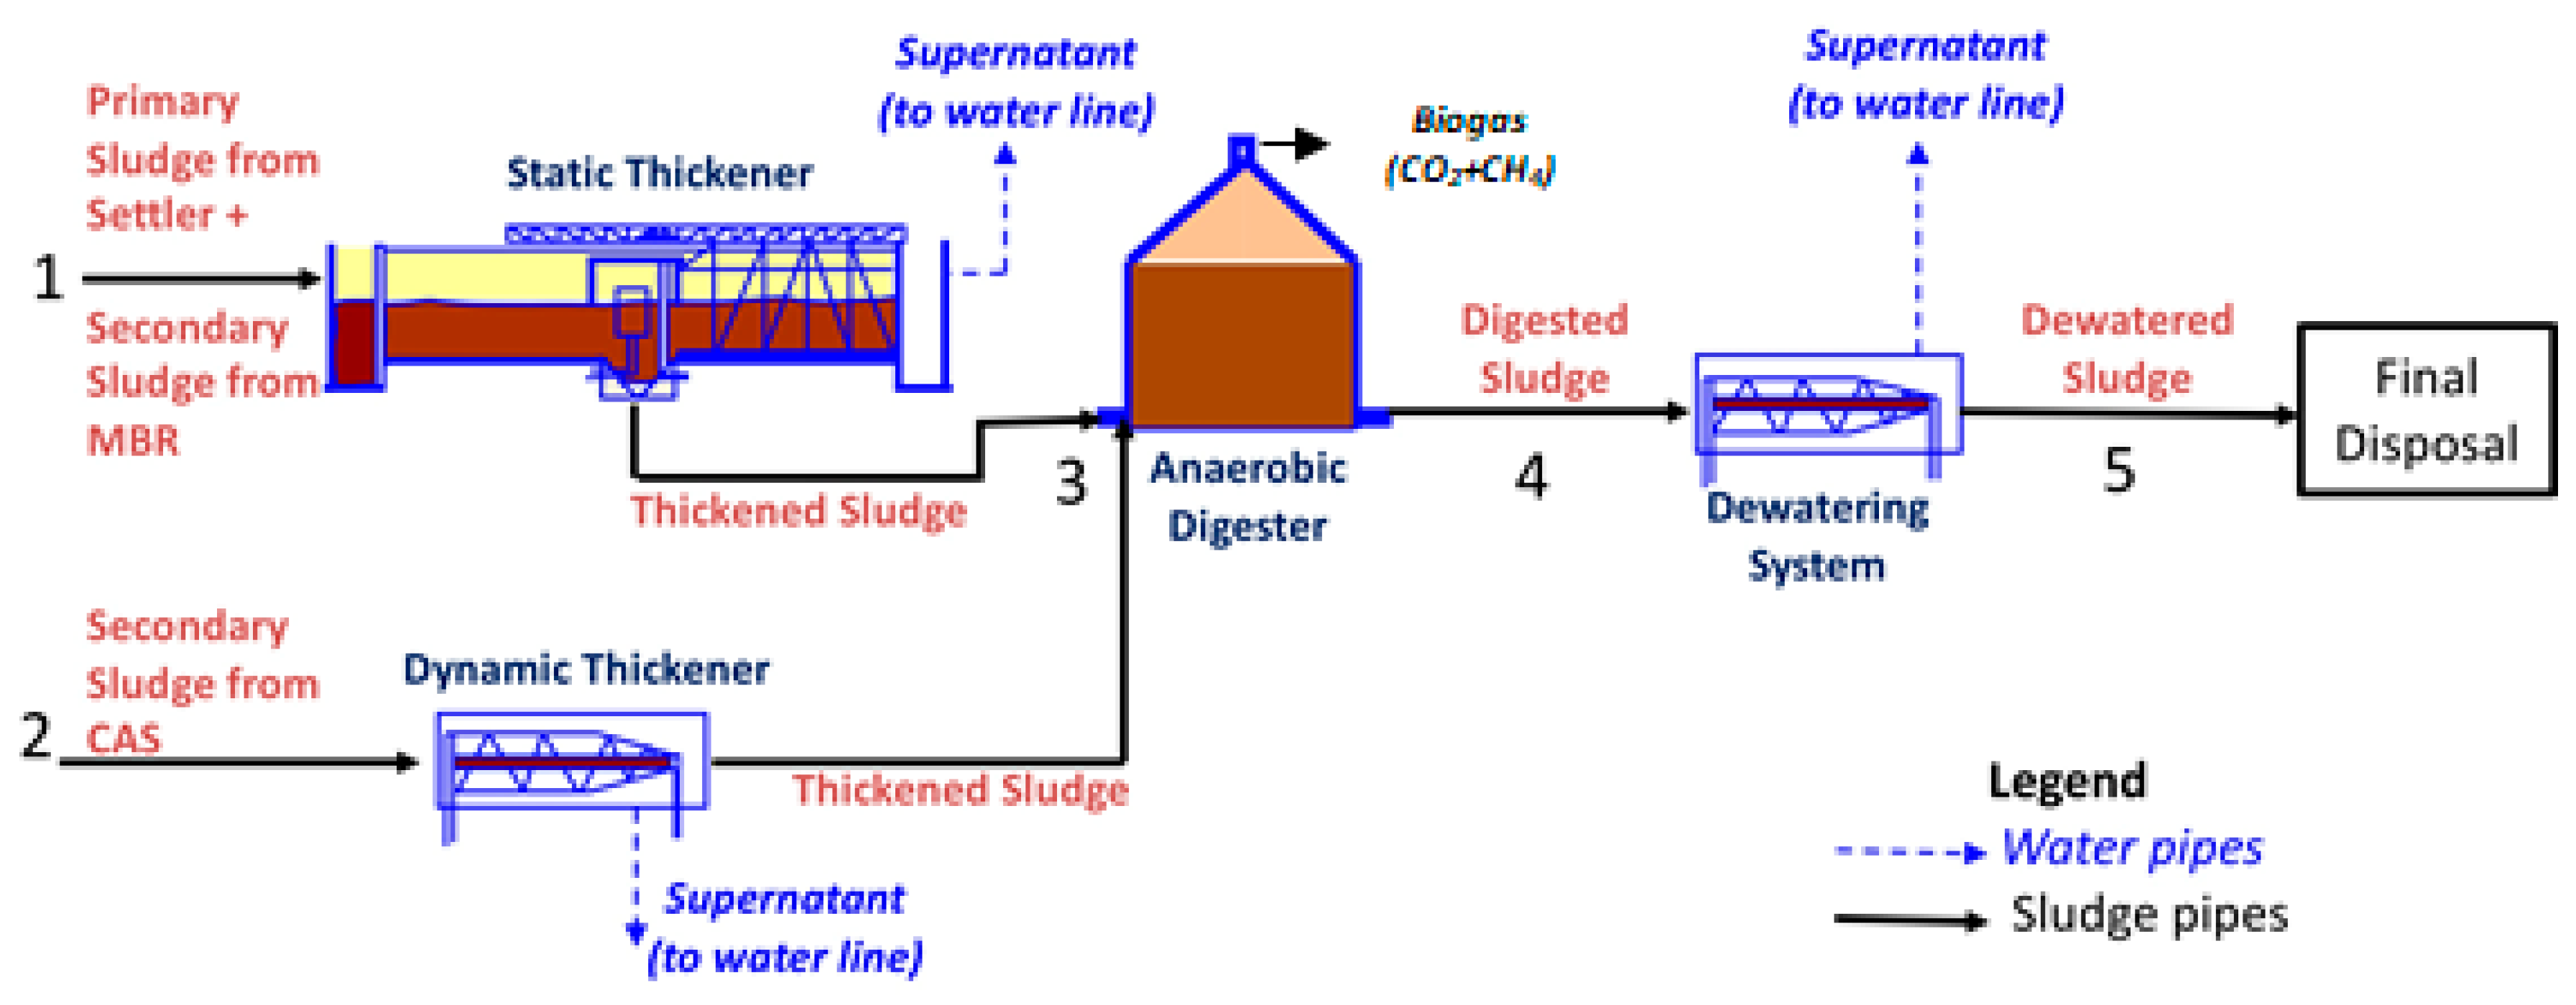
2.1. Feedstock Characterization

The three feedstocks used were characterized in accordance with accepted environmental practices. All measurements were conducted in triplicate and the average and standard deviation of each data is reported. The total solids content of each sludge was measured by drying in an oven at 105 °C for at least 8 h until constant weight was reached.
The pH of the raw and carbonized samples was measured using a Profi-Line pH 3310 (WTW, Milan, Italy) portable pH-meter by placing 1 g of solids in 20 g of deionized water, shaking for at least 90 min, allowing the mixture to settle for 15 min, and then reading the pH. The total Chemical Oxygen Demand (COD) was measured using a closed reflux titration method [43] using potassium dichromate digestion solution, sulfuric acid reagent, ferroin indicator solution, and a standard ferrous ammonium sulphate titrant according to standard procedures. The same method was used for soluble COD following filtration of the sample through a 0.45 μm filter [43]. Organic nitrogen in the trinegative state was measured via the semi-micro Kjeldahl method. Ammonium nitrogen was measured [43] by first buffering the sample at pH 9.5 with a borate buffer (to decrease hydrolysis), then distilling in a solution of boric acid, and determining the concentration via acid titration with H2SO4. To measure the total phosphorous, samples were first digested in H2SO4, forming molybdophosphoric acid, which was then reduced by stannous chloride to molybdenum blue. The concentration was measured photometrically at 690 nm and compared against a calibration curve [43].
Ultimate analysis to determine elemental composition of C, H, N, S, and O (by difference) was conducted on a LECO 628 analyzer (LECO, Moenchengladbach, Germany) equipped with Sulphur module for CHN (ASTM D-5373 standard method) and S (ASTM D-1552 standard method) determination. Proximate analyses were done on a LECO Thermogravimetric Analyzer TGA 701 (LECO Corporation, St. Joseph, MI, USA). Samples were heated at 20 °C min−1 to 105 °C in air and held until constant weight (< ±0.05%) to provide a dry baseline. They were subsequently heated at 16 °C min−1 from 105 °C to 900 °C in nitrogen with a hold time of 7 min, where the mass loss was attributed to Volatile Matter (VM). Finally, samples were held at 800 °C in air to oxidize the Fixed Carbon (FC) until the mass change stay within ±0.5% by weight. Mass remaining after this was considered to be ash (inorganic matter) content. The Higher Heating Value, HHV, was measured using an IKA 200C isoperibolic calorimeter (IKA-Werke GmbH, Staufen, Germany) according to the CEN/TS 14918 standard.
Inductively coupled plasma-optical emission spectroscopy (Arcos Ametek, Spectro, Germany) was used to determine the inorganic concentration of the sludge samples. Briefly, samples were oven-dried at 105 °C until constant weight and then acid-digested in concentrated nitric acid (650 mL−1; Carlo Erba, Milano, Italy) using a single reaction chamber microwave digestion system (UltraWAVE, Milestone Inc., Sheldon CT USA) and Teflon-lined vials to prevent interference. Elements were quantified using certified multi-element standards (CPI International).

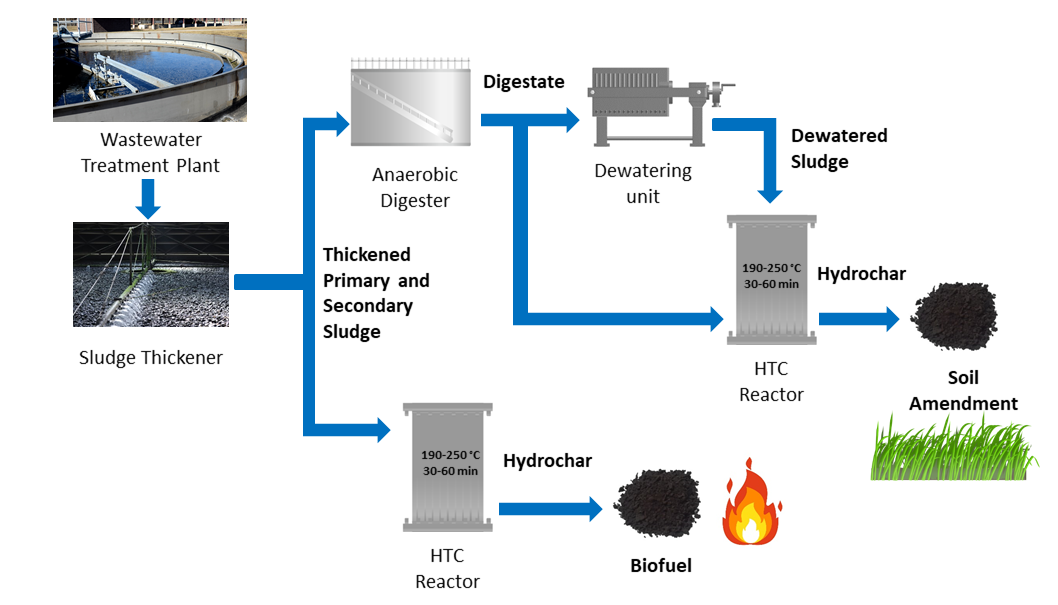
2.2. Hydrothermal Carbonization and Product Analysis

Hydrothermal carbonization typically occurs between 180 and 250 °C under autogenous pressure (up to 50 bar) but below the critical point [18]. The present work utilized a 50 mL stainless steel batch HTC reactor rated to withstand 300 °C and 140 bar, with temperature and pressure monitoring and temperature control, as previously described [44,45]. The thickened and digested sludges were used as-received. The reactor was loaded with 35.0 mL ± 0.1 mL biomass, which maintained a biomass (dry biomass)-to-water ratio of about 0.03:1. The dewatered sludge had a solid content of 25 wt% and needed to be diluted to ensure that the biomass was fully submerged. The reactor was filled with 20.00 g ± 0.01 g of dewatered sludge and 15.00 g ± 0.01 g of deionized water to cover the sludge, resulting in a biomass-to-water ratio of 0.17:1. Prior to each run, the reactor was sealed and purged with nitrogen gas; then it was heated up to the desired reaction temperature (190 °C, 220 °C and 250 °C) and held at the set point for the desired reaction time (30 min and 60 min). At least three experimental runs for each of the temperature/time combinations were performed for each of the three sludge samples.
After the reaction time, the reactor was cooled by placing a cold (−25 °C) stainless steel disk under its bottom and by blowing compressed air into its outer walls. The reactor was cooled to ambient temperature in less than 15 min, at which point the produced gas was measured by flowing it into a graduate cylinder filled with water [45]. As reported in the literature, where the CO2 content is always greater than 90 vol.%, the produced gas was assumed to be comprised entirely of CO2 [45,46]. The gas yield was estimated according to the ideal gas law under the assumption of standard temperature and pressure as:
Y g a s = M a s s CO 2 M a s s S l u d g e ,   d r y
The liquid and solid HTC products were filtered through a pre-dried and weighed piece of cellulose filter paper. The filter paper was then put in the oven overnight at 105 °C and weighed to calculate the solids produced. The solid yield of the hydrochar, Yhydrochar, was calculated as:
Y h y d r o c h a r = M a s s h y d r o c h a r , d r y M a s s S l u d g e , d r y
The liquid yield was computed as the complement to 1 of the gas and solid yields.
The solid hydrochar was characterized according to the same methods described in Section 2.1. for Higher Heating Value (HHV), proximate, and ultimate analyses. The hydrochar’s relative solid reactivity was measured using a Mettler-Toledo Thermogravimetric Analyzer–Differential Scanning Calorimeter (TGA-DSC-1, Mettler-Toledo LLC, Columbus, Ohio, USA) in an oxidative atmosphere. The TGA-DSC was calibrated with NIST-traceable gold, indium, and aluminum and the mass was measured to ±0.1 μg and temperature to ±0.1 °C. Approximately 10 mg of sample was loaded into a 70 μL alumina crucible. Samples were heated at 20 °C min−1 up to 110 °C in air flowing at 50 mL min−1 and held for 30 min to drive off any residual moisture. They were subsequently heated at 20 °C min−1 up to 950 °C and held for 30 min to oxidize all material. The mass fraction of sample converted (X) at any time, t, was calculated as:
X = m i m t m i m f
where mi is the initial mass, mt is the mass at any time, t, and mf is the final mass after the hold at 950 °C. Derivative thermogravimetric (DTG) curves were plotted as dX/dt (s−1) versus temperature. Differential scanning calorimeter (DSC) data was normalized as heat flow per sample mass at any given instant (mt). DTG curves are compared to those from an in-house sample of Illinois No. 6 coal, a high volatile bituminous coal from the Illinois #6 (Herrin) seam from the Argonne Premium Coal Bank [47]. The coal sample is well characterized in the literature and is often used as a standard on which to compare solid fuel oxidation [47,48,49].
Dewaterability—and the improvement due to HTC was determined by measuring the Capillary Suction Time (CST) required for water to be separated from sludge across a filter paper (Whatman 17 CHR, VWR International, Milan, Italy) using a Triton Electronics Ltd. capillary suction timer type 304B according to standard methods [43]. CST provides a quantitative assessment of how readily sludge releases water.
The liquid phase remaining after hydrothermal carbonization was characterized by measuring pH, COD, organic nitrogen, ammonia nitrogen, and phosphorous as described above. Measurements of Readily Biodegradable COD (RBCOD) were performed following the procedure described in literature [50]. To measure NH4+ nitrogen and soluble COD, samples were screened through a 0.45 µm filter [43].

3. Results

To assess the optimal point to withdraw sludge from the wastewater treatment process for hydrothermal carbonization in terms of resulting hydrochar properties, three samples were pulled from various points along the process: Thickened, Digested, and Dewatered (Figure 1). The feedstocks characteristics are presented in Table 1 and Table 2. These three samples were subjected to hydrothermal carbonization at three temperatures (190 °C, 220 °C, 250 °C) and two residence times (30 min, 60 min) each, producing a total of 18 hydrochar samples for analysis.
Looking at the data of the different raw sludges, it is clear that they differ substantially. Thickened sludge contains about 46 wt% elemental carbon and 15 wt% ash. In digested sludge, the carbon decreases to about 26 wt%, and the ash content increases to 45 wt%, due to stabilization during anaerobic digestion. Dewatered sludge contains 36 wt% carbon and about 28 wt% ash. Thus, even if dewatering is a mechanical process, it greatly modifies the sludge characteristics. The supernatant from sludge dewatering has high concentrations of inorganic compounds such as N-NH4+, P compounds, CaCO3, Mg, K, Na, and other minerals that contribute to the ash content [51]. The dewatering unit washes away these inorganics strongly decreasing the ash content of the dewatered sludge: this reflects on an increase in elemental C, H, N, and O, and also in FC and VM. VM variation is extremely significant, passing from a value of 50 wt% in the digested sludge to about 66 wt% in the dewatered sludge. These differences are also due to the fact that the digested sludge, immediately upstream of the dewatering operation, is chemically conditioned with organic polyelectrolyte (1–10 g/kg dry solids [52]) that is quickly adsorbed on the sludge particles.

3.1. Hydrochar Properties Depend on Sludge Withdrawal Point and Carbonization Conditions

Solid hydrochar yields and properties are strongly influenced by both sewage sludge feedstock and HTC temperature and residence time, as shown in Table 2 (see also Supplementary Materials Figure S1). In general, as the harshness of carbonization increases, the solid hydrochar yield decreases, as is the case with biomasses across the literature [53]. The one exception to this general trend was the digested sludge sample carbonized at 220 °C for 30 min, which had a lower solid yield than its 250 °C and 190 °C counterparts. This anomaly was observed for multiple experimental runs. Such behavior could be attributed to potential re-condensing of tarry materials onto the hydrochar matrix, increasing the observed “solid” yield at 250 °C. Such materials were previously identified on the surface of heterogeneous biomasses that can be maximized at carbonization conditions specific to each biomass [17]. As the solid hydrochar is collected on a 10–100 μm filter, any particles smaller than this size range would be considered part of the liquid yield, which may also explain this anomaly.
As a result of the carbonization process, which releases organic compounds from the solid matrix and forces them into the water phase while generating CO2, the total COD present substantially decreased upon carbonization (at any time, temperature) of the dewatered sludge sample, with a similar behavior noted for the thickened and digested samples (the effect on these two samples is less pronounced given the lower initial concentration in the raw samples) as shown in Table 1 and Figure S2 in Supplementary Materials. Conversely, soluble COD increased with increasing severity, most notably for the thickened and digested samples, with a significantly higher soluble COD that is maintained throughout carbonization for the dewatered samples. Such behavior has been described in the literature for other biomasses, including sludge, secondary sludge, wood waste, and dairy waste [54]. Given the nature of the carbonization process, where water acts as both a solvent and transport medium, simultaneously drawing organics into the water phase and generating CO2, this COD mass balance suggests that indeed the insoluble fraction is being converted to CO2 (and lesser amounts of CO and other non-condensable gases) while the soluble portion is retained in the process water.
The decrease in hydrochar pH for increasingly severe carbonization of the thickened sludge is to be expected; Volatile Fatty Acids (VFAs) present in primary sludge and formed via hydrolysis of triacylglycerols [55], especially acetic acid, are known to remain stable in the liquid phase, only breaking down at higher carbonization temperatures [54]. It was found here that the pH for the thickened sludge dropped from 7.2 (raw) to 6.0 for both the 190 °C and 220 °C conditions and to 5.8 for the 250 °C condition of the 30 min HTC samples and to 5.3, 6.1, and 6.0 for the 190 °C, 220 °C, and 250 °C 60 min samples, respectively (Table 1; plotted in Figure S3 in Supplementary Materials). This suggests that carbonization is able to release some VFAs from the primary matrix, but that the overall acidic nature of the hydrochar increases slightly. It should be noted that these measurements were taken in the same manner used to measure biochar pH, by equilibrating the hydrochar with deionized water and reading the pH of the liquid following settling. Anecdotally, when the pH of the process water is measured immediately following carbonization, the pH increases slightly upon severe carbonization, which would indicate hydrolysis of released VFAs occurs in the process water. For the digested samples, carbonization at 250 °C yields hydrochars with slightly higher pH than their 190 °C and 220 °C counterparts, suggesting a reduced acid content of the char. For the dewatered secondary sludge, the pH decreases with increasing carbonization but is overall lowest to begin with, suggesting that the acid content decreased during anaerobic digestion.
The proposed loss of semi-volatile compounds from the sludge matrices upon carbonization is further supported by the proximate analysis (Figure 2; Table 2; data of Table 2 plotted in Figure S4 in Supplementary Materials). The sludge treatment of WWTP results in a decrease in fixed carbon and volatile matter content upon digestion, with a slight increase in both upon dewatering. Changes in proximate analysis as a function of carbonization conditions versus the raw sludge withdrawn at each point are given in Figure 2. Figure 2 reports the percentage change in value of the various variables (FC, VM, Ash, all data on a dry basis) due to HTC, in respect to the raw biomasses. As compared to the raw sludge sample from each withdrawal point, the volatile matter content decreased with increasingly harsh carbonization. The fixed carbon content also decreases upon HTC, shifting the balance of the hydrochar composition to the inorganic (loosely termed “ash” phase). The change in proximate analysis appears to be more heavily temperature dependent than time dependent for the thickened samples. In this case, the ash content increased by 50 wt%, 100 wt%, and 150 wt% over the raw thickened sample as the carbonization temperature increased from 190 °C to 220 °C to 250 °C, respectively. This increase in inorganic content is offset more so by decreases in fixed carbon than volatile matter. For the digested samples, the increase in ash content—ranging from 25 wt% to 50 wt% as temperature increases—is offset by decreases in both VM and FC, with a slightly higher decrease in FC than VM across HTC conditions. The behavior of the dewatered samples is somewhat different. While for HTC at 30 min there is a slight increase in ash (especially at 220 °C and 250 °C carbonization), the 220 °C 30 min sample is offset more by changes in FC, whereas the 250 °C 60 min sample’s higher ash content is due to a decrease in VM. The dewatered 60 min HTC samples show even further divergent behavior; for all temperatures, the FC and ash contents increase, offset by a decrease in VM content. For the 190 °C and 220 °C samples, the change in FC weight percent is actually greater than that of the ash, whereas the 250 °C sample has a larger increase in ash than fixed carbon. This is likely due to the preparation of the samples. Both thickened and digested samples were used as received. The dewatered samples had too low of a moisture content to ensure all solids were submerged in the reactor, such that deionized water was added to the samples prior to carbonization. It is possible that some of the inorganics migrated into the water phase (to establish a concentration equilibrium), and thus, the relative change in ash content was lower for these samples.
This behavior is echoed by the ultimate analysis, whereby HTC temperature has a greater impact on organic element composition than time (Figure 3; Figure 4; Table 2; data of Table 2 plotted in Figure S5 in Supplementary Materials). As expected, the biological transformations of the primary sludge lead to overall lower oxygen and carbon contents of the raw digested and dewatered samples [56]. Figure 3 reports the percentage change in content of atomic species C, H, N, and O (all data on a dry basis) due to HTC, in respect to the raw biomasses. As shown in Figure 3, in general the weight percent of the organic elements decrease upon carbonization of the sludge samples, the balance made up by an increasing (relative) inorganic content. The elemental carbon contents for the thickened 190 °C 30 min and 60 min and all dewatered samples remain constant within statistical significance. Interestingly, the relative percent changes of C, H, and O were fairly minimal for the thickened sludge carbonized at 190 °C and 220 °C, suggesting minimal decarboxylation and dehydration, both of which would lower the O:C and H:C ratios, respectively [57]. However, this is not to imply a stagnant system; for the thickened (and indeed all sludge samples) the nitrogen content of the solids decreases considerably upon even mild carbonization, ranging from hydrochars with 40 wt% to those with 80 wt% lower N content than their raw counterparts (Figure 3). This loss of nitrogen supports the hypothesis that there is significant hydrolysis of fat and protein components present in the sludge. The organic nitrogen in the process liquid tends to decrease by 15–85 wt% upon carbonization of all samples. The ammonia nitrogen present in the liquid varies in a certain range, without any clear trend with time or temperature, as shown in Table 1. Given the substantial elemental decrease in N of the hydrochar, and liquid-phase organic nitrogen upon carbonization, closure of a mass balance would suggest either production of nitrogen gases (N2, NOx) or formation of nitrate or nitrite in the liquid phase, which could precipitate out as salts onto the hydrochar. As reported by Kruse and co-workers, this concentration would be too low to detect with N content measurements [58].
The carbon and fixed carbon values reported in Table 2 and the trends of the same variables shown in Figure 2 and Figure 3 testify to the peculiarity of these kinds of substrates which behave differently during HTC in respect to the vast majority of the other biomasses. While HTC applied to agro-waste, lignocellulosic feedstock, organic fraction of municipal solid waste, or compost [20,45,53,59,60] results in an increase in the values of C and FC, this is not the case for the majority of the sludge samples here investigated. The FC content decreases after HTC for thickened and digested sludges (Figure 2). The C content in the hydrochars is equal to or lower than C content in the raw sludges (Figure 3). This apparently strange behavior depends on the very high ash content of the sludge samples and was also previously reported in the literature [31,57,61]: in all these cases, the C and FC contents were expressed on a dry basis. Reverse C and FC trends were reported when the data was expressed on a dry ash free (daf) basis [23]. Here, on a daf basis, thickened and dewatered sludge increase their C content after HTC, and this applies to the digestate treated at the highest HTC temperature of 250 °C, too; FC data, conversely, even on a daf basis, remain still lower in the hydrochars in respect to the parent biomasses. To summarize, the organics in the sludge carbonized as should be expected in an HTC process: the increase in C content is evident when the basis of calculation is represented by the organics themselves (i.e., data on a daf basis), and the HTC was sufficiently severe. On a dry basis, conversely, the relative increase in ash content often prevails over the relative increase in C, as recently also discussed by Ferrentino et al. [62].

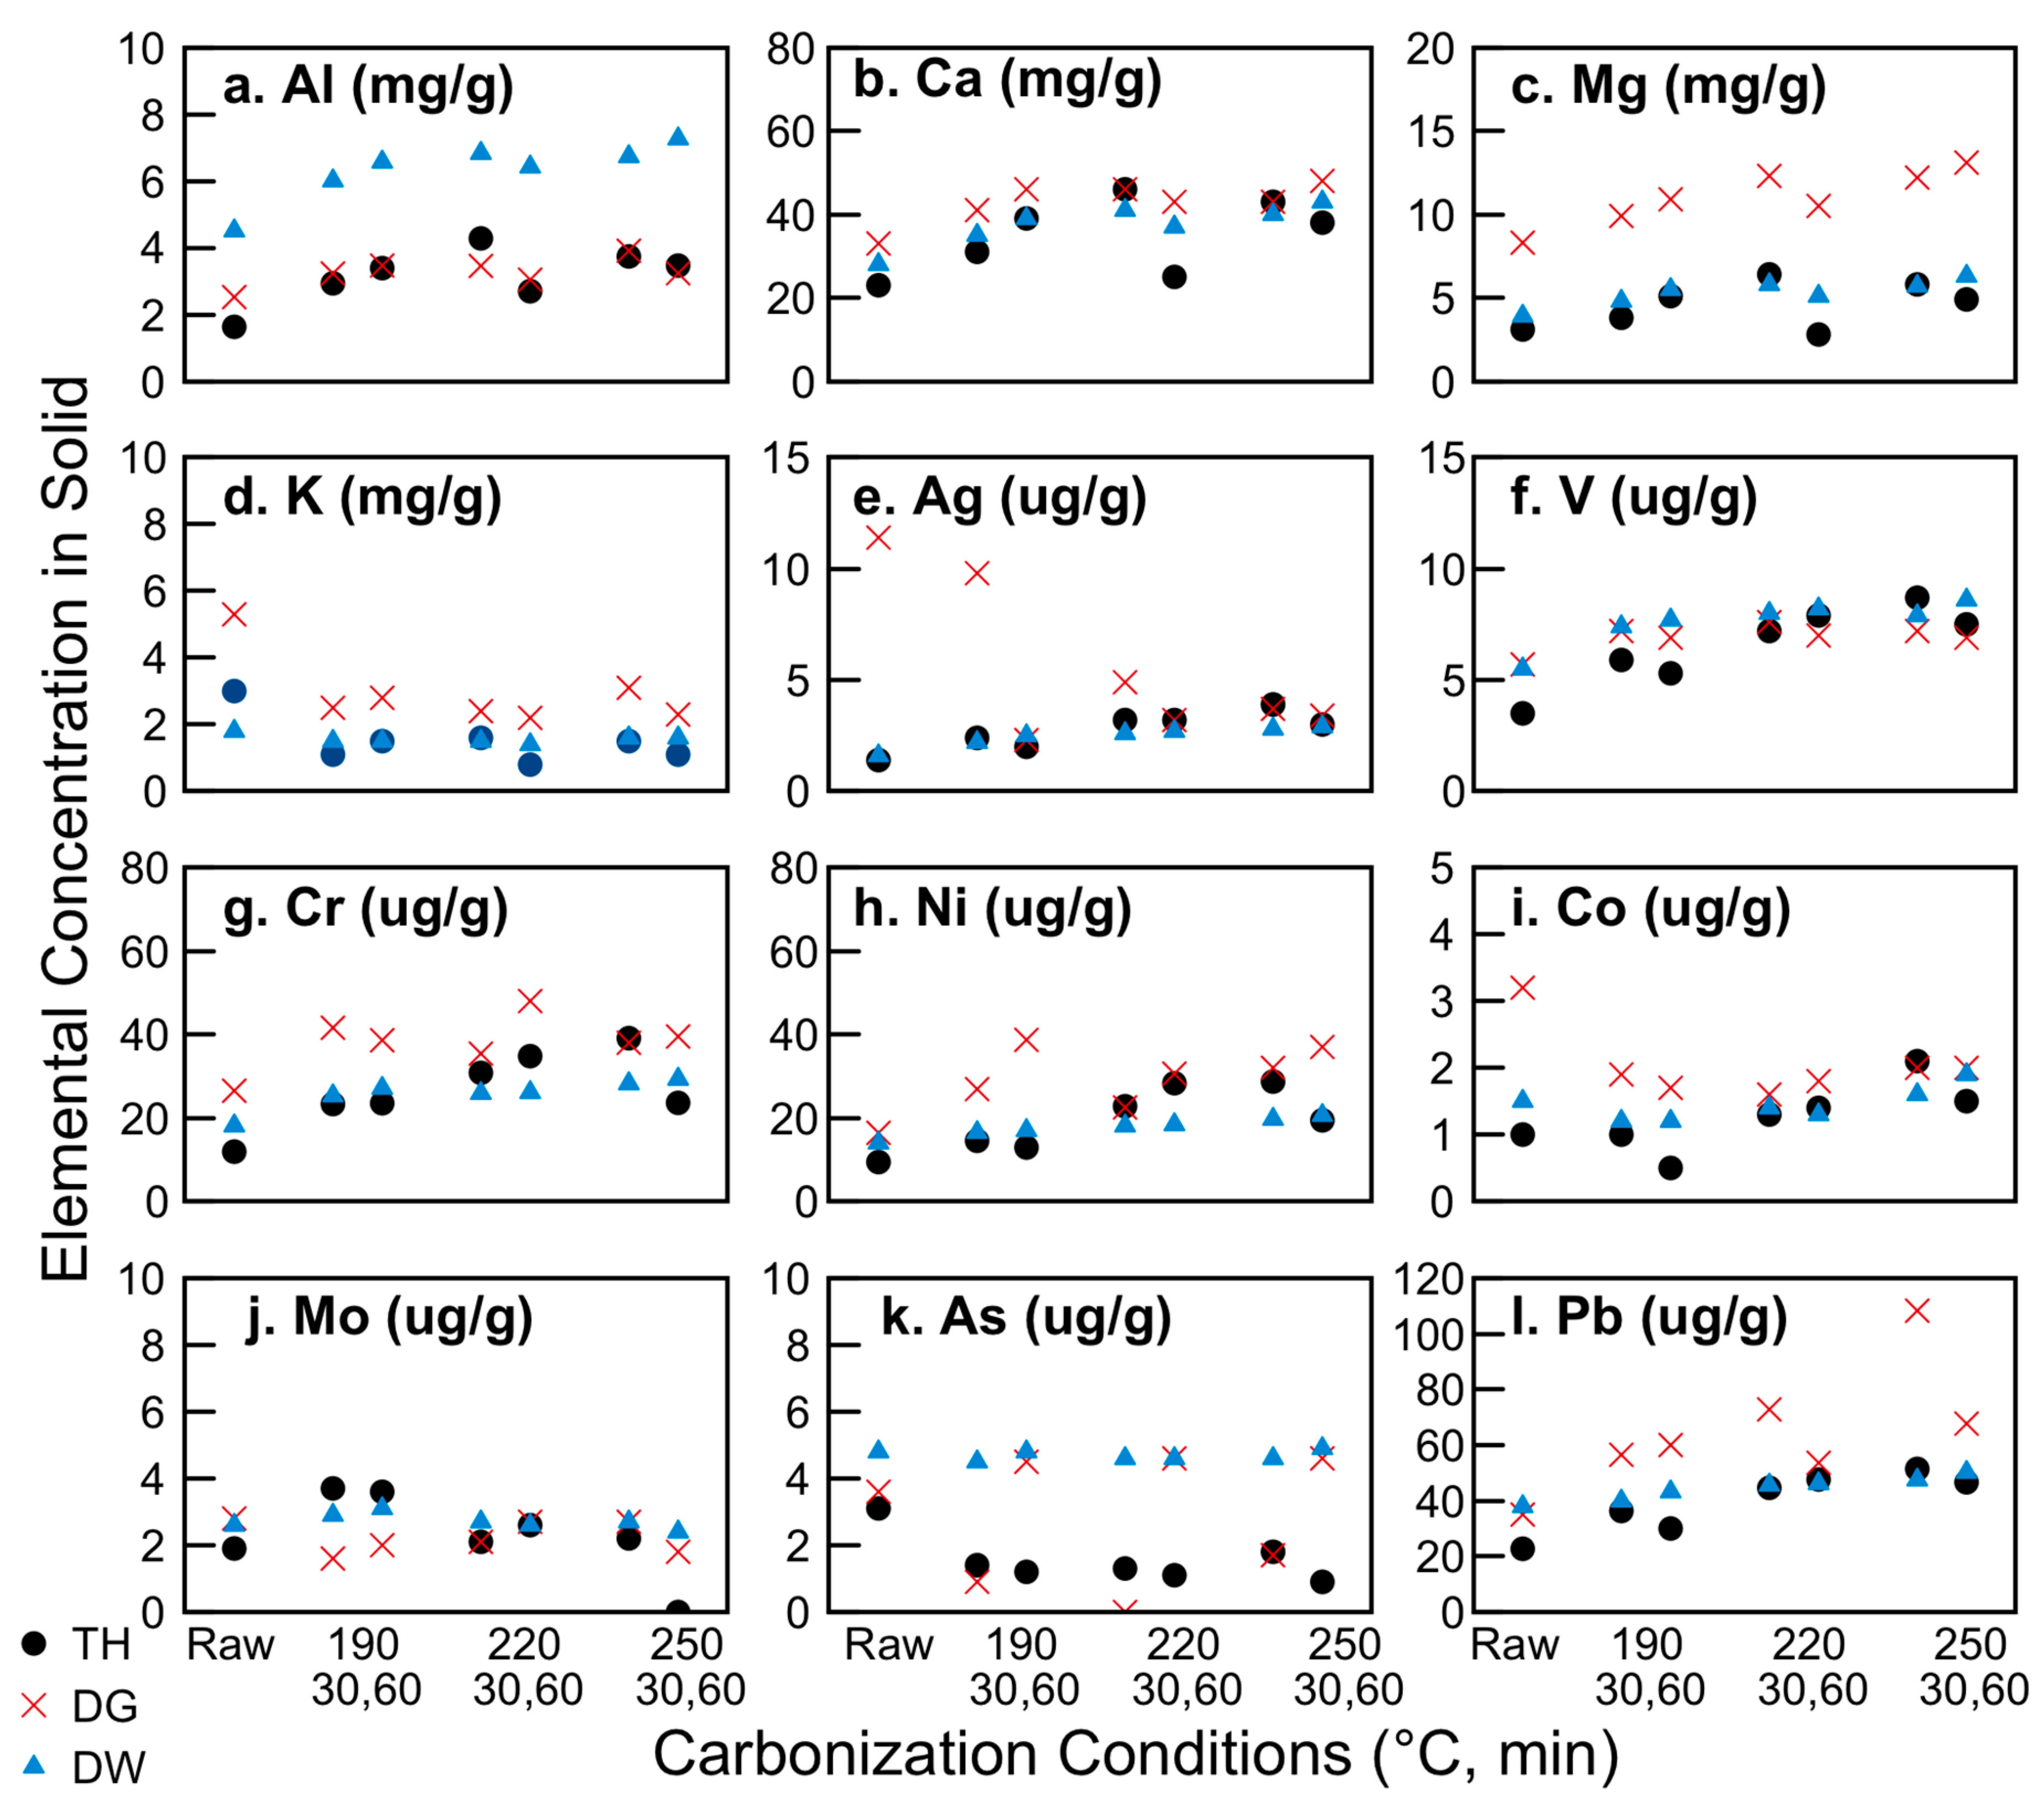
3.2. Distribution of Nutrients and Inorganics: Potential for Use as Soil Amendment

As shown in Table 1, the total phosphorous concentrated in the solid hydrochar (all samples/processing conditions) from 5 wt% in the raw samples to up to 10 wt% in the carbonized samples, with the thickened and dewatered 250 °C 30 min and 60 min samples having the highest amounts. The thickened sludge (all times/temperatures) showed lower organic nitrogen concentrations in the liquid phase, suggesting it remains in the solid phase or exits as a gas, as mentioned previously. This, coupled with the higher FC and VM contents of the thickened and dewatered hydrochars, suggests they would make better soil amendments than the digested sludge hydrochars [63,64,65].
Thermally treated biomasses tend to show enhanced P fertilizer values as a result of various mechanisms, including structural surface changes and improved association of P to inorganics such as Mg, Ca, and Al [66]. In the present work, the type of sludge sample had a larger impact on the retention and concentration of these nutrients than the carbonization conditions. As shown in Figure 5, the dewatered samples had higher overall Al concentrations—from 4 mgAl/gsludge for the raw sample as compared to ~ 2 mgAl/gsludge for the thickened and digested raw samples. Carbonization at 220 and 250 °C for both 30 min and 60 min doubled all of these concentrations, to 8 mgAl/gsludge for the carbonized dewatered sample and ~ 4 mgAl/gsludge for the others. Conversely, the digested sludge had almost twice the concentration of magnesium than the thickened or dewatered samples (which again almost doubled upon carbonization at 220 °C and 250 °C). The calcium concentration was quite similar for all sludge samples at 23, 33, and 28 mgCa/gsludge, for the thickened, digested, and dewatered raw samples, respectively. Upon carbonization at 250 °C for 30 min, the Ca content increased by over 100% for the thickened sample but only by 39% and 43% for the digested and dewatered raw samples, respectively. While soil incubation studies are beyond the scope of the present work, prior work by Thomsen and co-workers [66] suggests that the more heavily oxidized hydrochar samples (e.g., those that released more CO2 and thus had higher gas yield) containing more Mg, Ca, and Al would have a higher P availability. This corresponds to the digested 250 °C 60 min and dewatered 220 °C and 250 °C for 30 min and 60 min samples. Future work will investigate the degree to which hydrothermal carbonization plays a role in P plant availability, as well as the impact of HTC processing conditions itself on the volatilization and re-condensation of P species on the hydrochar surfaces.
The concentrations of a series of additional inorganic elements in the sludges and hydrochars were measured. Figure 5 shows a representative set of these elements (all data available in Supplementary Materials: Tables S1 and S2, Figures S6 and S7). Silver was included in the analysis, given its increasing prevalence in consumer materials as an incorporated nanomaterial and resulting detection in wastewater treatment systems [67]. Prior work indicates that silver will more likely accumulate in the biosolids than in the WWTP effluent [68]. Here, considerably higher levels of silver in the digested sludge are found as compared to the thickened or dewatered sludge, suggesting that the digestion indeed concentrates the silver in the biosolid, but that the dewatering process shifts the silver to the liquid phase. The silver concentration in the digested hydrochar decreases with increasing carbonization. Both of these indicate that the silver is in an easily mobile state in the digested sludge, equilibrating with its aqueous phase to lower solid concentration.
Arsenic and vanadium were included in this analysis given their high prevalence in Italian drinking water sources; the acceptable limit for arsenic in the Trentino-Alto Adige region increases to 50 µg L−1 over the nationwide 10 µg L−1 limit due to natural lithology [69]. As seen in Figure 5, the arsenic concentrations in the solid samples decreased with increasing harshness for the thickened and digested samples (with the exception of the 190 °C and 250 °C, 60 min digested samples). All other hydrochars had arsenic concentrations below 2 µg g−1. The International Biochar Initiative (IBI) [70] suggests an acceptable range for As in biochars of between 13 and 100 µg g−1 if they are to be applied as a soil amendment.
In Sicily, concentrations of V in drinking water sources are routinely above E.U. and U.S. maximum contaminant levels (MCLs) due to the underlying geology [71,72,73]. As such, it is important to ensure that concentrations of these metals were below MCLs before considering the potential for hydrochars to be land-applied, which could exacerbate the metal contamination issue. The vanadium concentration was slightly increased upon carbonization, but never exceeded 10 µgg−1; the MCL for drinking water in Italy is 50 µgL−1. V is known to co-precipitate with iron (III) [74]; while the oxidation states are not known here, the concentrations of iron in all solids exceeded 2 mgg−1 (therefore higher by several orders of magnitude), such that it is possible that V is present in the hydrochars in an iron (hydr)oxide precipitate.
As shown in Figure 5, the concentrations of chromium, cobalt, nickel, molybdenum, and lead (and a series of additional inorganics, as given in SI) are only modestly affected by carbonization and sludge withdrawal point. The cobalt concentration of the digested sludge was notably higher than the thickened or dewatered, but upon carbonization reached the same levels as the other samples of hydrochars, all at less than 3 µgg−1. The concentrations of all of these metals are below IBI maximum allowable thresholds [70], making them reasonable candidates for use as soil amendments on the basis of heavy metal content.

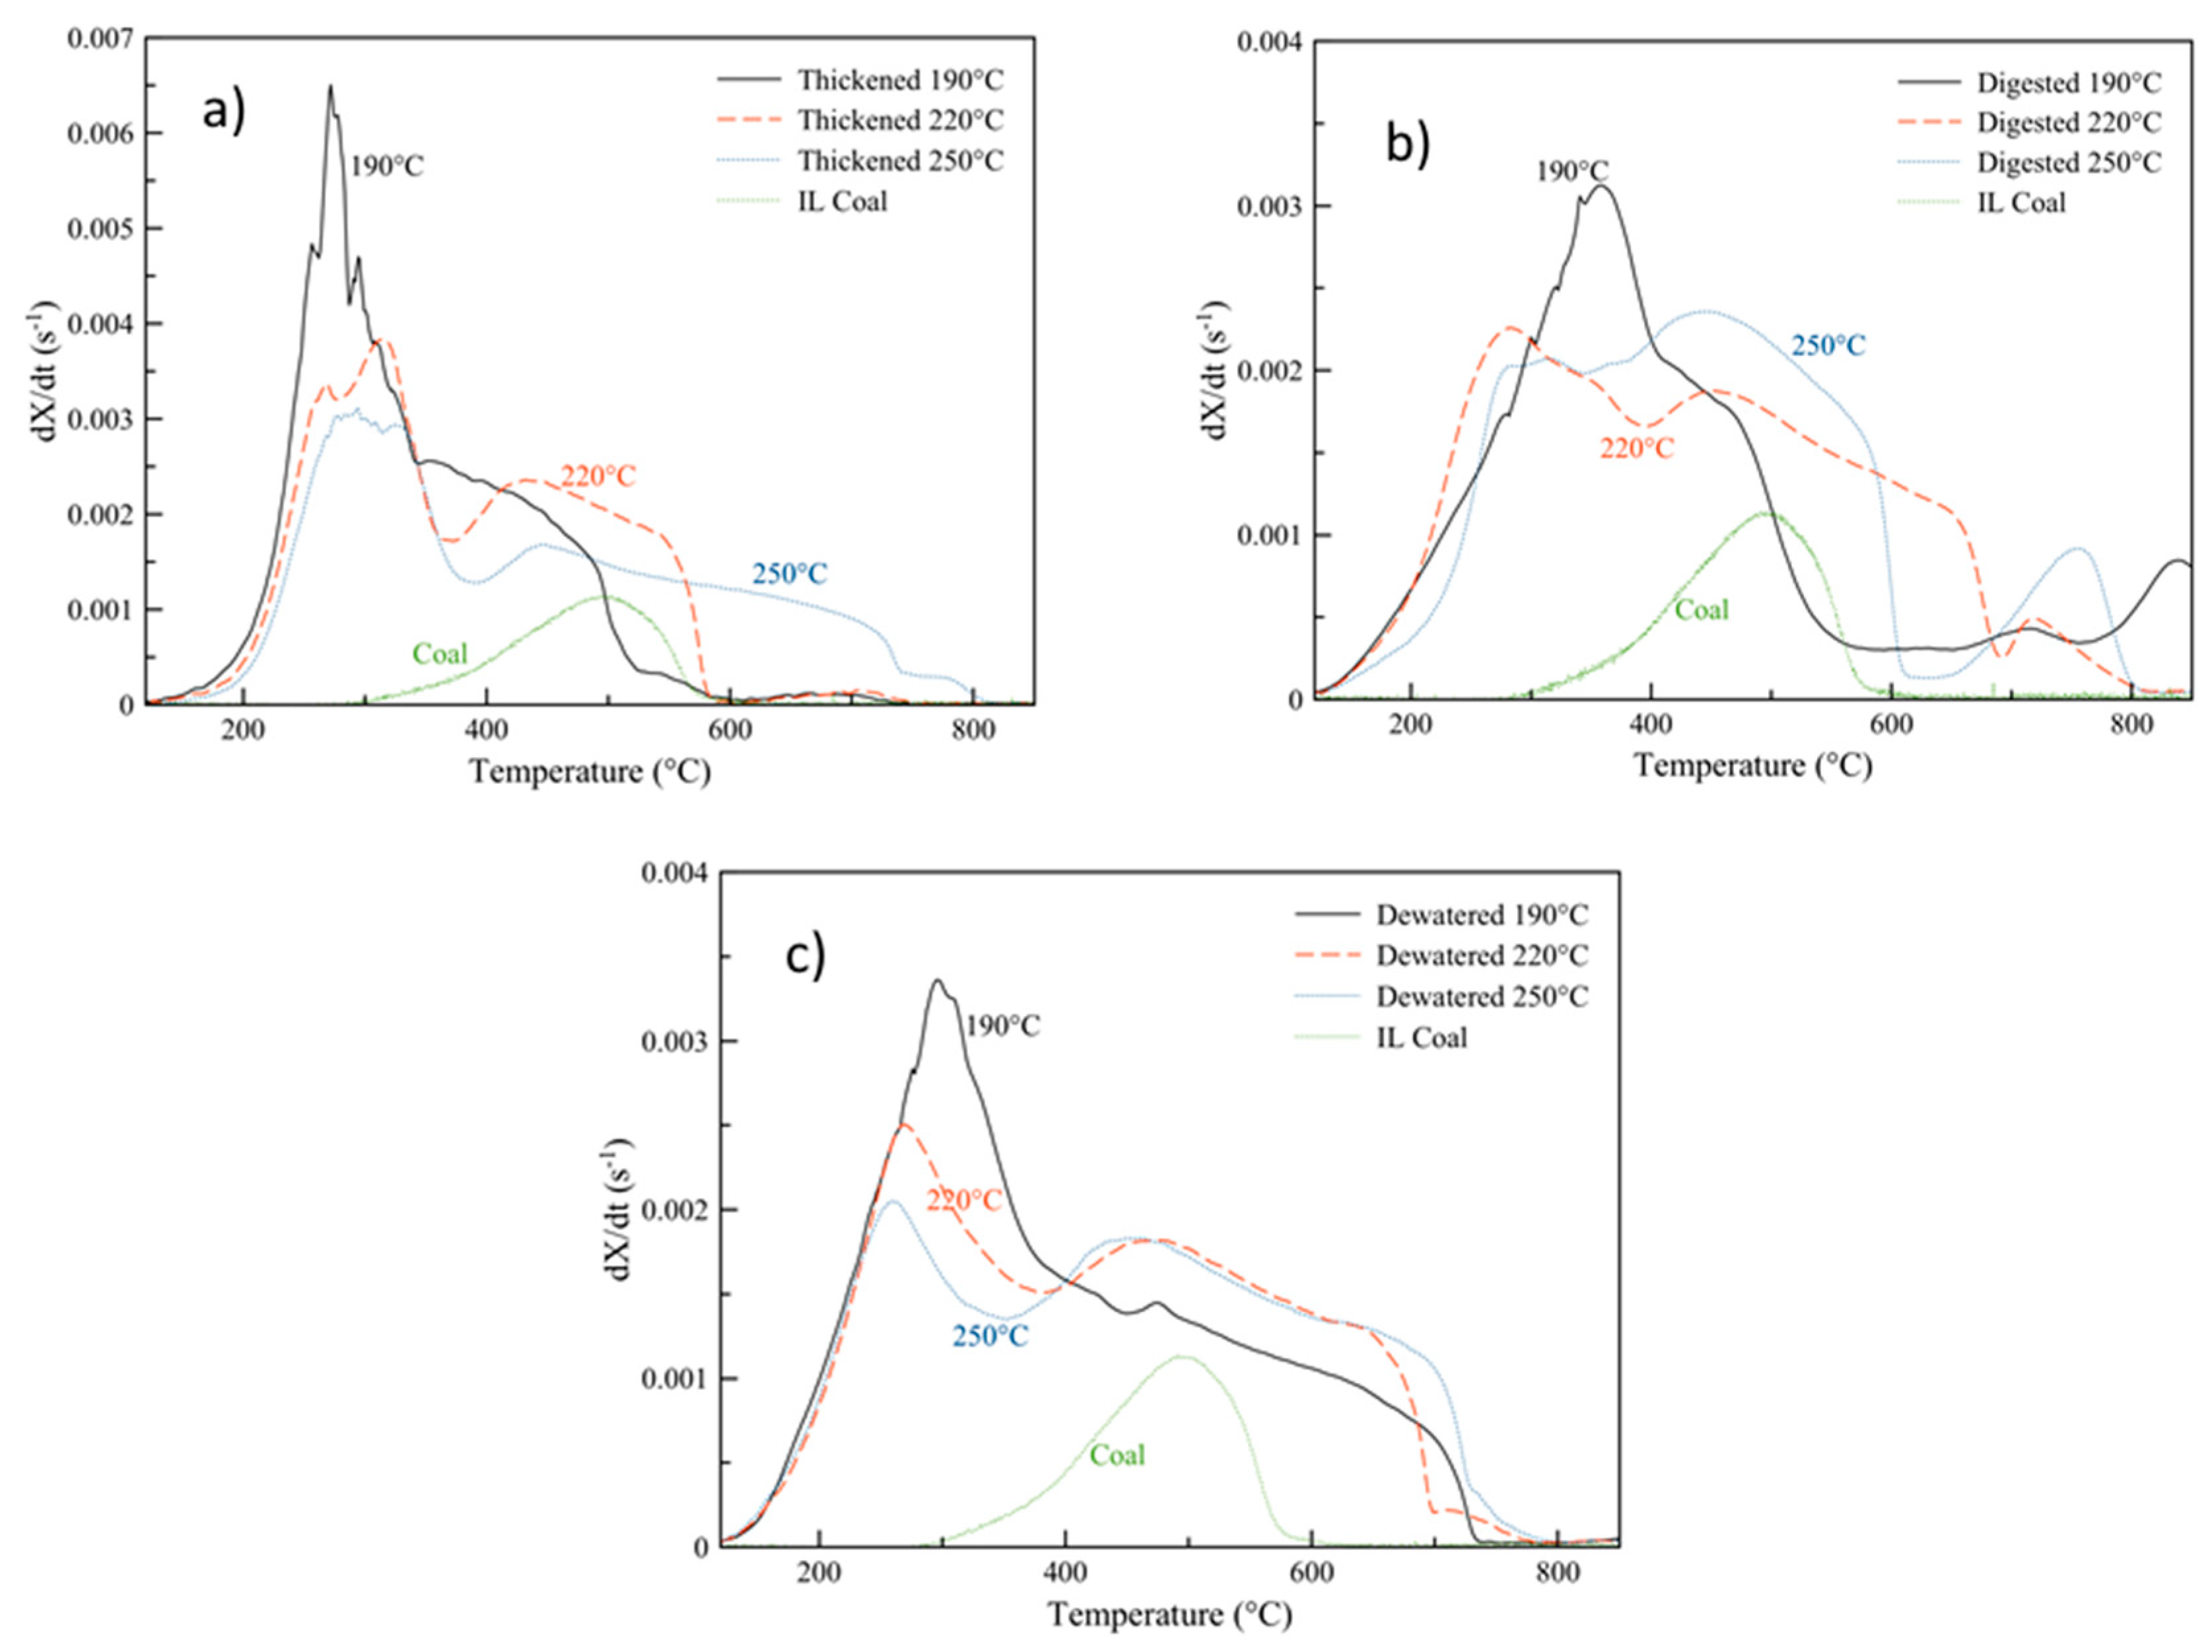
3.3. Energy Content and Oxidative Reactivity: Potential for Use as Solid Fuel

As Table 2 shows, the solid hydrochars have similar higher heating values to their raw counterparts. In this case, HTC has not substantially improved the “energy density” of the solid fuel. However, HTC does enable a more efficient solid–liquid separation and dewaterability. For the raw dewatered sludge, CST was not complete after 60 min, while it was complete for the 190 °C 60 min hydrochar after only 380 s. With an increase in HTC temperature, CST was 209 and 90 s at 220 °C and 250 °C (60 min), respectively. Images of the CST trials are available in Supplementary Materials Figure S8. This improved dewaterability demonstrates a reduction of volume for transport of the solid waste and reduced moisture content for potential combustion applications.
Figure 6 plots the DTG curves of the hydrochar samples produced at each of the three carbonization temperatures at 30 min, alongside an Illinois No. 6 coal sample. As can be seen, the hydrochar sludge samples are considerably more reactive than the coal sample. Their peak DTG temperatures (highest conversion rates) occur at hundreds of degrees less than the coal sample and at higher conversion rates. The highest peak mass loss rates occur for all three hydrochars produced from the thickened sludge, prior to any anaerobic digestion. Post-digestion, while the shape of the DTG curves changes, the peak rates are quite similar for both the thickened and dewatered sludge. For all three samples, the 190 °C carbonized hydrochars display the highest reactivity compared to the other HTC temperatures. Especially at such mild conditions, HTC does not significantly carbonize the sample—oftentimes, the original materials microstructure is preserved, whereas higher temperatures lead to a more complete destruction of the carbon matrix [53,75].
Given the relatively high reactivity of any of the sludge hydrochars, it may be difficult to combust them for electricity generation in current boilers designed for solid fuels such as coal [76]. While the higher heating values of especially thickened sludge (18–21 MJ kg−1) are suitable for such combustion schemes, their lower ignition and peak reactivity temperatures are considerably lower than that of most bituminous coals, and therefore may lead to loss of efficiency in boilers [77]. That, combined with the higher ash content that could result in slagging and fouling, suggests that the sludge hydrochars may perform better in co-combustion scenarios [78].
It was previously shown that blending biofuels with similar characteristics at ratios less than 20 wt% with coal mitigates fuel segregation and efficiency loss issues while increasing the share of renewables in energy generation portfolios [48,49,76]. Recent work in the literature suggests that hydrochars can be co-combusted with a variety of coals in economically, environmentally, and energetically viable schemes in existing infrastructure [79,80,81] and may even improve the emissions profile at optimized blending ratios [82]. It was recently demonstrated that hydrochars with similar reactivities can be oxidized with Illinois No. 6 coal at ratios of 10 wt% hydrochar, balance coal, without causing significant fuel segregation [83]. In summation, the high reactivity and ash content (though high HHV) of the thickened and dewatered hydrochars temper enthusiasm for their use as a combustible fuel. The low HHV of the digested sludge—below low-rank coals—makes it difficult to envision a combustion scenario where this would be a valuable solid fuel. As such, the potential for using sludge-based hydrochars as a drop-in solid fuel is likely minimal, though this could be accomplished without the need for anaerobic digestion of the sludge if used in a co-fired fuel scenario.

3.4. Further Considerations

This work examined the impact of WWTP withdrawal point and hydrothermal carbonization conditions on resulting hydrochar properties. Table S3 in Supplementary Materials provides a summary of the overall results discussed. While there is considerable potential to use HTC to convert sewage sludge to renewable fuels and/or use the hydrochars for nutrient recovery redistribution, several questions about the feasibility of implementing such a process remain unanswered.
One question is what to do with the process water remaining after treatment, which contains unreacted feedstock and/or chemical intermediates that are potentially hazardous [84]. While this is beyond the scope of the present work, others have previously demonstrated several potential management options. Process liquors remaining after hydrothermal treatments have been shown to be suitable feedstocks for aerobic, anoxic, and anaerobic processes [85,86,87]. The experimental data of the present investigation testify that RBCOD (readily biodegradable COD) for HTC performed at 190 °C reached values above 85% of total COD, while increasing the temperature led to values below 15 % at 250 °C. While wet air oxidation liquors have shown some inhibitory behaviors for strictly anaerobic treatments [86], this has not been the case for some studies of HTC liquors [87,88], although others suggest methanogenesis inhibition at high inoculum concentrations (>25 gCODL−1) [89]. As demonstrated by Qiao and co-workers [90], HTC process water may actually increase the efficiency of the solid hydrolysis step, a rate-limiting step in the digestion process [91,92], and enhance methane production in the digester [93]. The use of nitrates as oxidants can catalyze COD and dissolved organic carbon removal [94], and, as it was recently demonstrated, hydrochars themselves can be used to enhance anaerobic digestion [95].
Second, the fate of some heavy metals during HTC, especially Cu and Cr, may complicate the use of these materials as a soil amendment, as successive WWT and carbonization concentrates them within the hydrochar. While it was not found here that heavy metal concentrations were above recommended IBI limits in the hydrochars, the concentrations of heavy metals in wastewater solids and effluents vary widely across the globe and can pose health risks in certain areas [96]. To address this potential concern, Shi and co-workers [97] demonstrated that Cd in sludge hydrochars can be immobilized by the synergistic nature of apatite P present in the chars and addition of hydroxyapatite. However, as both acid and alkaline leaching have been shown to dissolve phosphate in sludges and sludge ashes [98], the long-term stability of the Cd immobilized by the method of hydroxyapatite addition is not clear. Prior work by Yoshizaki and Tomida [99] demonstrated that such heavy metals could be removed by phosphoric acid and hydrogen peroxide for downstream reuse and recovery. Their method had enhanced recovery and was more environmentally and economically viable than treatment with hydrochloric acid or sulfuric acid, opening a potential pathway for extraction of the metals from hydrochars. Such treatment would likely act as a porogen to increase the surface area of the hydrochars [100], increasing their ability to retain water and slow-release nutrients when used as a solid amendment [101], and may open up possibilities for conversion of the materials to activated carbons for use in water treatment, battery electrodes, and other high-value materials [102,103,104,105].

4. Conclusions

The present study probed the impact of hydrothermal processing conditions and sewage sludge withdrawal point on resulting hydrochars. The hydrothermal carbonization (HTC) of sludge proceeds similarly to many other wet biomasses; as harshness (time and temperature) of the process increases, the solid yield decreases, the ash (inorganic) content increases, total COD decreases but soluble COD increases, and solid pH decreases. However, there are distinct differences between the hydrochars produced from primary (thickened) versus secondary (digested and dewatered) sludge. Thickened sludge carbonized at moderate conditions (220 °C, 30 min) produced the most viable solid fuel with the highest HHV, moderate ash content, and high volatile matter content. However, with O:C and H:C ratios higher than typical bituminous coals of similar heating content, the thermal reactivity of the hydrochar was significantly higher than coals typically combusted. This suggests that sludge hydrochars could be co-fired with coal but are not ideal solid fuels. On the other hand, hydrochars produced from secondary sludge are more viable as potential soil amendments. The carbonized digested sludges show relatively neutral pH, low COD, and enhanced phosphorous, along with enhanced Ca, Mg, and Al concentrations to help mobilize P. Their heavy metal composition is well below International Biochar Initiative standards, though the elemental oxygen content and lower volatile matter content warrant future inquiry into this pathway.

Supplementary Materials

The following are available online at https://www.mdpi.com/1996-1073/13/11/2890/s1, Figure S1: Product distribution among solid, gas and liquid (by difference) phases following hydrothermal carbonization of three sludge samples, Figure S2: Impact of hydrothermal carbonization on total COD (top) and soluble COD (bottom) of three sludge samples, Figure S3: pH of raw and hydrothermally carbonized sludge samples, Figure S4: Proximate analysis of hydrothermally carbonized sludge samples with black circles indicating fixed carbon, red squares are volatile matter, and blue plus symbols are ash content (a: Thickened sludge, 30 min HTC; b: Thickened sludge, 60 min HTC; c: Digested sludge, 30 min HTC; d: Digested sludge, 60 min HTC; e: Dewatered sludge, 30 min HTC; f: Dewatered sludge, 60 min HTC), Figure S5: Ultimate analysis of hydrothermally carbonized sludge samples, Figure S6: Inorganic element distribution in raw sludge samples with: a high concentrations and b: low concentrations; error bars indicate 95% confidence interval, FigureS7: Inorganic elements as a function of sludge sample and carbonization conditions, Figure S8: Visual evidence of hydrochar dewaterability, Table S1: ICP-OES analysis of inorganics present in three sludge feedstocks, Table S2: ICP-OES analysis of inorganics present in hydrothermally carbonized sludge samples, Table S3: Summary of observations of sludge hydrochars.

Author Contributions

Conceptualization, J.G., G.A. and L.F.; methodology, F.M., J.G., G.A. and L.F.; validation, F.M., M.V. and T.M.; formal analysis, F.M., J.G., T.M. and M.V.; investigation, F.M.; resources, J.G., G.A. and L.F.; data curation, F.M., J.G. and M.V.; writing—original draft preparation, F.M. and J.G.; writing—review and editing, J.G., M.V. and L.F.; visualization, F.M. and J.G.; supervision, G.A. and L.F.; project administration, G.A. and L.F.; funding acquisition, G.A. and L.F. All authors have read and agreed to the published version of the manuscript.

Funding

This work was partially supported by Atzwanger Spa http://www.atzwanger.net/.

Acknowledgments

The authors appreciate the help of Lihui Gao and Giulia Ischia in running the thermogravimetric analysis and of Fabio Valentinuzzi and Stefano Cesco for inductively coupled plasma-optical emission spectroscopy. J. Goldfarb acknowledges support of the U.S.-Italy Fulbright Commission.

Conflicts of Interest

The authors declare no conflict of interest. The funders had no role in the design of the study; in the collection, analyses, or interpretation of data; in the writing of the manuscript, or in the decision to publish the results.

References

  1. Steichen, R. Council Directive of 21 May 1991 concerning urban waste water treatment (91/271/EEC). Off. J. Eur. Communities 1991. Available online: https://www.tarimorman.gov.tr/SYGM/Belgeler/ab%20mevzuat%C4%B1/91-271-EEC.pdf (accessed on 4 June 2020).
  2. Bianchini, A.; Bonfiglioli, L.; Pellegrini, M.; Saccani, C. Sewage sludge management in Europe: A critical analysis of data quality. Int. J. Environ. Waste Manag. 2016, 18, 226. [Google Scholar] [CrossRef]
  3. EUROSTAT. Sewage Sludge Production and Disposal from Urban Wastewater (in Dry Substance (d.s)). 2017. Available online: https://data.europa.eu/euodp/en/data/dataset/hzWkcfKt5mxEaFijeoA (accessed on 4 June 2020).
  4. Zhang, Q.; Hu, J.; Lee, D.; Chang, Y.; Lee, Y. Sludge treatment: Current research trends. Bioresour. Technol. 2017, 243, 1159–1172. [Google Scholar] [CrossRef]
  5. European Commission. Eighth Report on the Implementation Status and the Programmes for Implementation (as required by Article 17) of Council Directive 91/271/EEC Concerning Urban Waste Water Treatment; European Commission: Brussels, Belgium, 2016. [Google Scholar]
  6. Yanagida, T.; Fujimoto, S.; Minowa, T. Application of the severity parameter for predicting viscosity during hydrothermal processing of dewatered sewage sludge for a commercial PFBC plant. Bioresour. Technol. 2010, 101, 2043–2045. [Google Scholar] [CrossRef]
  7. Campbell, H.W.; Pacific, C.; Technologies, E. Sludge management—Future issues and trends. Water Sci. Technol. 2000, 41, 1–8. [Google Scholar] [CrossRef]
  8. European Commission. Disposal and Recycling Routes for Sewage Sludge Part 1—Sludge Use Acceptance Report; European Commission: Brussels, Belgium, 2001; ISBN 9289417986. [Google Scholar]
  9. Rulkens, W. Sewage Sludge as a Biomass Resource for the Production of Energy: Overview and Assessment of the Various Options. Energy Fuels 2008, 44, 9–15. [Google Scholar] [CrossRef]
  10. Tyagi, V.K.; Lo, S.L. Sludge: A waste or renewable source for energy and resources recovery? Renew. Sustain. Energy Rev. 2013, 25, 708–728. [Google Scholar] [CrossRef]
  11. Cao, Y.; Pawłowski, A. Sewage sludge-to-energy approaches based on anaerobic digestion and pyrolysis: Brief overview and energy efficiency assessment. Renew. Sustain. Energy Rev. 2012, 16, 1657–1665. [Google Scholar] [CrossRef]
  12. Merzari, F.; Langone, M.; Andreottola, G.; Fiori, L. Methane production from process water of sewage sludge hydrothermal carbonization. A review. Valorising sludge through hydrothermal carbonization. Crit. Rev. Environ. Sci. Technol. 2019, 49, 947–988. [Google Scholar] [CrossRef]
  13. Johansson, K.; Perzon, M.; Fröling, M.; Mossakowska, A.; Svanström, M. Sewage sludge handling with phosphorus utilization—Life cycle assessment of four alternatives. J. Clean. Prod. 2008, 16, 135–151. [Google Scholar] [CrossRef]
  14. Merzari, F.; Lucian, M.; Volpe, M.; Andreottola, G.; Fiori, L. Hydrothermal carbonization of biomass: Design of a bench-Scale reactor for evaluating the heat of reaction. Chem. Eng. Trans. 2018, 65, 43–48. [Google Scholar]
  15. Akiya, N.; Savage, P.E. Roles of water for chemical reactions in high-temperature water. Chem. Rev. 2002, 102, 2725–2750. [Google Scholar] [CrossRef] [PubMed]
  16. Kritzer, P. Corrosion in high-temperature and supercritical water and aqueous solutions: A review. J. Supercrit. Fluids 2004, 29, 1–29. [Google Scholar] [CrossRef]
  17. Lucian, M.; Volpe, M.; Gao, L.; Piro, G.; Goldfarb, J.L.; Fiori, L. Impact of hydrothermal carbonization conditions on the formation of hydrochars and secondary chars from the organic fraction of municipal solid waste. Fuel 2018, 233, 257–268. [Google Scholar] [CrossRef]
  18. Lucian, M.; Fiori, L. Hydrothermal carbonization of waste biomass: Process design, modeling, energy efficiency and cost analysis. Energies 2017, 10, 211. [Google Scholar] [CrossRef] [Green Version]
  19. Volpe, M.; Messineo, A.; Mäkelä, M.; Barr, M.R.; Volpe, R.; Corrado, C.; Fiori, L. Reactivity of cellulose during hydrothermal carbonization of lignocellulosic biomass. Fuel Process. Technol. 2020, 206, 106456. [Google Scholar] [CrossRef]
  20. Volpe, M.; Fiori, L.; Volpe, R.; Messineo, A. Upgrading of Olive Tree Trimmings Residue as Biofuel by Hydrothermal Carbonization and Torrefaction: A Comparative Study. Chem. Eng. Trans. 2016, 50, 13–18. [Google Scholar]
  21. Mäkelä, M.; Volpe, M.; Volpe, R.; Fiori, L.; Dahl, O. Spatially resolved spectral determination of polysaccharides in hydrothermally carbonized biomass. Green Chem. 2018, 20, 1114–1120. [Google Scholar] [CrossRef] [Green Version]
  22. Lucian, M.; Volpe, M.; Fiori, L. Hydrothermal Carbonization Kinetics of Lignocellulosic Agro-Wastes: Experimental Data and Modeling. Energies 2019, 12, 516. [Google Scholar] [CrossRef] [Green Version]
  23. Zhao, P.; Shen, Y.; Ge, S.; Yoshikawa, K. Energy recycling from sewage sludge by producing solid biofuel with hydrothermal carbonization. Energy Convers. Manag. 2014, 78, 815–821. [Google Scholar] [CrossRef] [Green Version]
  24. Danso-Boateng, E.; Holdich, R.G.; Wheatley, A.D.; Martin, S.J.; Shama, G. Hydrothermal Carbonization of Primary Sewage Sludge and Synthetic Faeces: Effect of Reaction Temperature and Time on Filterability. Environ. Prog. Sustain. Energy 2015, 34, 1279–1290. [Google Scholar] [CrossRef] [Green Version]
  25. Khalil, W.A.S.; Shanableh, A.; Rigby, P.; Kokot, S. Selection of hydrothermal pre-treatment conditions of waste sludge destruction using multicriteria decision-making. J. Environ. Manag. 2005, 75, 53–64. [Google Scholar] [CrossRef]
  26. Catallo, W.J.; Comeaux, J.L. Reductive hydrothermal treatment of sewage sludge. Waste Manag. 2008, 28, 2213–2219. [Google Scholar] [CrossRef] [PubMed]
  27. Zhao, P.; Chen, H.; Ge, S.; Yoshikawa, K. Effect of the hydrothermal pretreatment for the reduction of NO emission from sewage sludge combustion. Appl. Energy 2015, 111, 199–205. [Google Scholar] [CrossRef]
  28. Becker, G.C.; Wüst, D.; Köhler, H.; Lautenbach, A.; Kruse, A. Novel approach of phosphate-reclamation as struvite from sewage sludge by utilising hydrothermal carbonization. J. Environ. Manag. 2019, 238, 119–125. [Google Scholar] [CrossRef] [PubMed]
  29. Shi, Y.; Luo, G.; Rao, Y.; Chen, H.; Zhang, S. Hydrothermal conversion of dewatered sewage sludge: Focusing on the transformation mechanism and recovery of phosphorus. Chemosphere 2019, 228, 619–628. [Google Scholar] [CrossRef]
  30. Song, E.; Park, S.; Kim, H. Upgrading Hydrothermal Carbonization (HTC) Hydrochar from Sewage Sludge. Energies 2019, 12, 2383. [Google Scholar] [CrossRef] [Green Version]
  31. Danso-Boateng, E.; Shama, G.; Wheatley, A.D.; Martin, S.J.; Holdich, R.G. Hydrothermal carbonisation of sewage sludge: Effect of process conditions on product characteristics and methane production. Bioresour. Technol. 2015, 177, 318–327. [Google Scholar] [CrossRef] [Green Version]
  32. Brookman, H.; Gievers, F.; Zelinski, V.; Ohlert, J.; Loewen, A. Influence of Hydrothermal Carbonization on Composition, Formation and Elimination of Biphenyls, Dioxins and Furans in Sewage Sludge. Energies 2018, 11, 1582. [Google Scholar] [CrossRef] [Green Version]
  33. Breulmann, M.; Schulz, E.; Van Afferden, M.; Müller, R.A. Hydrochars derived from sewage sludge: Effects of pre-treatment with water on char properties, phytotoxicity and chemical structure. Arch. Agron. Soil Sci. 2017, 64, 860–872. [Google Scholar] [CrossRef]
  34. Liu, T.; Liu, Z.; Zheng, Q.; Lang, Q.; Xia, Y.; Peng, N. Effect of hydrothermal carbonization on migration and environmental risk of heavy metals in sewage sludge during pyrolysis. Bioresour. Technol. 2018, 247, 282–290. [Google Scholar] [CrossRef]
  35. Chen, C.; Liu, G.; An, Q.; Lin, L.; Shang, Y.; Wan, C. From wasted sludge to valuable biochar by low temperature hydrothermal carbonization treatment: Insight into the surface characteristics. J. Clean. Prod. 2020, 263, 1–9. [Google Scholar] [CrossRef]
  36. Zhai, Y.; Peng, C.; Xu, B.; Wang, T.; Li, C. Hydrothermal carbonisation of sewage sludge for char production with different waste biomass: Effects of reaction temperature and energy recycling. Energy 2017, 127, 167–174. [Google Scholar] [CrossRef]
  37. Wang, R.; Wang, C.; Zhao, Z.; Jia, J.; Jin, Q. Energy recovery from high-ash municipal sewage sludge by hydrothermal carbonization: Fuel characteristics of biosolid products. Energy 2019, 186, 115848. [Google Scholar] [CrossRef]
  38. Zheng, X.; Jiang, Z.; Ying, Z.; Song, J.; Chen, W.; Wang, B. Role of feedstock properties and hydrothermal carbonization conditions on fuel properties of sewage sludge-derived hydrochar using multiple linear regression technique. Fuel 2020, 271, 1–11. [Google Scholar] [CrossRef]
  39. Xu, Z.-X.; Song, H.; Li, P.-J.; He, Z.-X.; Wang, Q.; Wang, K.; Duan, P.-G. Hydrothermal carbonization of sewage sludge: Effect of aqueous phase recycling. Chem. Eng. J. 2020, 387, 1–12. [Google Scholar] [CrossRef]
  40. Vardon, D.R.; Sharma, B.K.; Scott, J.; Yu, G.; Wang, Z.; Schideman, L.; Zhang, Y.; Strathmann, T.J. Chemical properties of biocrude oil from the hydrothermal liquefaction of Spirulina algae, swine manure, and digested anaerobic sludge. Bioresour. Technol. 2011, 102, 8295–8303. [Google Scholar] [CrossRef]
  41. Hao, X.D.; Li, J.; van Loosdrecht, M.C.M.; Li, T.Y. A sustainability-based evaluation of membrane bioreactors over conventional activated sludge processes. J. Environ. Chem. Eng. 2018, 6, 2597–2605. [Google Scholar] [CrossRef]
  42. Manser, R.; Gujer, W.; Siegrist, H. Membrane bioreactor versus conventional activated sludge system: Population dynamics of nitrifiers. Water Sci. Technol. 2005, 52, 417–425. [Google Scholar] [CrossRef]
  43. APHA. Standard Methods for the Examination of Water and Wastewater, 22th ed.; American Public Health Association: Washington, DC, USA, 2012. [Google Scholar]
  44. Fiori, L.; Basso, D.; Castello, D.; Baratieri, M. Hydrothermal carbonization of biomass: Design of a batch reactor and preliminary experimental results. Chem. Eng. Trans. 2014, 37, 55–60. [Google Scholar]
  45. Basso, D.; Weiss-Hortala, E.; Patuzzi, F.; Castello, D.; Baratieri, M.; Fiori, L. Hydrothermal carbonization of off-specification compost: A byproduct of the organic municipal solid waste treatment. Bioresour. Technol. 2015, 182, 217–224. [Google Scholar] [CrossRef] [Green Version]
  46. Basso, D.; Patuzzi, F.; Castello, D.; Baratieri, M.; Rada, C.E.; Weiss-Hortala, E.; Fiori, L. Agro-industrial waste to solid biofuel through hydrothermal carbonization. Waste Manag. 2016, 47, 114–121. [Google Scholar] [CrossRef] [PubMed] [Green Version]
  47. Hunt, J.E. Argonne Premium Coal Sample Program; Argonne: Lemont, IL, USA, 2007. Available online: https://publications.anl.gov/anlpubs/2007/04/58856.pdf (accessed on 4 June 2020).
  48. Celaya, A.A.M.; Lade, A.T.A.; Goldfarb, J.J.L. Co-combustion of brewer’s spent grains and Illinois No. 6 coal: Impact of blend ratio on pyrolysis and oxidation behavior. Fuel Process. Technol. 2015, 129, 39–51. [Google Scholar] [CrossRef]
  49. Xue, J.; Chellappa, T.; Ceylan, S.; Goldfarb, J.L. Enhancing biomass + coal Co-firing scenarios via biomass torrefaction and carbonization: Case study of avocado pit biomass and Illinois No. 6 coal. Renew. Energy 2018, 122, 152–162. [Google Scholar] [CrossRef]
  50. Andreottola, G.; Foladori, P.; Ferrai, M.; Ziglio, G. Respirometria Applicata Alla Depurazione Delle Acque; Principi e metodi; Department of Civil, Environmental and Mechanical Enginnering, University of Trento: Trento, Italy, 2002. [Google Scholar]
  51. Ren, W.; Zhou, Z.; Jiang, L.M.; Hu, D.; Qiu, Z.; Wei, H.; Wang, L. A cost-effective method for the treatment of reject water from sludge dewatering process using supernatant from sludge lime stabilization. Sep. Purif. Technol. 2015, 142, 123–128. [Google Scholar] [CrossRef]
  52. Al Momani, F.A.; Örmeci, B. Optimization of polymer dose based on residual polymer concentration in dewatering supernatant. Water Air Soil Pollut. 2014, 225. [Google Scholar] [CrossRef]
  53. Volpe, M.; Goldfarb, J.L.; Fiori, L. Hydrothermal carbonization of Opuntia ficus indica cladodes: Role of process parameters on hydrochar properties. Bioresour. Technol. 2018, 247, 310–318. [Google Scholar] [CrossRef]
  54. Jomaa, S.; Shanableh, A.; Khalil, W.; Trebilco, B. Hydrothermal decomposition and oxidation of the organic component of municipal and industrial waste products. Adv. Environ. Res. 2003, 7, 647–653. [Google Scholar] [CrossRef]
  55. Kocsisová, T.; Juhasz, J.; Cvengroš, J. Hydrolysis of fatty acid esters in subcritical water. Eur. J. Lipid Sci. Technol. 2006, 108, 652–658. [Google Scholar] [CrossRef]
  56. Díaz, E.; Pintado, L.; Faba, L.; Ordóñez, S.; González-LaFuente, J.M. Effect of sewage sludge composition on the susceptibility to spontaneous combustion. J. Hazard. Mater. 2019, 361, 267–272. [Google Scholar] [CrossRef]
  57. Berge, N.D.; Ro, K.S.; Mao, J.; Flora, J.R.V.; Chappell, M.A.; Bae, S. Hydrothermal Carbonization of Municipal Waste Streams. Environ. Sci. Technol. 2011, 45, 5696–5703. [Google Scholar] [CrossRef]
  58. Kruse, A.; Koch, F.; Stelzl, K.; Wüst, D.; Zeller, M. Fate of Nitrogen during Hydrothermal Carbonization. Energy Fuels 2016, 30, 8037–8042. [Google Scholar] [CrossRef]
  59. Volpe, M.; Fiori, L. From olive waste to solid biofuel through hydrothermal carbonisation: The role of temperature and solid load on secondary char formation and hydrochar energy properties. J. Anal. Appl. Pyrolysis 2017, 124, 63–72. [Google Scholar] [CrossRef]
  60. Volpe, M.; Wüst, D.; Merzari, F.; Lucian, M.; Andreottola, G.; Kruse, A.; Fiori, L. One stage olive mill waste streams valorisation via hydrothermal carbonisation. Waste Manag. 2018, 80, 224–234. [Google Scholar] [CrossRef] [PubMed]
  61. Ekpo, U.; Ross, A.B.; Camargo-Valero, M.A.; Williams, P.T. A comparison of product yields and inorganic content in process streams following thermal hydrolysis and hydrothermal processing of microalgae, manure and digestate. Bioresour. Technol. 2016, 200, 951–960. [Google Scholar] [CrossRef] [PubMed]
  62. Ferrentino, R.; Ceccato, R.; Marchetti, V.; Andreottola, G.; Fiori, L. Sewage Sludge Hydrochar: An Option for Removal of Methylene Blue from Wastewater. Appl. Sci. 2020, 10, 3445. [Google Scholar] [CrossRef]
  63. Zornoza, R.; Moreno-Barriga, F.; Acosta, J.A.; Muñoz, M.A.; Faz, A. Stability, nutrient availability and hydrophobicity of biochars derived from manure, crop residues, and municipal solid waste for their use as soil amendments. Chemosphere 2016, 144, 122–130. [Google Scholar] [CrossRef]
  64. Wu, H.; Lai, C.; Zeng, G.; Liang, J.; Chen, J.; Xu, J.; Dai, J.; Li, X.; Liu, J.; Chen, M.; et al. The interactions of composting and biochar and their implications for soil amendment and pollution remediation: A review. Crit. Rev. Biotechnol. 2017, 37, 754–764. [Google Scholar] [CrossRef]
  65. Melo, T.M.; Bottlinger, M.; Schulz, E.; Leandro, W.M.; Filho, A.M.D.A.; Wang, H.; Ok, Y.S.; Rinklebe, J. Plant and soil responses to hydrothermally converted sewage sludge (sewchar). Chemosphere 2018, 206, 338–348. [Google Scholar] [CrossRef] [PubMed]
  66. Thomsen, P.T.; Zsuzsa, S.; Ahrenfeldt, J.; Henriksen, U.B.; Frandsen, F.J.; Müller-st, D.S. Changes imposed by pyrolysis, thermal gasi fi cation and incineration on composition and phosphorus fertilizer quality of municipal sewage sludge. J. Environ. Manag. 2017, 198, 308–318. [Google Scholar] [CrossRef] [Green Version]
  67. Dwivedi, A.D.; Dubey, S.P.; Sillanp, M.; Kwon, Y.N.; Lee, C.; Varma, R.S. Fate of engineered nanoparticles: Implications in the environment. Coord. Chem. Rev. 2015, 287, 64–78. [Google Scholar] [CrossRef]
  68. Wang, Y.; Westerhoff, P.; Hristovski, K.D. Fate and biological effects of silver, titanium dioxide, and C60(fullerene) nanomaterials during simulated wastewater treatment processes. J. Hazard. Mater. 2012, 201–202, 16–22. [Google Scholar] [CrossRef] [PubMed]
  69. Dinelli, E.; Lima, A.; Albanese, S.; Birke, M.; Cicchella, D.; Giaccio, L.; Valera, P.; De Vivo, B. Major and trace elements in tap water from Italy. J. Geochem. Explor. 2012, 112, 54–75. [Google Scholar] [CrossRef]
  70. International Biochar Initiative. Standardized Product Definition and Product Testing Guidelines for Biochar That Is Used in Soil. 2015. Available online: https://www.biochar-international.org/wp-content/uploads/2018/04/IBI_Biochar_Standards_V2.1_Final.pdf (accessed on 4 June 2020).
  71. Giammanco, S.; Valenza, M.; Pignato, S.; Giammanco, G. Mg, Mn, Fe, and V Concentration in the Ground Waters of Mount Etna (Sicily). Water Res. 1996, 30, 378–386. [Google Scholar] [CrossRef]
  72. Roccaro, P.; Barone, C.; Mancini, G.; Vagliasindi, F.G.A. Removal of manganese from water supplies intended for human consumption: A case study. Desalination 2007, 210, 205–214. [Google Scholar] [CrossRef]
  73. Varrica, D.; Tamburo, E.; Dongarrà, G. Sicilian bottled natural waters: Major and trace inorganic components. Appl. Geochem. 2013, 34, 102–113. [Google Scholar] [CrossRef]
  74. Roccaro, P.; Vagliasindi, F.G.A. Coprecipitation of vanadium with iron(III) in drinking water: A pilot-scale study. Desalin. Water Treat. 2015, 55, 799–809. [Google Scholar] [CrossRef]
  75. Kruse, A.; Funke, A.; Titirici, M.-M. Hydrothermal conversion of biomass to fuels and energetic materials. Curr. Opin. Chem. Biol. 2013, 17, 515–521. [Google Scholar] [CrossRef]
  76. Goldfarb, J.L.; Liu, C. Impact of blend ratio on the co-firing of a commercial torrefied biomass and coal via analysis of oxidation kinetics. Bioresour. Technol. 2013, 149, 208–215. [Google Scholar] [CrossRef]
  77. Khan, A.A.; de Jong, W.; Jansens, P.J.; Spliethoff, H. Biomass combustion in fluidized bed boilers: Potential problems and remedies. Fuel Process. Technol. 2009, 90, 21–50. [Google Scholar] [CrossRef]
  78. Haykiri-Acma, H.; Yaman, S.; Kucukbayrak, S. Does carbonization avoid segregation of biomass and lignite during co-firing? Thermal analysis study. Fuel Process. Technol. 2015, 137, 312–319. [Google Scholar] [CrossRef]
  79. Cartmell, E.; Gostelow, P.; Riddell-black, D.; Simms, N.; Oakey, J.; Morris, J.O.E.; Jeffrey, P.; Howsam, P. Biosolids-A Fuel or a Waste? An Integrated Appraisal of Five Co-combustion Scenarios with Policy Analysis. Environ. Sci. Technol. 2006, 40, 649–658. [Google Scholar] [CrossRef] [Green Version]
  80. Xiao, H.; Ma, X.; Liu, K. Co-combustion kinetics of sewage sludge with coal and coal gangue under different atmospheres. Energy Convers. Manag. 2010, 51, 1976–1980. [Google Scholar] [CrossRef]
  81. Otero, M.; Calvo, L.F.; Gil, M.V.; Garcia, A.I.; Moran, A. Co-combustion of different sewage sludge and coal: A non-isothermal thermogravimetric kinetic analysis. Bioresour. Technol. 2008, 99, 6311–6319. [Google Scholar] [CrossRef]
  82. Parshetti, G.K.; Liu, Z.; Jain, A.; Srinivasan, M.P.; Balasubramanian, R. Hydrothermal carbonization of sewage sludge for energy production with coal. Fuel 2013, 111, 201–210. [Google Scholar] [CrossRef]
  83. Gao, L.; Volpe, M.; Lucian, M.; Fiori, L.; Goldfarb, J.L. Does hydrothermal carbonization as a biomass pretreatment reduce fuel segregation of coal-biomass blends during oxidation? Energy Convers. Manag. 2019, 181, 93–104. [Google Scholar] [CrossRef]
  84. Fregolente, L.G.; Miguel, T.B.A.R.; de Castro Miguel, E.; de Almeida Melo, C.; Moreira, A.B.; Ferreira, O.P.; Bisinoti, M.C. Toxicity evaluation of process water from hydrothermal carbonization of sugarcane industry by-products. Environ. Sci. Pollut. Res. 2019, 26, 27579–27589. [Google Scholar] [CrossRef] [PubMed] [Green Version]
  85. Barlindhaug, J.; Ødegaard, H. Thermal hydrolysis for the production of carbon source for denitrification. Water Sci. Technol. 1996, 34, 371–378. [Google Scholar] [CrossRef]
  86. Friedman, A.A.; Smith, J.E.; DeSantis, J.; Ptak, T.; Ganley, R.C. Characteristics of Residues from Wet Air Oxidation of Anaerobic Sludges. J. (Water Pollut. Control Fed.) 1988, 60, 1971–1978. [Google Scholar]
  87. Wirth, B.; Reza, T.; Mumme, J. Influence of digestion temperature and organic loading rate on the continuous anaerobic treatment of process liquor from hydrothermal carbonization of sewage sludge. Bioresour. Technol. 2015, 198, 215–222. [Google Scholar] [CrossRef]
  88. Aragón-briceño, C.; Ross, A.B.; Camargo-valero, M.A. Evaluation and comparison of product yields and bio-methane potential in sewage digestate following hydrothermal treatment. Appl. Energy 2017, 208, 1357–1369. [Google Scholar] [CrossRef]
  89. Villamil, J.A.; Mohedano, A.F.; Rodriguez, J.J.; de la Rubia, M.A. Valorisation of the liquid fraction from hydrothermal carbonisation of sewage sludge by anaerobic digestion. J. Chem. Technol. Biotechnol. 2018, 93, 450–456. [Google Scholar] [CrossRef]
  90. Qiao, W.; Peng, C.; Wang, W.; Zhang, Z. Biogas production from supernatant of hydrothermally treated municipal sludge by upflow anaerobic sludge blanket reactor. Bioresour. Technol. 2011, 21, 9904–9911. [Google Scholar] [CrossRef]
  91. Appels, L.; Dewil, R.; Baeyens, J.; Degrève, J. Ultrasonically enhanced anaerobic digestion of waste activated sludge. Int. J. Sustain. Eng. 2008, 1, 94–104. [Google Scholar] [CrossRef]
  92. Vavilin, V.A.; Rytov, S.V.; Lokshina, L.Y. A Description of Hydrolysis Kinetics in Aanaerobic Degradation of Particulate Organic Matter. Bioresour. Technol. 1996, 56, 229–237. [Google Scholar] [CrossRef]
  93. Nuchdang, S.; Frigon, J.; Roy, C.; Pilon, G.; Phalakornkule, C.; Guiot, S.R. Hydrothermal post-treatment of digestate to maximize the methane yield from the anaerobic digestion of microalgae. Waste Manag. 2018, 71, 683–688. [Google Scholar] [CrossRef] [PubMed]
  94. Stutzenstein, P.; Weiner, B.; Köhler, R.; Pfeifer, C.; Kopinke, F.D. Wet oxidation of process water from hydrothermal carbonization of biomass with nitrate as oxidant. Chem. Eng. J. 2018, 339, 1–6. [Google Scholar] [CrossRef]
  95. Luz, F.C.; Volpe, M.; Fiori, L.; Manni, A.; Cordiner, S.; Mulone, V.; Rocco, V. Spent Coffee Enhanced Biomethane Potential via an Integrated Hydrothermal Carbonization-Anaerobic Digestion Process. Bioresour. Technol. 2018, 256, 102–109. [Google Scholar]
  96. Singh, A.; Sharma, R.K.; Agrawal, M.; Marshall, F.M. Risk assessment of heavy metal toxicity through contaminated vegetables from waste water irrigated area of Varanasi, India. Trop. Ecol. 2010, 51, 375–387. [Google Scholar]
  97. Shi, L.; Zhang, G.; Wei, D.; Yan, T.; Xue, X.; Shi, S.; Wei, Q. Preparation and utilization of anaerobic granular sludge-based biochar for the adsorption of methylene blue from aqueous solutions. J. Mol. Liq. 2014, 198, 334–340. [Google Scholar] [CrossRef]
  98. Stark, K.; Plaza, E.; Hultman, B. Phosphorus release from ash, dried sludge and sludge residue from supercritical water oxidation by acid or base. Chemosphere 2006, 62, 827–832. [Google Scholar] [CrossRef]
  99. Yoshizaki, S.; Tomida, T. Principle and Process of Heavy Metal Removal from Sewage Sludge. Environ. Sci. Technol. 2000, 34, 1572–1574. [Google Scholar] [CrossRef]
  100. Hotova, G.; Slovak, V.; Soares, O.S.G.P.; Figueiredo, J.L.; Pereira, M.F.R. Oxygen surface groups analysis of carbonaceous samples pyrolysed at low temperature. Carbon 2018, 134, 255–263. [Google Scholar] [CrossRef]
  101. Liang, B.; Lehmann, J.; Solomon, D.; Kinyangi, J.; Grossman, J.; Skjemstad, J.O.; Thies, J.; Luiza, F.J.; Petersen, J.; Neves, E.G. Black Carbon Increases Cation Exchange Capacity in Soils. Soil Sci. Soc. Am. J. 2006, 1719–1730. [Google Scholar] [CrossRef] [Green Version]
  102. Goldfarb, J.L.; Dou, G.; Salari, M.; Grinstaff, M.W. Biomass-Based Fuels and Activated Carbon Electrode Materials: An Integrated Approach to Green Energy Systems. ACS Sustain. Chem. Eng. 2017, 5, 3046–3054. [Google Scholar] [CrossRef]
  103. Isitan, S.; Ceylan, S.; Topcu, Y.; Hintz, C.; Tefft, J.; Chellappa, T.; Guo, J.; Goldfarb, J.L. Product quality optimization in an integrated biorefinery: Conversion of pistachio nutshell biomass to biofuels and activated biochars via pyrolysis. Energy Convers. Manag. 2016, 127, 576–588. [Google Scholar] [CrossRef] [Green Version]
  104. Goldfarb, J.L.; Buessing, L.; Gunn, E.; Lever, M.; Billias, A.; Casoliba, E.; Schievano, A.; Adani, F. Novel Integrated Biorefinery for Olive Mill Waste Management: Utilization of Secondary Waste for Water Treatment. ACS Sustain. Chem. Eng. 2017, 5, 876–884. [Google Scholar] [CrossRef]
  105. Gopu, C.; Gao, L.; Volpe, M.; Fiori, L.; Goldfarb, J.L. Valorizing municipal solid waste: Waste to energy and activated carbons for water treatment via pyrolysis. J. Anal. Appl. Pyrolysis 2018, 133, 48–58. [Google Scholar] [CrossRef]
Figure 1. Schematic of wastewater treatment plant in Trento, Italy, identifying three sludge samples (Thickened—Pipe 3; Digested—Pipe 4; Dewatered—Pipe 5) used in the present work.
Energies 13 02890 g001
Figure 2. Changes in volatile matter, fixed carbon, and ash composition as a result of hydrothermal carbonization: (a) Thickened sludge, 30 min of Hydrothermal Carbonization (HTC); (b) Thickened sludge, 60 min HTC; (c) Digested sludge, 30 min HTC; (d) Digested sludge, 60 min HTC; (e) Dewatered sludge, 30 min HTC—note 190 °C Fixed Carbon (FC) and Volatile Matter (VM) data points overlap; (f) Dewatered sludge, 60 min HTC.
Energies 13 02890 g002
Figure 3. Changes in ultimate analysis as a result of hydrothermal carbonization: (a) Thickened sludge, 30 min HTC; (b) Thickened sludge, 60 min HTC; (c) Digested sludge, 30 min HTC; (d) Digested sludge, 60 min HTC; (e) Dewatered sludge, 30 min HTC; (f) Dewatered sludge, 60 min HTC.
Energies 13 02890 g003
Figure 4. Van Krevelen diagram of raw and hydrothermally carbonized sludge samples with: (a) all samples; (b) thickened sludge; (c) dewatered sludge; (d) digested sludge.
Energies 13 02890 g004
Figure 5. Impact of hydrothermal carbonization on nutrient and heavy metals concentrations for: (a) Al; (b) Ca; (c) Mg; (d) K; (e) Ag; (f) V; (g) Cr; (h) Ni; (i) Co; (j) Mo; (k) As; (l) Pb.
Energies 13 02890 g005
Figure 6. Derivative thermogravimetric curves of oxidation: (a) thickened sludge and hydrochars; (b) digested sludge and hydrochars; (c) dewatered sludge and hydrochars, produced at 30 min alongside Illinois No 6. Coal.
Energies 13 02890 g006
Table 1. Characteristics of raw thickened sludge, raw digested sludge, and raw dewatered sludge and products of hydrothermal carbonization of thickened, digested, and dewatered sludge.
Property Thickened SludgeDigested SludgeDewatered Sludge
Moisture Content (wt%)97.1 ± 0.197.1 ± 0.374.9 ± 0.1
Total Solids (g/L)29.1 ± 0.429.0 ± 2.3n.a.
Fixed + Volatile Solids (g/L)26.7 ± 0.415.4 ± 0.9n.a.
HTC Temp (°C)30 min HTC60 min HTC30 min HTC60 min HTC30 min HTC60 min HTC
Total COD (g/L)Raw28.1 ± 1.418.0 ± 0.9193.2 ± 0.3 a
19014.1±2.015.3±0.79.1±0.29.3±0.455.3±1.456.3±2.7
22015.4±1.415.1±1.111.3±1.29.9±0.156.7±8.254.1±0.3
25018.4±0.718.4±1.810.4±0.78.8±0.464.9±8.257.5±0.3
Soluble COD (g/L)Raw2.3 ± 0.10.4 ± 0.147.2 ± 2.4 a
19010.5±1.013.4±0.46.4±0.36.7±0.549.8±0.455.1±2.8
22011.9±1.513.5±0.56.7±0.36.7±0.544.8±3.445.7±5.5
25015.3±0.913.7±0.18.3±0.85.7±0.257.5±9.846.8±0.6
pHRaw7.21 ± 0.18.42 ± 0.017.0 ± 0.0
1906.0±0.05.3±0.07.1±0.26.8±0.06.0±0.16.0±0.0
2206.0±0.06.1±0.06.8±0.06.2±0.16.0±0.05.9±0.0
2505.8±0.16.0±0.07.3±0.66.9±0.16.0±0.05.5±0.0
Total Phosphorous in Liquid (mg/L)Raw175.00 ± 9.00187.00 ± 9.0010.00 ± 1.00 a
19032.5±0.138.4±0.119.6±0.322.7±0.10.3±0.00.4±0.0
22020.2±0.116.4±0.219.8±0.317.8±0.10.2±0.00.2±0.0
25016.1±0.111.1±0.219.3±0.312.2±0.10.2±0.00.2±0.0
Total Phosphorous in Solid (mg/g)Raw5.22 ± 0.105.81 ± 0.139.22 ± 0.33
1906.2±0.76.8±0.47.2±0.77.4±1.49.2±0.59.4±0.4
2207.8±0.39.4±0.27.5±0.57.5±1.510.5±0.210.6±0.2
2509.9±0.510.2±4.67.4±0.96.7±1.210.8±0.810.9±0.9
Organic Nitrogen in Liquid (g/L)Raw0.470 ± 0.2300.880 ± 0.01011.023 ± 0.551 a
1900.1±0.00.1±0.01.3±0.01.2±0.04.5±1.04.1±0.2
2200.1±0.00.1±0.01.4±0.00.9±0.02.4±0.61.5±0.1
2500.1±0.00.1±0.01.3±0.01.5±0.01.7±0.31.4±0.7
Ammonia Nitrogen in Liquid (g/L)Raw0.490 ± 0.0100.880 ± 0.0100.598 ± 0.030 a
1900.4±0.00.6±0.00.7±0.00.7±0.02.7±0.13.8±0.2
2200.4±0.00.5±0.00.8±0.01.0±0.04.4±0.34.6±0.6
2500.6±0.00.6±0.01.0±0.00.8±0.06.9±0.46.5±0.4
aras received, n.a.—not applicable, a Based on 1g of dry biomass dissolved in one liter of distilled water, HTC—Hydrothermal Carbonization.
Table 2. Products yields and analysis of solid fuel characteristics of raw feedstocks and hydrochars from thickened, digested, and dewatered sludge.
PropertyHTC Temp (°C)Thickened SludgeDigested SludgeDewatered Sludge
30 min HTC60 min HTC30 min HTC60 min HTC30 min HTC60 min HTC
Process Yields (dry basis)
Solid Yield (wt%)19077.2±4.767.0±11.082.8±8.981.5±8.988.2±2.085.6±0.0
22060.6±8.857.2±3.464.6±6.470.6±3.475.1±1.075.2±0.3
25049.4±4.852.0±6.278.1±7.864.9±3.767.6±2.566.8±0.2
Gas Yield (wt%)1902.5±0.02.7±0.23.7±0.94.7±0.32.1±1.42.6±0.2
2204.1±0.74.2±0.45.1±1.35.6±1.03.7±0.14.3±0.6
2506.3±1.67.2±1.36.1±2.17.6±1.95.1±0.25.9±0.1
Liquid Yield (wt%)19020.3±2.434.9±5.443.2±4.943.1±4.645.2±1.744.1±0.1
22035.3±4.730.7±1.934.8±3.938.1±2.239.4±0.639.7±0.4
25044.3±3.229.6±3.842.1±5.036.3±2.836.4±1.336.4±0.2
Ultimate Analysis (dry basis)
C (wt%)Raw45.96±0.2045.96±0.2025.60±0.3325.60±0.3335.91±0.2535.91±0.25
19044.56±0.3946.11±0.3919.22±1.3714.16±2.5736.61±0.0235.07±0.23
22044.86±0.5143.15±0.1911.70±0.6410.21±0.5835.19±0.1735.75±0.31
25041.68±0.2941.21±0.5212.51±0.2612.02±0.0535.30±0.1835.57±0.08
H (wt%)Raw6.57±0.026.57±0.023.96±0.063.96±0.065.42±0.005.42±0.00
1906.24±0.086.46±0.062.63±0.162.00±0.294.92±0.024.61±0.03
2205.95±0.015.69±0.021.61±0.081.37±0.074.32±0.014.36±0.03
2505.03±0.055.01±0.031.65±0.011.56±0.024.11±0.004.05±0.01
N (wt%)Raw4.26±0.004.26±0.003.59±0.103.59±0.105.81±0.025.81±0.02
1902.23±0.072.10±0.071.58±0.071.07±0.174.27±0.063.95±0.01
2201.87±0.241.86±0.070.80±0.080.66±0.013.48±0.023.45±0.02
2501.89±0.051.99±0.040.70±0.000.69±0.023.16±0.043.12±0.02
O (wt%)Raw27.61±4.8627.61±4.8621.16±0.7921.16±0.7923.52±0.5223.52±0.52
19028.52±6.6925.97±4.6318.43±3.5015.67±6.8918.55±0.1719.33±0.58
22025.51±6.3426.43±5.0612.35±1.0318.93±1.1016.53±0.3315.34±0.49
25022.47±6.4421.59±3.8311.72±2.007.17±2.5314.07±0.4414.12±2.18
Proximate Analysis (dry basis)
Fixed Carbon (wt%)Raw12.56±1.4312.56±1.434.76±3.784.76±3.785.90±0.625.90±0.62
1904.25±2.504.58±1.751.70±0.092.06±0.345.37±0.239.94±6.93
2205.37±4.005.23±3.971.26±0.070.13±0.014.04±2.069.83±5.58
2505.31±5.856.12±5.930.62±0.051.38±0.096.27±0.617.02±0.03
Volatile Matter (wt%)Raw72.48±3.1972.48±3.1950.25±3.5150.25±3.5165.67±0.5065.67±0.50
19070.84±6.6571.03±5.3641.09±3.2230.84±4.2058.98±0.2953.02±6.61
22066.05±5.5663.57±7.8126.17±1.5931.99±0.9055.48±2.1949.07±5.72
25060.06±2.1956.70±3.9525.97±1.6821.65±4.6850.37±0.3949.85±2.03
Ash (Inorganic) (wt%)Raw14.96±2.3114.96±2.3144.99±3.6544.99±3.6528.43±0.5628.43±0.56
19024.91±4.5724.40±3.5657.21±1.6167.10±2.2735.66±0.2637.05±6.77
22028.58±4.7831.20±5.8972.57±0.8067.88±0.4540.48±2.1341.10±5.65
25034.63±4.0237.18±4.9473.42±0.8676.97±2.3443.36±0.5043.14±1.03
Combustion Analysis
HHV (MJ/kg)Raw20.50±0.1420.50±0.1410.66±1.7910.66±1.7916.02±0.0916.02±0.09
19019.45±0.6420.71±0.039.27±1.737.97±1.7716.30±0.1915.96±0.07
22020.06±0.9018.72±0.038.96±1.777.86±0.3915.70±0.0915.47±0.37
25018.66±0.2619.17±0.618.59±1.789.37±1.3915.98±0.1115.33±0.26

