Abstract
The wave energy converter captures the wave power by buoy’s heaving motion, transfers it by hydraulic system, and converts it into the electric power by generator. The hydraulic conversion system plays an important role that can realize the effective regulation of the output power. In order to develop the working characteristics of the hydraulic transmission system, a new wave energy experimental platform was devised. The platform adopts the matching design mode of the driving oil cylinder and the driven oil cylinder. The active hydraulic cylinder and the clump weight can simulate the movement of the oscillating float under certain sea conditions, and the driven oil cylinder realizes the conversion and the output of wave energy. In order to improve the operation accuracy of the active hydraulic cylinder, the control strategy of the active hydraulic cylinder was studied. An adaptive sliding mode control strategy based on the back-stepping method was proposed to overcome the influence of the parameter uncertainty in state equation. The adaptive law was designed by Lyapunov criterion to ensure the stability and the convergence of the closed-loop system. The proposed control strategy was verified and compared with proportional integral derivative control strategy through the concrete experiment, which shows the rapidity and the stability of it. The hydraulic transmission system of wave energy converter was developed; at the same time, the characteristics of hydraulic regulation under different working conditions were summarized through experiments. The results of the research could be the guidance for the power control design.
1. Introduction
Compared with other wave energy capturing devices, the oscillating floater wave power generation device is simpler to manufacture. It can adopt a hydraulic system or a mechanical system to transfer energy with high efficiency, and it is easy to collect energy that can form a large-scale power generation system [1,2,3]. Its disadvantages are that the device fails to achieve high conversion efficiency [4]. The parameter adjustment and the adaptability to a sea environment need to be improved.
The hydraulic transmission system in the wave energy utilization device is responsible for transforming the unstable wave energy of random fluctuation into relatively stable energy and outputting it [5,6]. Because the hydraulic transmission system can use the accumulator to store the hydraulic energy and buffer the random wave and the shock, it can also realize the volume speed regulation of variable motors to improve the stability of electric energy output [7,8]. Therefore, scholars all over the world use the hydraulic transmission system of wave energy power generation device as their research object. They conducted a series of targeted research on wave energy conversion efficiency, energy output stability, and system reliability [9,10]. The main research methods include mathematical mode analysis, simulation, and prototype experiment. It has been proven that hydraulic technology has many advantages in wave energy utilization devices [11,12]. Through the optimization of the mechanical system design and the energy output design, the hydraulic transmission system is effectively used in the existing offshore power generation device [13,14].
Because of the huge cost of ocean testing, it is an effective research strategy to use a semi physical experiment platform to develop the working characteristics of the equipment before the actual ocean test. However, design and control of the experiment platform are complicated, which is the key technical problem to be solved [15,16]. Because it contains the nonlinear factors caused by viscous damping force, inertia force, and friction force of the mechanical system as well as the nonlinear dynamics and the parameter uncertainty of the hydraulic system itself, traditional control strategies have difficultly achieving ideal control performances under different conditions; it is also difficult to ensure the stability and the real-time control in the full requirement. The application of advanced non-linear control strategies to overcome the effects of parameter uncertainty and nonlinearities, system uncertain delayed, and external interference is a current research focus and development direction [17,18].
The starting point of this project was to design an experimental device. According to the condition of complex disturbance parameters, the control strategy of the wave power experiment platform was designed by using the adaptive back-stepping sliding mode control strategy. The proposed controller was devised to ensure a better displacement tracking accuracy regardless of parameter nonlinearities and uncertainties. An adaption law was also included in this controller to effectively compensate for external disturbances and uncertainties. The desired force is planned to guarantee the boundedness of the internal state, and the position controller is used to track the required state variable. The main contributions are summarized as follows.
A wave power generation experiment platform was designed that can be used to develop the working characteristics and the control strategies of the power generation device under different working conditions. It also can provide the experimental basis for the marine engineering test and strengthen the stability and the security. A displacement tracking control strategy based on back-stepping and adaptive control algorithm was devised, and the control strategy can solve the problems caused by nonlinear parameters and unknown interference as well as improve the rapidity and the validity of displacement tracking. Through the comparative test, the rationality of experiment platform design and the effectiveness of the control strategy were verified, the working characteristics of the hydraulic transmission system were studied, and the dynamic properties of the hydraulic parameters under different working conditions were revealed. The influence of the system parameters on the absorption of pressure shock and flow pulsation of the hydraulic system was clarified, which provided the basis for the optimal design of the wave power transmission system. The design method of the nonlinear control strategy and the study of dynamic characteristics regulation law of hydraulic system can provide a theoretical basis for the research of other marine engineering equipment.
The rest of this paper is organized as follows. In the second part, methods and principles of the semi physical experimental platform are introduced. In the third part, the mathematical model on the control strategy is built; meanwhile, the control strategy is verified and analyzed through experiments. The working characteristics of the hydraulic transmission system are also presented. The final section is the conclusion.
2. Methods and Principles
2.1. Power Generation Principle
Figure 1 shows a heaving float wave energy power generation device designed by our team. Figure 1a is bracing and agent architectures of the device, and Figure 1b is the work principle sketch diagram of it. The device is mainly composed of wave energy conversion system, hydraulic energy transfer system, electric energy consumption system, and control detection system.
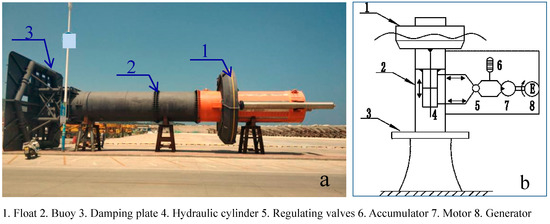
Figure 1.
The heaving float wave energy power generation device. (a) Bracing and agent architectures, (b) work principle sketch diagram.
It uses the hydraulic transmission system as energy transmission to improve the stability of electric energy output.
The wave energy collection system can convert the wave energy into mechanical energy of float. The movement of float can alter the mechanical energy to hydraulic energy, which travels through the hydraulic system and drives the motor to rotate, thus driving the generator to work and output power stably.
Figure 2 is a schematic diagram of the hydraulic energy transfer system. The double rods hydraulic cylinder improves the output energy efficiency of the hydraulic system and ensures that there is hydraulic energy discharging when the float moves up and down. Four check valves are used to constitute a hydraulic rectifier module, which guarantees that the hydraulic motor remains rotating in the same direction. The accumulator serves to turn the surplus wave energy into high pressure oil. In the case of small fluctuations, the pressurized oil is released quickly and then runs the generator at a high speed to overcome the oscillation of the power output. The relief valve is designed to open at a predetermined pressure for protecting pressure vessels and other equipment from being damaged. When the wave pushes the float to move upward along the guide column, it drives the piston rod of the hydraulic cylinder to rise and pushes the oil up the chamber into the accumulator (3) after the throttle valve (7) regulates the flow, then the hydraulic motor (8) works so that the power generator (9) operates.
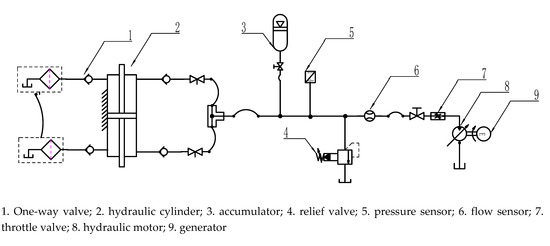
Figure 2.
Working principle of the hydraulic transmission system.
2.2. Design Principle of Experimental Platform
According to the principle of oscillating float wave energy generator, a semi physical experimental device was designed. Figure 3 reveals the principle of the experimental platform. The experimental platform consists of two subsystems: the float motion simulate system (Figure 3a) as well as the hydraulic transmission and electric power processing system (Figure 3b). The float motion simulate system is used to achieve the simulation of the float movement with different signals, while the hydraulic transmission and electric power processing system realizes the wave energy conversion and the output of electric energy. It corresponds to operating principle two of the power generation device. We took advantage of the design method of the double rod hydraulic cylinder and symmetrical arrangement. The hydraulic circuits of the two systems are relatively independent, and the hydraulic transmission system has a separate upper oil tank at the top of the device that can improve the self-priming capacity of the hydraulic cylinder.
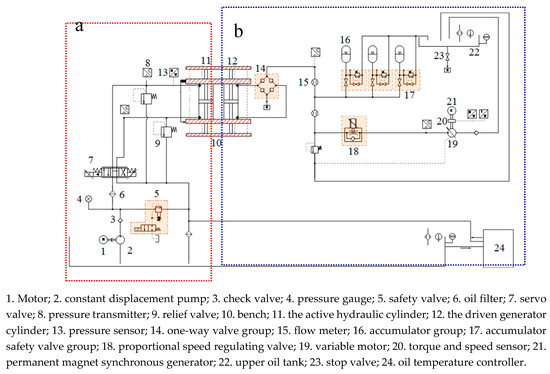
Figure 3.
Schematic diagram of wave energy power experimental platform. (a) The float motion simulate system, (b) hydraulic transmission and electric power processing system.
Because the float motion simulate system is used to realize the imitating operation of float under different wave conditions, the accurate operation of the active simulation part is the key to ensuring that the platform can realize the research function. Therefore, it was necessary to develop the control strategy according to the characteristics of wave operation. The control principle of the float motion simulate system is that the displacement sensor converts the displacement signal of the hydraulic cylinder (11) into an electrical signal and compares it with the given displacement signal to form the error signal of the closed-loop control. The given signal comes from the ocean wave information. The error signal obtained is proportionally amplified and driven by the servo valve to adjust the hydraulic oil quantity and direction so as to control the displacement speed as well as the direction of the active hydraulic cylinder. As long as there is deviation between the output displacement of the actuator and the given displacement, the control system can automatically adjust the pressure and the flow until the displacement error achieves the minimum. The driven generator cylinder can move synchronously to simulate the motion of the practical hydraulic cylinder.
2.3. Mathematical Modeling Analysis on the Main Parts of the Experimental Platform
The valve control cylinder part is the key device to simulate the reciprocating motion of the float under the action of the wave, and it is the core of the wave simulation system. Its main control mode is the servo valve control double rod hydraulic cylinder. Figure 4 shows the valve control cylinder schematic diagram, and its state equation is analyzed as follows.
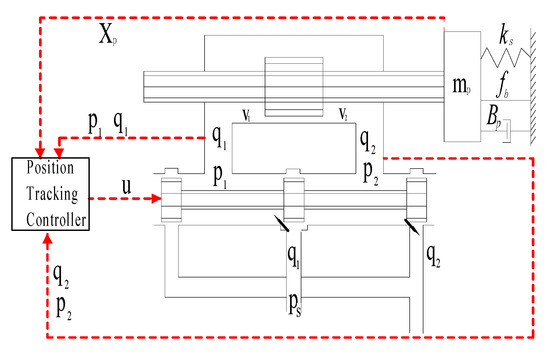
Figure 4.
Schematic diagram of servo valve control cylinder of experimental platform.
The moment equation of hydraulic cylinder is:
In formulation: is the effective area of the hydraulic cylinder, is the outlet pressure of the servo valve, is the effective piston mass, is piston viscous damping coefficient, is the stiffness coefficient, is the operating displacement of hydraulic cylinder, and is the friction force and other nonlinear forces caused by external disturbance.
The flow equation of the servo valve controlled hydraulic cylinder is as follows:
In formulation: is the discharge coefficient, is the average volume of both cylinder chambers, is the supply pressure to hydraulic source, is the equivalent volume modulus of elasticity, is the output pressure of servo valve controlled hydraulic cylinder, is the movement speed of the hydraulic cylinder, and is the leakage coefficient.
The dynamic equation of servo valve core can be expressed approximately as follows:
In formulation: is the input voltage, is the damping ratio of the electric-hydraulic servo valve, is the natural frequency of the electric-hydraulic servo valve, and is the gain of the electric-hydraulic servo valve. Then, the differential equation expression of the system is:
Define the variables and the output variables expressed respectively as:
Then, the state equation of the system is:
In the definition expression:
Then, the equation of state can be expressed as:
2.4. Establish the Control Strategy
The displacement control strategy of the hydraulic cylinder was designed based on the back-stepping method combined with adaptive control mode and sliding mode variable structure control mode. The expected displacement value of the hydraulic cylinder is defined as . The tracking error expression of the hydraulic cylinder is:
The designed integral sliding mode surface expression is as follows:
The derivation of the above formula is as follows:
The expected value of the design pressure used to control the cylinder displacement is defined as , the expected displacement of the servo spool designed to control the movement of the hydraulic cylinder is defined as , and the expected speed of the servo spool designed to control the movement of the hydraulic cylinder is defined as . The tracking error expression of pressure used to control the displacement of hydraulic cylinder, the servo valve core displacement tracking error, and the servo valve core speed tracking error are as follows:
Definition: is the evaluation value of coefficient and the error , is positive real number and satisfaction relation ; then, sorting the expression, we can get:
The expected pressure value is expressed as:
Then:
In the process of building the back-stepping control method, the way based on Lyapunov stability criterion was used to design the adaptive parameters so as to approach unknown interference. At the same time, in order to eliminate the approach error of the adaptive system, the integral sliding mode theory was employed to compensate it. During this process, the nonlinear control strategy was devised, and the control input was solved. The designed expression according to Lyapunov’s decision theorem is [19,20]:
The derivative of the above equation is:
The adaptive rate of the above equation is:
Then:
In formulation, is the positive constants, function is a saturation function, and its expression is:
In formulation, is the boundary layer and , then:
The essence of sliding mode control using saturation function is when the control signal is outside the boundary layer of the sliding mode surface, the switching control is adopted to make the system state tend to the sliding mode quickly; when the control signal reaches the boundary layer of the sliding mode, the feedback control is adopted to reduce chattering caused by rapid switching of sliding mode and improve the anti-vibration performance of the system. We continued to use the back-stepping method and got the adaptive rate as follows:
The expression of design control input is:
Through the Lyapunov’s theorem, we get:
From the above formula, we get , which ensures that the layout of the control system is stable and bounded. Summarizing the planned method of the above control strategy, we present the design diagram of displacement tracking control strategy based on back-stepping and adaptive rate, as shown in Figure 5.
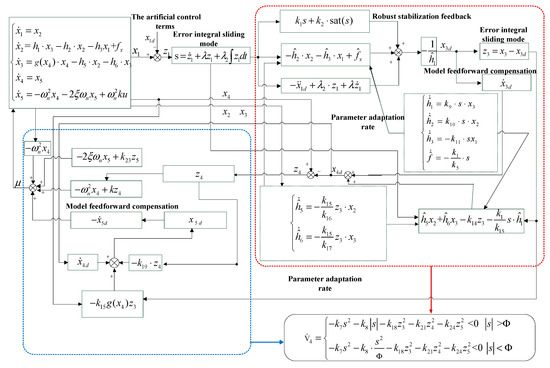
Figure 5.
Design diagram of displacement tracking control strategy based on back-stepping and adaptive control methods.
3. Results and Discussion
3.1. Experimental Setup
The wave energy experimental platform was built to develop the influence of the hydraulic transmission system, as illustrated in Figure 6. The experimental platform is mainly composed of the float motion simulator, which is employed to simulate the motion of 1500 kg floats under different motion trails. The float motion simulator mainly consists of the active hydraulic cylinder operation control system and its load, the controller, the hydraulic energy transfer system, the variable motor, as well as the generator combination and the output power management system (Figure 6a).
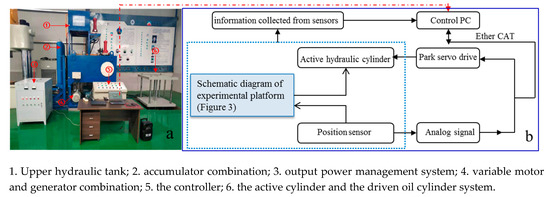
Figure 6.
Wave power experiment device and experimental principle. (a) Wave power experimental device, (b) block diagram of the experimental setup.
The hydraulic energy transfer system, including a driven hydraulic cylinder, an accumulator combination, hydraulic valves, and sensors, was built to convert the mechanical energy of simulating float motion into the hydraulic energy. The variable motor and generator combination change the hydraulic energy into electrical energy. The output power management system is employed to adjust the energy output of the generator to ensure the electric energy output stability. It mainly consists of load resistance and the power processing module; the load resistance is used to simulate different power loads of users. The target computer is applied to control the servo slave, collect various sensor information, and adjust the loading to the generator. Real-time operating parameters, such as the flow, the pressure, the torque, the displacement, the voltage, and the current are fed back to the host computer through ethernet. The software Matlab simulink and AMEsim were used to establish the control strategy in the host computer (Figure 6b). The posed hydraulic cylinder displacement control strategy was obtained by using Equations (1)–(22), while the reference controller was designed based on the proportional integral derivative (PID) algorithm [21,22]. The proposed controller was compared to a conventional hydraulic cylinder-controlled displacement system that used a PID controller.
This PID hydraulic cylinder displacement controller can be described as:
When denotes the displacement command derived from the PID pitch controller, , , , denote the proportional integral derivative gains. denotes the reference displacement, and denotes the sensor detection displacement.
3.2. Displacement Control Result Analysis of Experimental Device
The comparative experiments were carried out to evaluate the performances of the experimental device and the proposed new controller. In the first experiment, the proposed new controller was compared with PID under the same reference sine signal, and the other conditions were same. In the second experiment, the proposed new controller was compared with PID under the step response signal.
The comparison curves of the movement displacement and target displacement (REF) of the hydraulic cylinder under the action of PID control algorithm and designed control algorithm (AMCB) are shown in Figure 7, when the amplitude was 0.4 m and the period was 4 s. Figure 8 shows the error response curve. As shown in Figure 7, the conventional controller and the proposed controller can realize the effective control of active hydraulic cylinder displacement. As shown in Figure 8, the sine tracking curve error generated by the conventional controller was 0.6 mm, while the sine tracking curve error generated by the proposed controller was 0.4 mm. Thus, the proposed controller can realize the displacement control more effectively than the PID controller does.
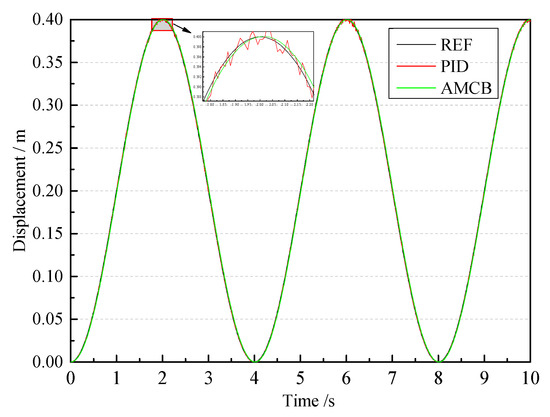
Figure 7.
Displacement response curves of hydraulic cylinder.
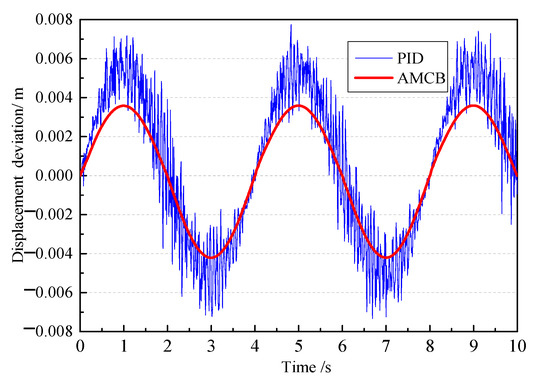
Figure 8.
Displacement error response curves.
When the target displacement of the hydraulic cylinder was 0.4 m, the comparison analysis curve of step response characteristics under PID control algorithm and AMCB control algorithm are shown in Figure 9, and the error curves are shown in Figure 10. As illustrated in Figure 9, the proposed controller could realize the step response with 0.65 s, and after reaching the step response value, it could be kept at the target value stably while the PID controller was 0.7 s. After reaching the step response value, the oscillation occurred under the uncertain interference factors. Figure 10 shows that the relative result error was 1.25% between target and observation values by using the PID controller, while the error was 0.5% by using the proposed controller. Therefore, the proposed controller can be employed to significantly reduce the fluctuations and better follow the target displacement curve.
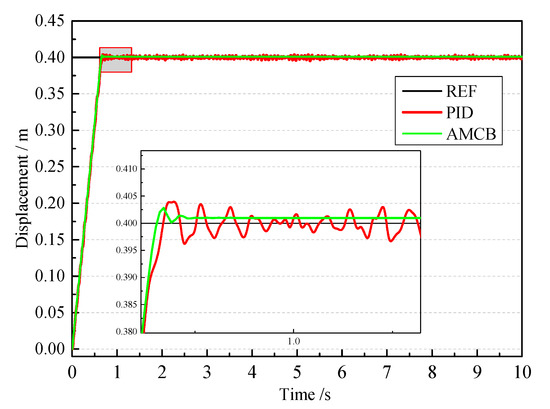
Figure 9.
Step response displacement curves of hydraulic cylinder.
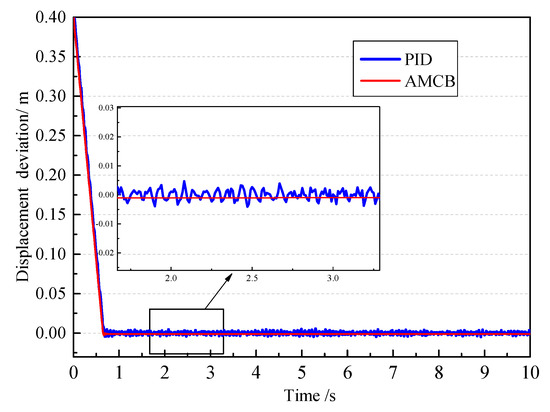
Figure 10.
Step response displacement error curves.
3.3. Working Characteristic Analysis of Hydraulic Transmission System Under Sinusoidal Displacement
Motor torque, speed, and pressure curves are shown in Figure 11 when the target displacement of the hydraulic cylinder was 0.4 m, the cycle was 6 s, loads were 1 kW, and the motor displacement was 10 mL/r. In addition, the pressure curves of the active hydraulic cylinder and the check valve output curves are shown in Figure 12. As illustrated in Figure 11, the motor speed was kept within 225 r/min, and the change rate was about 7.5%. The pressure of the motor was usually in 90 Bar, and the variation ratio was about 1%. The motor torque remained in 15 Nm, and the variability rate was about 7%. The hydraulic transmission and electric power processing system could output more stable parameters under regular waves. Figure 12 shows the pressure changes of the active hydraulic cylinder. When the hydraulic cylinder operated according to the target displacement curve, the pressure change of the upper chamber was opposite to that of the lower chamber, which was consistent with the design of the symmetrical hydraulic cylinder. The difference value of output pressure between the minimum and the maximum pressure was about 95 Bar, while, after the design of the one-way valve group, the output pressure was stable at 100 Bar. This could be beneficial to the stability treatment of electric energy. The experimental results verify the accuracy and the reliability of the experimental device.
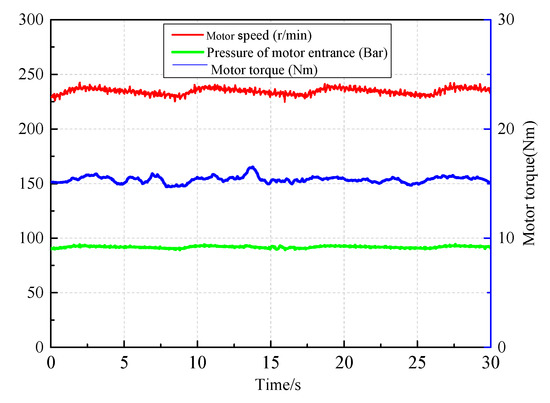
Figure 11.
Motor torque, speed, and pressure curves.
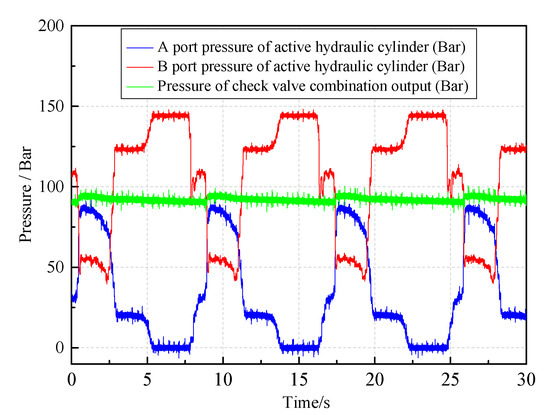
Figure 12.
Pressure curves of active hydraulic cylinder and check valve.
3.4. Working Characteristic Analysis of Hydraulic Transmission System Under Nonsinusoidal Displacement
When the target displacement of the hydraulic cylinder was nonsinusoidal and loads were 2 kW, the comparison curves of hydraulic cylinder movement displacement under the designed control algorithm (AMCB) and target displacement (REF) are shown in Figure 13. The proposed controller could realize effective control of the active hydraulic cylinder displacement. The tracking curve error was about 0.5 mm. This further verified the effectiveness of the control strategy. Figure 14 shows the pressure changes of the active hydraulic cylinder when the hydraulic cylinder was being operated according to the target displacement curve. Although the movement displacement was irregular, the output pressure was still stable at about 70 Bar after the one-way valve group. The motor speed and the flow curves in front of the accumulator are shown in Figure 15. When the displacement difference of the hydraulic cylinder became smaller and kept stable, the flow into the accumulator altered from 2.5 L/min–5.3 L/min to 4 L/min–5.2 L/min and held steady. The hydraulic oil entering the accumulator overlapped with the hydraulic oil stored in the accumulator, which made the flow enter the motor and showed an increasing trend, thus the motor speed increased slowly, and the maximum speed could arrive at 160 r/min.
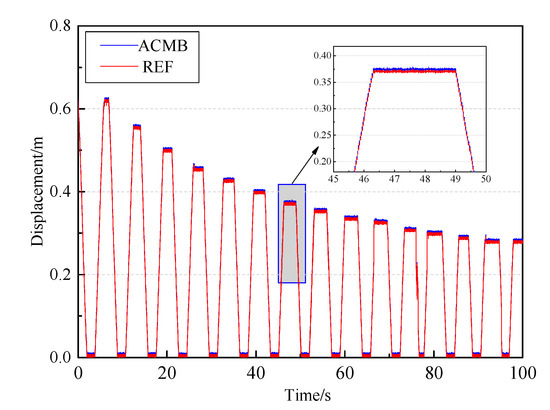
Figure 13.
Displacement response curves of cylinder.
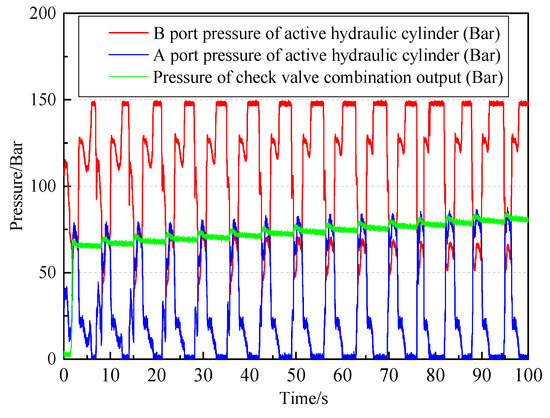
Figure 14.
Pressure curves of active hydraulic cylinder and check valve.
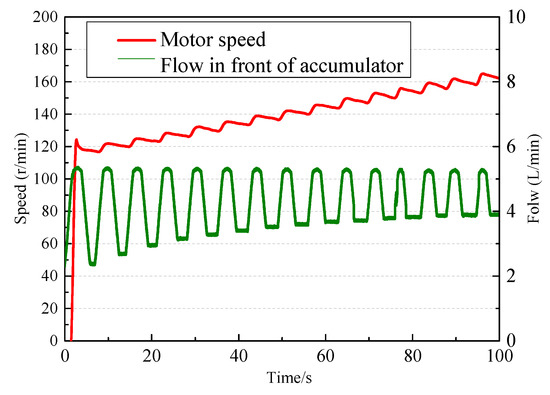
Figure 15.
Motor speed and flow curves in front of the accumulator.
3.5. Working Characteristic Analysis of Hydraulic Transmission System Under Different Loads
When the target displacement of the hydraulic cylinder was 0.3 m, the cycle was 6 s. The load varied from no load to 1 kW, then to 2 kW, and finally to 3 kW. The output pressure curves of the active hydraulic cylinder and the check valve are shown in Figure 16. When there were no loads, the pressure oscillation was obvious, as it changed from 20 Bar to 70 Bar. As the load increased, the system pressure increased and became stable; when the loads were 3 kW, the designed one-way valve group output pressure was steady at 86 Bar. Figure 17 shows the motor pressure and the flow curves. Figure 18 shows the motor speed and the motor torque curves. When the loads were 0 kW, the pressure and the flow of the motor showed greater oscillations. The pressure altered from 20 to 70 Bar, the flow changed from 0 to 3.5 L/min, the speed turned from 0 to 490 r/min, and the torque went from 0 to 7.5 Nm. When the loads moved to 1 kW, the pressure became stable and grew from 70 Bar, the flow was stable and grew from 1.7 L/min, the speed turned stable and kept at about 150 r/min, and the torque changed to stable and kept at about 5.5 Nm. When the loads turned to 2 kW, the trend of change did not alter, but there was an oscillation at the variation point. When the loads became 3 kW, the flow reduced from 1.8 to 1.5 L/min, the motor speed adjusted from 130 r/min to 110 r/min, and the torque turned stable and increased to 15 Nm. By analyzing Figure 17 and Figure 18, we can see that the pressure change was consistent with the variation of motor torque, and the flow alteration was consistent with the adjustment of motor speed. It also obeys the law of energy conservation.
Figure 16.
Pressure curves of active hydraulic cylinder and check valve.
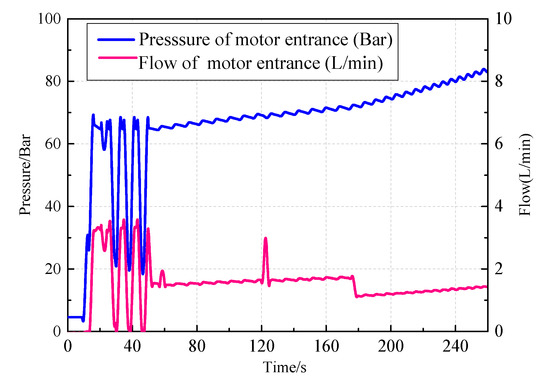
Figure 17.
Motor pressure and flow curves.
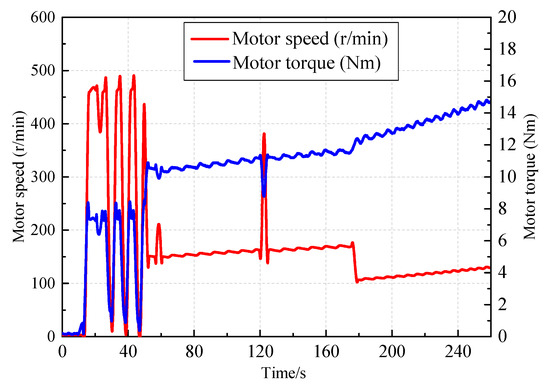
Figure 18.
Motor speed and torque curves.
4. Conclusions
In this research, an oscillating float wave energy experimental platform was taken as the research object to develop the design principle and the control strategy. Design details and dynamic modeling of the platform were also presented. An adaptive back-stepping displacement controller was shown and compared with the PID controller. The designed displacement controller aims to improve the displacement tracking accuracy, and its uniform stability can be guaranteed by constructing the Lyapunov function. The adaptive back-stepping displacement controller was synthesized based on this state-space model to accurately achieve the desired displacement control regardless of such uncertainties and nonlinearities. This displacement tracking controller includes a back-stepping procedure and an adaption law to deal with uncertainties and nonlinearities and hence to improve the final displacement control performances.
The comparative experimental of motion response under the new controller and PID controller was carried out. Comparative results validated that the proposed control strategy in this research can better realize the hydraulic cylinder displacement tracking control than the PID controller. The motion response of the active hydraulic cylinder was basically consistent with the input target curve; in addition, the tracking error was smaller, and the response speed was faster than PID controller. The precise control on the active part of the wave power experimental device provides a prerequisite for the development of the hydraulic transmission system. The working characteristics of the hydraulic transmission system were also shown through the experimental platform, and the peculiarities of hydraulic regulation under different working conditions were summarized. It is helpful to realize the design optimization of energy transfer process, as it provides the foundation for the layout of a hydraulic transfer system of the wave energy power generation device.
Author Contributions
Data curation and methodology, W.Z.; software, S.L.; visualization, Y.L.; supervision, D.L.; writing and review and editing, Q.H.; All authors have read and agreed to the published version of the manuscript.
Funding
The project was supported by the National Marine Bureau’s marine renewable energy special fund project (Project No.: SDME2010GC02), the National Natural Science Foundation joint fund project (Project No.: U17062305), and National key research and development program strategic international scientific and technological innovation cooperation key special project (Project No: 2016YFE0205700), and National Natural Science Foundation of China (Grant No. 51705288),and Doctoral fund research project of shandong jianzhu university (Project No. x18036z),and Open Foundation of the State Key Laboratory of Fluid Power and Mechatronic Systems, China (GZKF-201805).
Conflicts of Interest
The authors declare no conflict of interest. The funders had no role in the design of the study, in the collection, analyses or interpretation of data, in the writing of the manuscript, or in the decision to publish the results.
References
- Lin, Y.; Bao, J.; Liu, H.; Li, W.; Tu, L.; Zhang, D. Review of hydraulic transmission technologies for wave power generation. Renew. Sustain. Energy Rev. 2015, 50, 194–203. [Google Scholar] [CrossRef]
- Cargo, C. Design and Control of Hydraulic Power Take-Off for Wave Energy Converters. Ph.D. These, University of Bath, Bath, UK, 2012. [Google Scholar]
- Gaspar, J.F.; Calvário, M.; Kamarlouei, M.; Soares, C.G. Design tradeoffs of an oil-hydraulic Power Take-Off for Wave Energy Converters. Renew. Energy. 2018, 129 Pt A, 245–259. [Google Scholar] [CrossRef]
- Ricci, P.; Lopez, J.; Santos-Mugica, M.; Ruiz-Minguela, P.; Villate, J.; Salcedo, F.; Falcaão, A. Control strategies for a wave energy converter connected to a hydraulic power take-off. IET Renew. Power Gener. 2011, 5, 234–244. [Google Scholar] [CrossRef]
- Hansen, R.H.; Kramer, M.; Vidal, E.; Hansen, R.H.; Kramer, M.M.; Vidal, E. Discrete Displacement Hydraulic Power Take-Off System for the Wavestar Wave Energy Converter. Energies 2013, 6, 4001–4044. [Google Scholar] [CrossRef]
- Zou, S.; Abdelkhalik, O. Control of Wave Energy Converters with Discrete Displacement Hydraulic Power Take-off Units. J. Mar. Sci. Eng. 2018, 6, 1–24. [Google Scholar] [CrossRef]
- Gaspar, J.F.; Kamarlouei, M.; Sinha, A.; Xu, H.; Calvário, M.; Faÿ, F.X.; Robles, E.; Soares, C.G. Speed control of oil-hydraulic power take-off system for oscillating body type wave energy converters. Renew. Energy 2016, 97, 769–783. [Google Scholar] [CrossRef]
- Do, H.T.; Dang, T.D.; Ahn, K.K. A multi-point-absorber wave-energy converter for the stabilization of output power. Ocean Eng. 2018, 161, 337–349. [Google Scholar] [CrossRef]
- Kim, S.J.; Koo, W.; Shin, M.J. Numerical and experimental study on a hemispheric point-absorber-type wave energy converter with a hydraulic power take-off system. Renew. Energy 2019, 135, 1260–1269. [Google Scholar] [CrossRef]
- Wang, K.; Sheng, S.; Zhang, Y.; Ye, Y.; Jiang, J.; Lin, H.; Huang, Z.; Wang, Z.; You, Y. Principle and control strategy of pulse width modulation rectifier for hydraulic power generation system. Renew. Energy 2019, 135, 1200–1206. [Google Scholar] [CrossRef]
- Penalba, M.; Giorgi, G.; Ringwood, J.V. Mathematical modelling of wave energy converters: A review of nonlinear approaches. Renew. Sustain. Energy Rev. 2017, 78, 1188–1207. [Google Scholar] [CrossRef]
- Pedro, B.; Cândida, M. Hydraulic Power Take-off and Buoy Geometries Charac-terisation for a Wave Energy Converter. Energy Power Eng. 2013, 5, 72–77. [Google Scholar]
- Babarit, A.; Guglielmi, M.; Clément, A.H. Declutching control of a wave energy converter. Ocean Eng. 2009, 36, 1015–1024. [Google Scholar] [CrossRef]
- Falcão, A.F.O. Modelling and control of oscillating-body wave energy converters with hydraulic power take-off and gas accumulator. Ocean Eng. 2007, 34, 2021–2032. [Google Scholar]
- Yang, L.; Hals, J.; Moan, T. A wear model for assessing the reliability of wave energy converter in heave with hydraulic power take-off. In Proceedings of the 8th European Wave and Tidal Energy Conference, Uppsala, Sweden, 7–10 September 2009; pp. 874–881. [Google Scholar]
- Limin, Y.; Torgeir, M. Dynamic analysis of wave energy converter by incorporating the effect of hydraulic transmission lines. Ocean Eng. 2011, 38, 1849–1860. [Google Scholar]
- Shi, H.; Cao, F.; Liu, Z.; Qu, N. Theoretical develop on the power take-off estimation of heaving buoy wave energy converter. Renew. Energy 2016, 86, 441–448. [Google Scholar] [CrossRef]
- Gaspar, J.F.; Calvário, M.; Kamarlouei, M.; Soares, C.G. Power take-off concept for wave energy converters based on oil-hydraulic transformer units. Renew. Energy 2016, 86, 1232–1246. [Google Scholar] [CrossRef]
- Li, S.Z.; Wei, J.H.; Guo, K.; Zhu, W. Nonlinear Robust Prediction Control of Hybrid Active—Passive Heave Compensator with Extended Disturbance Observer. IEEE Trans. Ind. Electron. 2017, 64, 6684–6694. [Google Scholar] [CrossRef]
- Yin, X.-X.; Lin, Y.; Li, W.; Liu, H.-W.; Gu, Y.-J. Adaptive sliding mode back-stepping pitch angle control of a variable-displacement pump controlled pitch system for wind turbines. Isa Trans. 2015, 88, 2316–2326. [Google Scholar] [CrossRef] [PubMed]
- Lederer, J.; Vastesaeger, M. Adaptive sliding mode back-stepping pitch angle control of a variable-displacement pump controlled pitch system for wind turbines. ISA Trans. 2015, 58, 629–634. [Google Scholar]
- Van, T.L.; Nguyen BP, N.T.; Truong, T.H.; Trang, T.T. Improved Pitch Angle Control for Variable-Speed Wind Turbine System. Lect. Notes Electr. Eng. 2014, 282, 103–112. [Google Scholar]


© 2020 by the authors. Licensee MDPI, Basel, Switzerland. This article is an open access article distributed under the terms and conditions of the Creative Commons Attribution (CC BY) license (http://creativecommons.org/licenses/by/4.0/).