Article

Potentiality of Waste-to-Energy Sector Coupling in the MENA Region: Jordan as a Case Study

1
Department of Waste and Resource Management, Faculty of Agricultural and Environmental Sciences, University of Rostock, D-18059 Rostock, Germany
2
Deutsches Biomasseforschungszentrum GmbH, D-04347 Leipzig, Germany
*
Author to whom correspondence should be addressed.
Energies 2020, 13(11), 2786; https://doi.org/10.3390/en13112786
Submission received: 3 May 2020 / Revised: 22 May 2020 / Accepted: 25 May 2020 / Published: 1 June 2020
(This article belongs to the Special Issue Alternative Energy Sources)

Abstract

:
Population growth, urbanization, and changes in lifestyle have led to an increase in waste generation quantities. The waste management system in the Middle East and North Africa (MENA) region is still considered an adolescent system, while developed countries have made great progress in this field, including regulation, financing, administration, separation at source, recycling, and converting waste to energy. At the same time, in the MENA region, the best performance of the recycling process is around 7–10% of total waste. Nowadays, many developed countries like Germany are shifting from waste management to material flow systems, which represent the core of a circular economy. Also, it should be stated here that all countries that have a robust and integrated waste management system include waste-to-energy (W-to-E) incineration plants in their solutions for dealing with residual waste, which is still generated after passing through the entire treatment cycle (hierarchy). Therefore, this paper illustrates the potentiality of embedding waste incineration plants in the MENA region, especially in large cities, and addressing the economic and financial issues for the municipalities. Cities in these countries would like to build and operate waste treatment plants; however, municipalities do not have the sustainable investment and operating costs. The solution is to maximize the income from the output, such as energy, recycling materials, etc. In addition, the MENA region is facing another dilemma, which is water scarcity due to climate change, increasing evaporation, and reduction of precipitation. This research illustrates a simulated model for a waste incineration plant in the MENA region. The EBSILON 13.2 software package was used to achieve this process. Furthermore, the simulated plant applies the concept of waste-to-energy-to-water, so that not only is waste converted to energy but, by efficient usage of multi-stage flash (MSF) technology, this system is able to generate 23 MWe of electric power and 8500 m3/day of potable water. A cost analysis was also implemented to calculate the cost of thermal treatment of each ton of municipal solid waste (MSW) during the life span of the plant. It was found that the average cost of treatment over 30 years would be around US$39/ton.

Graphical Abstract

1. Introduction

To attain sustainable development, the need to decouple resource consumption from economic growth is critical. There are two levels that should be taken into consideration. First, the concept or the term “waste management” must be transformed to “waste and resource flow management” [1]. Second, the waste management system must not be treated as a system anymore but as a comprehensive industrial sector. With these concepts, a new methodology has appeared that shows how waste is a source of materials for the production of energy and goods [2,3]. The waste sector contributes to sustainable production with high recycling and recovery rates (circular economy), which in turn helps to save raw materials and primary energy [4,5]. For example, in Germany, after about 30 years of connecting these sectors there are now 68 waste incineration plants in operation with a capacity of around 20 million tons and a calorific value of around 10 MJ/kg [6,7]. This means there is 200 × 109 MJ of energy to be harvested. Therefore, waste represents a source of energy, which should be used and recovered. The incinerators are divided according to the energy content of the waste, as shown in Figure 1.
In the Middle East and North Africa (MENA) region, 95% of municipal waste goes to landfills without any pre-treatment process. It is recognized to have a high organic content of about 50% and this leads to an increased water content in the composition of mixed municipal waste [8,9]. Furthermore, the waste management system in the MENA region suffers from many problems, including lack of secured financial support (economic problems), formulated laws, instructions, and professional organized systems. For example, separation at source is a very important technique, and it must be implemented in waste management in developing countries; here, some barriers appear, as the infrastructure of the cities and municipalities are not able to embed such a concept.
Around 18 countries in the region (Egypt, Algeria, Bahrain, Iraq, Yemen, Jordan, Qatar, Kuwait, Lebanon, Libya, Morocco, Oman, Saudia Arabia, Syria, United Arab Emirates, Tunisia, Palestine) share the same composition of waste and also the same energy content, which is approximately 6.5–7 MJ/kg. The rate of waste generation per capita in the region is around 1–1.5 kg/day/capita [10]. This paper shows the potentiality of recovering energy content from waste via a waste incineration plant, and can be considered motivation to erect the first waste incineration plant in the MENA region. This research also introduces an efficient utilization of the waste heat (steam) coming out from the power plant as potable water generation by implementing once-through multi-stage flash (OT-MSF) technology. The simulated power plant was achieved using the EBSILON software package, which was developed by the STEAG Company in Germany. Many parameters were required to achieve the simulation process, such as precise element analysis and other requirements, as shown in the next parts.
Waste management systems in the MENA region have different problems and challenges [11]. Before trying to find sustainable solutions for the waste management sector in this region, it is first very important to state several parameters governing the final solutions and treatment. Characterization and composition, collection methods, and existing treatment approaches represent the main aspects that should be taken into consideration to verify the optimum treatment for the daily generated waste. The real situation in the MENA region is that all countries share the same characterization and same final treatment processes, with around 90–95% of waste going to landfill [8,12,13].
In developed countries, for example in Germany, the waste management system involves many streams of treatment [7] to reduce the amount of waste sent to landfill as much as possible. The main ideas behind these kinds of treatment are protecting our environment, harvesting the huge amount of energy existing in waste (by incineration), and reducing the amount of waste sent to landfill in order to increase the life span of the landfills and ensure that only unusable materials are sent there.
At the core of this research is a need to answer several important questions: Which treatment process can be used after materials have been recycled many times? What about unrecyclable materials, hazardous waste, or mixed waste (most common in the MENA region)?
It can be concluded that there is a persistent need for waste incineration plants in the MENA region. As mentioned before, although developed countries have different processes to handle daily generated waste, they also use a thermal treatment technique (waste incineration).
According to the above-mentioned information, it can be concluded that a waste incineration plant represents the optimum treatment process, especially in the case of the MENA region where a huge amount of the waste, more than 50%, is organic in composition [10,12], as shown in Figure 2. Landfill is currently the only main treatment process, due to an absence of legislation and a comprehensive management system. It should be restated here that waste incineration is capable of reducing waste volume by more than 75% [14]. In this paper, a software model has been built to simulate a waste incineration power plant in the MENA region. Jordan has been used as a case study for this model.

2. Materials and Methods

This section clarifies the methodology of the research and all required data, technical information, and assessments which have been included and used in the EBSILON model, where this research deals with three sectors: waste management, water scarcity, and power production.

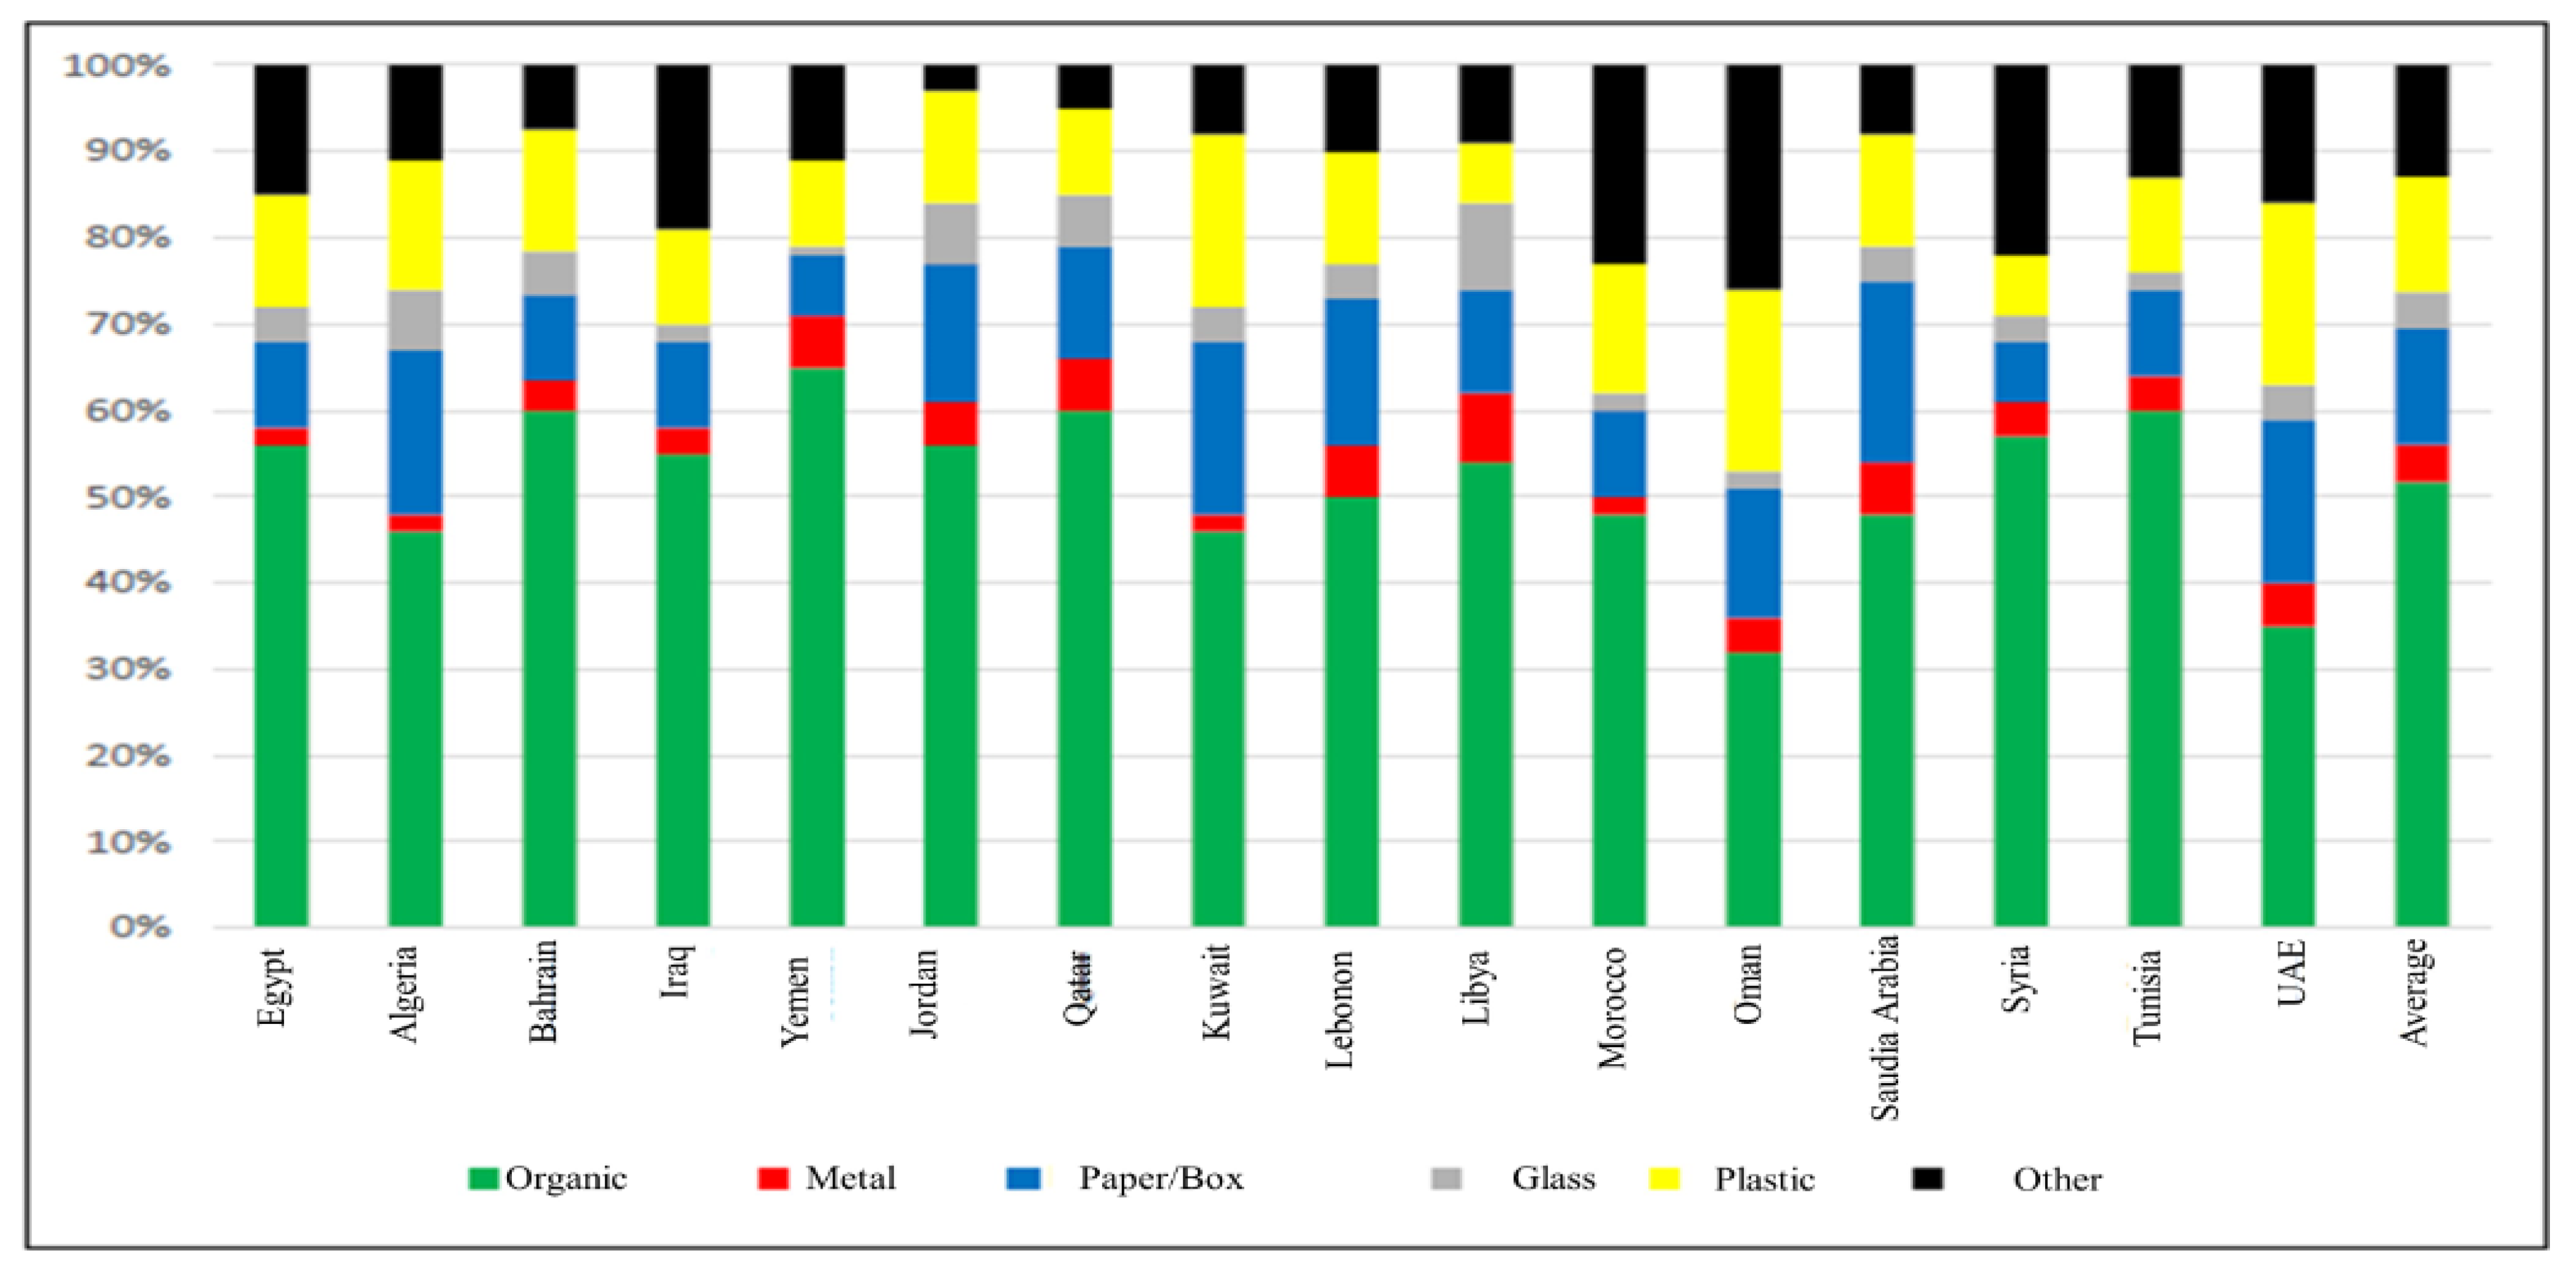
2.1. Waste Composition in Jordan as a Case Study in the MENA Region

Waste fractions or composition is a very important factor for the experts and decision makers to understand when trying to find solutions for waste management and facing existing problems. Many studies have analyzed the divisions and fractions forming municipal solid waste (MSW) [15]. It should be noted here that the vast majority of analysis studies in this field have studied MSW, which is the most concerning source of waste all over the world. Jordan was selected as a representative case study for MENA region countries for many reasons: first, availability of data, second, Jordan is a strategic partner to the German Federal Ministry for Economic Affairs and Energy, and third, Jordan was ranked second in the world for water scarcity [10]. In Jordan, 90–95% of the MSW generated is going to landfill. The main problem with landfills is that they are unsanitary, and they affect the water aquifers, which are considered the main sources of water in Jordan. Furthermore, Jordan is a non-producing country in terms of energy, with 96% of its energy supply in the country being imported [10,16,17].
Considering all of that, the waste management sector in Jordan should be developed using a sustainable solution to overcome all these challenges. A waste incineration plant represents one of the potential solutions to these problems and could convert MSW in Jordan into two sources: energy (power) and water. The waste divisions of MSW in Jordan are shown in Table 1. The high proportion of organic waste (approximately 50%), seen in the MSW of many developing countries, such as Jordan, has a high-water content. The huge amount of water is the main obstacle faced by a waste power plant, it lowers the recovery of materials and decreases the energy content of the matter (lower calorific value (LCV)). The LCV is the core of the combustion process inside the combustion chamber, thus conserving a high ignition value requires a higher calorific value.
Du Long’s Approximation was used to evaluate the heat and governing coefficients of the chemical elements of the volatile fraction (see Table 2). Du Long’s Approximation is an empirical method used for essential elements of hydrocarbons (C, H, and O) that are connected with each other, as shown in Equation (1) [19]:
Q = 14,406 C + 67,276 H2 − 6187 O2 + 4142 S + 2433 Cl2 − 1082 N2
Because of the requirements of this model, a sample of 4 kg was collected from a more than 52 ton heap of waste in the waste-converting station in Amman city, which receives waste from six regions, and was considered a representative sample for Jordan. The sample was shredded and prepared for analysis in the laboratory. The results are shown in Table 2. As expected, the vast majority of the fraction was the water content (around 60%), with the volatile fraction making up 40%. This 40% includes two divisions: combustible materials and incombustible materials (ash). As shown in Table 2, of the 40% volatile compounds, 15% is ash, which is an incombustible fraction, so the combustible fraction which generates the heat (energy) in the flue gas is 25%. The lower calorific value was taken as an average for the whole year, i.e., 7 MJ/kg for the raw materials.
Studies show that the average per capita production of waste is between 1 kg and 1.5 kg/day [10,18]. In the case of Jordan, around 4000 ton/day is generated in the whole country, the vast majority of this is sent to Alghabawi landfill, which lies around 45 km east of Amman, and receives 60–70% of the waste generated in the kingdom (Jordan), around 2800–3000 ton/day [20], and the rest is taken to other landfills. There are presently 24 covered landfills in Jordan. The location of these landfills was not chosen according to the international standards but according to population density, so as to serve the largest possible number of municipalities. Apart from one landfill, the locations have not been based on feasibility studies for proper site selection. The only exception is Alghabawi landfill of the Greater Amman Municipality. The location of this landfill was selected after conducting an environmental impact assessment for best site selection [21].
Thermal treatment of waste, which is often used, is the incineration of unsorted waste on a so-called mass-burn grate. Sometimes, it is necessary to add fuel to such waste in order to increase its temperature, which will result in more efficient combustion. Often, natural gas, coal, and wooden biomass are used as additional fuels, particularly if the waste has not been previously dried [15]. The technology of waste combustion on a grate is a mature technology that has been used for hundreds of years.
The primary role of waste incineration is the reduction of mass (up to 75%) and volume (up to 90%) of waste, as well as the destruction of dangerous organic compounds and pathogens [22]. There is a long tradition of grate incineration in Europe, and extensive experience has been collected in more than 400 operational incinerators, processing 52 Mt/year of municipal solid waste (MSW) in 2003, which was around 20% of the total quantity of MSW [23,24].

2.2. Water Scarcity in the MENA Region

There are many reasons for the phenomenon of water scarcity in MENA countries, including population growth, developing economies, changing lifestyles, and climate change. This region has one of the greatest water scarcity situations in the world: it is accommodating almost 6% of the world’s population, while getting only 2% of the planet’s renewable freshwater supply [25,26]. The average water accessibility per capita in the MENA region is 1100 m3/year, which drops below the water security threshold of 1700 m3/year [25]. Therefore, for the purpose of this research, it is very important to illustrate the water situation for the vast majority of the countries in the region in terms of water consumption and water availability, as shown in Figure 3, which highlights the water scarcity in 19 countries. As can be seen in Figure 3, the countries are divided into 11 countries with great scarcity, like Bahrain and Kuwait where they do not have any water resources to compensate, and 8 countries with moderate scarcity, like KSA (Kingdom of Saudi Arabia), where they have around 5 billion m3 as surface and ground water, while the consumption is around 23.5 billion m3. Note the differences in the scale of the figure (y-axis) due to the huge difference in the available amounts of water in the great scarcity region and the moderate scarcity region.

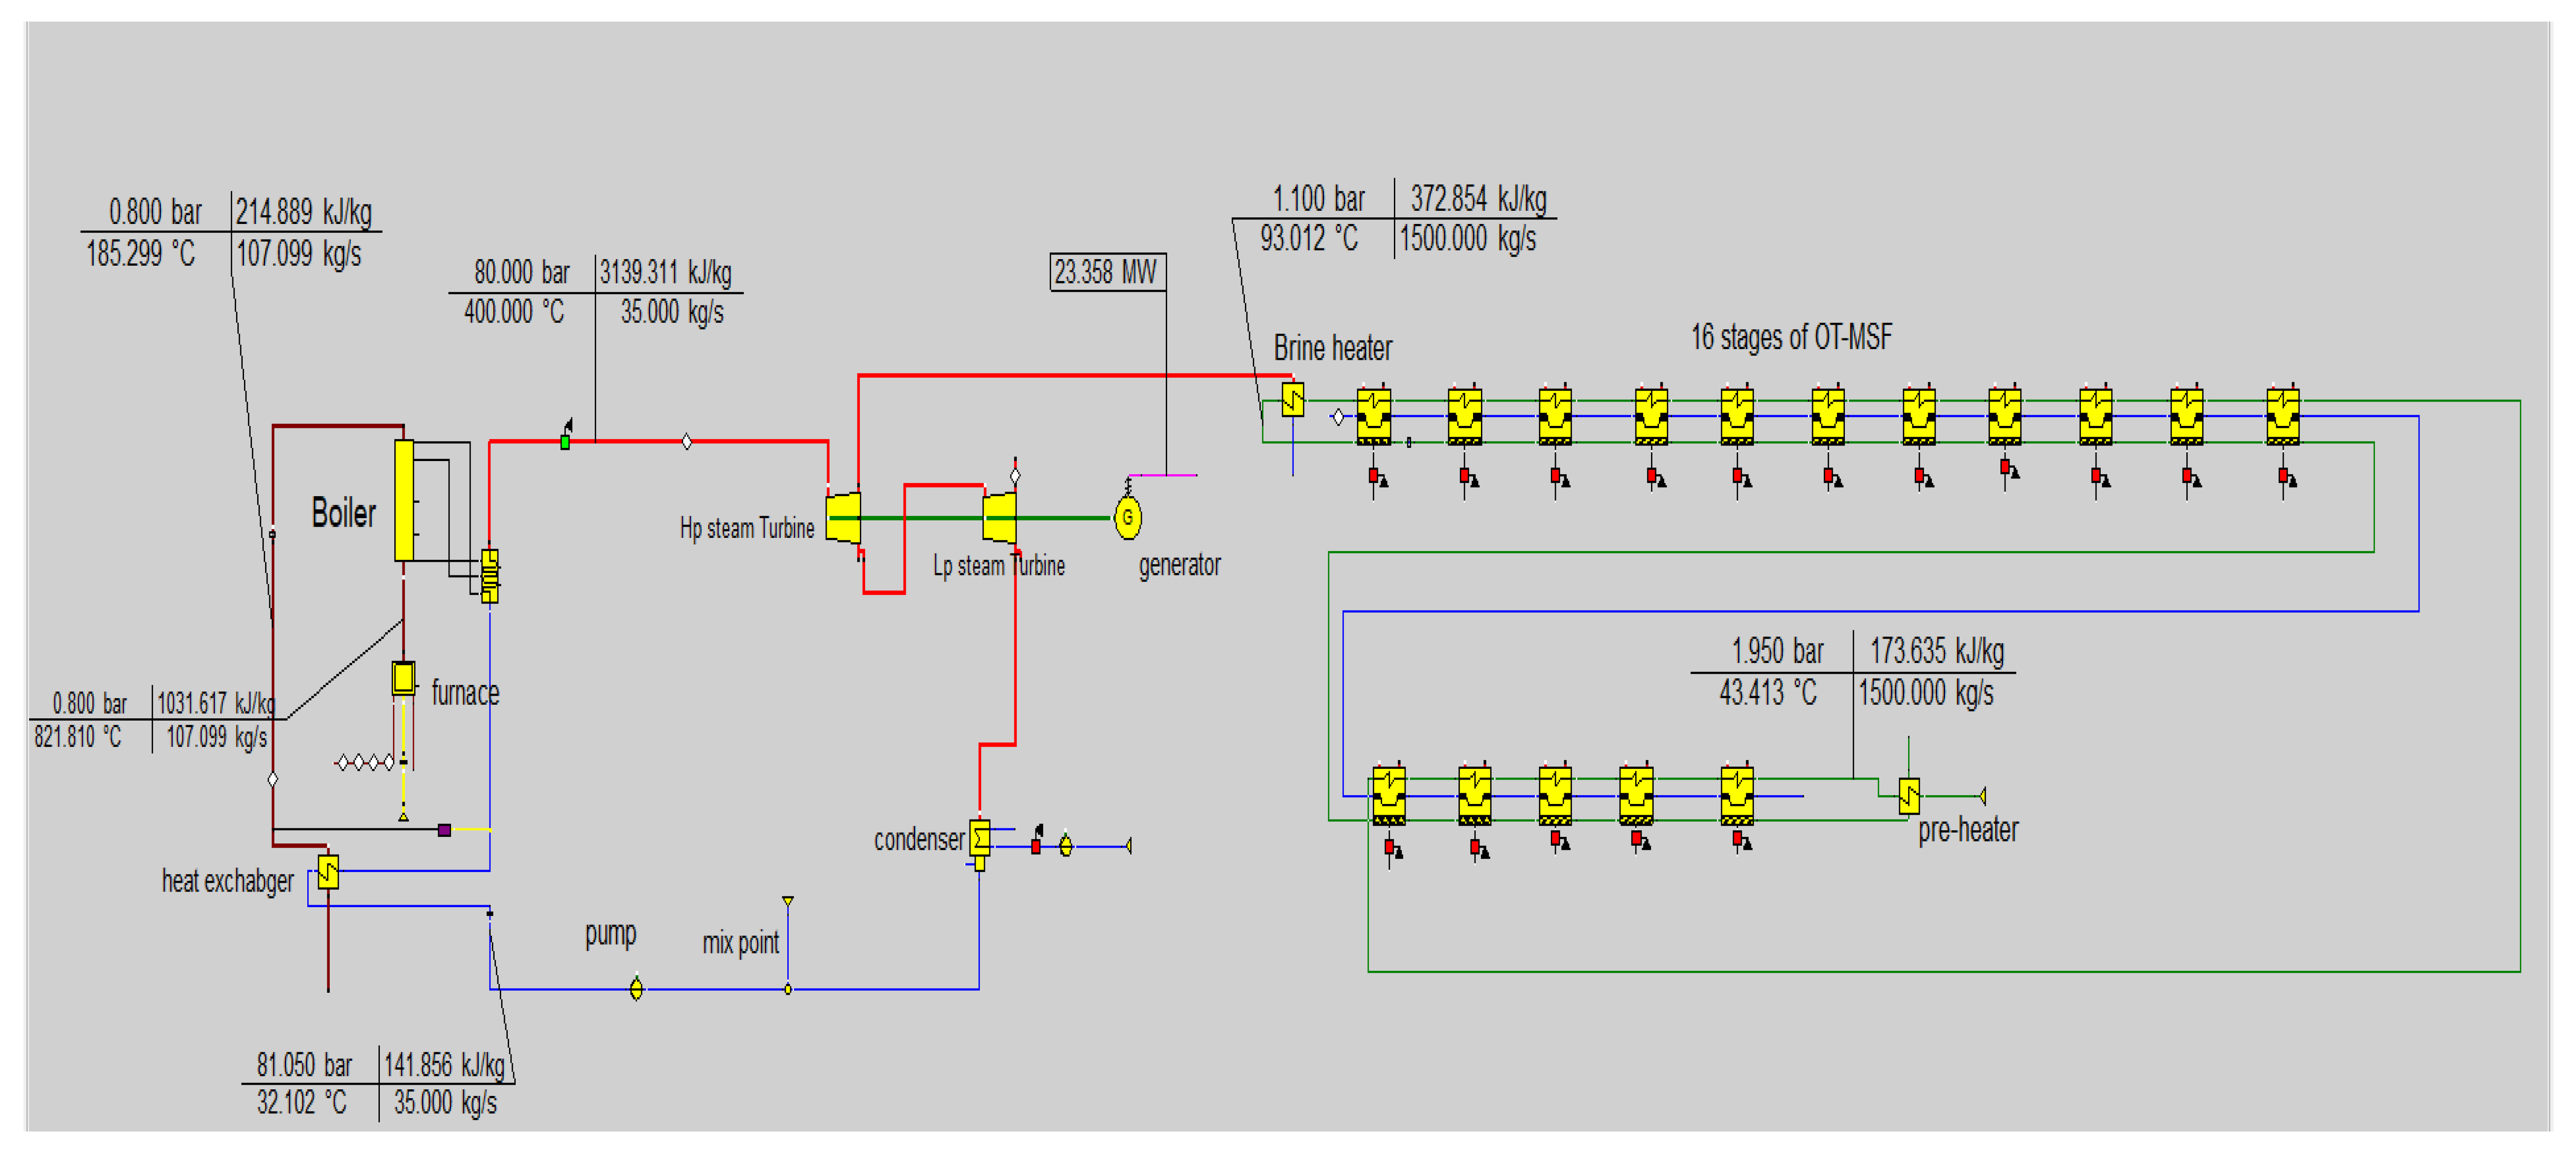
2.3. Design Path of Waste-to-Energy-to-Water System

This section presents the pathway of the research and the configuration of the power plant as shown in Figure 4. The whole system has been simulated using the EBSILON 13.02 software package to achieve this work. EBSILON is the abbreviation for “Energy balance and simulation of the load response of power generating or process controlling network structures.” It is used for engineering, attainment, preparation, checking, and plant optimization. It allows the arrangement of individual components, component groups, sub-systems, and complete systems within closed or open cycles.
This system includes three main blocks. The first one is related to the waste incineration facility, which involves the combustion chamber (grate firing), a system for controlled and continuous input of waste to the grate, a duct for the flue gas, and bottom tanks to assemble residual unburnable materials (ash). There are different treatment streams for the residual ash. In developed countries, it is separated into two fractions, metallic and non-metallic residues, where the non-metallic fraction is used in the buildings and streets industry, while the metallic fraction is considered as a source of metals and represents another revenue for the facility, otherwise it can be directly converted to landfills.
The second part is the core of this system, the steam Rankine cycle, which consists of high- and low-pressure steam turbines, a condenser, a deaerator to reduce the amount of oxygen that dissolves in the water and to increase the life span of the boiler and decrease maintenance costs, a pre-heater to increase the temperature of the water before it enters the boiler, harvesting thermal energy from the flue gas, and a super-heated steam generator (boiler).
The third block includes a once-through multi-stage flash plant, the design and technical aspects of which will be described later. This block consists of 16 stages.
An economic analysis of the cost of treatment for each ton of MSW has been calculated. The capital and operational costs of the plant were also assessed along with the cash flow during the lifetime of the plant (assumed to be 30 years) in terms of expenditure and income.
Finally, CO2 emissions were analyzed, to compare the emissions of the WI (waste incineration) and landfill.
As mentioned before, the second block consists of thermo-mechanical components. The technical properties of the main components are shown below in Table 3.
The annual capacity of the waste incineration plant, LCV, and working hours throughout the year are shown in Table 4 below. The table also shows the live super-heated steam temperature and pressure, temperature of the flue gas, and steam temperatures of the extractions from the steam turbines.
MSF plants, where freshwater is separated from brine through evaporation, normally reach and exceed 20 stages. Before the first stage, a brine heater powered by hot steam from a steam generator is responsible for heating the liquid up to the first inlet temperature value, as shown in Figure 5. Basically, the higher this temperature is, the more the distillation rate rises, since a larger amount of vapor can then be extracted from the salt water [30,31].
In the simulated power plant, there were 16 stages of the MSF process, with one pre-heater before the stages. The capital cost of the multi-stage flash desalination process depends on different parameters, particularly the size of the facility and the salinity and temperature of the water. Table 5 below clarifies the variations in the capital and operational costs based on data from real projects in many different countries in the MENA region.
According to the data in References [32,33], capital costs were taken to be US$1100/m3 and operational costs US$0.26/m3. As Jordan was chosen as a case study in this research, Aqaba city was selected to be a candidate city for the erection of such a project. Since it lies on the Red Sea, it would be a good source of seawater for the MSF plant.
Concentration salinity and temperature ranges used in this model are 42–46 ppt (parts per thousand) and 24–33 °C, respectively [32]. Table 6 illustrates all the parameters used in the EBSILON model to simulate the 16 stages of the MSF process. As can be seen, the salt concentration unit was converted to mg/L, and the feed seawater temperature was calibrated to 48 °C. This is higher than the original temperature of the seawater; as mentioned previously, a pre-heater was used to control and fix the influent temperature into the plant instead of working with a variant range. This is further discussed in the next sections.

2.4. Economical Evaluation of the Waste-to-Energy-to-Water System

In general, cost and economic analysis include two main streams. The first one is related to expenditure representing the investment cost, which is returnable as annual payments during the first 12–15 years of the life span of the power plant [34], and operational costs, which are continued during the life span of the power plant as salaries of the working staff (engineers, technicians, managers, etc.), maintenance and replacement of the components, and many other things, as will be discussed later. The second stream is related to income, representing the income from power sales and water sales (for this case). Then, the financial budget (cash flow) can be calculated by taking the difference between the annual expenditure and annual income.

2.4.1. Capital Costs

Capital costs vary with respect to several dominant factors: design of the power plant, its size (capacity), existence of the local infrastructure, and opportunities for selling energy (in terms of power prices). This system includes the power plant (waste incineration). There is also the cost of the multi-stage flash units to be added on to the investment. From that, the capital cost is divided into two parts:
  • Waste incineration plant (W-to-E) capital costs, including the power block with 650 × 103 ton/year.
  • Multi-stage flash (MSF) capital cost, with 8500 m3/day of water production.
Many studies [35,36] state the capital costs of waste incineration (WI) plants, but they vary greatly, as the cost of a waste-to-energy power plant changes depending on different dynamic parameters, such as plant capacity, waste composition, pre-treatment existence, and the flue gas cleaning system, which is related to the limitations and laws of air pollution emissions in each country. According to Reference [35], where the investment costs of all thermal treatment plants were embedded, including WI, the investment cost (capital cost) was in the range US$400–700/ton of MSW/year. Of course, this range is related to the capacity (annual amount of waste which would be burned in the plant) and emission treatment technology. For this study, the capital cost of US$400/ton has been selected to adjust and verify the economic analysis.
The last part of the capital cost analysis of the system is the investment in the water desalination (multi-stage flash) process. The capital cost of MSF is US$1100/(m3/day). According to the specified capacities of the waste incineration plant and water production, the initial investment for approximately 650,000 ton/year and 8500 m3/day is US$260 million and US$10 million, respectively.
To calculate the distribution of capital cost investment, Equation (2) was used:
C ( t ) c a p i t a l = C A P E X . r i . ( 1 + r i ) t d e b t ( 1 + r i ) t d e b t 1
where:
C ( t ) c a p i t a l is the annual distribution of the capital cost,
ri: Interest rate (%),
tdebt: Year debt (year),
CAPEX: Capital expenditure.

2.4.2. Operational Costs

Operational costs are an important part of the economic analysis of any project, as these costs continue through the whole life span of the power plant, whereas capital costs vanish after a few years. For the simulated model, operational costs were very variant. In terms of waste incineration, these costs include: salaries, maintenance costs, a flue gas cleaning system, disposal of waste materials (since different technologies use various amounts of reagents and consequentially generate different quantities of waste material, such as ash and various residues from the flue gas cleaning process), and the operation of feed-water pumps and fans supplying primary and secondary combustion air [37].
Operational costs were assumed to be 10% of the total cost, including the operational costs of the MSF system. According to the literature [35,36,38], operational costs ranged between 4% and 11%, so for this work, they were taken to be 10%. The most variant component in the MSF operation system is the cost of preparing the water before it enters later stages, like de-aerating and adding chemicals for water purification [39].
The aim of this economic analysis is to show the potentiality of erecting a waste incineration plant in the MENA region and to connect it with producing desalinated water to utilize waste heat in an efficient pathway. Therefore, the cost for each ton of MSW to be treated in this power plant was calculated.
The levelized cost of electricity was analyzed according to Equation (3):
L E C = t = 1 t   L i f e           C ( t ) c a p i t a l + C ( t ) o p e r a t i o n ( 1 + r d ) t t = 1 t L i f e E e l y ( 1 + r d ) t
where:
LEC: is the levelized cost of electricity,
C ( t ) o p e r a t i o n a l : is the annual distribution of the operational cost,
rd: Discount rate (%),
E_(el-y): Annual power production (MWe/year).
The inflation rate was taken into consideration as a fixed percentage in order to show its effect on the economic model. The equation below is to calculate the inflation through the whole lifetime of the plant:
Pn = P(1 + i)n
where:
Pn: Total inflated estimated cost (US$),
P: Base estimated cost (US$),
i: Inflation rate (%).
To calculate income from power and water sales, the equation below was used:
I l = 365   D t f A W M P
where:
f: Inflation rate (%),
Il: Income for first year (US$),
Dt: Distillate water production (m3/day),
AWMP: Average water market price (US$).
Many parameters have been applied in this model, many of them were assumed and others were found in the literature. Table 7 shows all parameters used in this model.

2.5. CO2 Emissions

Waste incineration and landfilling processes come at the last two treatment steps in the hierarchy of waste management, with landfilling being the last option [40]. Both of these include different emissions of greenhouse gases with variant concentrations, like NOx, CO2, CH4, and others. For the purpose of this research, CO2 emissions were considered, as this gas is listed as a main greenhouse gas that needs to be mitigated or recycled according to the Kyoto Protocol and the Paris Agreement [41]. The variation in emitted concentration is related to the composition of the MSW in each country, which constitutes the element formation. Due to that, many studies gave different concentration values of CO2 emissions for each ton of MSW for each case (landfill and incineration) [42,43]. In this work, 840 kg CO2 for each ton of MSW to be landfilled was taken and 415 kg CO2 for each ton of MSW for waste incineration, according to References [43,44]. Unfortunately, as mentioned before, 90–95% of the MSW in the MENA region is going to landfill, so to show the effect of that in terms of greenhouse gas emissions, the capacity of the simulated WI power plant in this study of 650,000 ton/year has been used in landfilling and energy recovery (WI) cases. To calculate the amount of CO2 emission:
E ɻ = μ ɻ M ξ
where, E ɻ is the emission concentration of the given gas, μɻ, M is the mass of the waste, and ξ is the exhaust gas volume.

3. Results

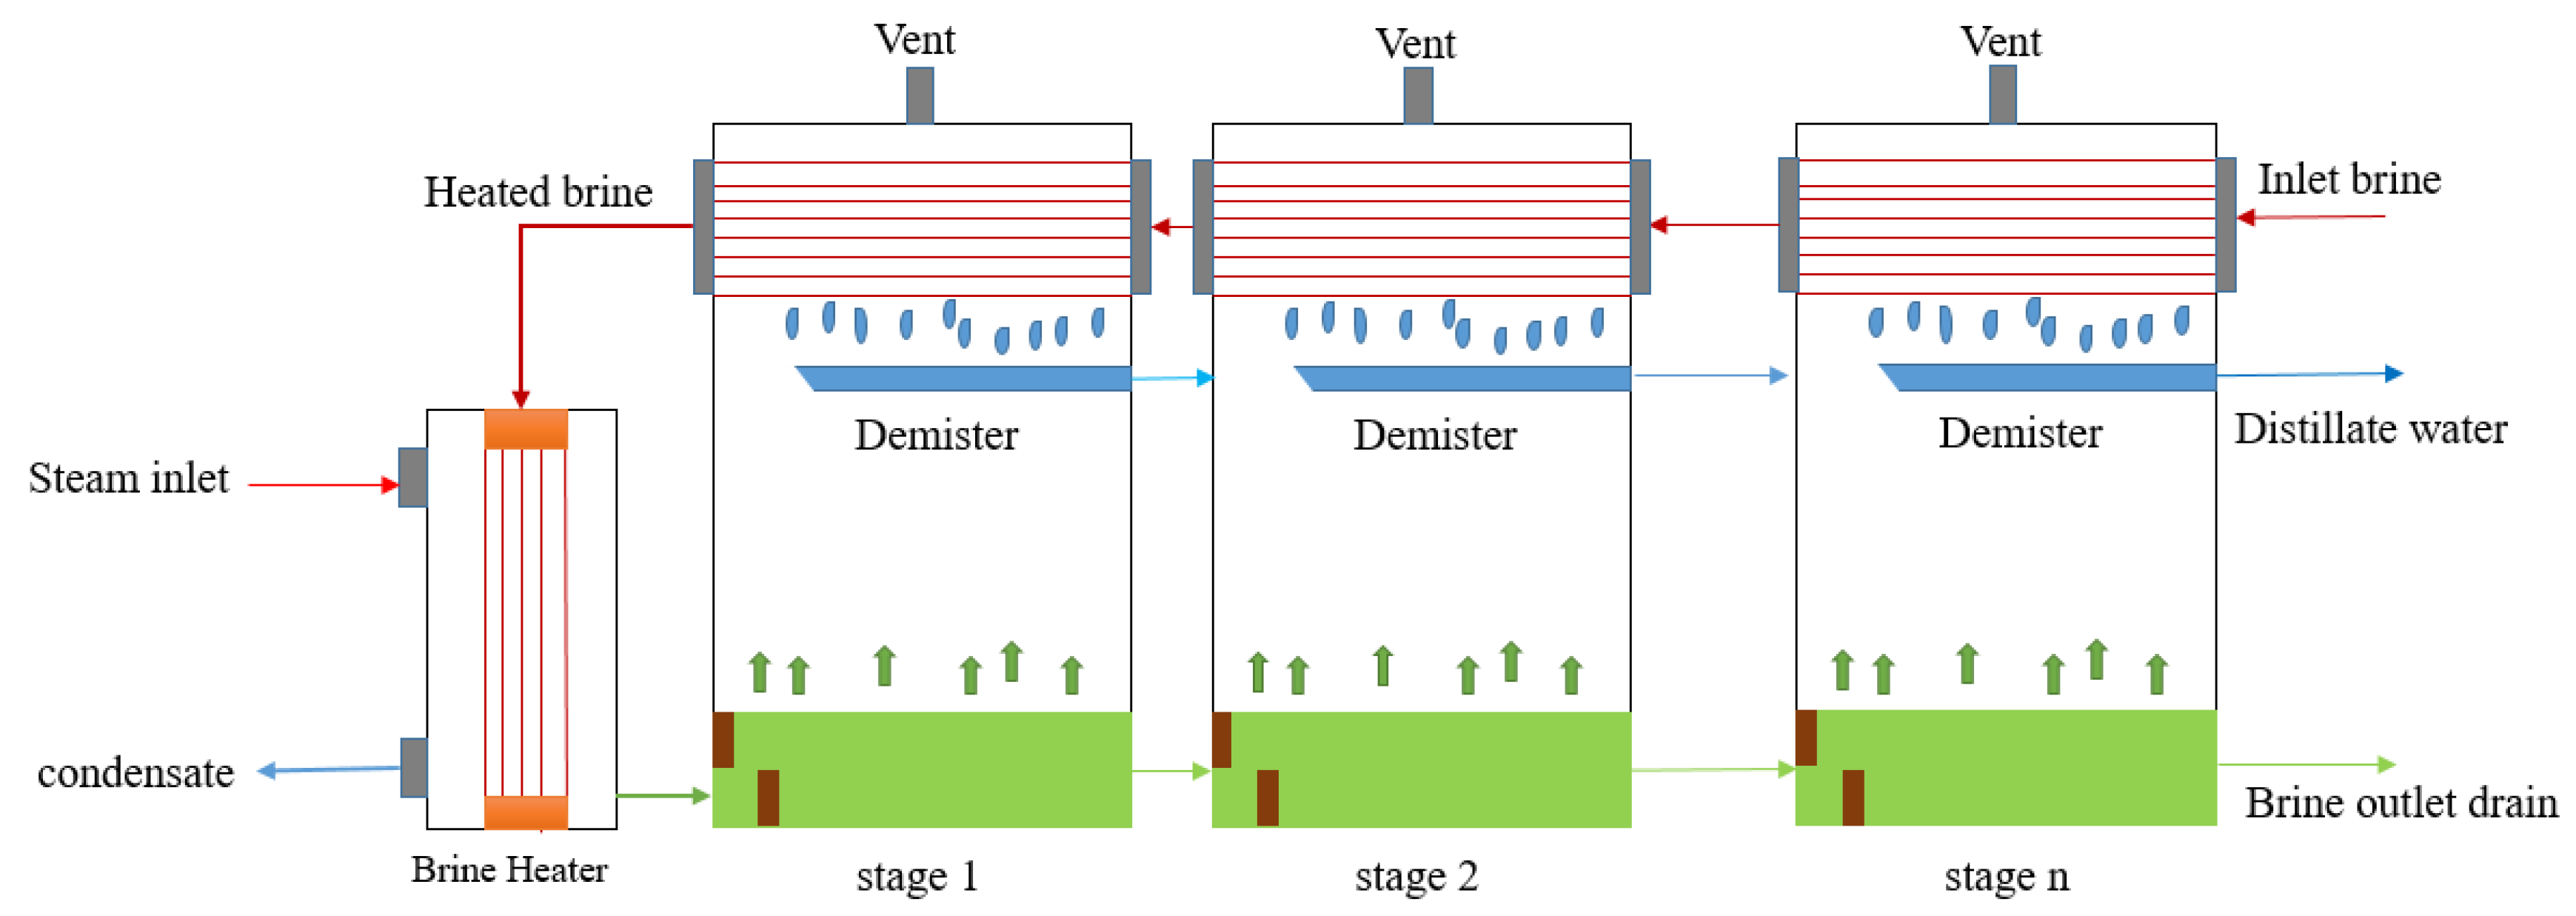
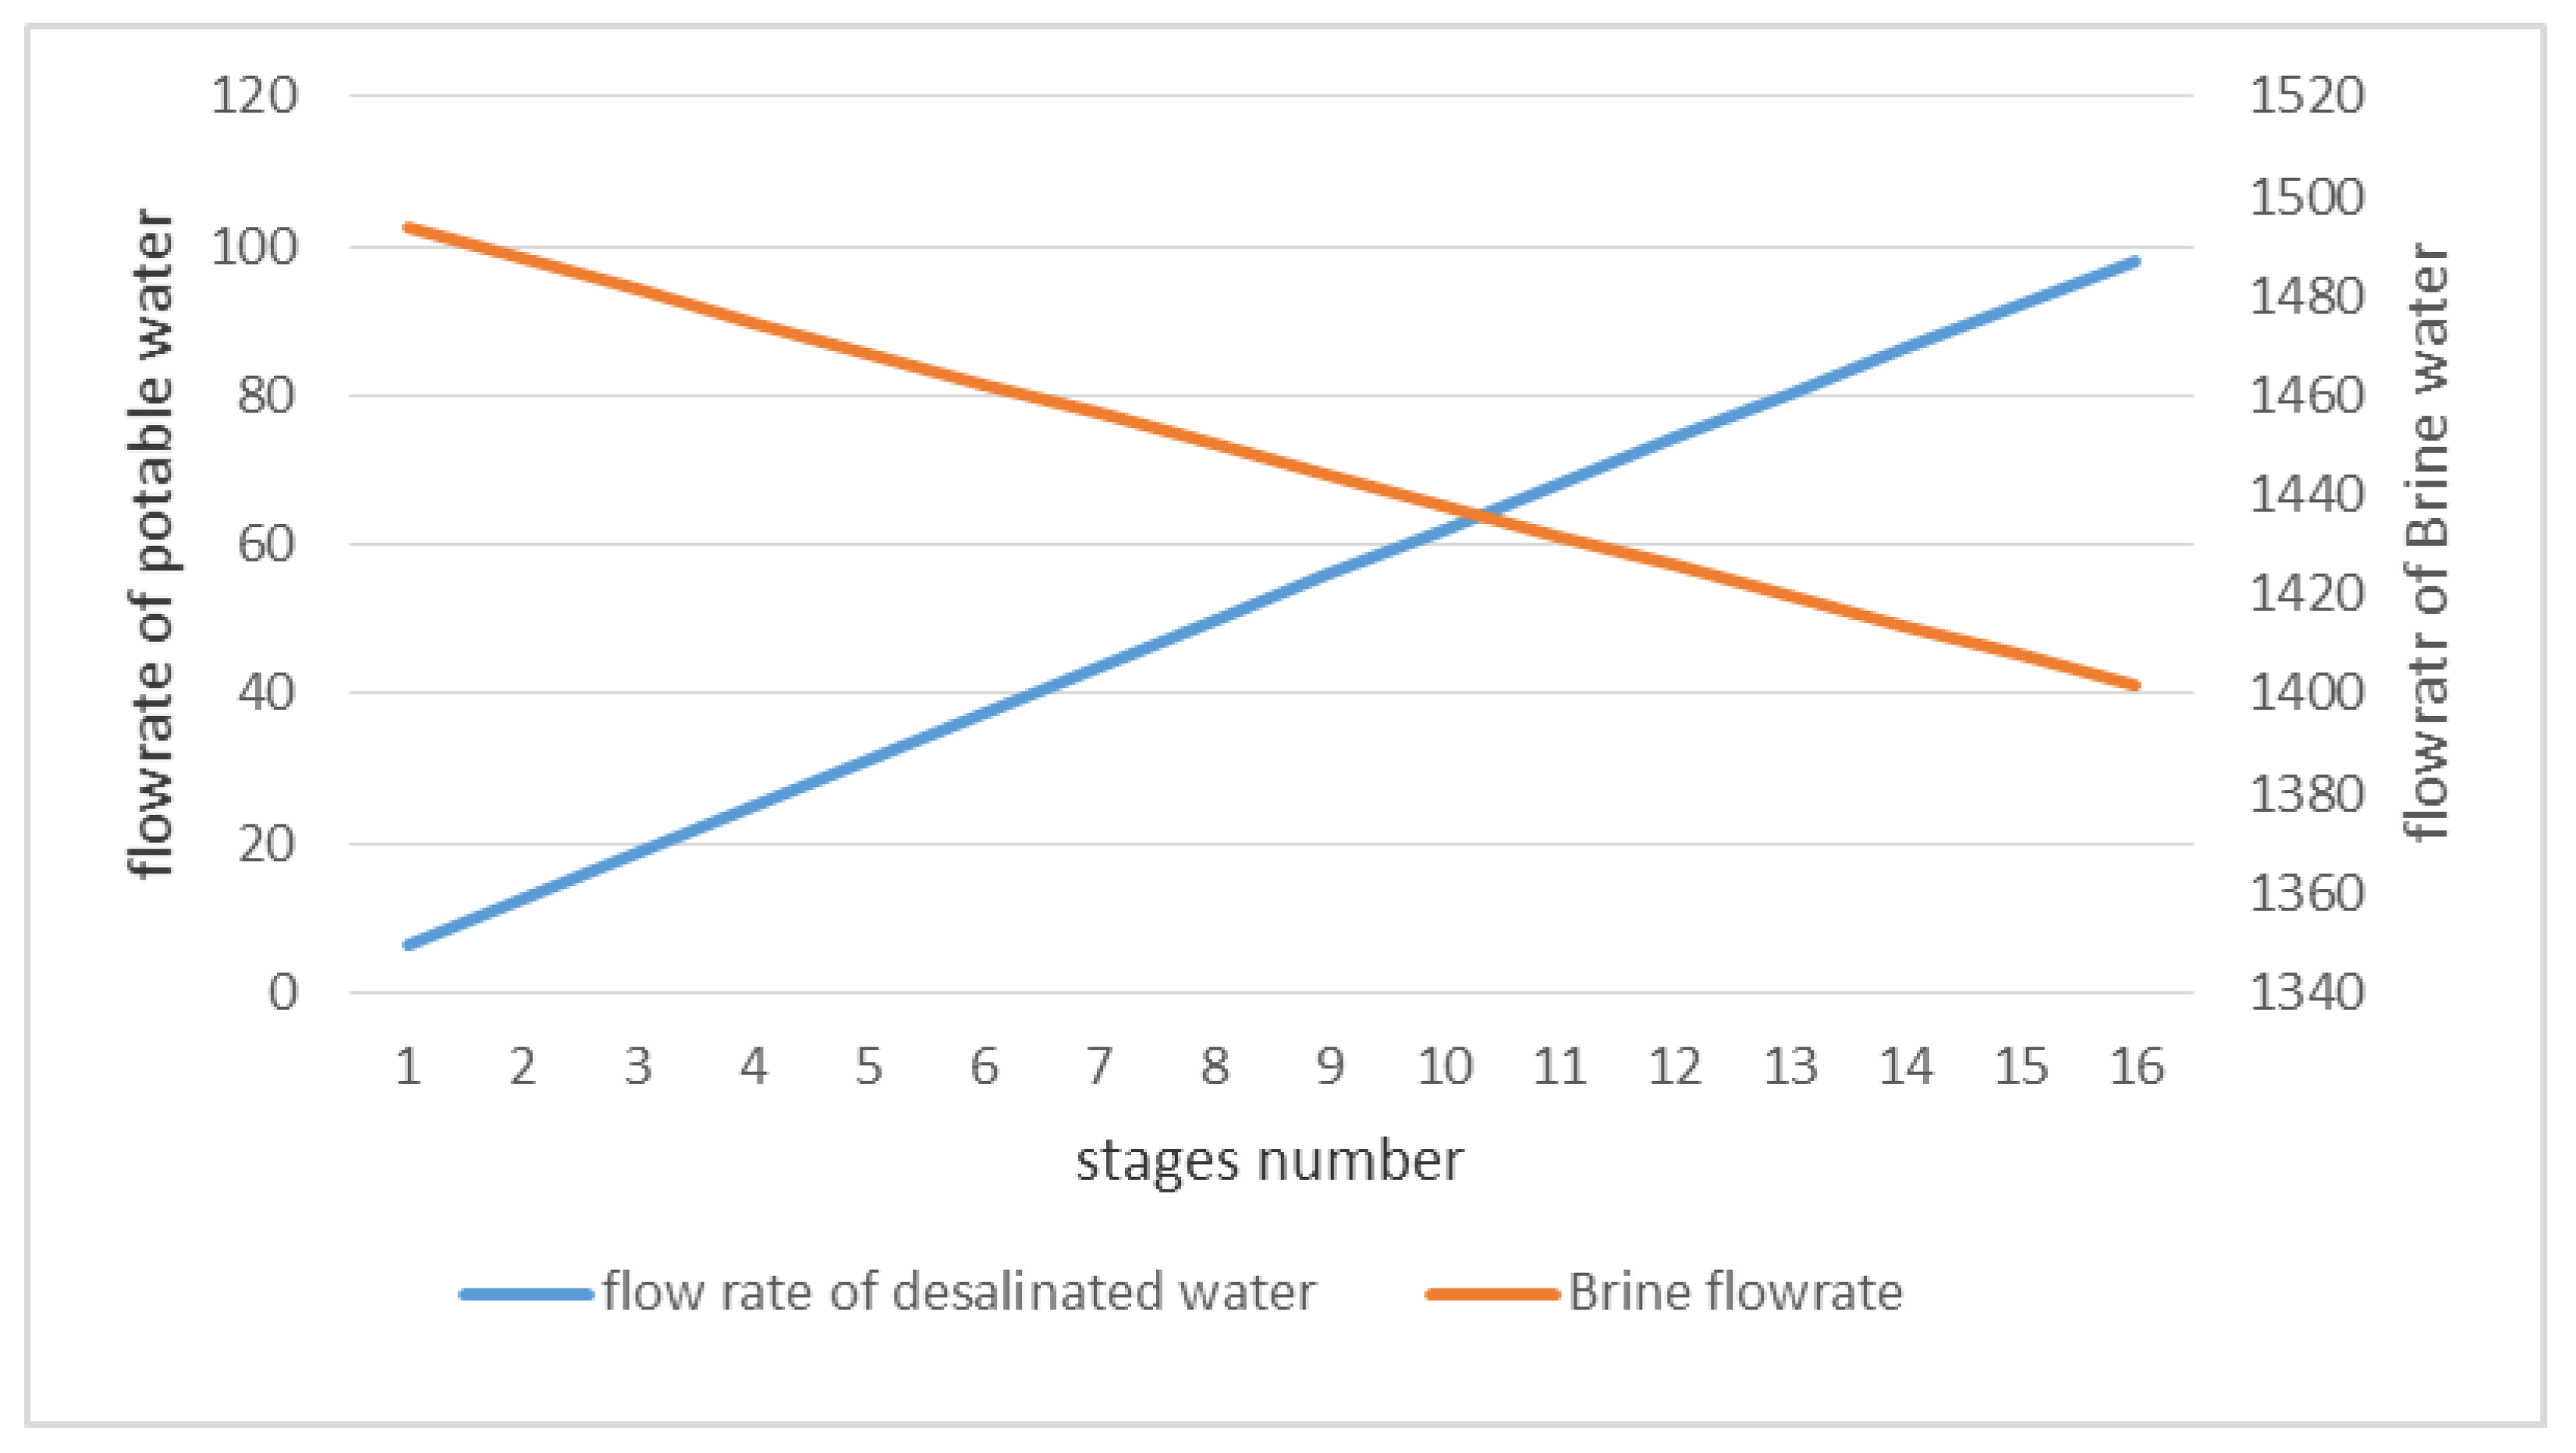
3.1. Once Through-Multi Stage Flash Performance

In this section, the results of the water plant are illustrated. The simulated facility was able to produce 23 MWe and 8500 m3/day of distillate water. With regard to the OT-MSF part of the process, the results show that the temperature of top brine (T0) reached its maximum value at the first stage (around 91 °C), then started to decrease in each stage within a rate of 2 °C, as the temperature dropped. It eventually dropped to 55 °C in stage 16, as shown in Figure 6. A pre-heater was also erected after stage 16 to increase and moderate the temperature of intake seawater, which ranged from 24 to 33 °C, as mentioned before. The temperature of intake seawater was increased from 48 °C in stage 16 to around 84 °C in stage 1 before entering the brine heater.
In terms of mass flow rate, distillate water was accumulated stage by stage, as presented in Figure 7. At stage 1, the amount of condensed water in the gathering tray was around 3 kg/s, at stage 2, it became 6.3 kg/s, and at stage 16, it was around 97 kg/s. At the same time, the mass flow rate of the brine water (seawater) was decreasing due to the evaporation process in each stage. After the evaporation in stage 1, the mass flow rate decreased to 1497 kg/s and continued to decrease until stage 16, where it was approximately 1400 kg/s. It can be concluded that the mass balance of the evaporated and condensed water was more or less 3 kg/s in each stage.
It should be noted here that the salt concentration of the seawater was increasing from 42,000 mg/L to 45,000 mg/L because during the evaporation of water through the stages, the water is transferring from a liquid phase to a saturated water vapor phase, leaving behind an increment in the concentration of salt in the brine water in the lower stages of the MSF process. It should be noted here that the produced water is ready to use in the industry sector, if the water produced was intended to be used as a source of potable water post-treatment and is required in order to comply with local health regulations, preventing the risk of biological growth. A number of drinking water regulations and guidelines define the concentration limits for several substances, which are potentially hazardous for human health. In terms of brine discharge, of course it will contain a high concentration of salinity and chemical compounds like calcium bicarbonate due to the pre-treatment process of the water, and rather, working with high temperatures in the evaporation stages of the plant, where the brine must be well-treated before recirculating it into the seawater source. The treatment process of the brine is not in the scope of this research. Figure 8 illustrates the whole simulated facility as waste incineration plant and multi stage flash process, please note the pre-heater which was erected before the influent of seawater into the desalination plant to moderate its temperature around 48 ℃.

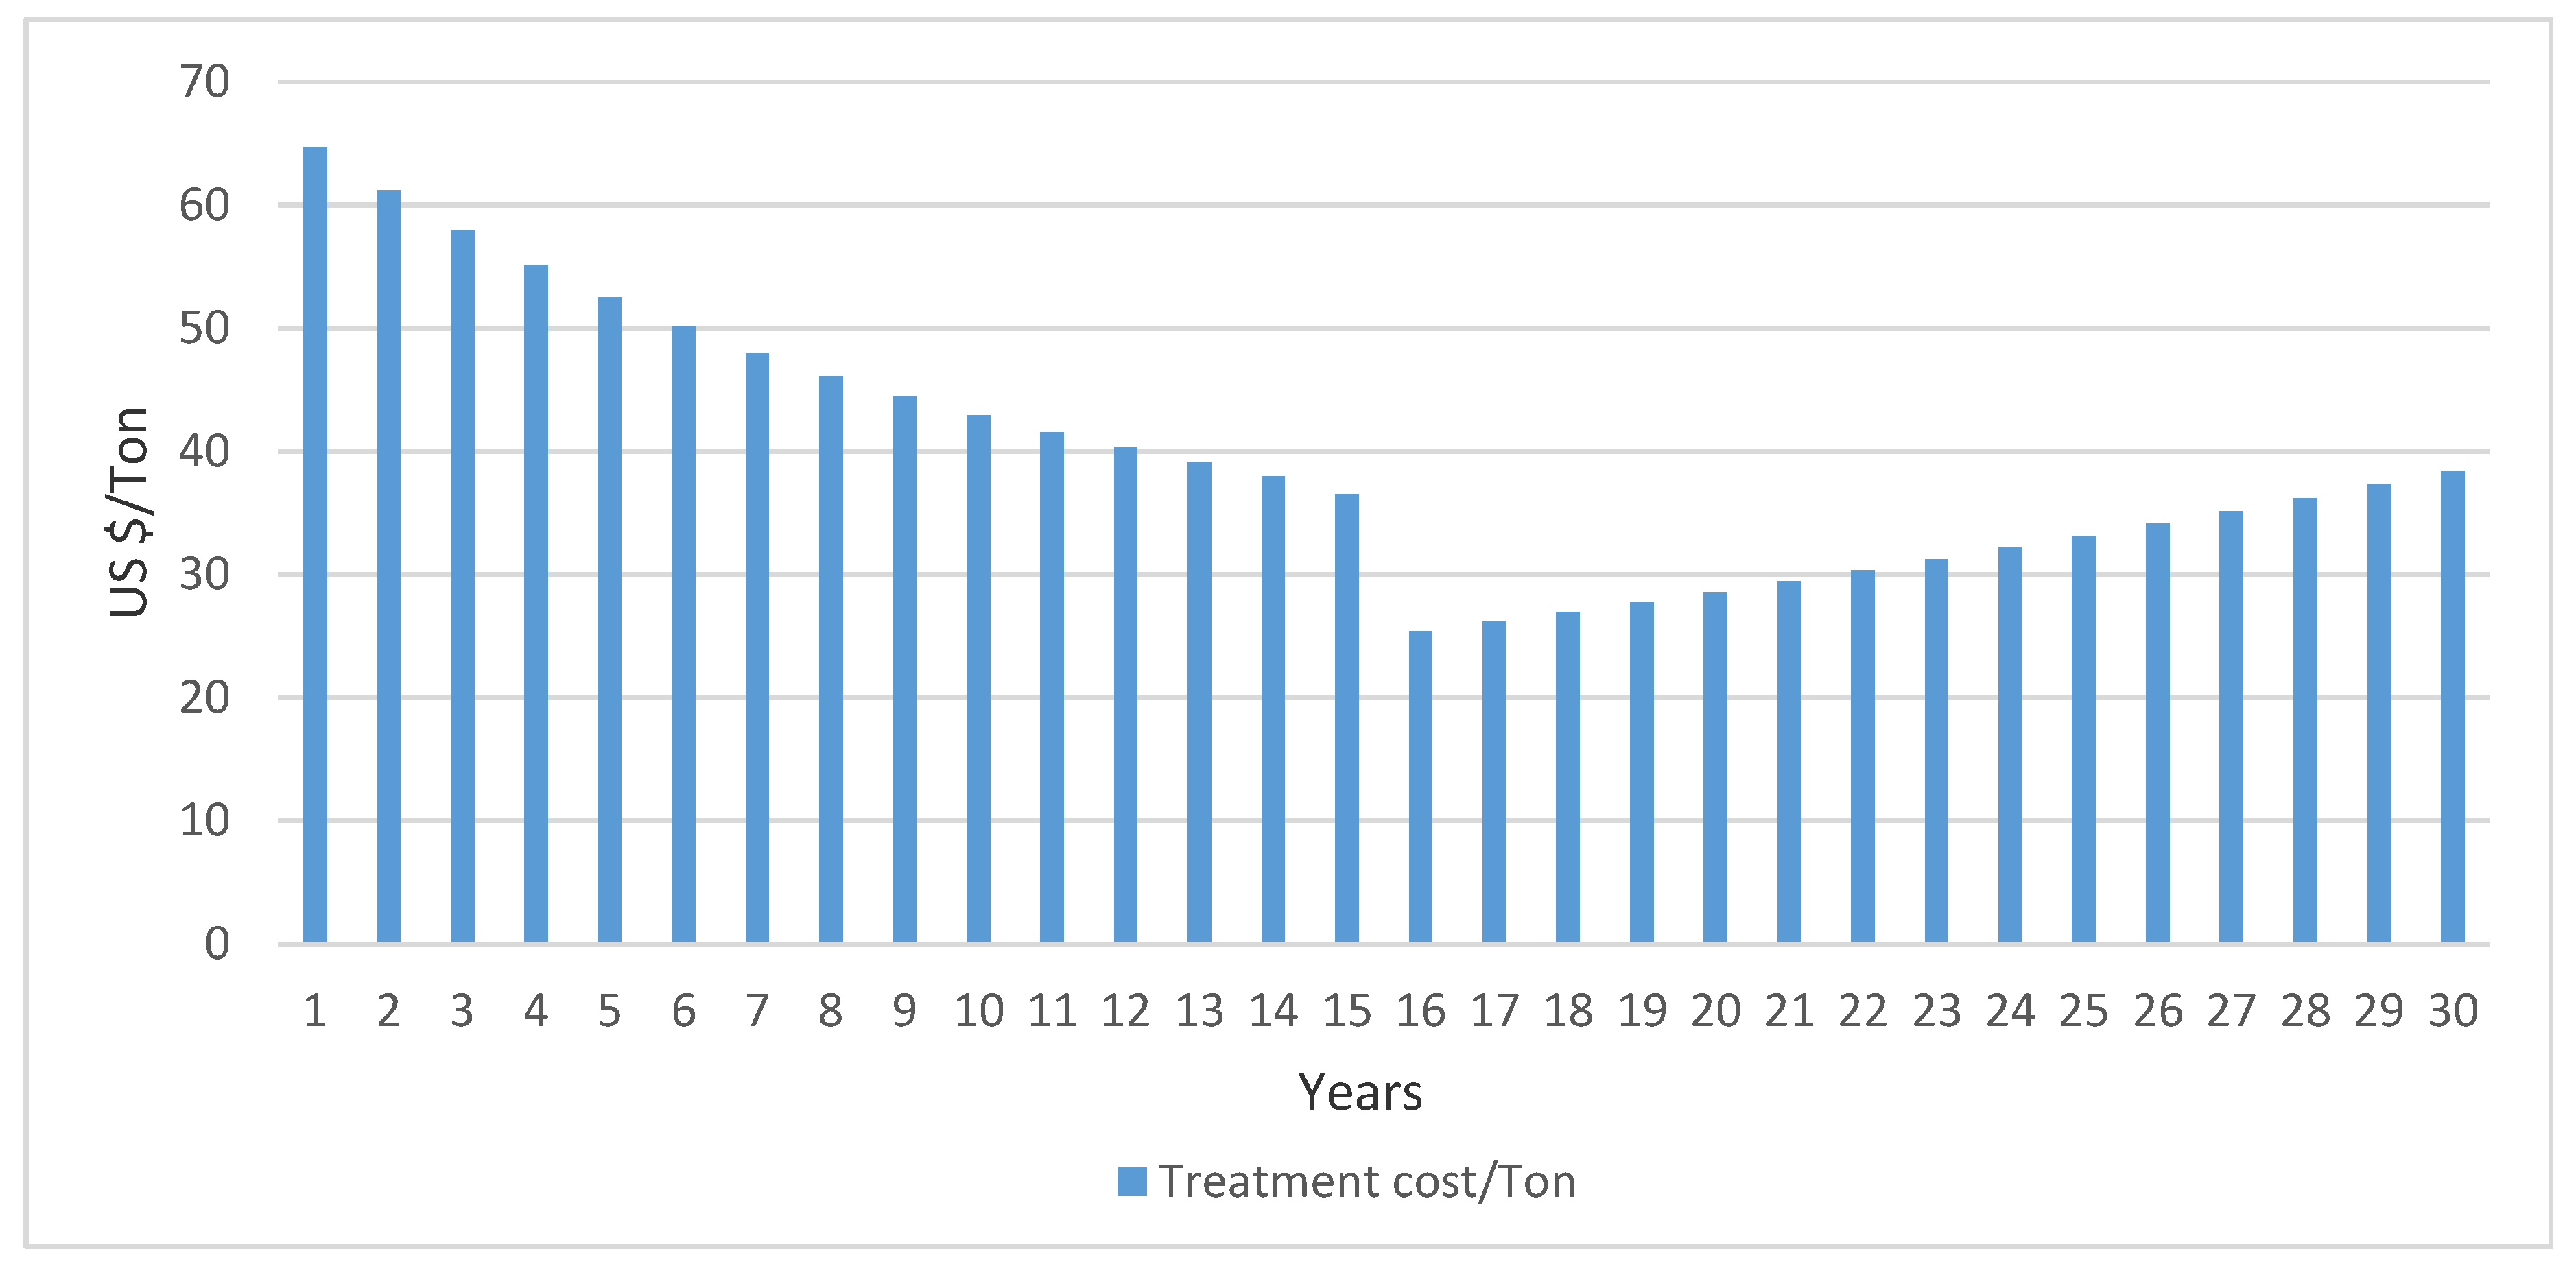
3.2. Economic Analysis

The most important part of this study is the cash flow analysis in terms of expenditure, income, and configured treatment cost for each ton of MSW, in order to make the concept of this research affordable and applicable for the municipality. Note, this plant works on treating MSW by reducing its volume and recovering dispersed energy. This represents the core concept of the circular economy—to deal with waste as a source of fuel. Furthermore, this plant produces useful power and potable water, which is critical to solve the water scarcity in the MENA region, especially for countries like Jordan. Figure 9 shows the distribution of expenditure and income through the whole lifetime of the power plant. It should be noted here that the expenditures were illustrated with minus values and the incomes with plus values.
Expenditure represents the capital and operational costs, while the income includes sales of power and water. It can be seen that capital costs reduce over the first 15 years then completely vanish. At the first operational year of the plant, they are around US$31 million and they reduce at a rate of around US$2 million/year. The operational costs are the only fixed costs during the whole lifetime of the plant; as shown in Figure 9, this amount (operational costs) is approximately US$26 million at the first year of operation. Please note that the effect of annual inflation rate has been embedded in this figure; therefore, there appears to be a yearly increase in operational costs and the same effect can also be noticed for the incomes. Also, the division of operational costs into fractional parts, i.e., maintenance, salaries, treatment of emission gases, and ash disposal, are detailed in the definition of Figure 9.
Formulated or configured gate fees, which should be paid by the municipalities to the WI investor (government sector, private sector, public private partnership), were analyzed and calculated by computing the annual expenditure and income, as illustrated in Figure 10.
As can be seen from Figure 10, one can calculate the cost of treatment for each ton of waste by taking the difference between expenditure and income then dividing the resulting value by the capacity of the WI plant in terms of MSW (in this paper, this was taken to be 650,000 ton/year). It can be seen from the figure that the cost of treatment decreases during the first 15 years, due to the paying back of capital costs, which represent the main component of expenditure.
Finally, it should be noted that in the first year, the treatment cost per ton is US$64 and this decreases to reach US$36 in year 15. At year 16, it is US$25, which is a very important result in this year, when the CAPEX has been totally returned and the expenditure is only the operational costs. The increment starting from year 17 is related to the effect of the inflation rate, which was taken as a fixed value of 3%. According to the equations above, the levelized cost of electricity (LCOE) was also calculated and was found to be US$241/MWh.
Finally, the CO2 emissions were also taken into consideration, as mentioned before. These were calculated according to Equation (6) and by taking the WI capacity (650,000 ton/year) as a scale factor to show the effect of landfilling according to that capacity. The available data about MSW treatment processes in the MENA region, where 7–10% of MSW is recycled and the rest is going to landfill, were also inserted in the calculations. The results show that the same amount of MSW going to landfill will produce approximately 490,000 Tons of CO2, while WI generates 269,000 Tons.

4. Discussion

The simulated plant in this research shows the ability to recover the content energy from waste and convert it to useful electric power through steam Rankine cycle power block. The system was able to produce 23 MWe and 8500 m3/day of desalinated water by utilizing the heat energy from one of the extractions of the steam turbine in Once-Through Multi Stage Flash, two configurations are available for MSF technology: OT-MSF and brine recirculation, where the amount of water production depends on the MSF configuration, number of stages, and temperature of the seawater; therefore, a pre-heater has been used to moderate the temperature of the seawater. By this, the efficiency of stages in terms of water production was increased and the effect of seasonal changes of the temperature of seawater was reduced.
Many studies have introduced the concept of Waste-to-Energy-to-Water. Udono et al. [45] developed a model in a simpler, understandable way to reduce efforts required for modeling complex multi-domain problems, which can be adapted to any local conditions by changing the local parameters. Jana et al. [46] utilized ASPEN Plus (AP for short, is the leading Chemical Process Simulator in the market) to model the polygeneration process of power and water from biomass. It was found that biomass have strong potential for efficient delivery of several outputs with lesser/negative CO2 emission as a sustainable solution.
Dajnak et al. [47] stated that the concept of Waste-to-Energy-to-Water needs further study to optimize the conversion process and to assess the economy of the concept relative to competing desalination energy sources.
Pirotta et al. [48] investigated the potentiality of energy recovery from the MSW of Maltese for power generation and water desalination. The best scenario considered corresponds to a potential electric power of 10 MW or to a maximum 4.8 million m3/year of desalinated water, it was concluded that the incineration has the greatest potential to maximize revenues, due to the optimal combination of heat production and electricity generation.
Many studies suggested other sources of waste for power and water production. Mohammed et al. [49] used waste gases that emerged from oil refineries rather than burning them in the air, hybrid MSF-MED (Multi Effect Desalination) thermal desalination processes are utilized in this study to produce a total range of 100–40,000 m3/day. Ishaq et al.’s [50] trigeneration system for electricity, hydrogen, and freshwater production using waste heat from a glass melting furnace was illustrated in this work. It concluded that the world should be seeking for new sources of energy with lesser impacts on the environment to cope with all the challenges.
In terms of cost analysis and levelized cost of electricity, it was in the range between 235–87 US$/MWh depending on the population density and on the analysis and the results which were shown in Reference [36]. While for a city with 600,000 inhabitants, the cost was found to vary between 113 and 183 US$/MWh, Nordi et al. [51] studied various waste management scenarios considering incineration, recycling, and anaerobic digestion, and the generation cost was found to vary from 80 to 150 US$/MWh.
However, the novelty of this research is that it introduced a comprehensive potential energy recovery from MSW for the MENA region generally and for Jordan specifically to produce power and desalinated water through a combined heat power cycle for waste incineration plants; furthermore, an integrated economic analysis for the treatment cost for each ton of waste has been illustrated and it was demonstrated how to calculate it by using cash flow, capital cost, and operational costs concepts.

5. Conclusions

In this study, many points have been highlighted while seeking to explore the concept of converting waste to power and generating water. There were two main targets of this work. The first was to illustrate an efficient usage for waste heat (steam) from the power plant to generate potable water. The MENA region suffers from great water scarcity, and Jordan, which was chosen as a case study in this work, is classified as the fourth worst-off country in the world in terms of water shortage. Note that the cost of this thermal energy is free of charge in the MENA region. Second, municipalities and responsible government institutions face many financial and technical problems in dealing with MSW; therefore, this research introduced an innovative concept to treat the MSW and also proposed a financial strategy through the economic analysis discussed earlier. It can be stated that the simulated system was able to generate 23 MWe and 8500 m3/day of potable water by recovering the energy content in MSW with 7 MJ/kg as LCV (elements fractions, as mentioned in Table 2). The mass flow rate of the distillate water was 97 kg/s as a total accumulation of 16 stages, average flow per stage was approximately 3 kg/s, and salt concentration increased from 42,000 mg/L to 45,000 mg/L, which is a normal effect due to evaporated water. In terms of economic analysis, it was found that the treatment cost for each ton of waste would be US$64 during the first year of the plant’s life, while in the second year, this would reduce to reach US$61/ton. The cost would continue to decrease until, in year 15, it would be US$36/ton. The lowest price would be in year 16, at US$25/ton. Taking the average for 30 years, the annual treatment cost (gate fees) would be US$39/ton.

Author Contributions

Conceptualization, Q.T. and A.N.; Methodology, Q.T. and A.N.; Software, Q.T.; Validation, Q.T. and A.N.; Formal Analysis, Q.T. and A.N.; Investigation, Q.T. and A.N.; Resources, Q.T.; Data Curation, Q.T. and A.N.; Writing—Original Draft Preparation, Q.T.; Writing—Review and Editing, Q.T. and A.N.; Visualization, Q.T. and A.N.; Supervision, A.N.; Project Administration, M.N.; Funding Acquisition, A.N. and M.N. All authors have read and agreed to the published version of the manuscript.

Funding

This research was funded by DAAD German Academic Exchange service, as a part of the PhD scholarship grant for Qahtan Thabit.

Acknowledgments

The authors would like to thank Steag Company “Steag Energy Services GmbH” for their essential support through providing the Ebsilon software package to achieve this research.

Conflicts of Interest

The authors declare no conflict of interest.

References

  1. Markic, D.N.; Carapina, H.S.; Bjelic, D.; Bjelic, L.S.; Ilić, P.; Pesic, Z.S.; Kikanovic, O. Using Material Flow Analysis for Waste Management Planning. Pol. J. Environ. Stud. 2018, 28, 255–265. [Google Scholar] [CrossRef]
  2. Tomić, T.; Schneider, D.R. Circular economy in waste management—Socio-economic effect of changes in waste management system structure. J. Environ. Manag. 2020, 267, 110564. [Google Scholar] [CrossRef] [PubMed]
  3. Rada, E.C.; Ragazzi, M.; Torretta, V.; Castagna, G.; Adami, L.; Cioca, L.I. Circular economy and waste to energy. AIP Conf. Proc. 2018, 1968, 030050. [Google Scholar]
  4. Haupt, M.; Vadenbo, C.; Hellweg, S. Do We Have the Right Performance Indicators for the Circular Economy?: Insight into the Swiss Waste Management System. J. Ind. Ecol. 2016, 21, 615–627. [Google Scholar] [CrossRef]
  5. Ferronato, N.; Rada, E.C.; Portillo, M.A.G.; Cioca, L.-I.; Ragazzi, M.; Torretta, V. Introduction of the circular economy within developing regions: A comparative analysis of advantages and opportunities for waste valorization. J. Environ. Manag. 2019, 230, 366–378. [Google Scholar] [CrossRef]
  6. Huber, F. Modelling of material recovery from waste incineration bottom ash. Waste Manag. 2020, 105, 61–72. [Google Scholar] [CrossRef]
  7. Federal Ministry for the Environment, Nature Conservation and Nuclear Safety. Waste Management in Germany 2018 Facts, Data, Diagrams; Federal Ministry for the Environment, Nature Conservation and Nuclear Safety: Berlin, Germany, 2018. [Google Scholar]
  8. Nassour, A.; Hemidat, S.; Chaabane, W.; Eickhoff, I.; Nelles, M. Current Development in Waste Management in the Arab World; Erich Scmidt verlag: Berlin, German, 2018; pp. 157–216. [Google Scholar]
  9. Elnaas, A. Actual situation and Approach for municipal solid waste treatment in Arab Region. Ph.D. Thesis, University of Rostock, Rostock, Germany, 2015. [Google Scholar]
  10. Hemidat, S. Feasability Assesment of Waste Management and Treatment in Jordan; University of Rostock: Rostock, Germany, 2019. [Google Scholar]
  11. Mungai, E.M.; Ndiritua, S.W.; Rajwani, T. Do voluntary environmental management systems improve environmental performance? Evidence from waste management by Kenyan firms. J. Clean. Prod. 2020, 265, 121636. [Google Scholar] [CrossRef]
  12. Nassour, A.; Hemidat, S.; Lemke, A.; Elnass, A.; Nelles, M. Seperation By manual sorting at home:state of the Art in Germany. In Source Separation and Recycling; The handbook of Environmental chemistry; Springer: Cham, Germany, 2017; Volume 63, pp. 67–87. [Google Scholar]
  13. Loukil, F.; Rouached, L. Waste collection criticality index in African cities. Waste Manag. 2020, 103, 187–197. [Google Scholar] [CrossRef]
  14. Malinauskaite, J.; Jouhara, H.; Czajczynska, D.; Stanchev, P.; Katsou, E.; Rostkowski, P.; Thorne, R.; Colón, J.; Ponsá, S.; Al-Mansour, F.; et al. Municipal solid waste management and waste-to-energy in the context of a circular economy and energy recycling in Europe. Energy 2017, 141, 2013–2044. [Google Scholar] [CrossRef]
  15. Aboelnga, H.; Saidan, M.; Al-Weshah, R.; Sturm, M.; Ribbe, L.; Frechen, F.-B.; Saidan, M. Component analysis for optimal leakage management in Madaba, Jordan. J. Water Supply: Res. Technol. 2018, 67, 384–396. [Google Scholar] [CrossRef] [Green Version]
  16. Jordan Green Building Council and Friedrich Ebert Stiftung. Your Guide to Waste Management in Jordan; Jordan Green Building Council and Friedrich Ebert Stiftung: Amman, Jordan, 2016. [Google Scholar]
  17. Saidan, M. Sustainable Energy Mix and Policy Framework for Jordan; Friedrich Ebert Stiftung: Amman, Jordan, 2012. [Google Scholar]
  18. Abu Qdais, H. Techno-economic assessment of municipal solid waste management in Jordan. Waste Manag. 2007, 11, 1666–1672. [Google Scholar] [CrossRef] [PubMed]
  19. Tchobanoglous, G.; Kreith, F. Handbook of Solid Waste Management; McGraw-Hill: New York, NY, USA, 2002. [Google Scholar]
  20. Mohammad, A. Solid Waste Management in Jordan. Int. J. Acad. Res. Bus. Soc. Sci. 2014, 4, 138–150. [Google Scholar]
  21. Al-Tarazi, E.; Abu Rajab, J.; Al-Naqa, A.; Elwaheidi, M. Detecting leachate plumes and groundwater pollution at Ruseifa municipal landfill utilizing VLF-EM method. J. Appl. Geophys. 2008, 65, 121–131. [Google Scholar] [CrossRef]
  22. Wang, K.; Nakakubo, T. Comparative assessment of waste disposal systems and technologies with regard to greenhouse gas emissions: A case study of municipal solid waste treatment options in China. J. Clean. Prod. 2020. [Google Scholar] [CrossRef]
  23. Muhammad, M.S.; Muhammad, N.N.; Abdul Wahab, Y.; Hamizi, N.A.; Badruddin, I.B.; Chowdhury, Z.Z.; Akbarzadeh, O.; Johan, M.R.; Yunus Khan, T.M.; Kamangar, S. Evaluation of Municipal Solid Wastes Based Energy Potential in Urban Pakistan. Process 2019, 7, 11. [Google Scholar]
  24. Schneider, D.R.; Loncar, D.; Bogdan, Z. Cost Analysis of Waste-to-Energy Plant. Strojarstvo 2010, 3, 369–378. [Google Scholar]
  25. Mazzoni, A.; Zaccagni, S. Status of Water Resources and Human Health in the Middle East and North Africa Region: An Integrated Perspective; Elsiever: Amsterdam, The Netherlands, 2019; pp. 805–815. [Google Scholar]
  26. Al-Saidi, M.; Birnbaum, D.; Buriti, R.; Diek, E.; Hasselbring, C.; Jimenez, A.; Woinowski, D. Water Resources Vulnerability Assessment of MENA Countries Considering Energy and Virtual Water Interactions. Procedia Eng. 2016, 145, 900–907. [Google Scholar] [CrossRef] [Green Version]
  27. World Bank. Beyond Scarcity, Water Secirity in the Middle East and North Africa; World Bank: Washington, DC, USA, 2017. [Google Scholar]
  28. Keulertz, M. Water and Food Security Strategies in the Mena Region. 2019. paper in MENARA website. Available online: http://www.menaraproject.eu/ (accessed on 29 May 2020).
  29. Programme United Nations Development. Water Governance in the Arab Region; United Nations: New York, NY, USA, 2013. [Google Scholar]
  30. Cipollina, A.; Micale, G.; Rizzuti, L. Seawater Desalination Conventional and Renewable Energies Process; Springer: Berlin, Germany, 2009. [Google Scholar]
  31. Nannarone, A.; Toro, C.; Sciubba, E. Multi-Stage Flash Desalination Process: Modeling and Simulation. In Proceedings of the 30th International Conference on Efficiency, Cost, Optimization, Simulation and Environmental Impact Of Energy Systems, San Diego, CA, USA, 2–6 July 2017. [Google Scholar]
  32. World Bank. The Role of Desalination in an Increasingly Water-Scarce World; International Bank for Reconstruction and Development: Washington, DC, USA, 2019. [Google Scholar]
  33. Li, J.; Sun, H.; Ye, X.; Gao, S.; Yang, J. Economic evaluation of 20,000 M3/Day seawater desalination coupling with floating reactor nuclear power plant. In IOP Conference Series: Earth and Environmental Science; IOP Publishing: Bristol, UK, 2019. [Google Scholar]
  34. Zhao, X.G.; Jiang, G.W.; Ang, L.; Yun, L. Technology, cost, aperformance of waste-to-energy incineration industry in China. Renew. Sustain. Energy Rev. 2016, 55, 115–130. [Google Scholar]
  35. Haraguchi, M.; Siddiqi, A.; Narayanamurti, V. Stochastic cost-benefit analysis of urban waste-to-energy systems. J. Clean. Prod. 2019, 224, 751–765. [Google Scholar] [CrossRef]
  36. Silva, L.J.D.V.B.D.; Dos Santos, I.F.S.; Mensah, J.H.R.; Gonçalves, A.T.T.; Barros, R.M. Incineration of municipal solid waste in Brazil: An analysis of the economically viable energy potential. Renew. Energy 2020, 149, 1386–1394. [Google Scholar] [CrossRef]
  37. Wu, S. Capital Cost Comparison of Waste-to-Energy (WTE), Facilities in China and the U.S.; Columbia University: New York, NY, USA, 2018. [Google Scholar]
  38. Gómez, A.; Zubizarreta, J.; Rodrigues, M.; Dopazo, C.; Fueyo, N. Potential and cost of electricity generation from human and animal waste in Spain. Renew. Energy 2010, 35, 498–505. [Google Scholar] [CrossRef]
  39. El-Dessouky, H.T.; Ettouney, H.M. Fundamentals of Salt Water Desalination, 1st ed.; Elsevier Science B.V: Amsterdam, The Netherlands, 2002. [Google Scholar]
  40. Ferrari, K.; Gamberini, R.; Rimini, B.; Brebbia, C.; Itoh, H. The waste hierarchy: A strategic, tactical and operational approach for developing countries. The case study of mozambique. Int. J. Sustain. Dev. Plan. 2016, 11, 759–770. [Google Scholar] [CrossRef] [Green Version]
  41. Deng, X.; Yang, W.; Li, S.; Liang, H.; Shi, Z.; Qiao, Z. Large-Scale Screening and Machine Learning to Predict the Computation-Ready, Experimental Metal-Organic Frameworks for CO2 Capture from Air. Appl. Sci. 2020, 10, 569. [Google Scholar] [CrossRef] [Green Version]
  42. US Environmental Protection Agency (USEPA). Summary Report: Global Anthropogenic Non-CO2 Greenhouse Gas Emissions: 1990–2030; U.S. Environmental Protection Agency: Washington, DC, USA, 2012.
  43. Johnke, B.; Hoppaus, R.; Lee, E.; Irving, B.; Martinsen, T. Good Practice Guidance and Uncertainty Management in National Greenhouse Gas Inventories; Published by the Institute for Global Environmental Strategies (IGES) for the IPCC: Hayama, Kanagawa, Japan, 2000. [Google Scholar]
  44. Sadi, M.; Arabkoohsar, A. Modelling and Analysis of a Hybrid Solar Concentrating-Waste Incineration Power plant. J. Clean. Prod. 2018. [Google Scholar] [CrossRef]
  45. Udono, K.; Sitte, R. Modeling seawater desalination powered by waste incineration using a dynamic systems approach. Desalination 2008, 229, 302–317. [Google Scholar] [CrossRef]
  46. Jana, K.; De, S. Polygeneration for power, utility heat, desalination and refrigeration: Comparative performance evaluation for different biomass inputs. Mater. Today Proceeding 2018, 5, 22908–22915. [Google Scholar] [CrossRef]
  47. Dajnak, D.; Lockwood, F.C. Use of thermal energy from waste for seawater desalination. Desalination 2000, 130, 137–146. [Google Scholar] [CrossRef]
  48. Pirotta, F.J.C.; Ferreirab, E.C.; Bernardo, C.A. Energy recovery and impact on land use of Maltese municipal solid waste incineration. Energy 2013, 49, 1–11. [Google Scholar] [CrossRef] [Green Version]
  49. Eldean, M.A.S.; Soliman, A.M. A novel study of using oil refinery plants waste gases for thermal desalination and electric power generation: Energy, exergy & cost evaluations. Appl. Energy 2017, 195, 453–477. [Google Scholar]
  50. Ishaq, H.; Dincer, I.; Naterer, G.F. New trigeneration system integrated with desalination and industrial waste heat recovery for hydrogen production. Appl. Therm. Eng. 2018, 142, 767–778. [Google Scholar] [CrossRef]
  51. Nordi, G.H.; Bereche, R.P.; Gallego, A.G.; Nebra, S.A. Electricity production from municipal solid waste in Brazil. Waste Manag. Res. 2017, 35, 709–720. [Google Scholar] [CrossRef] [PubMed]
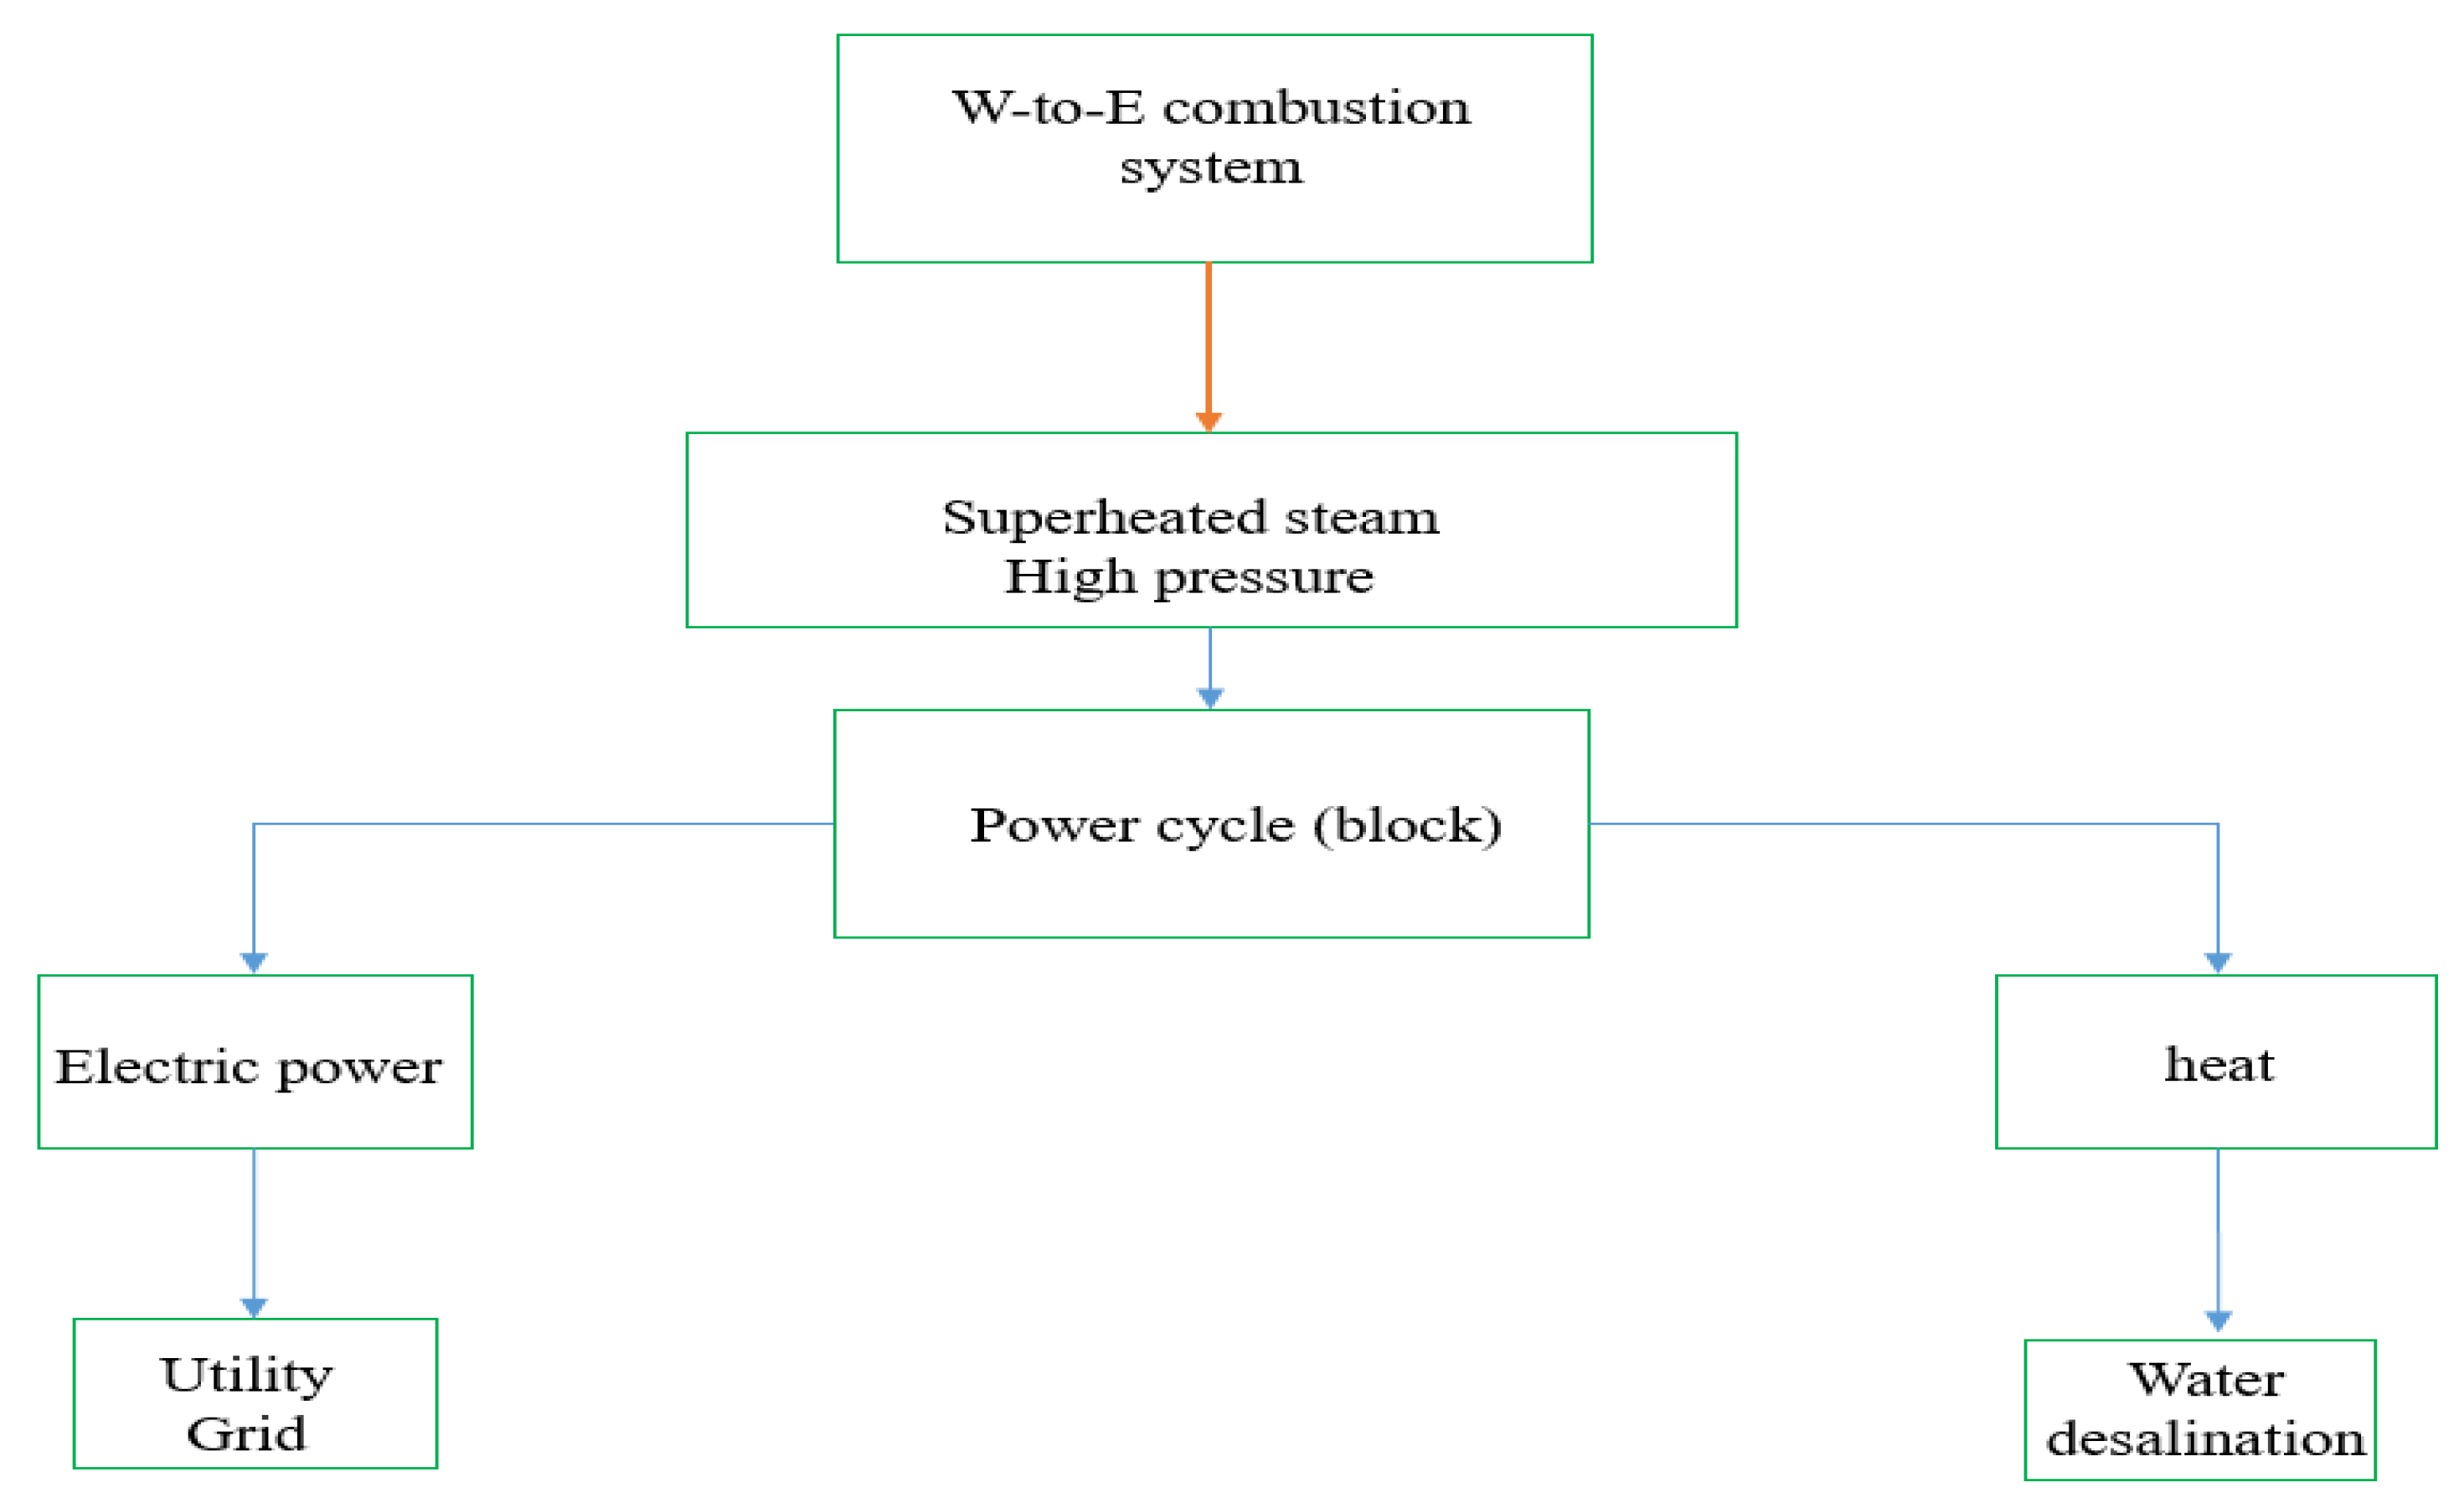
Figure 1. Distribution of waste incineration plants in Germany according to heat content, adapted from the German Environment Agency report [2,7].
Energies 13 02786 g001
Figure 2. Waste composition in the Middle East and North Africa (MENA) region [9].
Energies 13 02786 g002
Figure 3. Water scarcity in MENA countries, (A): 11 countries with great scarcity, (B): 8 countries with moderate scarcity (data adapted from References [27,28,29]).
Energies 13 02786 g003
Figure 4. Flowchart of the simulated power plant for waste incineration to produce power and potable water (W-to-W: waste to water by using heat in the multi-stage flash (MSF) process).
Energies 13 02786 g004
Figure 5. The once-through multi-stage flash process.
Energies 13 02786 g005
Figure 6. Temperature profile of the brine and intake seawater.
Energies 13 02786 g006
Figure 7. Flow rate distribution of brine water and distillate water in the MSF plant.
Energies 13 02786 g007
Figure 8. EBSILON model for the WI plant to produce power and potable water. Energies 13 02786 i001Water, Energies 13 02786 i002Steam, Energies 13 02786 i003Heat transfer fluid (Vp-1), Energies 13 02786 i004Water desalination.
Energies 13 02786 g008
Figure 9. Expenditure and income distribution over 30 years. Energies 13 02786 i005OPEX (20% salary, 40% emissions treatment, 23% maintenance, 15% ash disposal, 2% other). OPEX: Operation Expenses.
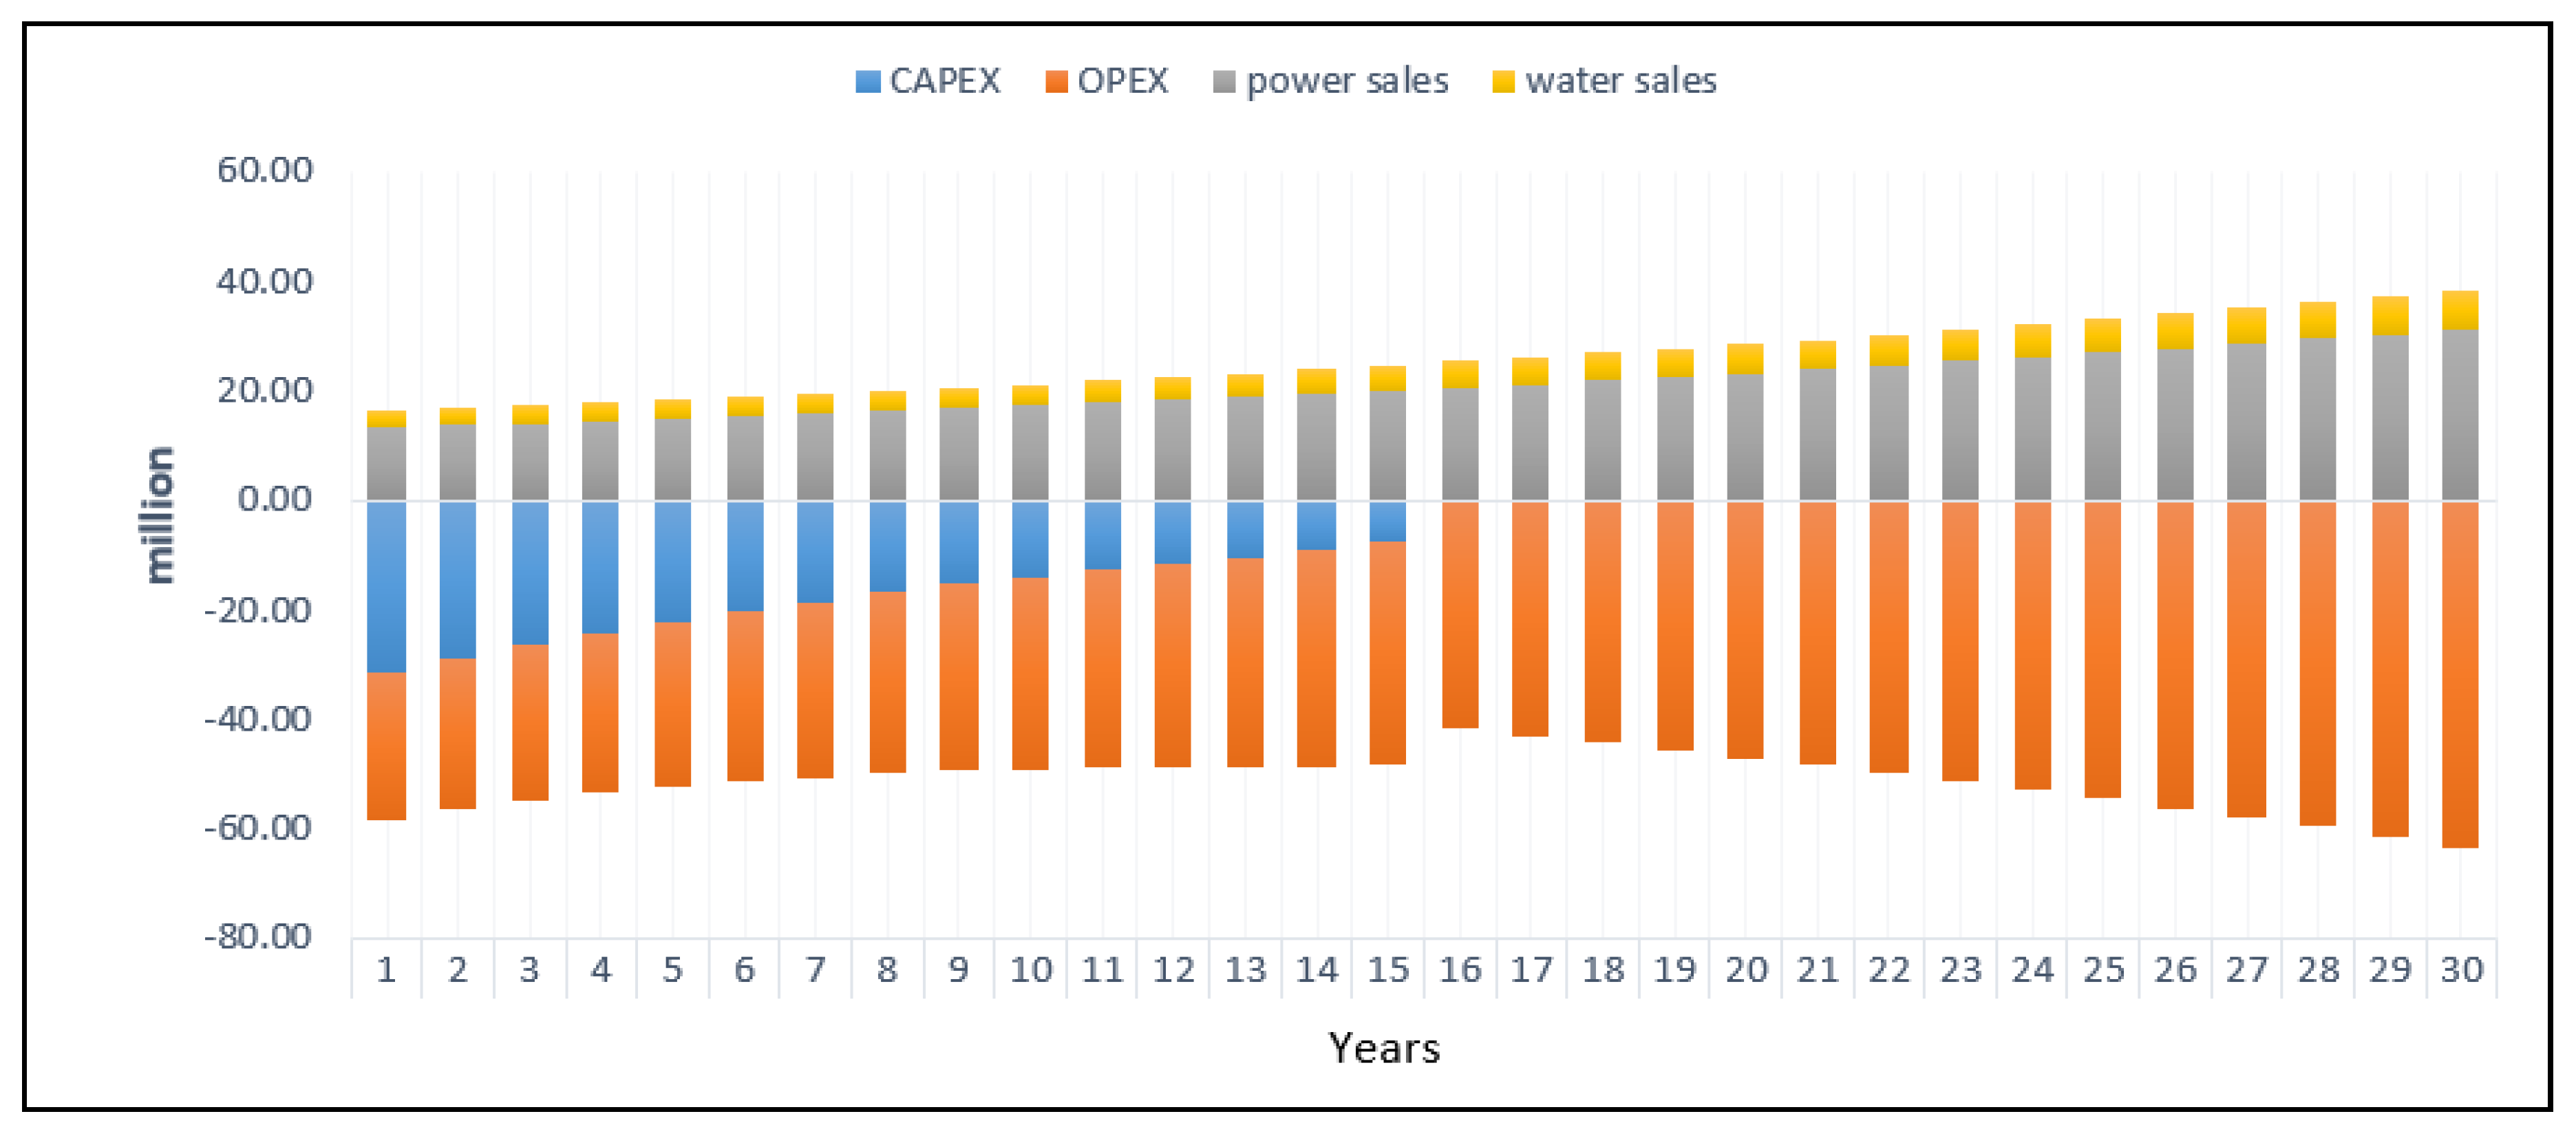
Energies 13 02786 g009
Figure 10. Annual distribution of treatment cost for each ton of MSW.
Energies 13 02786 g010
Table 1. Waste fraction divisions in Jordan [18].
FractionPercentage (%)FractionPercentage (%)
Organic50–60Metals2–4
Plastics10–15Glass2–4
Paper/cardboard10–14Wood and garden waste1–2
Other (e.g., hygiene products)5–10Textiles1–2
Table 2. Elementary analyses of the composition of raw waste in Jordan.
ParameterSymbolUnitValue
Water contentW%60
Total solids contentTS%40
Fuel ashA% of TS15
CarbonC% of TS46.0
HydrogenH2% of TS6.5
OxygenO2% of TS45.85
NitrogenN2% of TS0.9
SulfurS% of TS0.2
ChlorineCl% of TS0.55
Table 3. Technical parameters for the main components in a power block.
ComponentParameterValue
Steam turbineIsentropic efficiency85%
GeneratorGenerator efficiency85%
CondenserSteam pressure0.1 bar
PumpIsentropic efficiency80%
Pre-heaterEffectiveness70%
Table 4. Properties of the power plant.
ParameterSymbolValueUnit
CapacityQMSW650,000ton/year
Working hoursh7200h/year
Lower calorific valueLCV7MJ/kg
Live flue gas temperature-830°C
Exhausted flue gas temperature-150–223°C
Live steam temperature (Hp turbine)-400°C
Live steam pressure (Hp turbine)-80bar
Live steam temperature (Lp turbine)-120°C
Live steam pressure (Lp turbine)-2bar
Exhausted steam temperature (Lp turbine)-45°C
Incineration process efficiencyη0.8-
(QMSW: mass flow of MSW, LCV: Lower calorific value, Hp: High pressure, Lp: Low pressure).
Table 5. Capital and operational costs for different MSF plants in different countries in the MENA region [32] (MLD: million liters per day, O & M: operation and maintenance, KSA: kingdom of Saudia Arabia).
Plant Name and LocationOperation
Year
Size
(MLD)
Capital Cost
(US$/MLD)
O&M Cost
(US$/MLD)
Tobruk (extension), Libya201413.31.900.08
Rabigh, KSA200525.02.340.09
Abutaraba, Libya200740.01.750.07
Zuara, Libya201040.01.490.06
Layyah, United Arab Emirates200747.51.450.05
Ras Al Khaimah, United Arab Emirates200568.21.460.05
Sussa Derna Zawia, Libya2009160.01.340.05
Al Hidd, Bahrain 2008272.01.180.03
Ras Laffan, Qatar2010286.41.280.04
Marafiq Jubail, KSA2009800.01.390.06
Table 6. Technical parameters used in the model.
ParameterUnitSymbolValueReference of Values
Feed water flow rateKg/sMf1500Assumed
Salt concentrationmg/LXi42,000Literature
Feed seawater temperature°CTf48Calibrated
Steam temperature°CTs120Calibrated
Top brine temperature°CT093Calibrated
Brine temperature in the last (16th) stage°CTn55Calibrated
Table 7. Economic parameters used in the model.
ParameterUnitSymbolValueReference of Values
Inflation rate%f3Assumed
Interest rate%ri6Assumed
Discount rate%rd5Assumed
Cost of power saleUS$-0.08Assumed
Cost of water saleUS$-1.2Literature
Lifetime of the power plantyearsn30Literature
Operational hours of the power planth/yearh7200Literature

