Article

A Study on CO2 Methanation and Steam Methane Reforming over Commercial Ni/Calcium Aluminate Catalysts

1
Department of Civil, Chemical and Environmental Engineering, University of Genova, Chemical Engineering Pole, via Opera Pia 15, I-16145 Genova, Italy
2
INSTM, UdR Genova, via Dodecaneso 31, I-16146 Genova, Italy
3
Department of Chemistry and Industrial, Chemistry University of Genova, via Dodecaneso 31, I-16146 Genova, Italy
*
Authors to whom correspondence should be addressed.
Energies 2020, 13(11), 2792; https://doi.org/10.3390/en13112792
Submission received: 27 February 2020 / Revised: 23 May 2020 / Accepted: 25 May 2020 / Published: 1 June 2020
(This article belongs to the Special Issue Catalyst for Hydrogenation of CO2 to Fuels)

Abstract

:
Three Ni-based natural gas steam reforming catalysts, i.e., commercial JM25-4Q and JM57-4Q, and a laboratory-made catalyst (26% Ni on a 5% SiO2–95% Al2O3), are tested in a laboratory reactor, under carbon dioxide methanation and methane steam reforming operating conditions. The laboratory catalyst is more active in both CO2 methanation (equilibrium is reached at 623 K with 100% selectivity) and methane steam reforming (92% hydrogen yield at 890 K) than the two commercial catalysts, likely due to its higher nickel loading. In any case, commercial steam reforming catalysts also show interesting activity in CO2 methanation, reduced by K-doping. The interpretation of the experimental results is supported by a one-dimensional (1D) pseudo-homogeneous packed-bed reactor model, embedding the Xu and Froment local kinetics, with appropriate kinetic parameters for each catalyst. In particular, the H2O adsorption coefficient adopted for the commercial catalysts is about two orders of magnitude higher than for the laboratory-made catalyst, and this is in line with the expectations, considering that the commercial catalysts have Ca and K added, which may promote water adsorption.

Graphical Abstract

1. Introduction

Steam reforming of natural gas is the main process currently applied at the industrial level for the production of hydrogen [1,2,3,4]. The main reaction is assumed to be represented by steam methane reforming (SMR), an endothermic equilibrium reaction:
CH4 + H2O ⇆ CO + 3 H2
establishing together with the water gas shift (WGS) equilibrium:
CO + H2O ⇆ CO2 + H2
resulting, at least formally, in a “global reforming reaction” (GRR):
CH4 + 2 H2O ⇆ CO2 + 4 H2,
thus, producing a “syngas” containing H2, CO, CO2 and unreacted CH4. The reaction is usually realized at 1000–1200 K, 30–50 bar. Typical methane steam reforming catalysts [5] contain 10–25 wt% Ni supported over a low-surface-area refractory oxide, such as alpha-alumina, Mg aluminate spinel MgAl2O4, calcium aluminates and calcium-potassium aluminate CaK2Al22O34. A typical effect of this reaction consists in the production of carbon residue, in particular, “carbon whiskers” or nanotubes, which accumulate in the catalytic bed, clogging it and causing pressure drop and deactivation. The presence of additives in some commercial catalysts allows the reduction of the formation of carbon residues. In particular, potassium has a very positive effect in reducing the formation rate of carbon species, with the drawback of slightly reducing the catalytic activity of the catalyst [6].
Despite the many data available [1,2,3,4], some controversy still exists in reaction mechanism and path. Although most authors suppose that the reaction path implies SMR being the first step, followed by WGS to give the “formal” GRR reaction, it is also possible that GRR is the first real step, followed by the reverse of WGS (revWGS) to give the “formal” SMR reaction.
Hydrogenation of CO2 (MCO2) can produce several different products, among which methane and CO. Methanation reaction consists in the synthesis of methane from hydrogenation of COx. Formally, methanation of carbon monoxide (MCO) is the reverse of SMR (MCO = revSMR):
CO + 3 H2 ⇆ CH4 + H2O,
while methanation of CO2 (MCO2) is formally the reverse of GRR (MCO2 = revGRR):
CO2 + 4 H2 ⇆ CH4 + 2 H2O
The MCO2 reaction could result from the previous conversion of CO2 into CO, with the reverse water gas shift (revWGS):
CO2 + H2 ⇆ CO + H2O,
followed by MCO. Also, for methanation, the real reaction path is still not fully established. It is still not clear whether gas-phase CO is an intermediate in MCO2 (thus the reaction sequence is revWGS + MCO) or a final product (thus the MCO2 reaction would be parallel to the revWGS + MCO sequence).
A summary of the reactions considered in this study is given in Table 1.
Today, methanation of COx-containing mixtures is performed industrially to eliminate carbon-oxide impurities in hydrogen (low-temperature methanation [8]) or to produce Substitute or Synthetic Natural Gas (SNG) [9,10] using syngases rich in carbon oxides, like those arising from coal gasification. Ni-based catalysts supported on high-surface-area Al2O3 [10,11,12] are widely used for these applications. These catalysts have also been reported to be active for methanation of CO2-rich carbon-oxide mixtures as well as for pure CO2 methanation [13]. In fact, Ni metal catalysts are active for both steam reforming and methanation, according to the “micro-reversibility principle” [14]. The difference in catalyst formulations is essentially associated with the different stability requirements, related to the very dissimilar reaction conditions. In fact, while endothermic steam reforming must be realized at very high temperatures (1000–1200 K) with large excess of steam, exothermic COx-methanation is performed at a much lower temperature (450–750 K), with hydrogen excess or nearly stoichiometric feeds.
The methanation of CO2-rich gases or of pure CO2 in the presence of hydrogen is still not realized industrially [15]. It may be of interest in the future, for the production of methane or methane-hydrogen blends from captured CO2 as an element of “CO2 Capture and Utilization Technologies” (CCU) to reduce the emissions of greenhouse gases, with production of useful compounds. When dealing with conspicuous hydrogen use, such as in the PtX (Power to X) technologies, a great effort in renewable hydrogen sources, and sustainability of catalysts and processes, should be considered [16,17,18]. In this work, to achieve these targets, the attention is focused on abundant metal catalysts, avoiding the use of expensive and scarce active phases.
In the context of our studies on hydrogen production and CO2 methanation [19,20,21,22], this work aims at testing industrial steam reforming catalysts, both with and without potassium, as well as a home-made methanation catalyst (HMMC), in both SMR and MCO2. The experimental results are interpreted through the support of a simulation model developed for the laboratory reactors employed [23]. The model implements local mass and energy balances. For the local kinetics, the model proposed by Xu and Froment [24] is implemented, based on the assumption that the SMR, WGS and GRR reactions are reversible and can proceed simultaneously, thus implicitly including both the series and parallel kinetic network. In a companion paper [23], thermal effects occurring in the laboratory scale reactor are discussed in detail, whereas, here, the model is used to support the discussion of the experimental data.

2. Experimental

The catalysts, the laboratory reactors and the experimental procedures adopted are briefly described here, in Section 2.2. Laboratory Reactors, and in Section 2.3. Catalytic Experiments. Additional details on the catalytic reactor volumes involved and section sizing can be found in Reference [23].

2.1. Catalytic Materials

Commercial Johnson Matthey (JM) Katalco 57-4Q and 25-4Q quadrilobe SMR catalysts are used, after gentle grinding. According to the literature [5,6,25], the 57-4Q catalyst contains ~13 wt% Ni over a calcium aluminate cement, probably with a Ca:Al ratio of about 1:5 [26]. The surface area is 29 m2 g−1. The 25-4Q catalyst is a slightly alkalized version, doped with small amounts (1.8 wt%) of K2O [5]. A “home-made methanation catalyst” (HMMC) is prepared and used as a reference, where Siralox 5/170 (5% SiO2 and 95% Al2O3) is used as the support after calcination at 1073 K for 5 h. Nickel is then deposited through wet impregnation of an aqueous solution of Ni(NO3)2 ∙ 6H2O by achieving the desired Ni loading (26 wt% as wtNi ∙ 100/wtcatalyst). In Table 2, we report the composition as arising from the literature in the case of commercial catalysts and of FE-SEM and EDXS techniques for the HMMC catalyst.
Characterization of fresh and spent catalysts is beyond the scope of this paper. Data on the HMMC catalyst have been reported in previous papers [27], while data on the commercial catalysts are reported in several papers in the literature [5,6,25]. The state of nickel in spent catalysts was controlled by XRD, where metallic nickel was found in all cases.

2.2. Laboratory Reactors

The MCO2 and the SMR experiments are performed in two different laboratory scale fixed-bed catalytic tubular reactors [28], respectively. The geometry is the same in both cases, reported in Figure 1. In both reactors, the catalytic packed bed (indicated as PBR, packed bed reactor, in Figure 1) is located inside a silica glass tubular reactor with a diameter of 6 mm. The reactor is followed by an empty silica glass tube with a diameter of 6 mm, denominated post-reactor 1 (P-R1). At the exit of P-R1, the silica glass tube is connected to an empty stainless-steel pipe with a diameter of 6 mm, denominated post-reactor 2 (P-R2). At the exit of P-R2, the gaseous mixture is sampled for analysis.

2.3. Catalytic Experiments

All catalytic experiments are performed in steady state conditions.
The MCO2 experiments are performed with feed gas composition: 6.1% CO2, 29.8% H2, N2 balance, with 81.6 mL min−1 total flow rate (at RTP, reference temperature and pressure of 273.15 K and 101.325 kPa respectively), corresponding to 6.7 × 10³ h−1 GHSV calculated (at RTP) on the basis of the volume of the catalytic section (PBR) of the reactor and the inlet flow. In order to follow any hysteresis, activation or deactivation effects, CO2 hydrogenation experiments are performed both with ascending and descending furnace temperature steps (523 K, 573 K, 623 K, 673 K, 723 K, 773 K and reverse). Online product analysis is performed using a Nicolet 6700 FT-IR instrument. Frequencies are used where CO2, CH4 and CO molecules absorb weakly (2293 cm−1 for CO2, 2170 cm−1 for CO, 1333 cm−1 for CH4, after subtraction of baseline water absorption) with previous calibration using gas mixtures with known concentrations, in order to have quantitative results. Produced water is condensed before the IR cell, and the amount is weighted and used to check the consistency of the mass balances. CO2 conversion, XCO2, selectivity, Si, and yields to products, Yi, are calculated for CO and CH4 on the basis of the measured inlet and outlet total flows (which make it possible to take into account the mole number variation during the reaction) and concentrations (calculated from the absorbances of CO, CO2 and CH4). Definitions are given in Table 3.
For the SMR experiments, the feed gas composition is: 5% CH4, 20% H2O, He balance. Two total flow rates are experimented: 120 mL/min (at RTP), corresponding to GHSV = 2.1 × 10⁴ h−1 (at RTP) calculated on the basis of the volume of the catalytic section (PBR) of the reactor, and 80 mL/min (at RTP) corresponding to GHSV = 1.4 × 10⁴ h−1 (at RTP). SMR experiments are performed both with ascending and descending furnace temperature steps (773 K, 813 K, 853 K, 893 K, 933 K, 973 K, 1013 K, 1053 K, 1093 K, 1133 K, 1173 K and reverse). Product analysis is performed with an Agilent 4890 gas-chromatograph equipped with a Varian capillary column “Molsieve 5A/Porabond Q Tandem” and TCD and FID detectors in series. Between them, a nickel catalyst tube is employed to reduce COx to CH4. Product analysis is also performed on a Thermo-Fisher FOCUS coupled with ISQ GC/MS, in order to have a precise identification of the compounds. Methane conversion, XCH4, selectivity, Si, and the hydrogen yield are calculated according to the definitions given in Table 3.

3. Modeling

The experimental results are interpreted through the support of a simulation model developed for the laboratory reactors employed. The typical technique adopted in kinetic modeling is to set up an analytical equation for the reaction rate (if a kinetic mechanism is under study, then a system of analytical equations is set up, one for each reaction step). This is then coupled to an error minimization routine, often implementing a non-linear least squares (NLLS) algorithm. The resulting tool is then used to perform a regression of the kinetic experimental data, in order to identify the values of the kinetic model parameters. In addition, the fitting error is evaluated. In this work, the approach is different. The typical reactor modeling approach is applied, based on local mass and energy balances [28]. These are coupled to the local kinetic model (the same as described above). The model equations are reported in Table 4. This set of equations, once integrated, is able to capture any variations of temperature and composition along the reactor. Further details about the model are reported in a companion paper [23], where thermal effects occurring in the laboratory reactor are discussed in detail, whereas, here, the model is used to support the discussion of the experimental data.

4. Results

4.1. Model Calibration against Experimental Data

In Section 3, the kinetic model was discussed in comparison to the reactor model. From a mathematical point of view, there is an essential difference between the two models. The first, i.e., the kinetic model, is an analytical non-linear equation (or a system of these). The second, i.e., the reactor model, in addition to analytical non-linear equations (the kinetic model) also includes ordinary or partial differential equations (the local mass and energy balances), requiring specific numerical integration. This is the reason why the first type of model is (more or less) easily coupled to an error minimization routine, to perform a regression of kinetic experimental data. Coupling the chemical reactor model to an error minimization routine implies a level of difficulty which is an order of magnitude higher. Thus, in this study, the procedure adopted to calibrate the model against the experimental data is a trial-and-error procedure. The experimental data are, for each catalyst, the compositions of the reacted gas stream at the sampling point, and they are reported in the subsequent Sections, in Figure 2, Figure 3 and Figure 4. The absolute error between modeling and experimental molar fractions at the sampling point (ymod and yexp respectively), is defined as:
E r r a b s = | y m o d y e x p |  
The percentage absolute error is defined as:
E r r r e l = 100 E r r a b s y e x p  
To capture the experimental data, adjusting coefficients are introduced in the kinetic subroutine, as reported in Table 5. The kinetic parameters are kept at the original values proposed in Reference [24]. The adjusting coefficients are tuned to minimize the percentage absolute error, averaged over all the experimental data available for each catalyst. The values of the average absolute error and average percentage absolute error are reported in Table 6 for the three catalysts tested in this work.
The resulting values of the adjusting coefficients are reported in Table 5. The coefficient ζ6, related to H2O adsorption, is 90–95 times higher for commercial catalysts than for the catalyst produced in the laboratory, and this is in line with expectations, considering the commercial catalysts have Ca and K added in order to promote H2O adsorption. As regards the activation energies of the SMR and WGS reactions, the values of ζ4 and ζ5 in Table 5 are similar to those proposed in Reference [35], reporting values corresponding to ζ4 = 1.07 and ζ5 = 1.33. In addition, in Reference [35], the activation energy of the GRR reaction is multiplied by a factor 0.97, whereas in our case, no adjusting coefficient is used (i.e., the adjusting coefficient is 1). The catalyst used in Reference [35] was 18 wt% NiO on α-Al2O3 supplied by Johnson Matthey Plc, tested at about 600 °C for SMR and GRR, and at about 300 °C for WGS. Therefore, the values proposed here for the kinetic parameters agree with those reported in the literature for analogous catalysts.

4.2. HMMC Catalyst

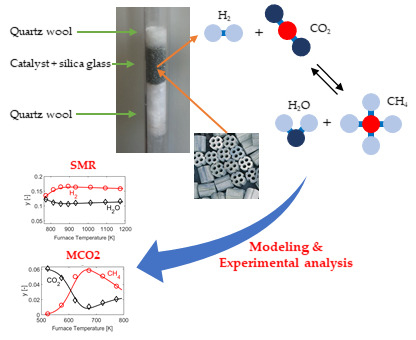
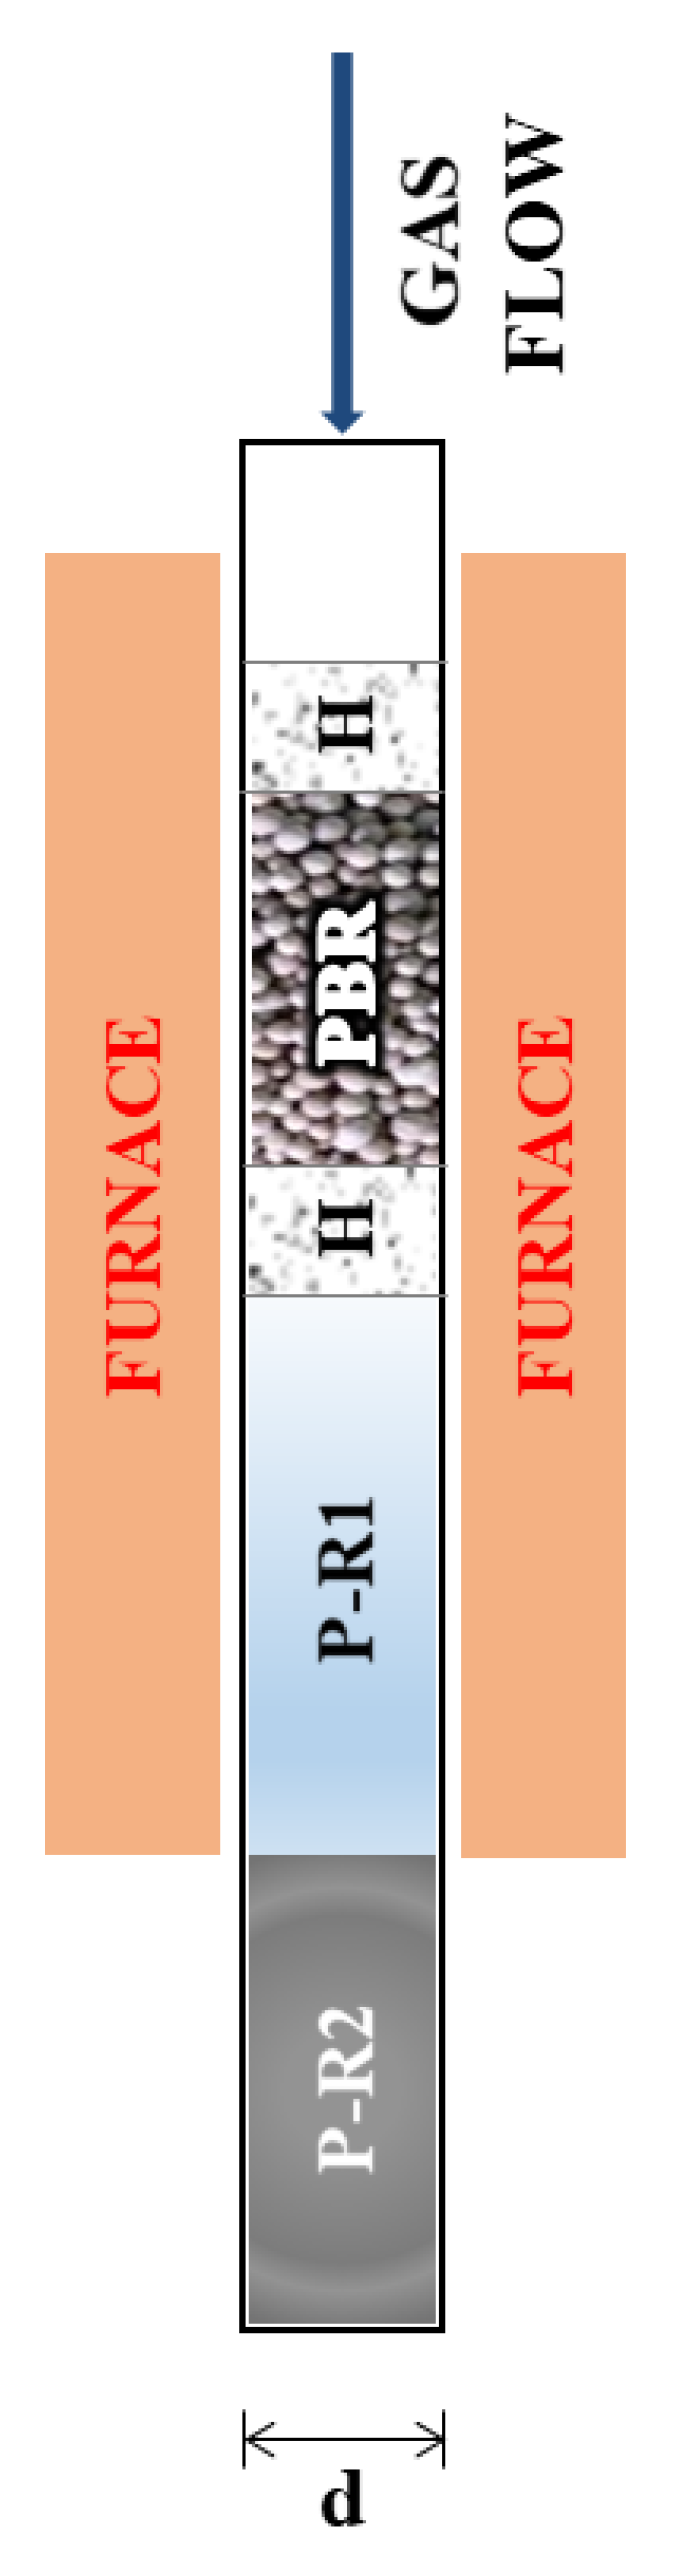
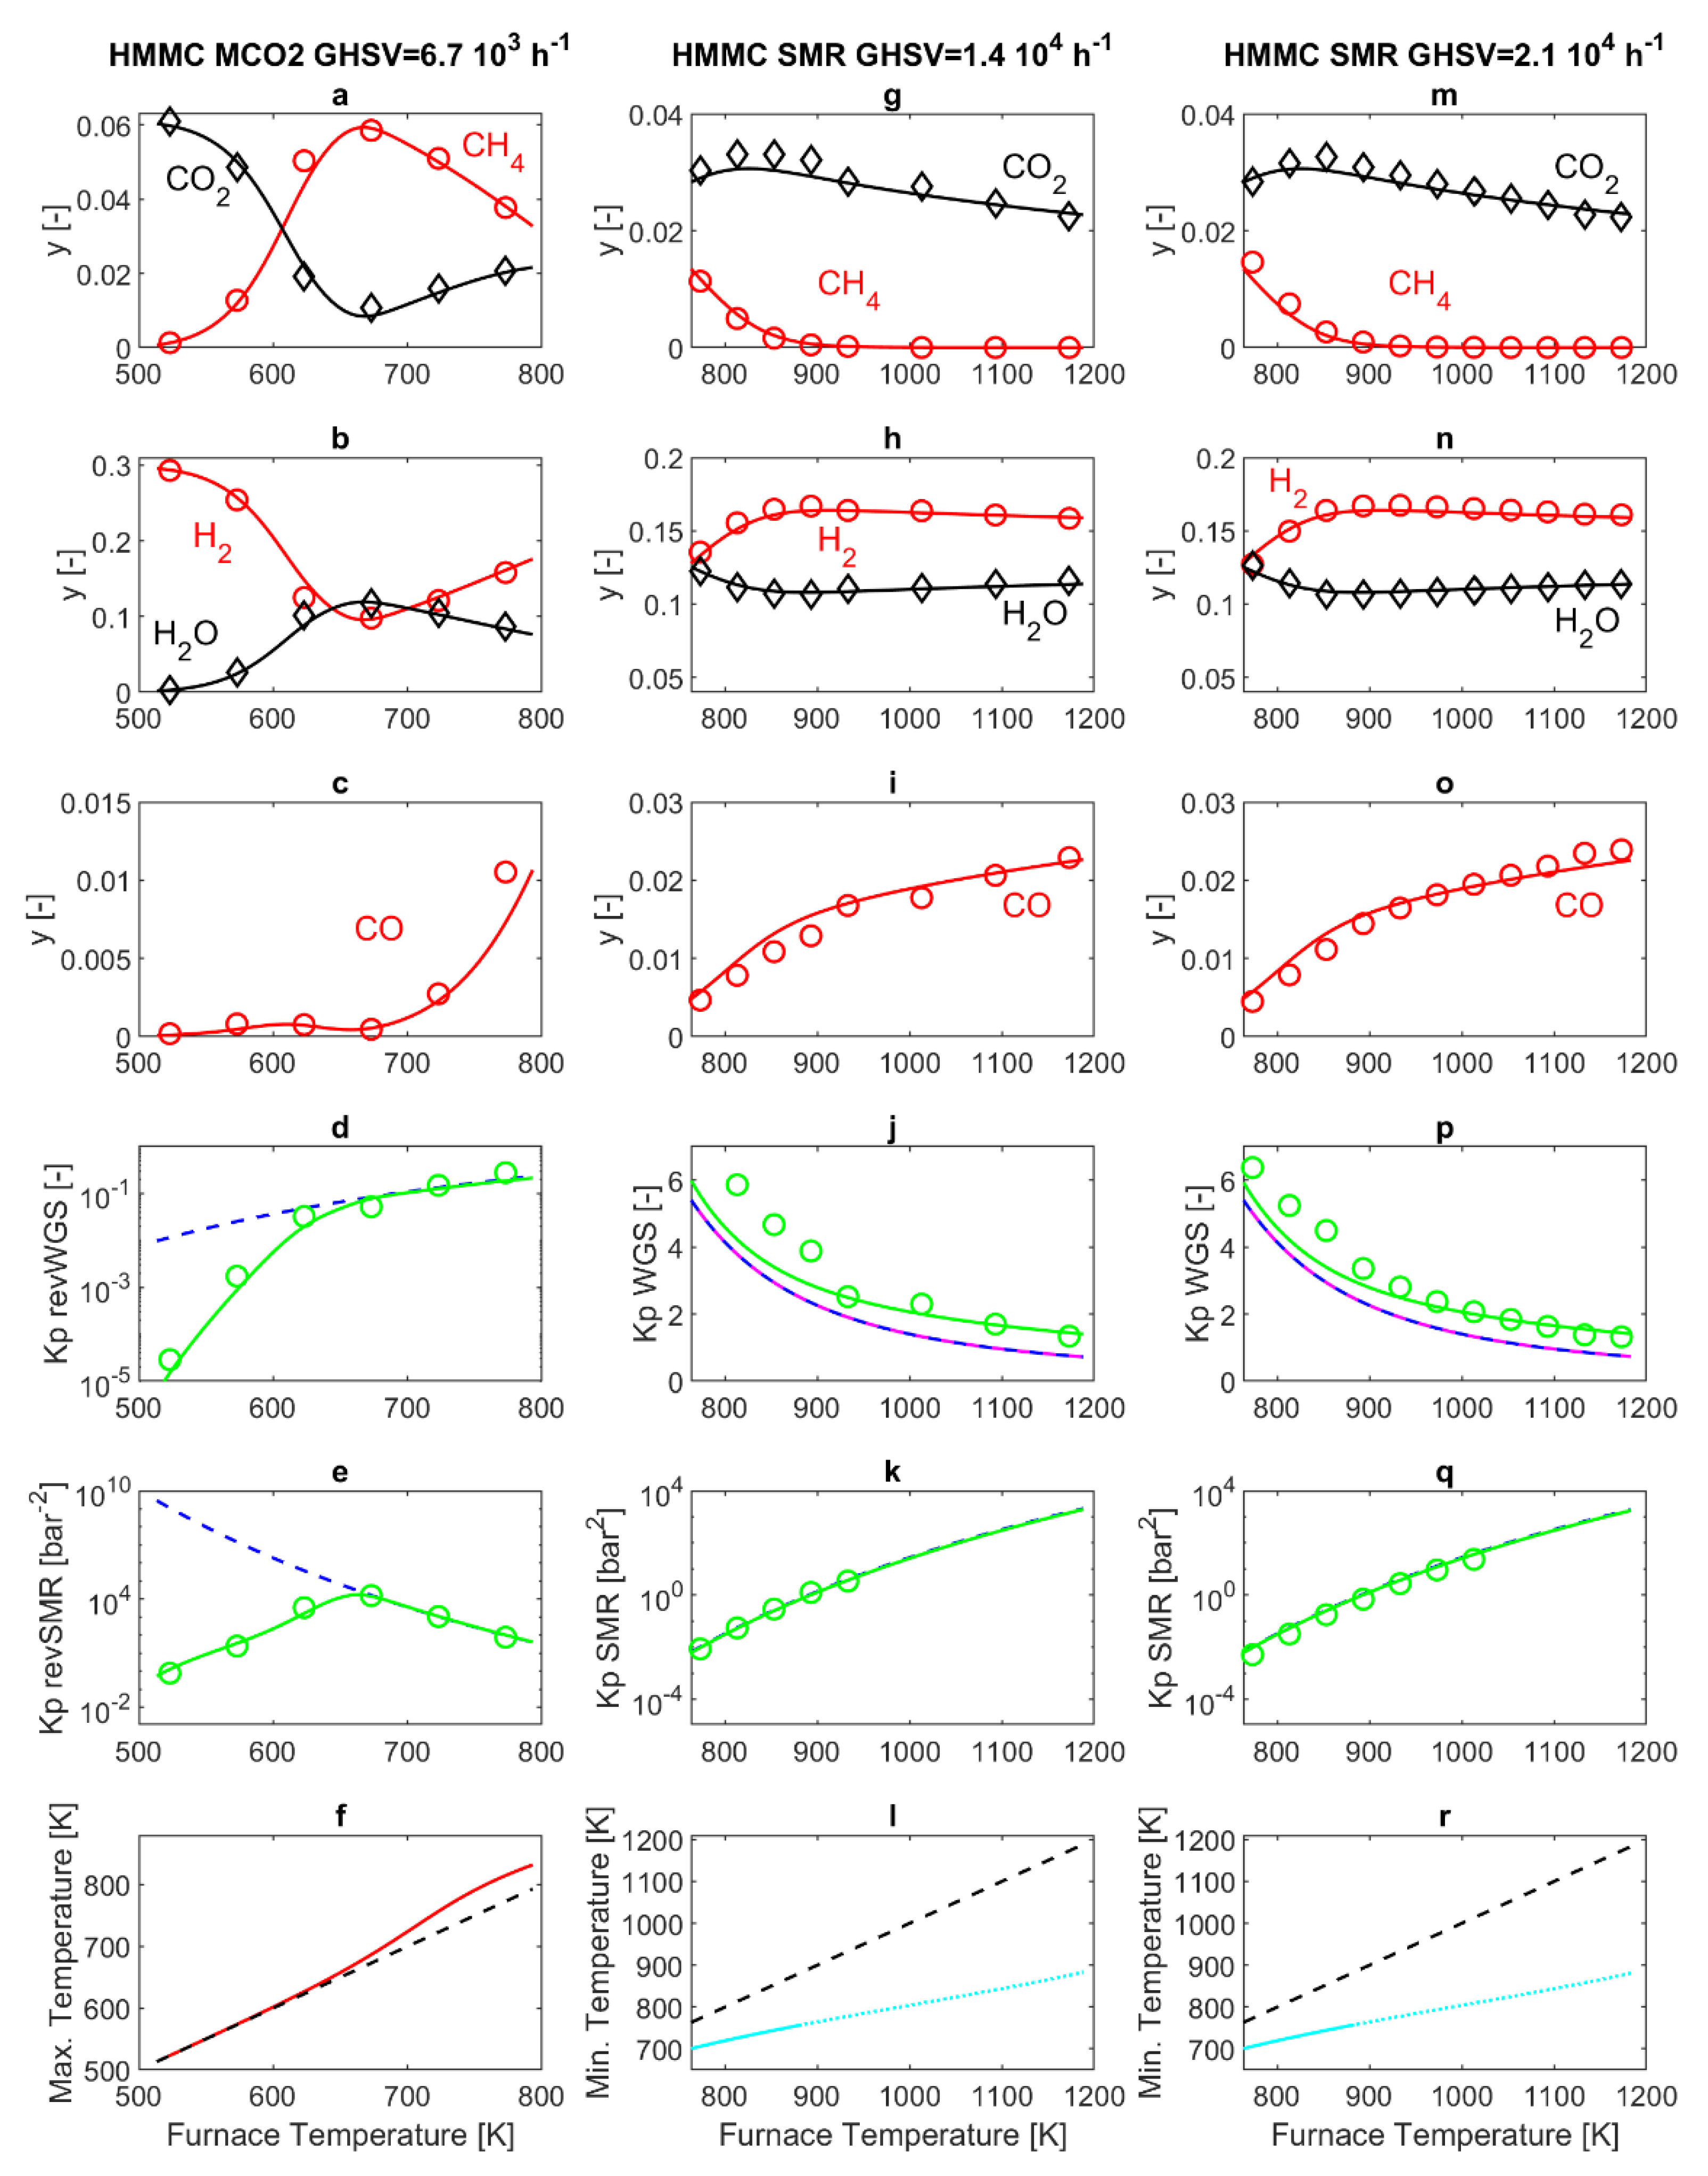
Figure 2 reports the results obtained from the HMMC catalyst. Panels 2a–f display the results obtained in MCO2 mode, with the furnace temperature varying in the range 523–773 K. Panel 2f (red line) displays the maximum temperature in the catalytic section (PBR) of the reactor, evaluated through the simulation model. Indeed, in the catalytic section of the reactor (PBR), the exothermal revSMR reaction causes an increase of reactor temperature above that of the furnace, resulting in a mild maximum in the temperature profile, which is noticeable for a furnace temperature above 610 K. This difference between the reacting gas temperature and the furnace temperature does not exceed 40 K for any of the operating conditions considered here, and, in all cases, the simulated reactor temperature is equal to the furnace temperature at the exit of the PBR and in the subsequent P-R1, while a rapid quench down to ambient temperature occurs in P-R2, as discussed in Reference [23].
Corresponding to panel 2f, panels 2d and 2e report the thermodynamic equilibrium constant Kp calculated at the furnace temperature, together with the i p i ν i calculated on the basis of the model results at the sampling point, respectively for the revWGS and revSMR reactions. The cited panels give a clear idea of where thermodynamic and kinetic regime are more prominent in all the experiments reported. This is an important aspect, since it has been demonstrated that the interplay between kinetics and thermodynamics has an important role in the interpretation of SMR and MCO2 experimental results [36,37].
According to the model, in MCO2 mode, gas compositions do not change in P-R1 and P-R2, as discussed in Reference [23]. Thus, in Figure 2, panels 2d and 2e demonstrate that both the revWGS and revSMR reactions are at thermodynamic equilibrium at the exit of PBR for furnace temperatures equal to or larger than T = 673 K. Conversely, the kinetic regime holds for T < 673 K. The corresponding gas compositions, measured and simulated at the sampling point (exit of P-R2), are reported in panels 2a–c. In particular, panels 2a and 2b show that, by increasing temperature, reactant (CO2, H2) consumption and product (CH4, H2O) generation increase as long as the temperature remains in the kinetic regime window. The maximum CH4 and H2O mol fractions (5.9% and 11.8%, respectively), and the corresponding minimum of CO2 and H2 (0.85% and 9.8%) are obtained around 673 K. Increasing the temperature further, the thermodynamic regime holds. Here, by increasing the temperature, the main effect is the marked decrease of the Kp of the exothermal revSMR reaction, as shown by Figure 2e). The simultaneous increase of the mildly endothermal revWGS (Figure 2d) is less marked. Considering the overall revGRR reaction, its Kp decreases strongly by increasing the temperature. Thus, by increasing the temperature, the revGRR is shifted more and more towards the reactants, and this explains the observed reduction of CH4 and H2O molar fractions and the associated increase of CO2 and H2 molar fractions displayed in panels 2a and 2b. In addition, panel 2c reports the behavior of CO, which, being produced by the revWGS and consumed by the revSMR, displays a trade-off behavior with a maximum at about 608 K, demonstrating that revWGS and revSMR kinetics prevail below and above 608 K, respectively. Above 673 K, the already discussed dominating decrease of Kp,revSMR by increasing temperature results in a continuous increase of CO.
In Figure 2, panels 2g–r report the results obtained in SMR mode, with two different GHSVs (1.4 × 10⁴ h−1 and 2.1 × 10⁴ h−1), with furnace temperatures varying in the range 773–1173 K. The analysis is started again with a discussion of temperature results in the reactor. A temperature drop occurs close to the entrance of the packed bed (PBR), due to the endothermal SMR reaction. After the temperature drop, the temperature quickly rises and reaches the furnace temperature well before the exit of the PBR, as discussed in Reference [23]. Here, minimum temperatures are reported in panels 2l and 2r in Figure 2. With the HMMC catalyst, due to the high catalyst activity and the consequently fast reaction kinetics, the temperature drops are marked. Since axial heat conduction within the PBR is not considered in the model, this temperature drop may be somehow overestimated, at least for furnace temperatures above 880 K (dotted lines in panels 2l and 2r of Figure 2). The predicted temperature occurs in a confined space. For example, for a GHSVs = 2.1 × 10⁴ h−1 and for a furnace temperature of 900 K, the minimum temperature of 765 K is reached at 0.03 mm after the entrance of the PBR, which is followed by a temperature increase up to 890 K at 1.1 mm after the entrance of the PBR.
According to the model, in SMR mode, no temperature or composition changes occur in P-R1. Conversely, a temperature decrease occurs in P-R2, in a slower fashion than in MCO2 operating mode, mainly due to the higher external temperature (523 K in SMR versus 298 K in MCO2). Simultaneously, the WGS reaction occurs in a slight, yet appreciable, way [23]. This phenomenon of WGS occurring thermally, or catalyzed by the metallic piping, in the exit-line of experimental laboratory reactors, is reported in the literature [33,34,38], and is included in the model presented in this work. These considerations make it possible to explain the results in panels 2j and 2p of Figure 2, which, on the one hand, display that the Kp,WGS calculated at the furnace temperature coincides with the model calculations of ( i p i ν i   ) W G S at the exit of the catalytic section, showing that the model predicts WGS to be at thermodynamic equilibrium at the exit of the PBR. On the other hand, in the same figures, modeling and experimental results of ( i p i ν i   ) W G S   at the sampling point (exit of P-R2) are slightly higher, demonstrating a further slight advancement of the WGS reaction in P-R2.
For the SMR reaction, the experimental and simulated ( i p i ν i   ) S M R at the sampling point are reported in panels 2k and 2q in Figure 2, together with Kp,SMR calculated at the furnace temperature. The three reported quantities coincide, demonstrating that the SMR reaction is at thermodynamic equilibrium at the exit of the reactor for all the operating conditions investigated. In particular, since no SMR reaction occurs in PR-1 or in PR-2, Figure 2k,q demonstrate that SMR is at thermodynamic equilibrium at the exit of the packed bed (PBR), and also provide confirmation that the experimental temperature at the outlet of PBR is equal to the furnace temperature. In Figure 2k,q, no experimental values of ( i p i ν i   ) S M R are reported for temperatures above 933 K and 1013 K respectively, because the amount of methane in the sampled gaseous mixture is below the resolution of the experimental measurement system (100 ppm). Therefore, the experimental ( i p i ν i   ) S M R diverges to infinity in these conditions.
The corresponding compositions measured and simulated at the sampling point, are reported in panels 2g–i of Figure 2 for GHSV = 1.4 × 10⁴ h−1, and in panels 2m–o for GHSV = 2.1 × 10⁴ h−1. Due to SMR being endothermal, it is thermodynamically favored by increasing temperature, with a progressive increase in reactant (CH4, H2O) consumption and product (CO2, H2) generation. For furnace temperatures above 890 K, the SMR reaction is complete, with CH4 being completely consumed inside the PBR zone of the SMR reactor. Hence, the compositions obtained by further increasing the furnace temperature are dictated by WGS. Due to WGS being mildly exothermal, it gradually shifts towards the reactants by increasing temperature, and this explains the slight decrease of CO2 and H2 and the associated slight increase of CO and H2O. The maximum hydrogen molar fraction obtained experimentally is 16.7% (at a furnace temperature of 893 K for GHSV = 1.4 × 10⁴ h−1, and at a furnace temperature of 933 K for GHSV = 2.1 × 10⁴ h−1).
In SMR conditions, differences between reactor behavior at GHSV = 1.4 × 10⁴ h−1 and at GHSV = 2.1 × 10⁴ h−1 are of minor entity, and in both cases, the SMR reaction reaches thermodynamic equilibrium before the exit of the PBR, for all the operating conditions investigated. The discrepancy between experimental and simulated results reported in Figure 2j,p, is related to the difficulty in simulating in a more accurate manner the advancement of the WGS in the exit line of the reactor.
Overall, the results offer further confirmation for the validity of the kinetic model set up by Xu and Froment [24]. This kinetic model is typically applied to the simulation of SMR reactors [39,40,41,42]; however, since it is based on reversible reaction kinetics, it is also expected to apply to MCO2 reactors, and the results reported in panels 2a–e of Figure 2 provide confirmation. It is interesting to notice that 773 K is the highest temperature experimented in MCO2 mode as well as the lowest temperature experimented in SMR mode. At this temperature, with the HMMC catalyst, the SMR reaction is at thermodynamic equilibrium at the exit of the PBR section of the experimental reactor, under both MCO2 and SMR operating conditions.

4.3. 57-4Q Catalyst

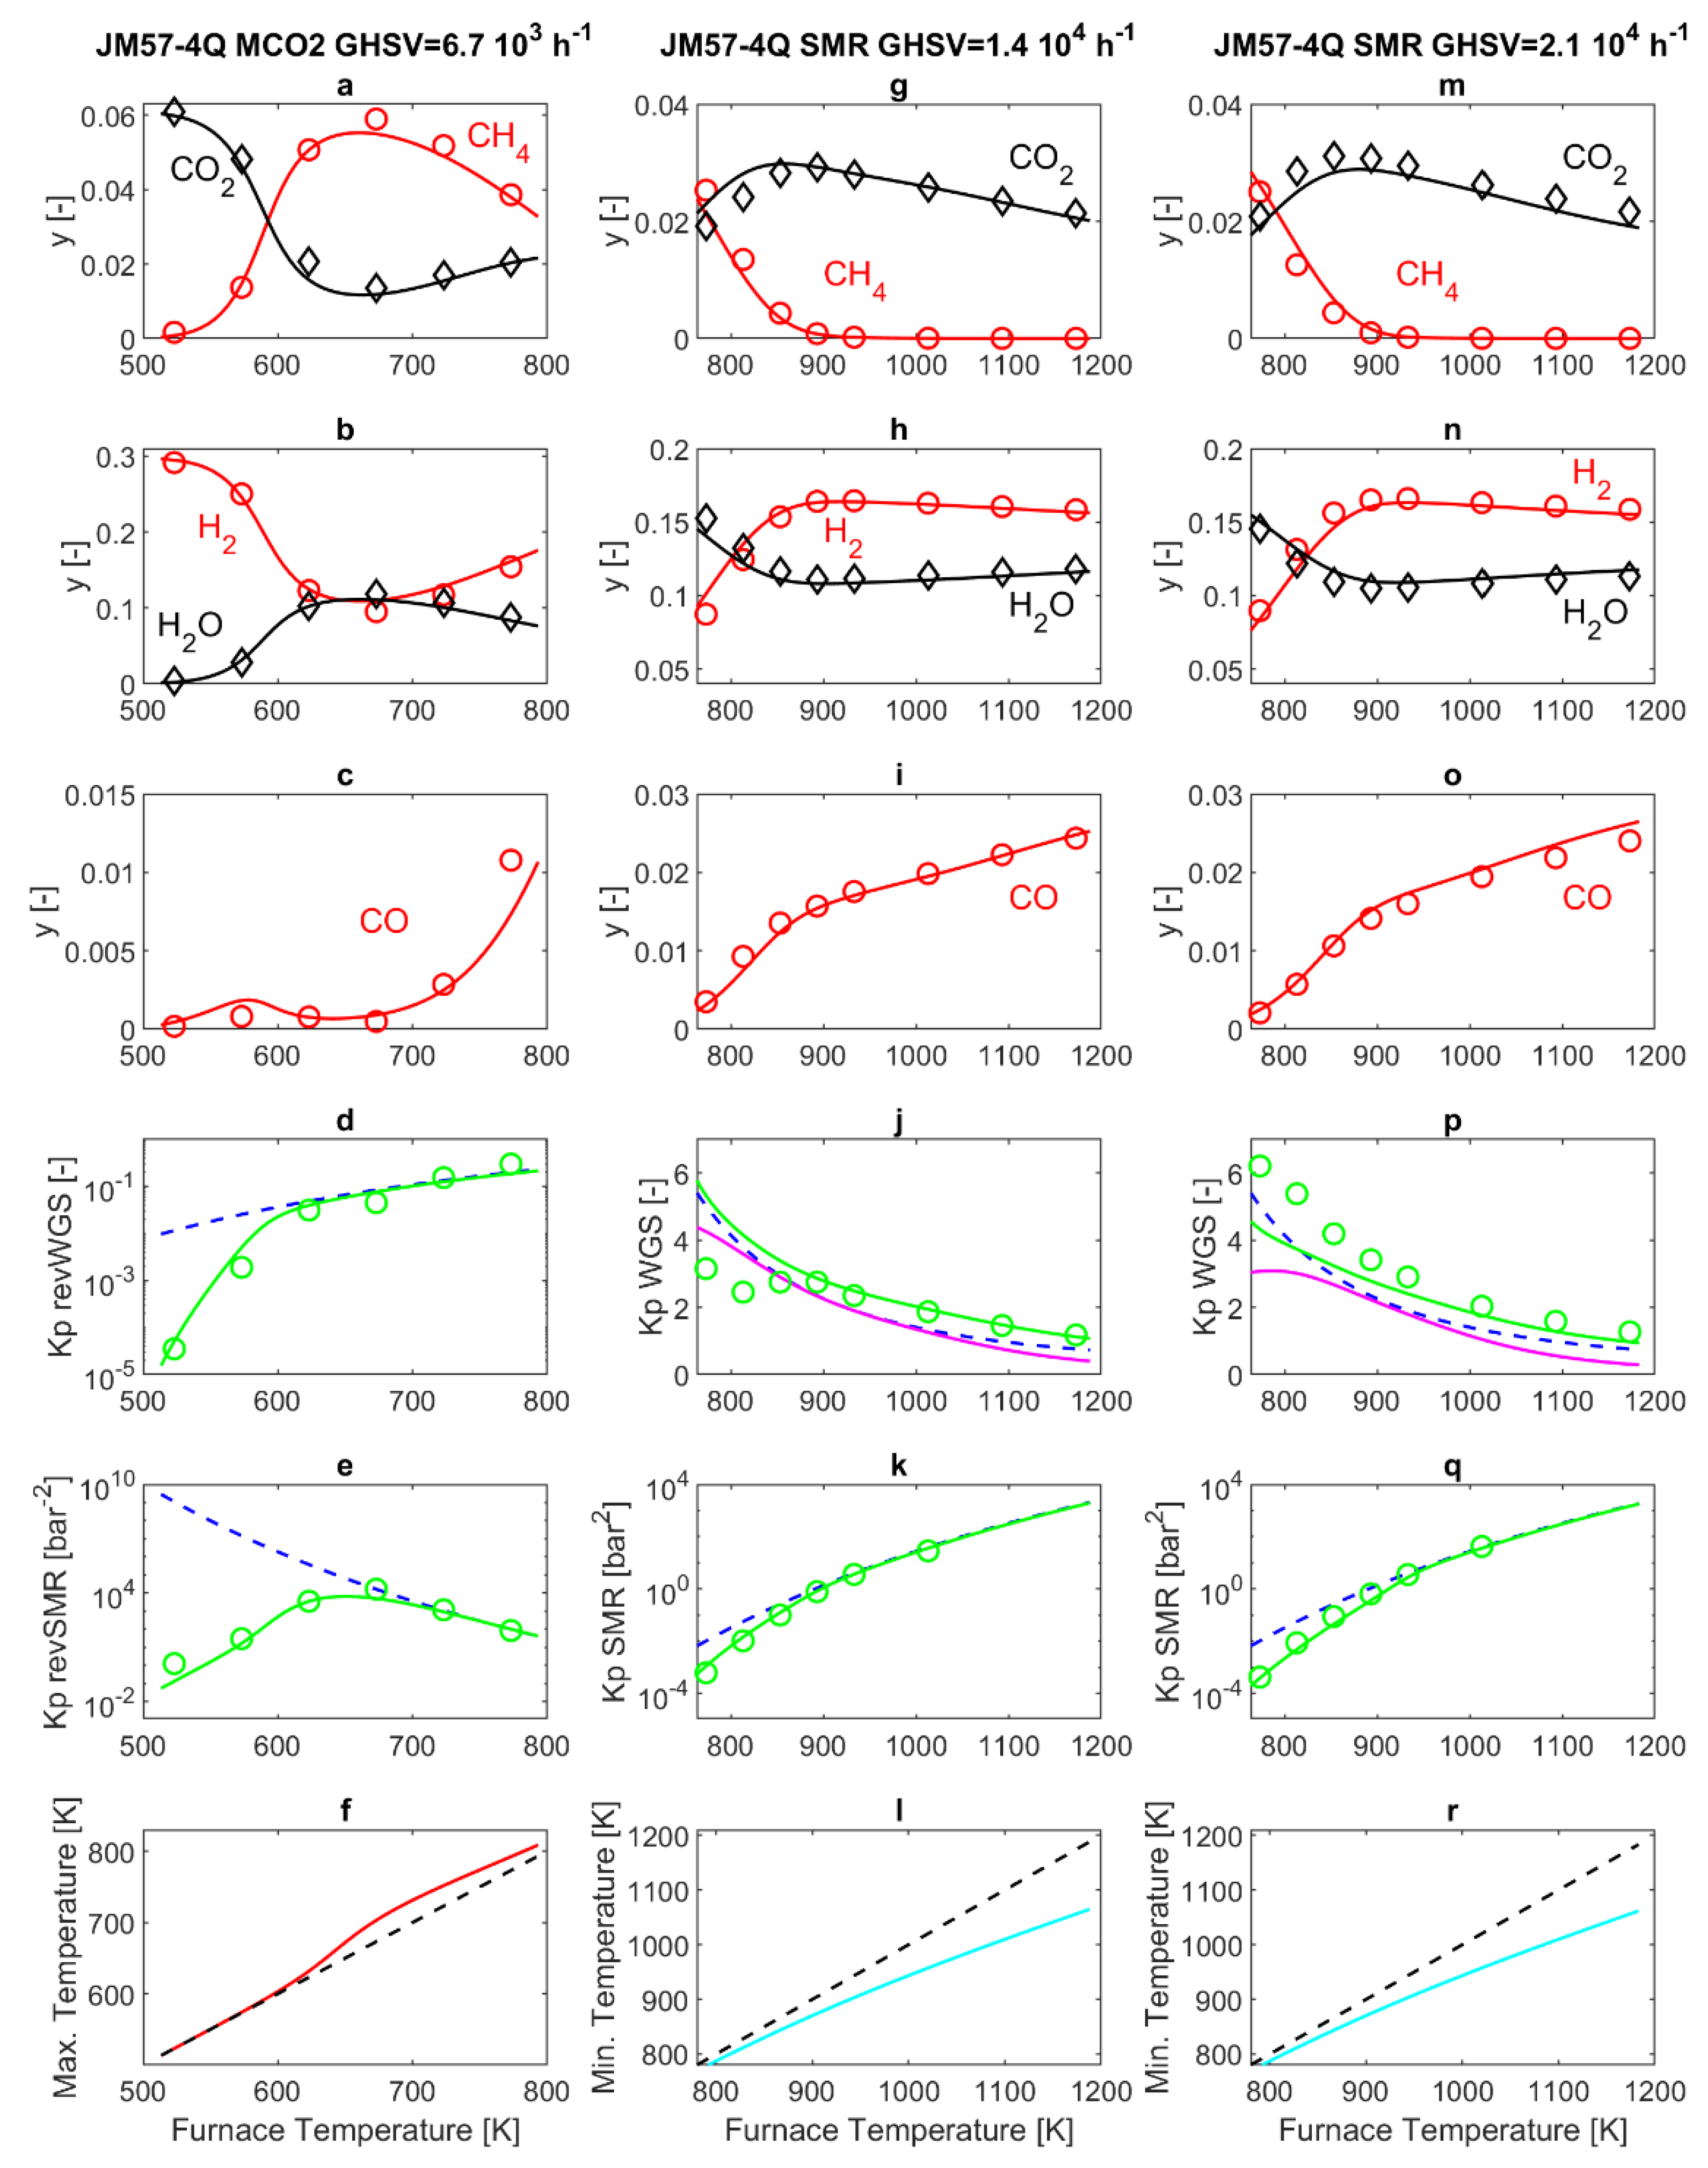
Figure 3 reports both modeling and experimental results obtained from the commercial 57-4Q catalyst. The first remark, when comparing the experimental results obtained in SMR and MCO2 operating modes, is that at the same temperature of 773 K, an interesting difference appears. Indeed, in MCO2 mode, the SMR reaction is at thermodynamic equilibrium at the exit of the PBR (Panel 3e), while this is clearly no longer true in SMR operating mode (Panels 3k and 3q). The possibility that this is related to thermal effects, i.e., the internal temperature of the PBR being higher than the furnace temperature in MCO2 operating mode, and lower than the furnace temperature in SMR operating mode, is considered in this work by performing a simulation of the reactor temperature profile. However, the simulated PBR temperature shows a peak/drop close to the PBR entrance, followed by an almost flat profile, very close to the furnace temperature [23]. The entity of the peak can change from one experiment to another, but ultimately it has a rather small influence on the overall reaction rate and thus on the gas composition at the PBR exit. A more convincing explanation can be formulated considering that the literature reports that H2O concentration strongly influences SMR kinetics [43], and that the composition of the 57-4Q and 25-4Q catalysts improves water adsorption properties [6]. As reported in Table 1, both commercial catalysts are based on a calcium aluminate support, where the addition of the calcium species can result in the increase of water adsorption through neutralization of the acidic sites of alumina. Bearing in mind that the HMMC catalyst employs a calcium-free support, the different support composition may explain different water adsorption capabilities and ultimately, the strikingly different behavior observed at 773 K. This is duly reflected by the model, thanks to the water adsorption coefficient KH2O, which, for the 57-4Q catalyst, is 90 times that of the HMMC catalyst. This makes the SMR reaction kinetics slow at high humidity levels.
The simulation results reported in Figure 3 show satisfactory agreement with the experimental data. The highest relative error is for the calculation of the CO molar fraction at the exit of the laboratory MCO2 reactor, since the experimentally measured molar fraction is very low (Figure 3c). In addition, the difficulty in capturing the advancement of the WGS in the exit line of the reactor in an accurate manner (Figure 3j,p) also impacts on the accuracy of the simulation results.
In MCO2 operating mode, slight differences are found in the molar fractions at the outlet of the reactor, compared to the results obtained with the previous HMMC catalyst. This is evidenced by panels 3a–c of Figure 3, that display a slightly reduced H2 and CO2 consumption, associated with a slightly reduced CH4 and H2O production, compared to panels 2a–c of Figure 2. In SMR mode, the slowdown of the SMR reaction rate is visible especially in panels 3g and 3m of Figure 3, reporting the CH4 molar fraction at the reactor outlet. Here, CH4 is completely converted at a furnace temperature of about 930 K, and below that temperature, the CH4 molar fraction at the reactor outlet is visibly higher than that displayed in Figure 2g,m, for the HMMC catalyst. Analogous considerations also apply to H2O (panels 3h and 3n) while, for furnace temperatures below 930 K, H2 (panels 3h and 3n) and CO2 (panels 3g and 3m) are higher than in the in the corresponding panels in Figure 2. For a furnace temperature higher than about 930 K, SMR thermodynamic equilibrium is established at the PBR outlet, and thus at higher temperatures, the compositions follow practically the same trend already discussed for Figure 2.
Concerning the WGS reaction, in the Xu and Froment kinetics equations scheme [24], the WGS kinetics is also slowed down for high KH2O values. This slowdown of the WGS reaction results in WGS thermodynamic equilibrium not being fully established at the exit of the PBR. This is displayed by the model results reported in panels 3j and 3p of Figure 3, in particular by the pink line not collapsing with the blue dotted line. As already discussed before, the model calculates a further advancement of the WGS reaction in the P-R2 post-reactor (green line), that is partially confirmed by the experimental data (green circles).
Concerning the simulated maximum and minimum temperatures inside the PBR, the qualitative behavior is similar to that previously discussed for the HMMC case. In more detail, in the MCO2 mode, no significant differences are observed in panel f of Figure 2 or Figure 3. In SMR mode, instead, differences are noticeable, since the slow SMR reaction occurring on the 57-4Q catalyst is accompanied by a small temperature drop at the entrance of the PBR, as displayed by panels 3l and r of Figure 3. For example, for a GHSVs = 2.1 × 10⁴ h−1 and for a furnace temperature of 900 K, the reactor temperature reaches the minimum value of 870 K at 0.012 mm after the entrance of the PBR (which, according to further simulations, is followed by a temperature increase up to 890 K at 2.7 mm after the entrance of the PBR).
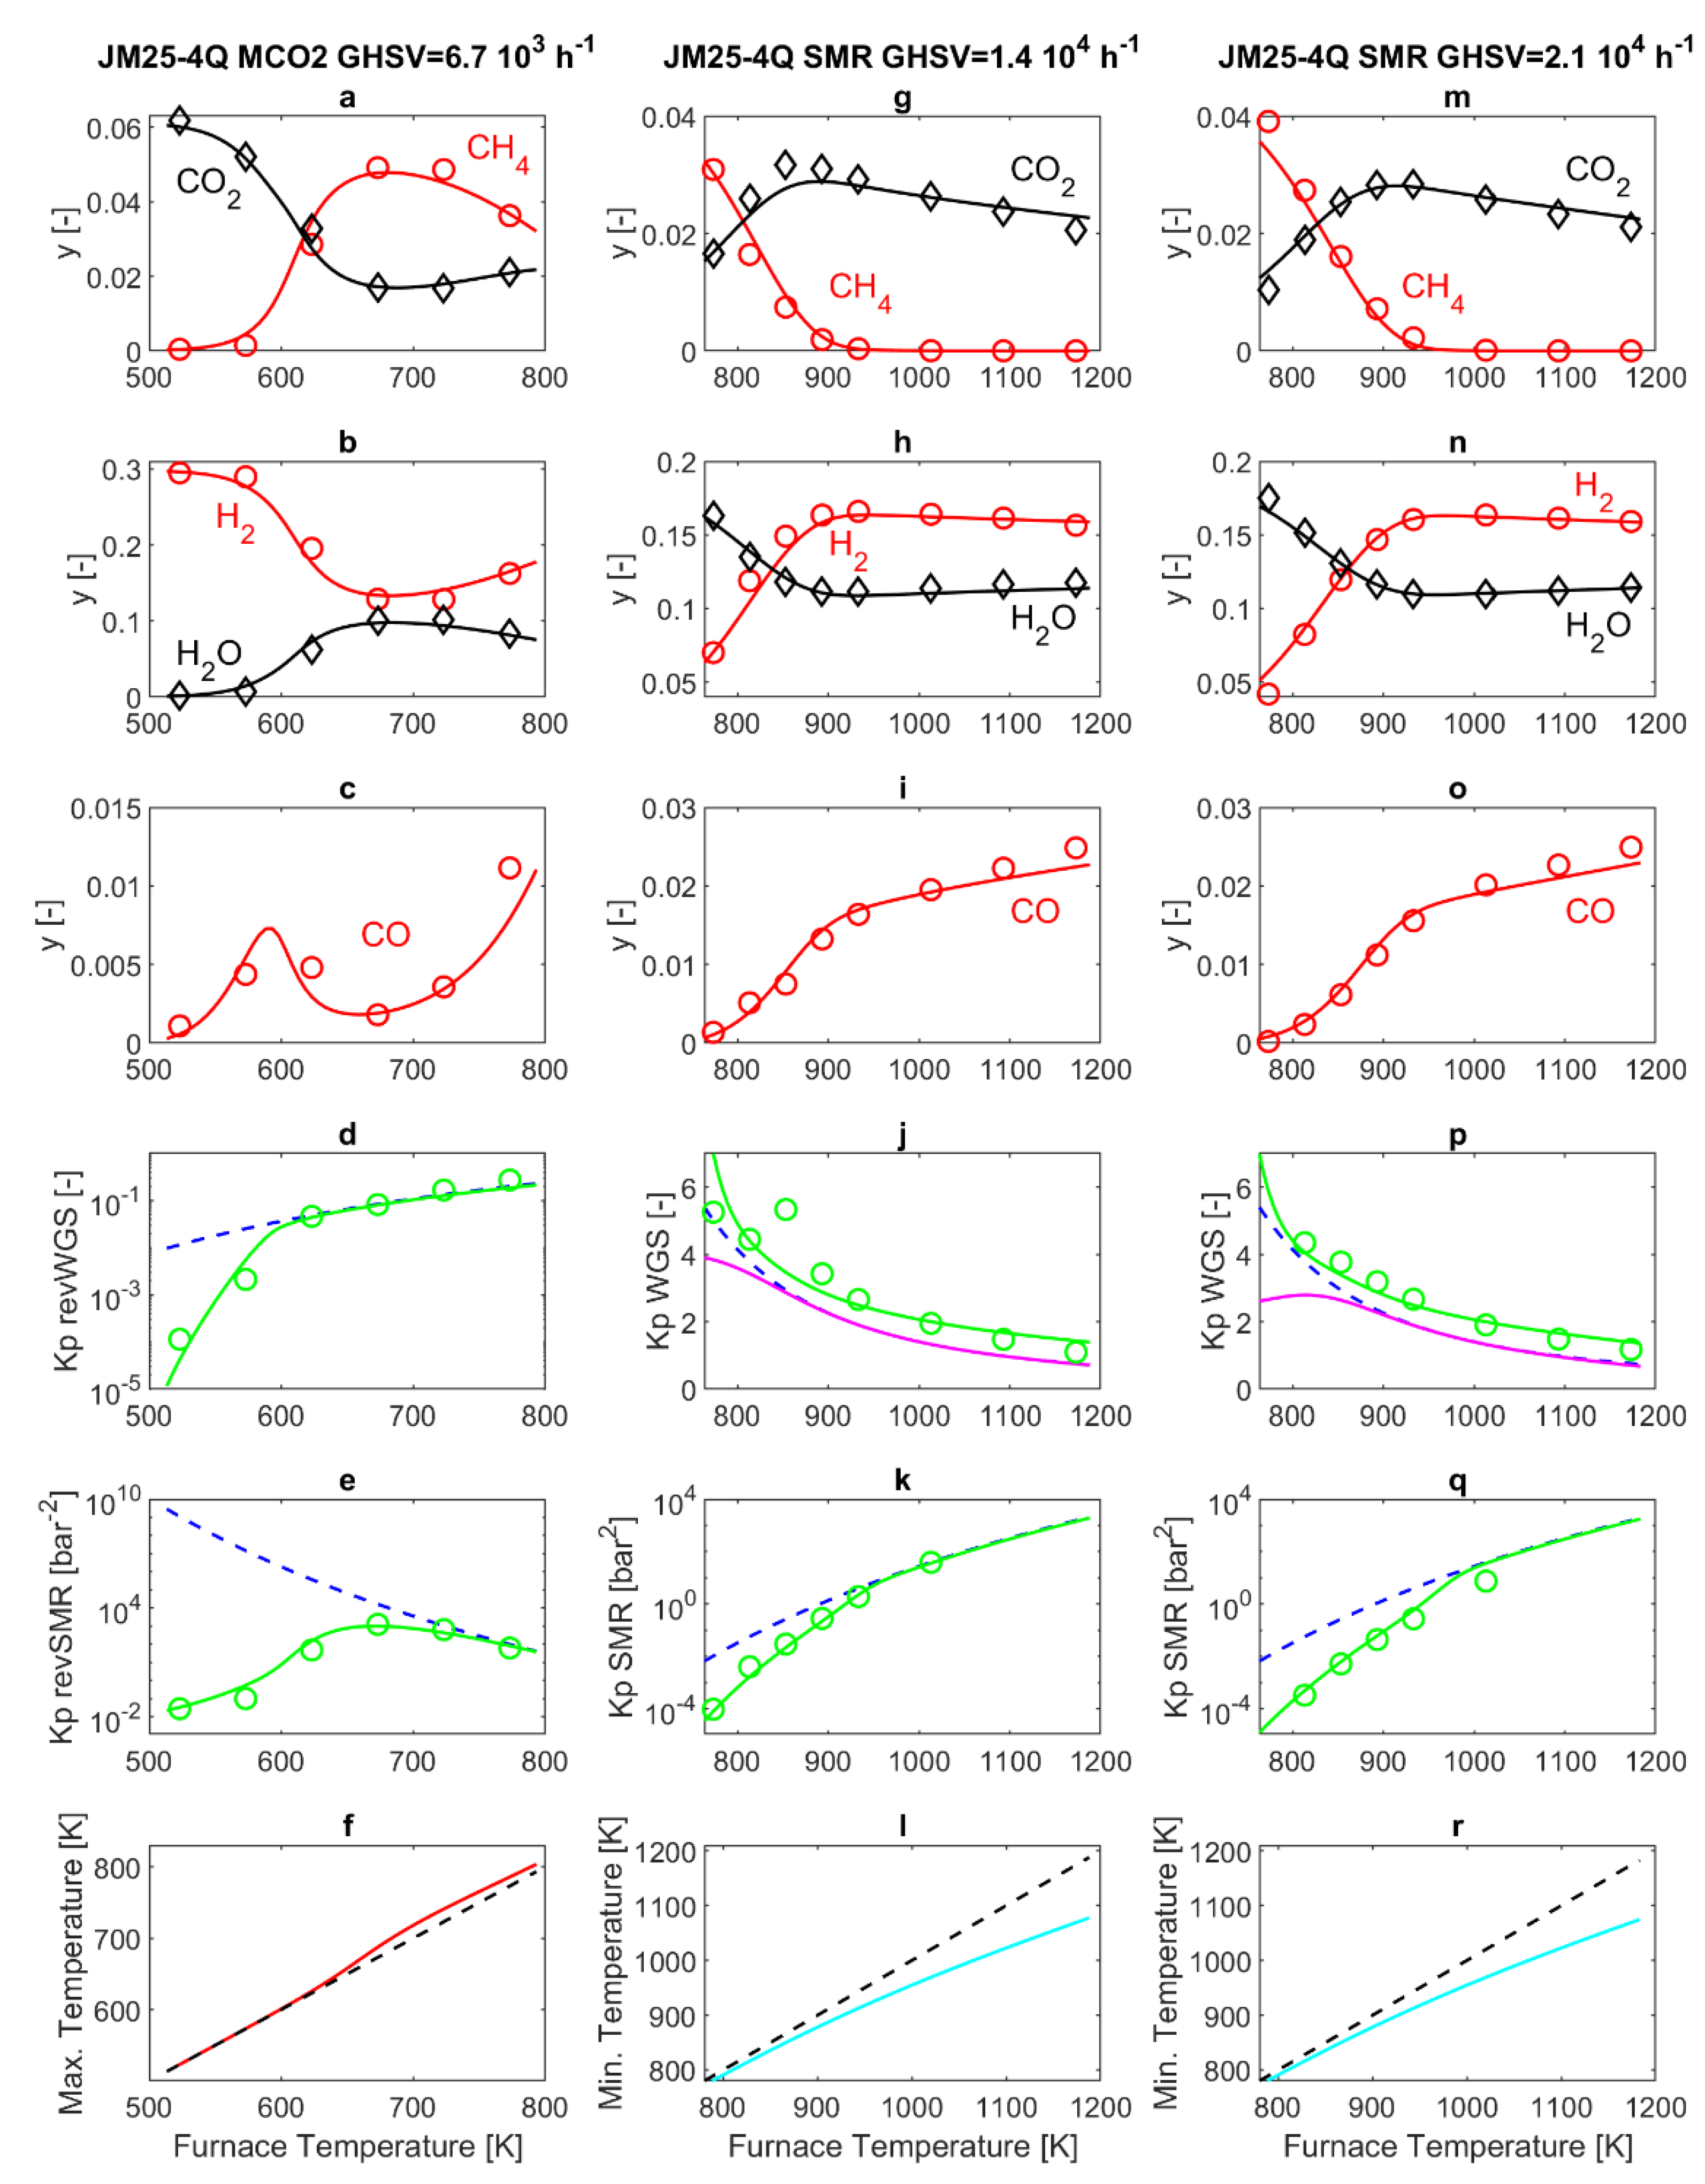
4.4. 25-4Q Catalyst

Figure 4 reports the results obtained from the commercial 25-4Q catalyst, which employs not only a calcium aluminate support, but also a 1.8 wt% K2O addition, whose role is to further increase the surface basicity and avoid coke deposition [6]. Indeed, it has been reported that, in SMR operating mode, since water adsorbs dissociatively on the catalyst surface, the increased number of sites for water adsorption increases the oxygen available on the surface, leading to an increase of the rate of carbon gasification and of the carbon monoxide production rate [6]. Thus, in modeling the performance of the 25-4Q catalyst, the water adsorption parameter KH2O is further increased, and is now 95 times that of the HMMC catalyst. With the 25-4Q catalyst, the increased water adsorption further slows the SMR and revSMR reaction rate, compared to the 57-4Q catalyst. This is visible by comparing panels e, k and q in Figure 3 and Figure 4. Figure 4, panel 4e, shows that, in MCO2 operating mode, thermodynamic equilibrium is now reached at the PBR outlet for a furnace temperature of 773 K. Correspondingly, the maximum of CH4 molar fraction displayed in panel 4a is now about 5%, visibly reduced compared to that reported in Figure 3, panel 3a. Analogously, panels 4k and 4q of Figure 4 show that, in SMR operating mode, thermodynamic equilibrium is reached for a furnace temperature of 1013 K, visibly increased compared to that displayed in Figure 3, panels 3k and 3q. Conversely, the features of the WGS and revWGS reaction reported in Figure 4, panels 4d, 4j and 4p, do not show appreciable variations compared to those reported in Figure 3 panels 3d, 3j and 3p, for the 57-4Q catalyst.

5. Discussion

The experimental data show that the catalysts investigated are all active in both SMR and MCO2 reactions. The data show that the HMMC catalyst is more active than both K-free and K-doped industrial SMR catalysts in both reactions. The better activity of the HMMC catalyst is likely associated, for both reactions, to the definitely higher nickel loading, as well as, perhaps, to the different support. It is evident that the composition of the industrial SMR catalysts are determined by the need for a very prolonged stability, both in terms of reduced sintering of nickel active phase and the support, and on a limited formation of carbon residues. Calcium aluminates are stable and refractory materials, allowing to stabilize nickel particles in the SR reaction conditions, even if they can in some way slightly reduce the activity of nickel with respect to alumina. In any case, we remark that, taking into consideration the experimental results, the HMMC catalyst does not show any apparent deactivation in a one-day-long experiment in SMR in our conditions. In any case, over both HMMC and 57-4Q catalysts, hydrogen yields above 90% are obtained at ca. 900 K.
Our data confirm, also in our conditions, the slightly lower activity of the K-doped commercial SMR catalyst with respect to the K-free catalyst [6] in the SMR reaction. As said previously, K-doping is useful to reduce carbon residue formation, in particular when treated natural gas contains significant amounts of higher hydrocarbons, propane and butane. The formation of carbon is in fact much more pronounced when higher hydrocarbons are treated. For this reason, in industrial plants, a pre-reforming reactor is frequently used [27], working at lower temperature (~773 K), to steam reform higher hydrocarbons before the tubular reactor. As remarked above, our HMMC catalyst has a composition which is comparable with that of pre-reforming catalysts. It seems interesting to remark that this catalyst, richer in nickel, is more active with respect to SMR, even at 773 K, thus at a temperature where pre-reforming is usually conducted. Indeed, at this low temperature, SR of propane and butane can already occur with high conversion and are much faster and more favored than SMR.
At low temperature, when the SMR reaction is under kinetic control, CO2 is selectively produced over the K-doped catalyst, while over the other catalysts; CO is already detected among products. This either indicates that K-containing catalysts are more active in WGS reaction (supposing CO is the primary product of the steam reforming process) or, in contrast, K-doping also poisons revWGS reaction (supposing CO2 is the primary product of the reaction, and CO is the final product). This point will be discussed later.
The trend of catalytic activity in MCO2 is the same as for SMR, i.e., HMMC > 57-4Q > 25-4Q, as might be expected from the “micro-reversibility principle” [14]. In the cases of K-free catalysts, MCO2 reaction is highly selective to methane (approaching 100%) until 673 K, when the maximum conversion is reached, allowing a methane yield near 85%. In these conditions, the reaction is still under kinetic control in our experiments, with CO2 conversion still being lower than that allowed by thermodynamics. At higher temperatures, however, when the reaction is over these catalysts, already under thermodynamic control, CO is produced in significant amounts, as indeed expected by thermodynamics. A different situation is found over the K-doped catalyst, where conversion of CO2 is significantly lowered with respect to undoped catalyst, and 10% CO yield is achieved upon CO2 methanation even at a low temperature (i.e., when thermodynamics allows complete CO hydrogenation). This behavior shows that the rate of the “methanation” steps (MCO2 and MCO) are both lowered by K-doping. However, the reduced CO2 conversion implies that either the rate of the revWGS activity is also reduced by potassium doping (supposing MCO2 as the sequence revWGS + MCO) or MCO2 is mainly parallel to revWGS. These data can be taken into consideration in parallel with the effect of K-doping on the selectivity to CO2 in SMR. These data support the idea that a direct reversible way from CO2 to CH4, without the intermediacy of gaseous phase CO, indeed exists and is predominant in both senses. Thus, MCO2 and GRR reaction are real inverse reactions, whose rates are both slowed down by K-doping. The increased production of CO by the hydrogenation side and to CO2 from the steam reforming side by K-doping is a secondary effect: this indicates that revWGS reaction is both parallel to CO2 methanation and consecutive to CH4 steam reforming and is hindered at least at a high temperature by K-doping.
On the other hand, it is interesting to remark that we have performed experiments in very similar conditions at 773 K, both feeding methane + water and feeding CO2 + hydrogen. At this temperature, the reaction is under (or near) equilibrium conditions from both sides only on the HMMC catalyst. With the two industrial catalysts, at 773 K, the reaction is, in our experiments, near equilibrium from the hydrogenation side, while it is far from equilibrium from the steam reforming side. This is likely associated to the water excess in our SMR experiments, while in the conditions of MCO2 experiments, water is a stoichiometric product, and to the need for large nickel particles to activate water for SMR at low temperature.

6. Conclusions

Regarding MCO2 and SMR catalysis on three different commercial and laboratory catalysts, it can be concluded that:
  • K-doped industrial SMR catalysts are less active than K-free samples also in our laboratory reactor conditions in SMR. However, they produce higher CO2 and hydrogen selectivity at low temperature where the reaction is under kinetic control, with respect to K-free catalyst.
  • Industrial SMR catalysts are also active in CO2 methanation, where K-doping also causes some deactivation and lowers CH4 selectivity at low temperature where the reaction is under kinetic control.
  • The HMMC catalyst, richer in Nickel, is more active than industrial catalysts in both SMR (95% hydrogen yield at 900 K) and CO2 hydrogenation (86% methane yield with 100% selectivity at 623 K). Although this catalyst is stable for one-day laboratory experiments, it is clear that composition and properties of industrial catalysts are mostly related to stability issues, for very prolonged use in SMR.
  • The experimental results suggest that the reverse water gas shift reaction is mainly parallel with respect to CO2 methanation and mainly successive to “global reforming reaction” that directly produces CO2 from methane and water.
  • The experimental and modeling results demonstrate that, in the feed and pressure conditions considered in this work, the optimal operating temperature for the MCO2 process is in the range 650–680 K, with all three catalysts under analysis. At this temperature, the yield in methane is maximum, as a result of a trade-off between kinetics and thermodynamics.
  • It has been pointed out by several authors [43] that a change of catalyst composition or operating conditions (temperature and S/C ratio) may alter not only the values of the parameters in the kinetic model, but also the structure of the model itself. Nevertheless, this work demonstrates the validity of the Xu and Froment [24] kinetic scheme, after adapting the model parameters to the different catalysts, and keeping them unchanged for all the operating conditions investigated.
  • Three sets of values for the kinetic parameters are proposed, adapted to the three catalysts under consideration. The H2O adsorption coefficient adopted for the commercial catalysts is 90–95 times higher than for the laboratory made catalyst, and this is in line with the expectations, considering that the commercial catalysts have Ca and K added in order to promote H2O adsorption.

Author Contributions

Conceptualization, G.G., G.B. and P.C.; Formal analysis, P.C.; Investigation, G.G. and T.C.; Methodology, F.P. and P.C.; Supervision, G.B.; Writing—original draft, G.B. and P.C.; Writing—review and editing, G.G. and F.P. All authors have read and agreed to the published version of the manuscript.

Funding

This research received no external funding.

Acknowledgments

The authors acknowledge Agnese Buscaldi and Beatrice Antonucci for the experimental tests made during their Master’s and Bachelor’s theses, respectively.

Conflicts of Interest

The authors declare no conflict of interest.

Abbreviations

CCUCO2 Capture and Utilization Technologies
EDXSEnergy-Dispersive X-Ray Spectroscopy
FE-SEMField Emission Scanning Electron Microscope
FIDFlame Ionization Detector
FT-IRFourier Transform Infrared Spectroscopy
GC/MSGas Chromatography/Mass Spectrometry
GHSVGas Hourly Space Velocity
GRRGlobal Reforming Reaction
HMMCHome-Made Methanation Catalyst
JMJohnson Matthey
MCOMethanation of CO
MCO2Methanation of CO2
PBRPacked Bed Reactor
P-RPost Reactor
PtXPower to X
revGRRreverse of Global Reforming Reaction
revSMRreverse of Steam Methane Reforming
revWGSreverse of Water Gas Shift
RTPReference temperature and pressure (273.15 K and 101.325 kPa)
S/CSteam-to-Carbon ratio
SMRSteam Methane Reforming
SNGSubstitute/Synthetic Natural Gas
SRSteam Reforming
TCDThermal Conductivity Detector
WGSWater Gas Shift
XRDX-Ray Diffraction
Symbols used
aSurface-to-volume ratio(m−1)
Bparameter for the evaluation of the radial thermal conductivity(-)
Cimolar concentration of the i-th component(mol m−3)
cpispecific heat for the i-th component(kJ mol−1 K−1)
Dmass diffusivity(m2 s−1)
dtube diameter(m)
dPparticle diameter(m)
E, E’, E″activation energies(kJ mol−1)
Errerror(-)
Fii-th component molar flowrate(mol s−1)
hconvective heat exchange coefficient(W m−2 K−1)
ΔH°298Kstandard reaction enthalpy(kJ mol−1)
ΔHiadsorption enthalpy of component i in SMR, WGS and GRR kinetics(kJ mol−1)
KCH4, KCO, KH2adsorption constants in SMR, WGS and GRR kinetics(bar−1)
KH2Oadsorption constant for H2O in SMR, WGS and GRR kinetics(-)
Kp,GRR, Kp,SMRequilibrium constants of GRR and SMR(Pa2)
Kp,WGSequilibrium constant of WGS(-)
kGRR, kSMRkinetic rates of GRR and SMR(kmol bar0.5 kgcat−1 h−1)
kWGSkinetic rate of WGS(kmol bar−1 kgcat−1 h−1)
k’WGSkinetic rate of WGS in gas-phase(m1.5 mol−0.5 s−1)
k″WGSkinetic rate of metal-catalyzed WGS(m2 s−1)
kthermal conductivity(W m−1 K−1)
Lcharacteristic dimension(m)
llength(m)
NuNusselt number(-)
pipartial pressure of the i-th component(bar)
Pemmass transfer Péclet number(-)
Peththermal Péclet number(-)
PrPrandtl number(-)
rjreaction rate of the j-th reaction(mol m−3 s−1)
Rideal gas constant(J mol−1 K−1)
ReReynolds number(-)
stube wall thickness(m)
Siselectivity to product i(-)
Ttemperature(K)
Uoverall heat transfer coefficient(W m−2 K−1)
ussuperficial velocity(m s−1)
Vvolume(m3)
XCH4, XCO2methane and carbon dioxide conversion(-)
ymolar fraction(-)
Yiyield in product i(-)
Greek Letters
εcatalyst bed void fraction(-)
κratio between solid and gas thermal conductivities(-)
ρdensity(kg m−3)
νijstoichiometric coefficient of the i-th component in the j-th reaction(-)
Subscripts
axaxial
avgaverage
expexperimental
ffluid
icomponent index
ininlet
jreaction index
modmodeling
outoutlet
rradial
ssolid
wwall

References

  1. Farrauto, R.J.; Armor, J.N. Moving from discovery to real applications for your catalyst. Appl. Catal. A Gen. 2016, 527, 182–189. [Google Scholar] [CrossRef]
  2. Murkin, C.; Brightling, J. Eighty years of steam reforming. Johns. Matthey Technol. Rev. 2016, 60, 263–269. [Google Scholar] [CrossRef]
  3. Rostrup-Nielsen, J.R.; Sehested, J.; Nørskov, J.K. Hydrogen and Synthesis Gas by Steam and CO2 Reforming. Adv. Catal. 2002, 47, 65–139. [Google Scholar] [CrossRef]
  4. Aasberg-Petersen, K.; Dybkjær, I.; Ovesen, C.V.; Schjødt, N.C.; Sehested, J.; Thomsen, S.G. Natural gas to synthesis gas—Catalysts and catalytic processes. J. Nat. Gas Sci. Eng. 2011, 3, 423–459. [Google Scholar] [CrossRef]
  5. Bartholomew, C.H.; Farrauto, R.J. Fundamentals of Industrial Catalytic Process, 2nd ed.; Wiley Interscience: Hoboken, NJ, USA, 2005. [Google Scholar]
  6. Carlsson, M. Carbon Formation in Steam Reforming and Effect of Potassium Promotion. Johns. Matthey Technol. Rev. 2015, 59, 313–318. [Google Scholar] [CrossRef]
  7. Perry, R.H.; Green, D.W. Perry’s Chemical Engineers’ Handbook, 8th ed.; McGraw-Hill: New York, NY, USA, 2008. [Google Scholar]
  8. Nielsen, S.E. Ammonia—Methanation. Available online: https://www.topsoe.com/processes/ammonia/methanation (accessed on 8 May 2019).
  9. Kopyscinski, J.; Schildhauer, T.J.; Biollaz, S.M.A. Production of synthetic natural gas (SNG) from coal and dry biomass—A technology review from 1950 to 2009. Fuel 2010, 89, 1763–1783. [Google Scholar] [CrossRef]
  10. Gao, J.; Liu, Q.; Gu, F.; Liu, B.; Zhong, Z.; Su, F. Recent advances in methanation catalysts for the production of synthetic natural gas. RSC Adv. 2015, 5, 22759–22776. [Google Scholar] [CrossRef]
  11. Wender, I. Reactions of synthesis gas. Fuel Process. Technol. 1996, 48, 189–297. [Google Scholar] [CrossRef]
  12. Pearce, B.B.; Twigg, M.V.; Woodward, C. Methanation. In Catalyst Handbook; Twigg, M.V., Ed.; Wolfe Publishing Ltd.: Frome, UK, 1989. [Google Scholar]
  13. Zhang, Z.; Wei, T.; Chen, G.; Li, C.; Dong, D.; Wu, W.; Liu, Q.; Hu, X. Understanding correlation of the interaction between nickel and alumina with the catalytic behaviors in steam reforming and methanation. Fuel 2019, 250, 176–193. [Google Scholar] [CrossRef]
  14. Mauri, R. Non-Equilibrium Thermodynamics in Multiphase Flows; Springer: Berlin/Heidelberg, Germany, 2013. [Google Scholar]
  15. Wang, W.; Gong, J. Methanation of carbon dioxide: An overview. Front. Chem. Eng. China 2011, 5, 2–10. [Google Scholar]
  16. Gómez-Camacho, C.E.; Ruggeri, B. Energy Sustainability Analysis (ESA) of energy-producing processes: A case study on distributed H2 production. Sustainability 2019, 11, 4911. [Google Scholar] [CrossRef] [Green Version]
  17. Rosen, M.A. Thermodynamic comparison of hydrogen production processes. Int. J. Hydrog. Energy 1996, 21, 349–365. [Google Scholar] [CrossRef]
  18. Bui, M.; Adjiman, C.S.; Bardow, A.; Anthony, E.J.; Boston, A.; Brown, S.; Fennell, P.S.; Fuss, S.; Galindo, A.; Hackett, L.A.; et al. Carbon capture and storage (CCS): The way forward. Energy Environ. Sci. 2018, 11, 1062–1176. [Google Scholar] [CrossRef] [Green Version]
  19. Garbarino, G.; Riani, P.; Magistri, L.; Busca, G. A study of the methanation of carbon dioxide on Ni/Al2O3 catalysts at atmospheric pressure. Int. J. Hydrog. Energy 2014, 39, 11557–11565. [Google Scholar] [CrossRef]
  20. Garbarino, G.; Bellotti, D.; Riani, P.; Magistri, L.; Busca, G. Methanation of carbon dioxide on Ru/Al2O3 and Ni/Al2O3 catalysts at atmospheric pressure: Catalysts activation, behaviour and stability. Int. J. Hydrog. Energy 2015, 40, 9171–9182. [Google Scholar] [CrossRef]
  21. Garbarino, G.; Wang, C.; Cavattoni, T.; Finocchio, E.; Riani, P.; Flytzani-Stephanopoulos, M.; Busca, G. A study of Ni/La-Al2O3 catalysts: A competitive system for CO2 methanation. Appl. Catal. B Environ. 2019, 248, 286–297. [Google Scholar] [CrossRef]
  22. Pugliese, F.; Trucco, A.; Moser, G.; Costamagna, P. Diagnostics and Prognostics-Oriented Modeling of an NGSR Fuel Processor for Application in SOFC Systems. Fuel Cells 2017, 17, 517–534. [Google Scholar] [CrossRef] [Green Version]
  23. Costamagna, P.; Pugliese, F.; Cavattoni, T.; Riani, P.; Busca, G.; Garbarino, G. Modeling of laboratory steam methane reforming and CO2 methanation reactors. Energies 2020, 13, 2624. [Google Scholar] [CrossRef]
  24. Xu, J.; Froment, G.F. Methane Steam Reforming, Methanation and Water-Gas Shift: I. Intrinsic Kinetics. AIChE J. 1989, 35, 88–96. [Google Scholar] [CrossRef]
  25. Adrados, A.; Lopez-Urionabarrenechea, A.; Acha, E.; Solar, J.; Caballero, B.M.; de Marco, I. Hydrogen rich reducing gases generation in the production of charcoal from woody biomass carbonization. Energy Convers. Manag. 2017, 148, 352–359. [Google Scholar] [CrossRef]
  26. Forrest, S.J.K.; Oliver, J.G.; French, S.A.; Carlsson, M.P.U. Catalyst Preparation Method. U.S. Patent 9,463,441, 11 October 2016. [Google Scholar]
  27. Garbarino, G.; Chitsazan, S.; Phung, T.K.; Riani, P.; Busca, G. Preparation of supported catalysts: A study of the effect of small amounts of silica on Ni/Al2O3 catalysts. Appl. Catal. A Gen. 2015, 505, 86–97. [Google Scholar] [CrossRef]
  28. Fogler, H.S. Elements of Chemical Reaction Engineering, 4th ed.; Prentice Hall: Upper Saddle River, NJ, USA, 2005. [Google Scholar]
  29. Levenspiel, O. Chemical Reaction Engineering, 3rd ed.; John Wiley & Sons: New York, NY, USA, 1999. [Google Scholar]
  30. Van Antwerpen, W.; Du Toit, C.G.; Rousseau, P.G. A review of correlations to model the packing structure and effective thermal conductivity in packed beds of mono-sized spherical particles. Nucl. Eng. Des. 2010, 240, 1803–1818. [Google Scholar] [CrossRef]
  31. Zehner, P.; Schlünder, E.U. Warmeleitfahigkeit von Schuttungen bei mässigen Temperaturen. Chem. Ing. Tech. 1970, 42, 933–941. [Google Scholar] [CrossRef]
  32. Singhal, A.; Cloete, S.; Radl, S.; Quinta-Ferreira, R.; Amini, S. Heat transfer to a gas from densely packed beds of cylindrical particles. Chem. Eng. Sci. 2017, 172, 1–12. [Google Scholar] [CrossRef]
  33. Bustamante, F.; Enick, R.M.; Killmeyer, R.P.; Howard, B.H.; Rothenberger, K.S.; Cugini, A.V.; Morreale, B.D.; Ciocco, M.V. Uncatalyzed and wall-catalyzed forward water-gas shift reaction kinetics. AIChE J. 2005, 51, 1440–1454. [Google Scholar] [CrossRef]
  34. Keiski, R.L.; Desponds, O.; Chang, Y.F.; Somorjai, G.A. Kinetics of the water-gas shift reaction over several alkane activation and water-gas shift catalysts. Appl. Catal. A Gen. 1993, 101, 317–338. [Google Scholar] [CrossRef]
  35. Abbas, S.Z.; Dupont, V.; Mahmud, T. Kinetics study and modelling of steam methane reforming process over a NiO/Al2O3 catalyst in an adiabatic packed bed reactor. Int. J. Hydrog. Energy 2017, 42, 2889–2903. [Google Scholar] [CrossRef]
  36. Kageyama, N.; Devocht, B.R.; Takagaki, A.; Toch, K.; Thybaut, J.W.; Marin, G.B.; Oyama, S.T. Interplay of Kinetics and Thermodynamics in Catalytic Steam Methane Reforming over Ni/MgO-SiO2. Ind. Eng. Chem. Res. 2017, 56, 1148–1158. [Google Scholar] [CrossRef]
  37. Challiwala, M.S.; Ghouri, M.M.; Linke, P.; El-Halwagi, M.M.; Elbashir, N.O. A combined thermo-kinetic analysis of various methane reforming technologies: Comparison with dry reforming. J. CO2 Util. 2017, 17, 99–111. [Google Scholar] [CrossRef]
  38. Ahmed, K.; Föger, K. Approach to equilibrium of the water-gas shift reaction on a Ni/zirconia anode under solid oxide fuel-cell conditions. J. Power Sources 2001, 103, 150–153. [Google Scholar] [CrossRef]
  39. Oliveira, E.L.G.; Grande, C.A.; Rodrigues, A.E. Methane steam reforming in large pore catalyst. Chem. Eng. Sci. 2010, 65, 1539–1550. [Google Scholar] [CrossRef]
  40. Pantoleontos, G.; Kikkinides, E.S.; Georgiadis, M.C. A heterogeneous dynamic model for the simulation and optimisation of the steam methane reforming reactor. Int. J. Hydrog. Energy 2012, 37, 16346–16358. [Google Scholar] [CrossRef]
  41. Lao, L.; Aguirre, A.; Tran, A.; Wu, Z.; Durand, H.; Christofides, P.D. CFD modeling and control of a steam methane reforming reactor. Chem. Eng. Sci. 2016, 148, 78–92. [Google Scholar] [CrossRef] [Green Version]
  42. Tran, A.; Aguirre, A.; Durand, H.; Crose, M.; Christofides, P.D. CFD modeling of a industrial-scale steam methane reforming furnace. Chem. Eng. Sci. 2017, 171, 576–598. [Google Scholar] [CrossRef]
  43. Angeli, S.D.; Monteleone, G.; Giaconia, A.; Lemonidou, A.A. State-of-the-art catalysts for CH4 steam reforming at low temperature. Int. J. Hydrog. Energy 2014, 39, 1979–1997. [Google Scholar] [CrossRef]
Figure 1. Schematic representation of the tubular laboratory reactor. PBR stands for packed bed reactor, P-R1 and P-R2 indicate the post reactor sections, H are the holders of the catalytic section, and d is the tube diameter. The same reactor geometry is employed for the MCO2 and SMR experiments.
Energies 13 02792 g001
Figure 2. Results for the HMMC catalyst. (Panels af): MCO2 operating mode (GHSV = 6.7 × 10³ h−1). (Panels gl): SMR operating mode (GHSV = 1.4 × 10⁴ h−1). (Panels mr): SMR operating mode (GHSV = 2.1 × 10⁴ h−1). Symbols: experimental data. Lines: simulations. (Panels ac, gi, mo): compositions at the sampling point (exit of P-R2). (Panels d,j,p): Kp,WGS calculated at the furnace temperature; model calculation and experimental data of ( i p i ν i   ) W G S   at the sampling point (exit of P-R2). (Panels j,p): model calculation of ( i p i ν i   ) W G S at the exit of the PBR. (Panels e,k,q): Kp,SMR calculated at the furnace temperature; model calculation and experimental data of ( i p i ν i   ) S M R at the sampling point (exit of P-R2). (Panels f,l,r): ━ ━ ━ furnace temperature; model results of: maximum temperature in the PBR of the MCO2 reactor and , minimum temperature in the PBR of the SMR reactor.
Energies 13 02792 g002
Figure 3. Results for the 57-4Q commercial catalyst. (Panels af): MCO2 operating mode (GHSV = 6.7 × 10³ h−1). (Panels gl): SMR operating mode (GHSV = 1.4 × 10⁴ h−1). (Panels mr): SMR operating mode (GHSV = 2.1 × 10⁴ h−1). Symbols: experimental data. Lines: simulations. (Panels ac, gi, mo): compositions at the sampling point (exit of P-R2). (Panels d,j,p): Kp,WGS calculated at the furnace temperature; model calculation and experimental data of ( i p i ν i   ) W G S   at the sampling point (exit of P-R2). (Panels j,p): model calculation of ( i p i ν i   ) W G S at the exit of the PBR. (Panels e,k,q): Kp,SMR calculated at the furnace temperature; model calculation and experimental data of ( i p i ν i   ) S M R at the sampling point (exit of P-R2). (Panels f,l,r): ━ ━ ━ furnace temperature; model results of: maximum temperature in the PBR of the MCO2 reactor and minimum temperature in the PBR of the SMR reactor.
Energies 13 02792 g003
Figure 4. Results for the 25-4Q commercial catalyst. (Panels af): MCO2 operating mode (GHSV = 6.7 × 10³ h−1). (Panels gl): SMR operating mode (GHSV = 1.4 × 10⁴ h−1). (Panels mr): SMR operating mode (GHSV = 2.1 × 10⁴ h−1). Symbols: experimental data. Lines: simulations. (Panels ac, gi, mo): compositions at the sampling point (exit of P-R2). (Panels d,j,p): Kp,WGS calculated at the furnace temperature; model calculation and experimental data of ( i p i ν i   ) W G S   at the sampling point (exit of P-R2). (Panels j,p): model calculation of ( i p i ν i   ) W G S at the exit of the PBR. (Panels e,k,q): Kp,SMR calculated at the furnace temperature; model calculation and experimental data of ( i p i ν i   ) S M R at the sampling point (exit of P-R2). (Panels f,l,r): ━ ━ ━ furnace temperature; model results of: maximum temperature in the PBR of the MCO2 reactor and minimum temperature in the PBR of the SMR reactor.
Energies 13 02792 g004
Table 1. Summary of the reactions considered in this work, with their standard reaction enthalpies, from Reference [7].
ReactionAcronym Δ H 298 o   ( kJ   mol 1 )
CH4 + H2O ⇆ CO + 3 H2SMR206.63
CO + H2O ⇆ CO2 + H2WGS−41.16
CH4 + 2 H2O ⇆ CO2 + 4 H2GRR165.47
CO + 3 H2 ⇆ CH4 + H2OMCO or revSMR−206.63
CO2 + 4 H2 ⇆ CH4 + 2 H2OMCO2 or revGRR−165.47
CO2 + H2 ⇆ CO + H2OrevWGS41.16
Table 2. Compositions of the catalysts tested in this study.
CatalystSupportNiO wt% aK2O wt%SiO2 wt%Al2O3 wt%SBET (m2/g)
57-4Q [3]CaAl2O418---29
25-4Q [3]CaAl2O4181.8--n.a.
HMMC [27]SiO2-Al2O333.3-3.363.3138
a NiO wt% prior to reduction. n.a. not available in the literature.
Table 3. Conversion, selectivity and yield defined for MCO2 and SMR reaction schemes [29].
CO2 Methanation ModeSMR Mode
X C O 2 = F C O 2   i n F C O 2   o u t F C O 2   i n X C H 4 = F C H 4 , i n F C H 4 , o u t F C H 4 , i n
S i = F i F C O 2 , i n F C O 2 , o u t S i = F i ν i ( F C H 4 , i n F C H 4 , o u t )
Y i = F i F C O 2 , i n Y H 2 = F H 2 , o u t 4 F C H 4 , i n
Table 4. Model equations.
Mass balance d F i d V = r i = j ν i j r j
Energy balance i F i c P i d T d V = j ( Δ H j ) r j + U a ( T f u r n a c e T )
Heat transfer coefficient U = ( 1 h + s k w ) 1
Reynolds number R e = ρ f · u s · L μ f
Prandtl number P r = c P f · μ f k r
Nusselt number N u = h · L k r
Radial thermal conductivity [30,31] k r = k f · { ( 1 1 ε ) + 2 1 ε 1 B κ 1 · [ B ( 1 κ 1 ) ( 1 B κ 1 ) 2 ln ( κ B ) B 1 1 B κ 1 B 1 2 ] }
Parameter in radial thermal conductivity B = 1.25 ( 1 ε ε ) 1.11
Correlation for Nu [32] N u = 2.67 + 0.53 · R e 0.77 · P r 0.53
SMR kinetics [24] r S M R = k S M R p H 2 2.5 · ( p C H 4 · p H 2 O p H 2 3 · p C O K p , S M R ) / D E N 2
WGS kinetics [24] r W G S = k W G S p H 2 · ( p C O · p H 2 O p H 2 · p C O 2 K p , W G S ) / D E N 2
GRR kinetics [24] r G R R = k G R R p H 2 3.5 · ( p C H 4 · p H 2 O 2 p H 2 4 · p C O 2 K p , G R R ) / D E N 2
DEN in SMR, WGS and GRR kinetics D E N = 1 + K C O · p C O + K H 2 · p H 2 + K C H 4 · p C H 4 + K H 2 O · p H 2 O p H 2
Kinetic parameter kj in SMR, WGS and GRR kinetics k j = k j ,   T r · e x p [ E j R · ( 1 T 1 T r ) ] j = M S R ,   W G S ,   G R R
Adsorption parameter Kj in SMR, WGS and GRR kinetics K i = K i ,   T r · e x p [ Δ H i R · ( 1 T 1 T r ) ] i = C O , H 2 , H 2 O , C H 4
Gas-phase WGS kinetics [33] r W G S = k W G S · C C O · C H 2 O ( 1 p H 2 · p C O 2 p C O · p H 2 O · K p , W G S )
Gas-phase WGS kinetic parameter k’WGS k W G S = k W G S , 0 · e x p [ E W G S R T ]
Metal-catalyzed WGS kinetics [34] r W G S = k W G S · C C O ( 1 p H 2 · p C O 2 p C O · p H 2 O · K p , W G S )
Metal-catalyzed WGS kinetic parameter k″WGS k W G S = k W G S , 0 · e x p [ E W G S R T ]
Table 5. Values of the adjusting dimensionless coefficients ζ1 to ζ6, adopted to adapt the Xu and Froment kinetic parameters [24] to the catalysts investigated in this work.
HMMC57-4Q25-4Q
ζ1⋅kSMRζ1=15258
ζ2⋅kWGSζ2=15100130
ζ3⋅kGRRζ3=151010
ζ4⋅ESMRζ4=11.171.22
ζ5⋅EWGSζ5=11.51.7
ζ6⋅KH2Oζ6=19095
Table 6. Error of modeling results of molar fraction at the sampling point, versus experimental data. The errors are averaged over the experimental data available, for each catalyst investigated in this work.
HMMC57-4Q25-4Q
Errabs,avg1.7 × 10−32.8 × 10−32.6 × 10−3
Errrel,avg8.6%11.8%9.7%

