Article

Surrogate Models for Studying the Wettability of Nanoscale Natural Rough Surfaces Using Molecular Dynamics

by
Lingru Zheng
1,
Maja Rücker
1,
Tom Bultreys
2,3,
Apostolos Georgiadis
1,4,
Miranda M. Mooijer-van den Heuvel
4,
Fernando Bresme
5,
J. P. Martin Trusler
1 and
Erich A. Müller
1,*
1
Department of Chemical Engineering, Imperial College London, London SW7 2AZ, UK
2
ProGRess/UGCT, Department of Geology, Ghent University, 9000 Ghent, Belgium
3
Department of Earth Science and Engineering, Imperial College, London SW7 2AZ, UK
4
Shell Global Solutions International B.V., 1031 HW Amsterdam, The Netherlands
5
Department of Chemistry, Molecular Sciences Research Hub, Imperial College London, London W12 0BZ, UK
*
Author to whom correspondence should be addressed.
Energies 2020, 13(11), 2770; https://doi.org/10.3390/en13112770
Submission received: 24 April 2020 / Revised: 21 May 2020 / Accepted: 26 May 2020 / Published: 1 June 2020
(This article belongs to the Special Issue Advances in Shale Oil and Shale Gas Technologies)

Abstract

:
A molecular modeling methodology is presented to analyze the wetting behavior of natural surfaces exhibiting roughness at the nanoscale. Using atomic force microscopy, the surface topology of a Ketton carbonate is measured with a nanometer resolution, and a mapped model is constructed with the aid of coarse-grained beads. A surrogate model is presented in which surfaces are represented by two-dimensional sinusoidal functions defined by both an amplitude and a wavelength. The wetting of the reconstructed surface by a fluid, obtained through equilibrium molecular dynamics simulations, is compared to that observed by the different realizations of the surrogate model. A least-squares fitting method is implemented to identify the apparent static contact angle, and the droplet curvature, relative to the effective plane of the solid surface. The apparent contact angle and curvature of the droplet are then used as wetting metrics. The nanoscale contact angle is seen to vary significantly with the surface roughness. In the particular case studied, a variation of over 65° is observed between the contact angle on a flat surface and on a highly spiked (Cassie–Baxter) limit. This work proposes a strategy for systematically studying the influence of nanoscale topography and, eventually, chemical heterogeneity on the wettability of surfaces.

Graphical Abstract

1. Introduction

Controlling the wettability of a solid/fluid/fluid system by tuning the surface roughness is a key strategy in surface engineering [1]. Showcase applications include industrial coatings, optimizing the design of implants [2], and the development of water-repellent [3] or self-cleaning materials [4]. Similarly, in a wide range of fields, such as microbiology, nanofluidics, and others, wettability plays a crucial role in the transport and displacement behavior of fluids [5]. In the energy industry, the consequences of changes in the wettability of natural rocks have an impact on all aspects of fossil fuel production and enhanced oil recovery processes. In sub-surface fluid reservoirs, such as oil reservoirs, CO2 storage, or energy storage sites, wettability is known to control the flow efficiency and dynamics [6,7,8]. In computational models, aiming to predict this behavior, the wetting behavior is commonly reflected through contact angles [9,10]. However, conceptually, wettability is a multi-scale thermophysical property, which is the result of a fine balance between fluid–fluid and fluid–solid interactions. It is well recognized that at the level of an atomic description, the roughness of the surface plays a significant role [11,12]. How exactly the surface roughness affects the self-organization of molecules deposited on the surface and the influence that this has on the micrometer and larger scales within the rock are, however, still open questions.
Artificial roughness can be introduced via fabrication, such as surface wrinkling, electro- or chemical deposition, etching, replica molding, and lithography [13,14,15,16,17]; these practices can generate topographies with well-controlled dynamic and functional flexibility suitable for engineering applications. However, the experimental process tends to be challenging, particularly at the nanometric scale [18] and on certain materials [19], and characterization efforts are non-trivial at the nanoscale, leading to doubts and questions on the interpretation of the results.
Notwithstanding, a convenient way of measuring solid surface roughness at the nanoscale is atomic force microscopy (AFM) [20]. In contrast to traditional microscopes that focus electromagnetic radiations by lenses, atomic force microscopes produce magnified images mechanically; the tip of a very sharp needle is attached to the end of a cantilever, which is used to scan the surface under study. The tip can be moved towards or away from the surface by a piezoelectric transducer and, when in close proximity to the surface, intermolecular forces become dominant and lead to various degrees of cantilever bending, which is captured by a laser interferometer. AFM has been used in different fields for micro- to atomic-scale topographical measurements [21,22,23]. In the aforementioned wettability-controlling applications, for instance, AFM has been used to measure titanium surface samples to improve osseointegration in dental and orthopedic implants [2] and study the effect of glass roughness on bacterial attachment [4].
In the field of geo-petroleum, AFM is widely employed in micron-scale wetting studies, for example, to measure the degree of oil adhesion on organic material- [24] and ion-adsorbed quartz [25]; to investigate oil-wet surfaces of chalk at the subpore resolution [26]; to study the variation of mica and silica topology as a result of crude oil treatment [27,28]; and to investigate oil–mineral interactions [29]. Though many of these studies focused on natural surfaces, the surface structure itself was mostly not considered. One reason is that the rock sample was often crushed in order to get access to the interior and to position the sampled surface in the favorable orientation in parallel to the x-y plane of the scanning head [30]. These studies focused on flat areas within the rock as these were identified as original crystal facies unaffected by the sample preparation and because an effect of surface roughness on the investigated molecular interactions between the functionalized tip and the surface could be excluded [30]. In more recent studies, AFM was also used to assess the impact of the surface structure on the fluid configuration and molecular interactions by scanning the original internal rock surface, thus avoiding invasive sample preparations [31,32]. These studies have demonstrated the impact of surface features in the range of 100 nm–10 µm but missed the range below, which is required to link the larger-scale wetting response with the underlying molecular interactions.
In contrast with the experimental perspective, computationally structured solid models unambiguously reproduce the desired surface roughness. Simulation methods, such as molecular dynamics (MD), probe the nanometer-scale domain and deliver quantitative predictions at thermophysical conditions that may be inaccessible to experiments [33,34]. While molecular modeling allows wetting to be studied at the nanoscale, very few simulations have been conducted on surfaces with natural roughness. Instead, wetting is often assessed on model solids that are flat and homogeneous [35], pillared [36,37], sinusoidal [38], or solid with grooves [39,40] and random roughness [41] but with no direct input from experimental assessments. In addition, researchers tend to adopt a bottom-up instead of a top-down approach when constructing surfaces in MD. As a result, significant efforts have been devoted to building surfaces that reproduce the precise local chemistry; examples include silicate [35,42,43,44,45,46] and carbonate [47,48,49] minerals, whereas comparatively less effort is invested in reproducing general topological traits.
At a further level of complexity, naturally occurring nanostructures often coexist with micrometric roughness, forming the hierarchical structure that contributes to super-hydrophobicity [1,50,51]. To describe the nanoscale wetting over rough surfaces, a common metric used is the contact angle, which is the angle between the normal vector to the (fitted) drop and the surface [39,41,45,52]. However, the size of the fluid droplet compared to the amplitude of the roughness is crucially important. For small droplets, the contact line tensions of the three-phase line might play a significant role in determining the contact angle of the droplet [53,54]. Simulations aimed at determining the number of fluid molecules needed in the droplet for the contact angle to be independent of the droplet size suggest that a number of O(105) is necessary [55,56]. When the scale of the roughness is significantly smaller than the droplet size, the contact angle change due to the roughness and/or heterogeneous composition of the surface can be estimated with phenomenological models.
The Wenzel [57,58] and Cassie–Baxter [59,60] models, for instance, are expected to be accurate when the drops are much larger than the surface defects [1]. Other wettability metrics include contact line curvature, which can be linked nonlinearly to the contact angles depending on the level of heterogeneity of the surface [61]; interface sensing, which uses the local number density to define the liquid–vapor interfaces [55,62]; and adsorption energy [63]. The wettability can also be quantified thermodynamically via the Young equation or its derived forms [53,54,64,65].
An issue that is omnipresent in molecular simulation studies is the inherent limitations in terms of the size and time scales that can be accessed with currently available computing resources. Researchers have been studying the contact angles of model fluids on surfaces for over 40 years [66], with the increase in computational power allowing for ever larger and more complex systems. Notwithstanding, we are still far away from being able to consider the full thermodynamic (macroscopic) limit. If one recognizes that the wettability can be modelled by averaging out small atomistic details of the surface and the interactions, then a coarse-grained (CG) formulation is sufficient to describe quantitatively fluid and solid–fluid behavior [55,63]. The use of CG models can significantly save computational power and invites further investigations into much larger and complex systems.
In this work, we focused on examining the wetting over surfaces that appear in petroleum reservoir settings. A CG representation was used to construct a solid with the topology, which is reminiscent of a carbonate rock, as suggested by AFM. We propose a simple parametric model that allows the creation of a surrogate surface model, which can be tuned from a molecularly flat to a “spiky” surface. We further employed these model surfaces to determine, through MD, the contact angle of a droplet of fluid placed upon it. The aim of this contribution was to provide a quantitative assessment on how the fluid contact angles formed on the surrogate surfaces are correlated to the surface roughness for plausible perturbations on a nanometer scale.

2. Methodology

2.1. Ketton Sample

Ketton rock, obtained from the Ketton quarry in Rutland, England, is a middle Jurassic oolithic carbonate rock consisting of round grains (ooids and peloids) ranging from 100 µm to 1 mm in diameter [67,68]. Oolites are marine sediments, which form during evaporation of the sea. The dissolved carbonate in the seawater starts to precipitate along nuclei. Concentric growth and continued movement of the particles before deposition leads to the round shape of the grains [69]. Correspondingly, the investigated surfaces within the rock may be facets resulting from both the initial growth and mechanical or chemical modifications afterward. Due to the simple macroscopic pore structure, this rock type is often used for multiphase flow studies, such as CO2 injection or oil recovery in conjunction with micro computed tomography (µCT) imaging [8,31,70,71,72].
In addition to the macroscopic structure, Ketton ooids also exhibit microporosity (amounting to some 40% of the pore volume) within their micritic (<30 µm in crystal size) matrix. Ketton rock consists predominantly of calcite (99.1%) with minor quartz (0.9%) components [70]. Calcite (CaCO3) is trigonal (crystal system) and hexagonal scalenohedral (3 m) (crystal class) and has perfect cleavage on {1011} in three directions with an angle of 74°55′. The hardness of the mineral is 3 on the Mohs hardness scale [73].
Our Ketton samples were cut into a cylindrical sections 20 mm in height and 5 mm in diameter. The AFM scans were taken from inside a pore to capture the original surface as it appears within the ground; hence, the sample was not cleaved, and no fresh surface was exposed.

2.2. AFM Imaging

The surface topology of Ketton was measured at the nanoscale using atomic force microscopy (Nanoscope Catalyst, JPK Instruments, Berlin, Germany) in Quantitative ImagingTM (QITM-mode). The corresponding analyses were conducted via NANOSENSORS PPP-NCHAuD probes with a nominal force constant of 42 N·m−1, a nominal resonance frequency of 330 kHz, and tip height up to 15 µm and tip radius ≤10 nm. Each AFM analysis was performed over a 483 nm × 483 nm area.
The cut Ketton samples were first cleaned with isopropanol before being scanned under the ambient atmosphere. For the measurement, the tip was moved into an open pore, to capture the original structure of the internal surface, not affected by drilling. The first image was taken along a 50 µm × 50 µm area and then gradually zoomed to a 483 nm × 483 nm area focusing on spots parallel to the x-y plane of the AFM head to avoid imaging artefacts caused by the micro-scale roughness. The tip was moved along the x-axis (fast axis) and scanned line by line along the y axis (slow axis). In general, the fast axis is considered more accurate as thermal drift is more likely to affect the slow axis. We removed the tilt of the initial topography by applying a second-order numerical correction, and the final AFM image of Ketton with a resolution of 512 × 512 pixels is shown in Figure 1a. This image has a pixel size of 0.943 nm in the x-y plane, and the vertical topography in the z-axis is stored as a 512 × 512 matrix. We performed 2-D interpolation twice on these data to generate a 2048 × 2048 matrix, giving a neighbor-point-distance of 0.236 nm. The corresponding topographic map is shown in Figure 1b, where the color bar represents the elevation of the data points in the z-axis. Given that MD simulations typically only run at up to 100-nm-length scale, a small region on top of a grain was chosen for the MD modelling. The selected region covers 96 × 96 interpolated pixels, corresponding to a field of 22.7 nm × 22.7 nm, and is labeled by “A” in Figure 1b. A zoomed-in version of this region is provided in Figure 1c.
It should be noted at this point that the “true” resolution may be (significantly) lower than the grid size of the model. However, the focus of these measurements were not to obtain an atomistic resolution as such but rather to probe the extent of the surface roughness in terms of both the vertical and lateral topologies.

2.3. Surface Molecular Models

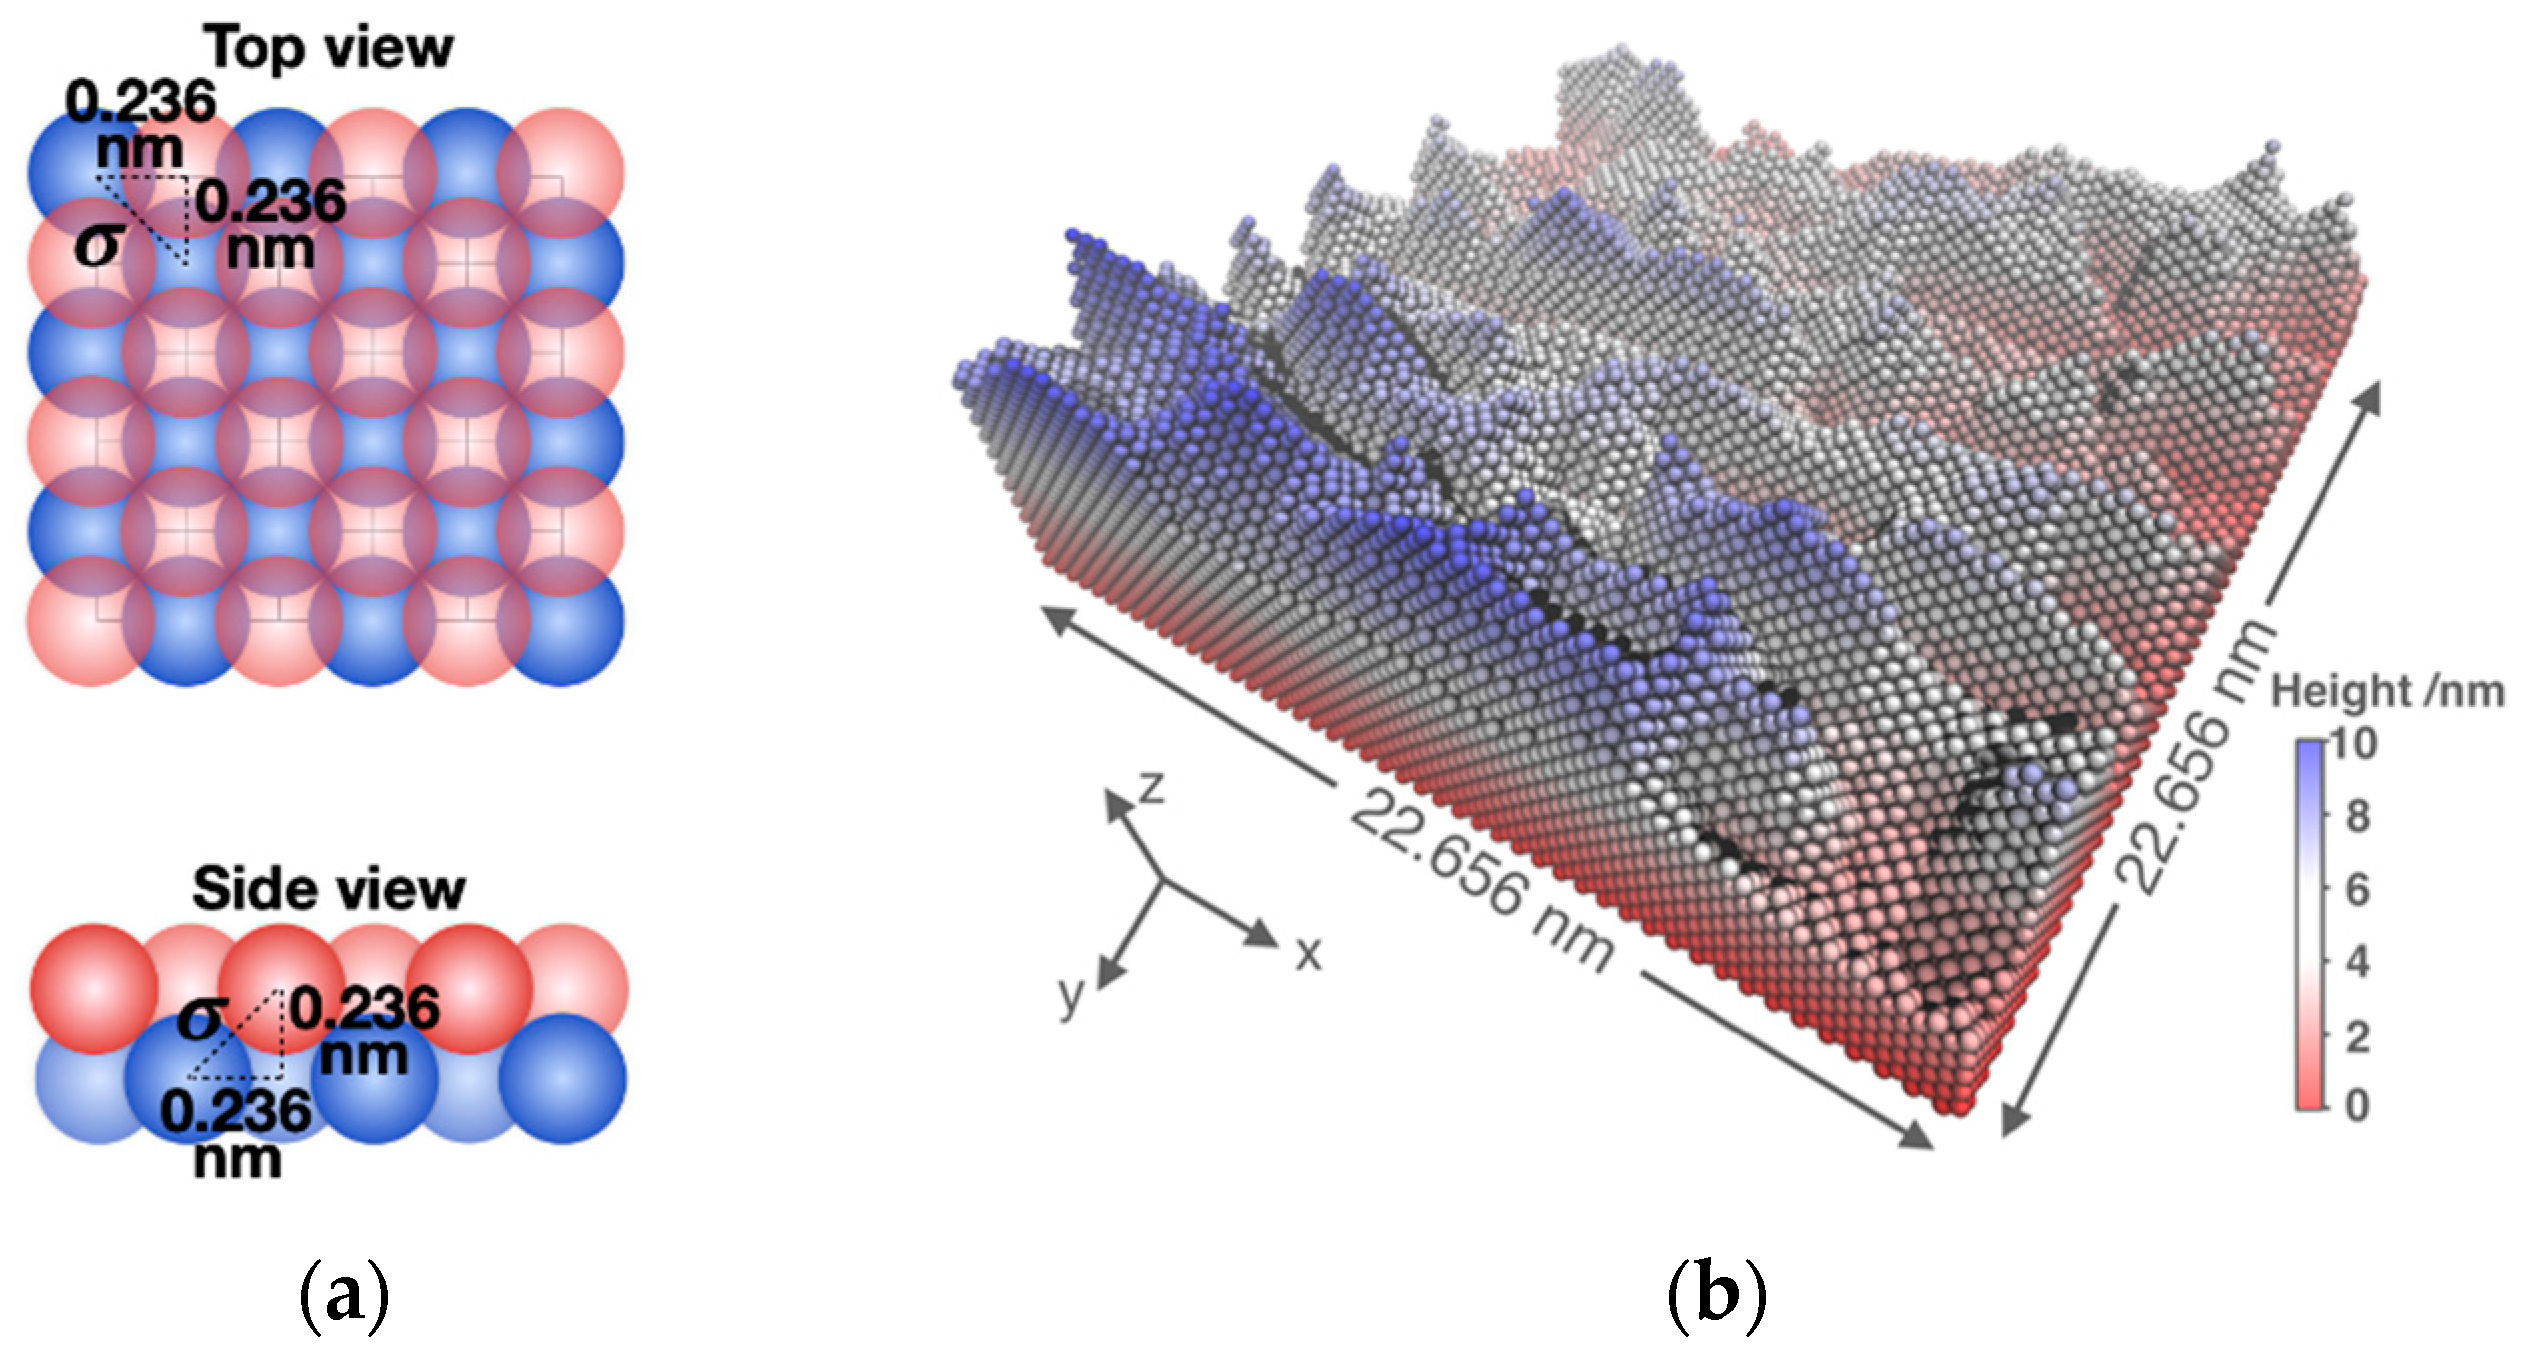
We constructed a model surface using spherical beads of diameter σ = 0.33 nm, initially arranged on an FCC lattice to create a square-based slab exposing the {001} plane, as indicated in Figure 2a. Beads were then removed from the top surface to match the topology of the selected region of the Ketton sample shown in Figure 1c. Figure 2b shows the resulting model surface; here, the color bar indicates the elevation of individual beads.
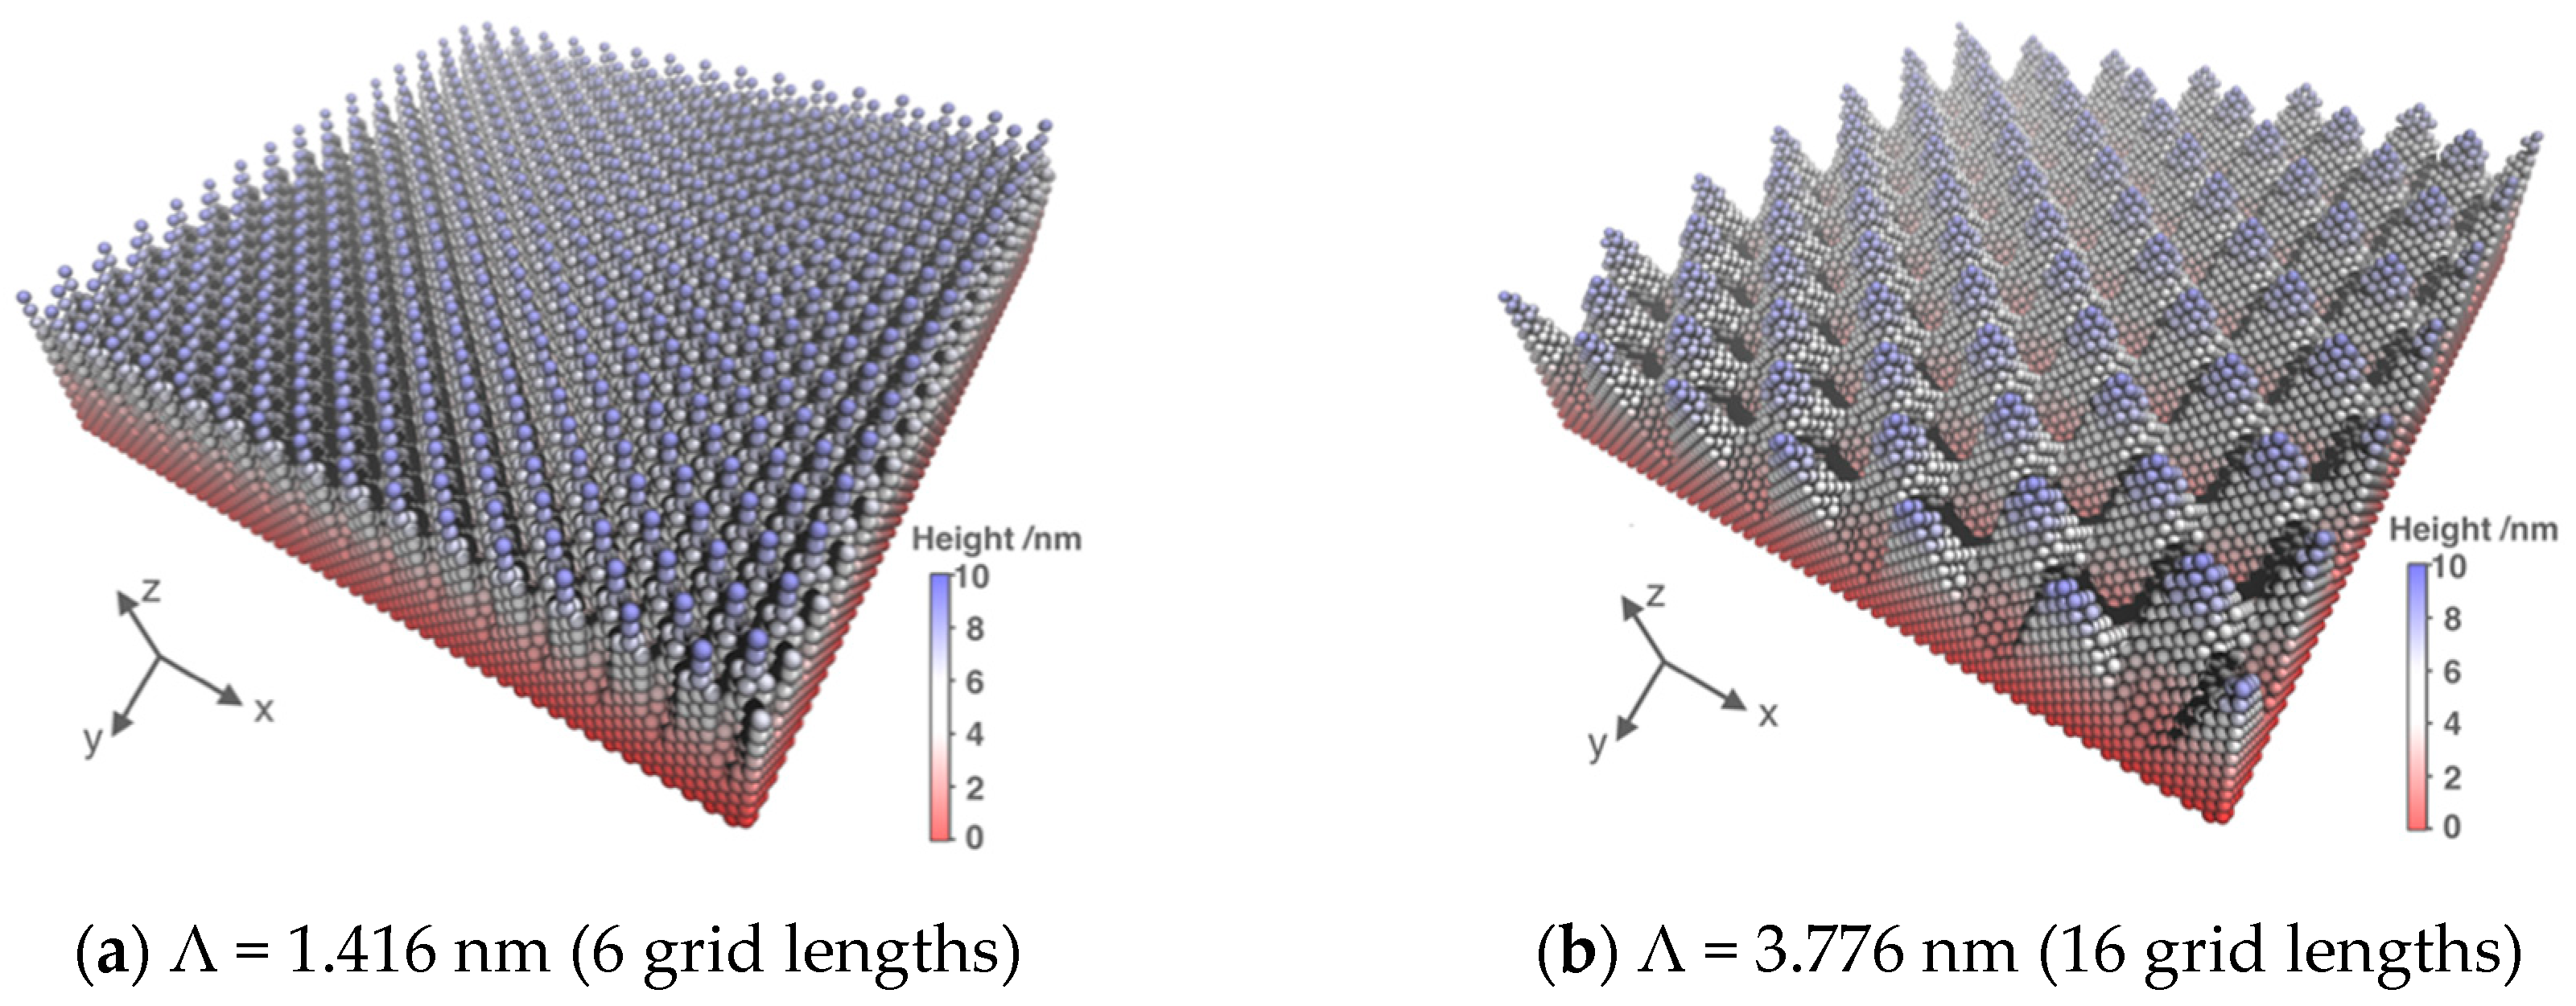
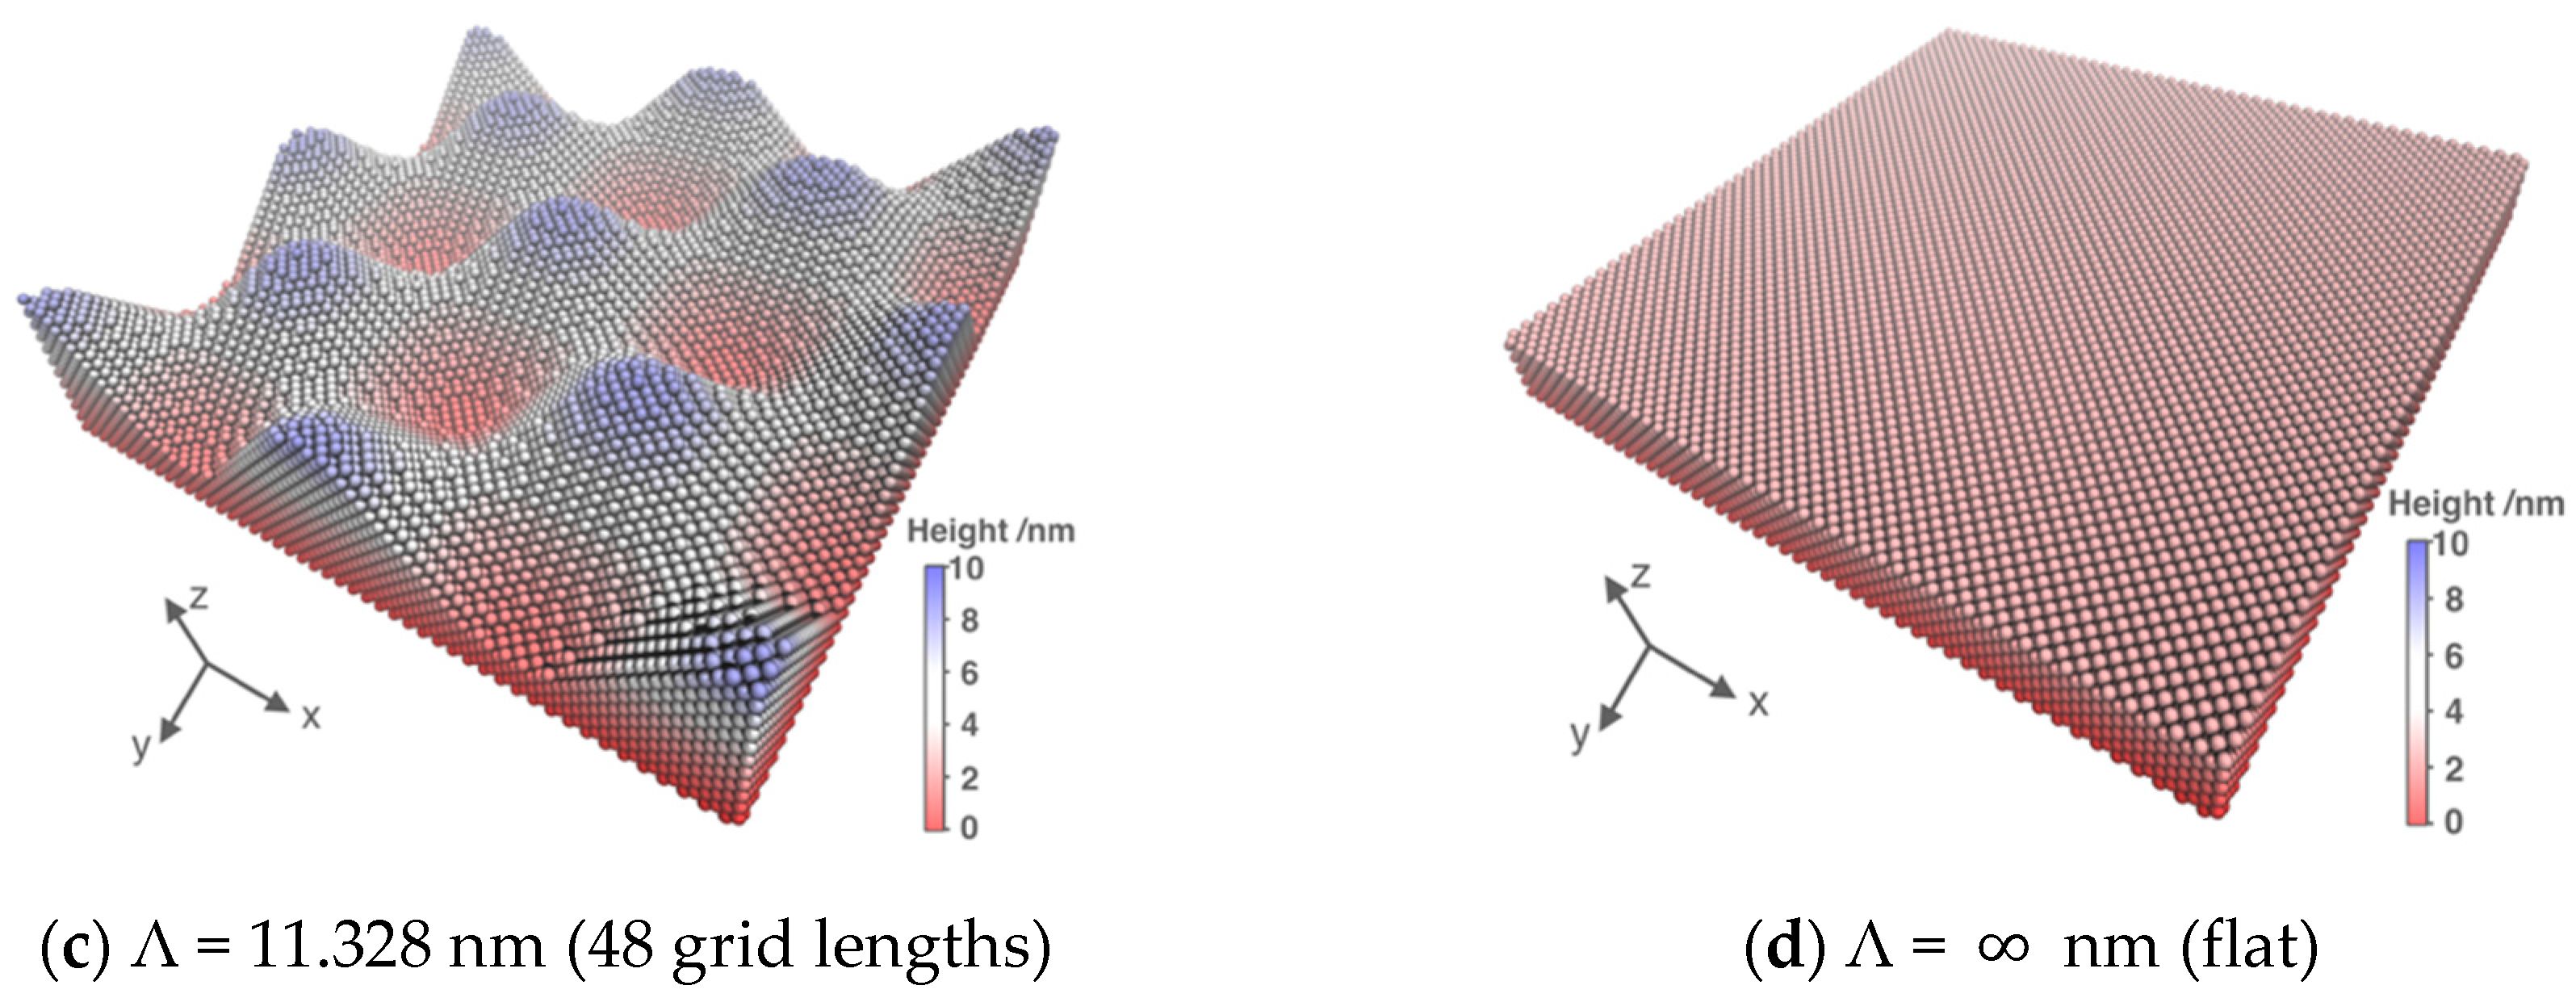
To analyze the natural roughness, we computed a Fourier transform on the horizontal (x), vertical (y), and diagonal section of the AFM data shown in Figure 1c to obtain the frequency distribution of the spatial oscillation period in each dimension and determine the corresponding most frequent oscillation period. The computation (see Supplementary Material) indicated that the main spatial oscillations of the interfaces are characterized by an amplitude of 4 nm, and a wavelength (Λ) of 7.55 nm, equivalent to 32 grid lengths or interpolated pixel lengths, in the diagonal direction and around 5.66 nm (24 grid lengths) in the x- or y-direction. We constructed a series of surrogate sinusoidal surfaces of a 4-nm amplitude with wavelengths ranging from 1.416 (6 grid lengths) to 22.656 nm (96 grid lengths). Additionally, we considered the limiting case of Λ → ∞, which corresponds to a flat surface. Examples of the sinusoidal surfaces are shown in Figure 3, with others depicted in the Supplementary Material.
We computed the roughness factor R of the model surfaces above by carrying out a multidimensional numerical integration over the area. R was defined as the area of the actual surface (Aactual) divided by the area of the flat surface, i.e., the projected area (Aflat) [57]:
R = A actual A flat   where   A actual = | r x × r y | d x   d y .
In Equation (1), the double integral is taken over the length of the vector normal to the surface in the x-y plane. The results are given in Table 1. For convenience, we denoted the different model sinusoidal surfaces as SS_X, where X = 22.656/Λ, and the model Ketton surface by SS_E. As shown in Table 1, the wavelength and roughness factor of the Ketton topography are closest to the sinusoidal surface SS_3 and SS_4.

2.4. Coarse-Grained MD Simulation

Here, we employed coarse-grained (CG) forcefields, which lump several (typically, but not necessarily, three) conjoined heavy atoms and their corresponding hydrogen atoms in a single spherical isotropic force center, or bead. The intermolecular interactions among these CG molecules are described by a Mie potential (uMie):
u Mie ( r ) = λ λ 6 ( λ 6 ) 6 / ( λ 6 ) ε [ ( σ r ) λ ( σ r ) 6 ] ,
where r is the inter-bead distance; ε is the energy scale of the potential, which coincides with the minimum potential well depth; σ is the length scale of the potential, which corresponds to the intermolecular distance where the potential is zero, a measure of the bead diameter; and λ is the repulsive exponent, which modulates the overall range of the potential. In a general Mie force field, the attractive exponent (fixed here to 6) may also be varied. However, it can be shown that there is a level of conformality in the Mie potential that makes this specification non-essential [74].
The parameterization of the potential is carried out by fitting an analytical equation of state [75], the statistical associating fluid theory (SAFT), to experimental thermophysical properties, such as the vapor pressure, surface tension, and saturated liquid density [76,77,78]. The advantage of the SAFT methodology over other plausible CG procedures is the direct correspondence between the intermolecular potential and the underlying representation of the Helmholtz free energy [79,80]. This connection facilitates the direct estimation of effective force field parameters by fitting the resulting equation of state to a wide a range of thermophysical properties without the need to perform extensive simulations. To date, the SAFT force field has been used successfully in the prediction of the behavior of crude oils in bulk [81,82] and confined reservoirs [83], high pressure oil/water interfacial tensions [84], adsorption [85], and the wetting behavior of surfactant solutions on surfaces [56,86], amongst others.
With no prejudice, we chose a parametrization that reflects the thermophysical properties of n-decane. However, the results can be trivially scaled to other fluids. The CG model of n-decane takes the form of a chain consisting of m = 3 tangentially bonded beads. Table 2 summarizes the intermolecular [82] and intramolecular (bond stretching and angle bending) parameters [87]. Additionally, also given in Table 2 are the fluid–solid cross interaction parameters, arbitrarily taken in this case to provide a contact angle of the fluid on the flat surface of around 90°, i.e., neutrally wetting conditions. In this CG model, the fluid–solid interaction parameters can be tuned to closely represent realistic molecular chemistries [88,89]. We note that whether or not our choice of fluid–solid interaction parameters resemble those between n-decane and a real mineral surface is out of the scope of this study. Among individual solid beads, there is no need to specify interactions, as all solid beads are frozen in their respective positions during simulations. Each solid surface is constructed in a way that the elevation is greater than the cut-off of the fluid–solid interaction, which was set at 2 nm. As a result, no fluid molecules interact beyond the bottom of the solid.
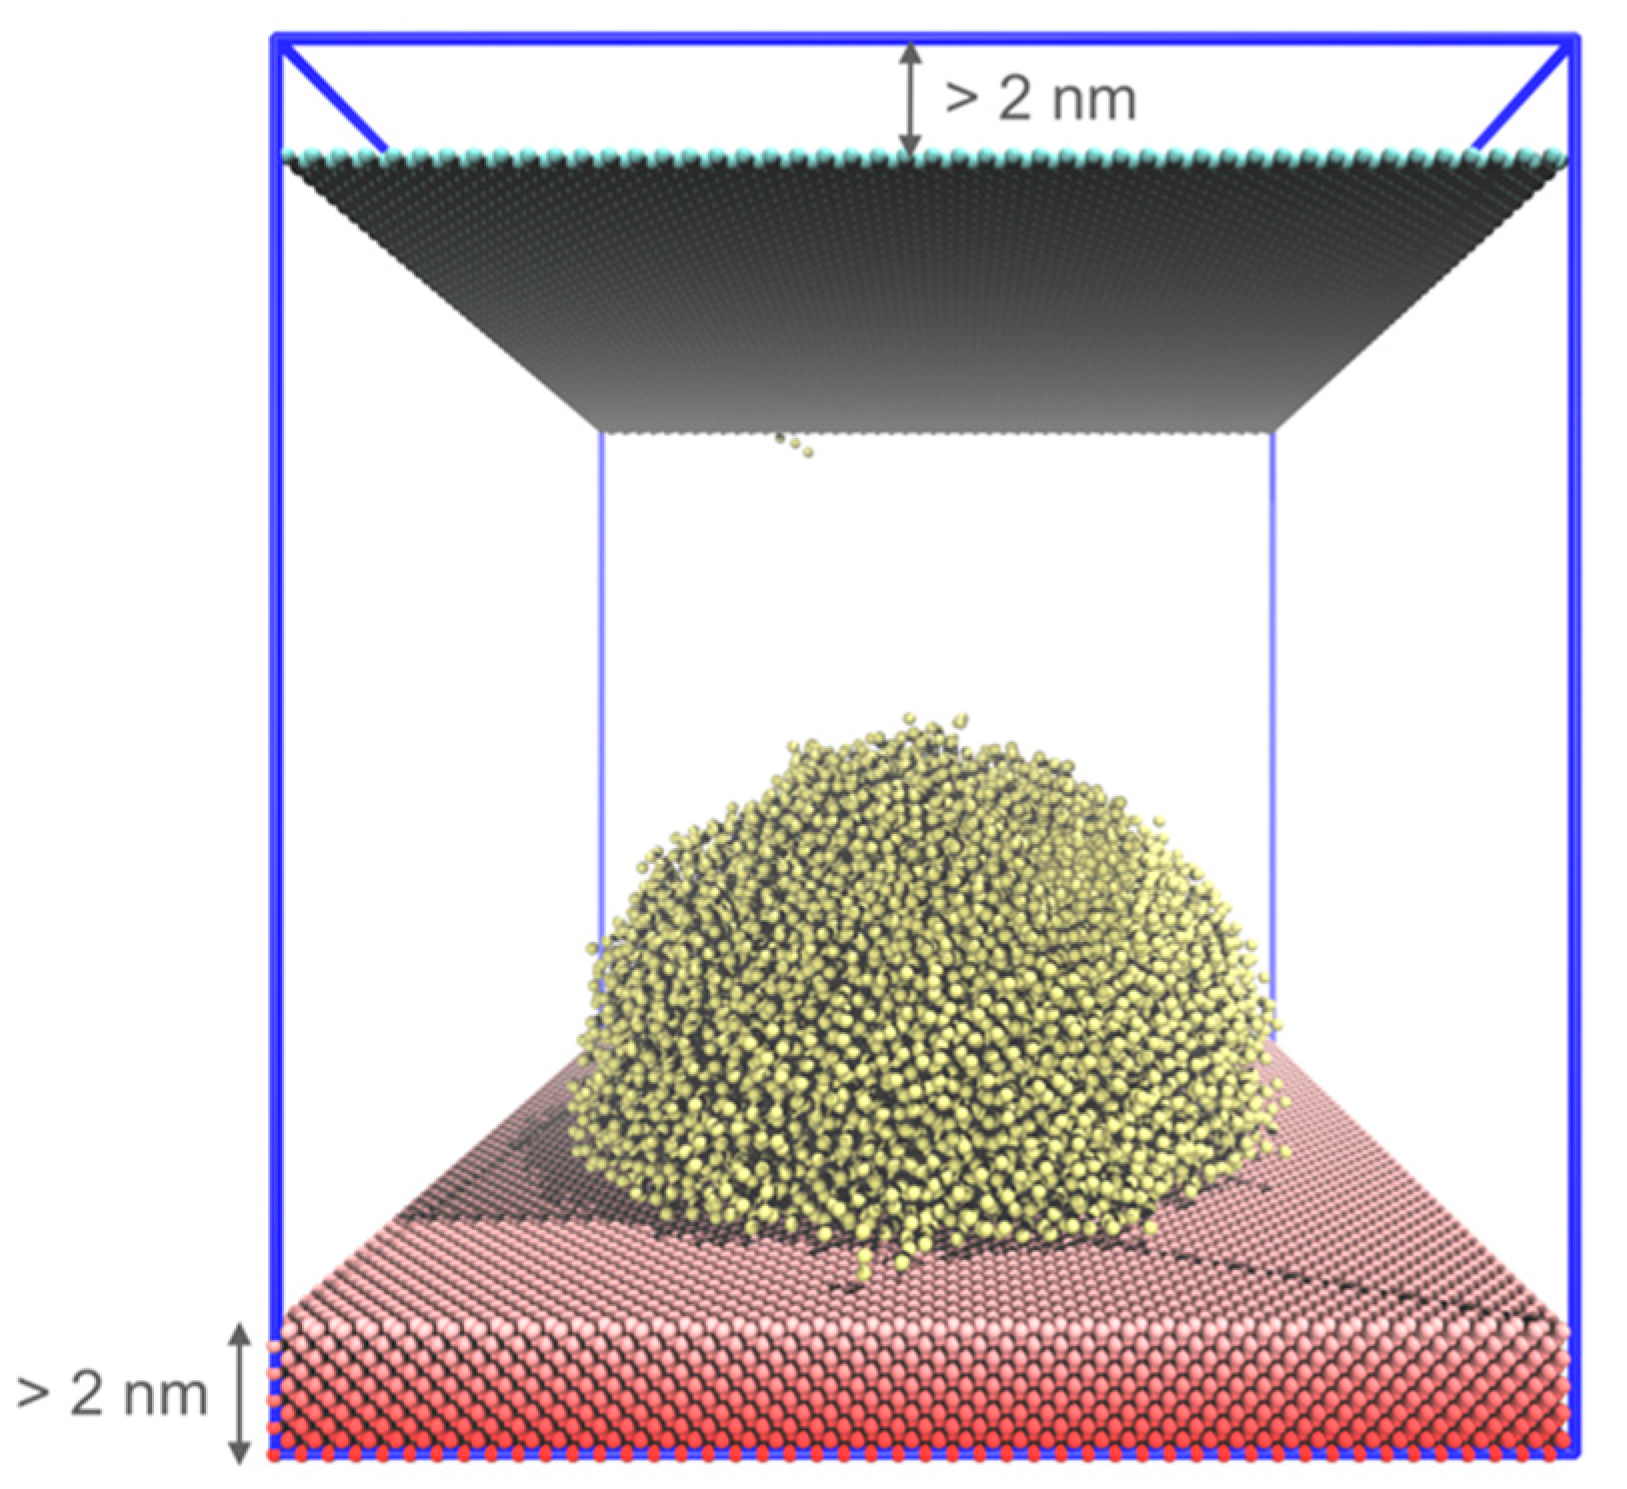
We carried out MD simulations using GROMACS 2018 [90]. Initializing the simulations, a fixed number of fluid molecules were arranged in a cubic geometry in the middle of the simulation box. The solid surface (the surface with Ketton topography in Figure 2b or one of the eight sinusoidal surfaces detailed in Table 1) was placed at the bottom of the box. The lateral (x and y) dimensions of the surfaces were 22.656 nm × 22.656 nm in all cases. A wall (one bead thick) was placed at the top of the simulation box (illustrated in Figure 4) to prevent the escape of fluid molecules. The fluid-barrier potential was modelled explicitly using an effective pseudo hard wall potential [91], which has no influence on the fluid–solid interactions. Note that the hard wall was positioned 2 nm below the top of the box to ensure there were no interactions between the wall and the surface replica, since periodic boundary conditions are present in all three Cartesian directions. We chose a long cut-off distance (2 nm) to eliminate the need for long-range corrections of the pressure and energy. Upon setting up the simulation box, the system was run for 2.5 ns with a 5-fs time step in the canonical (NVT) ensemble at a temperature of 298.15 K, controlled by the Nosé-Hoover thermostat using a 2-ps time constant. During the simulation, the fluid gradually forms a spherical drop and spontaneously moves towards and then contacts the surface. No gravity or external forces are employed; the adsorption on the surface is a consequence of free energy minimization. A further 5 ns of simulation was carried out to ensure the system had reached equilibrium, indicated by the flattening of the potential energy curves. The liquid n-decane drop was in equilibrium with coexisting vapor, but at the temperature studied, the vapor pressure was only about 7800 Pa and the number and effect of the vapor-phase molecules on the liquid droplet were negligible. Figure 4 illustrates the geometry of the simulation box and an equilibrium configuration in the case of a flat surface.

2.5. Computation of the Apparent Contact Angles

We used the apparent contact angle formed between the fluid droplet and surface as the metric to assess wetting. To compute the contact angle, from each system setting, we considered the fluid particle locations from 100 simulation frames. The simulation box was divided into 80 × 80 × 80 volume elements (voxels of 0.283 nm side length), and the particle density in each of these voxels was calculated. The voxel grid forms a three-dimensional image of the particle density integrated over the selected simulation frames. To reduce noise, this image was smoothed using a Gaussian image filter. Afterward, the voxels that contained more than a threshold fluid-particle density were identified as being fluid filled. The threshold was set at 5 molecules per nm3 based on visual inspection of the resulting fluid boundary. Noise in the data sometimes led to isolated fluid-filled voxels, which were removed by applying a median filter.
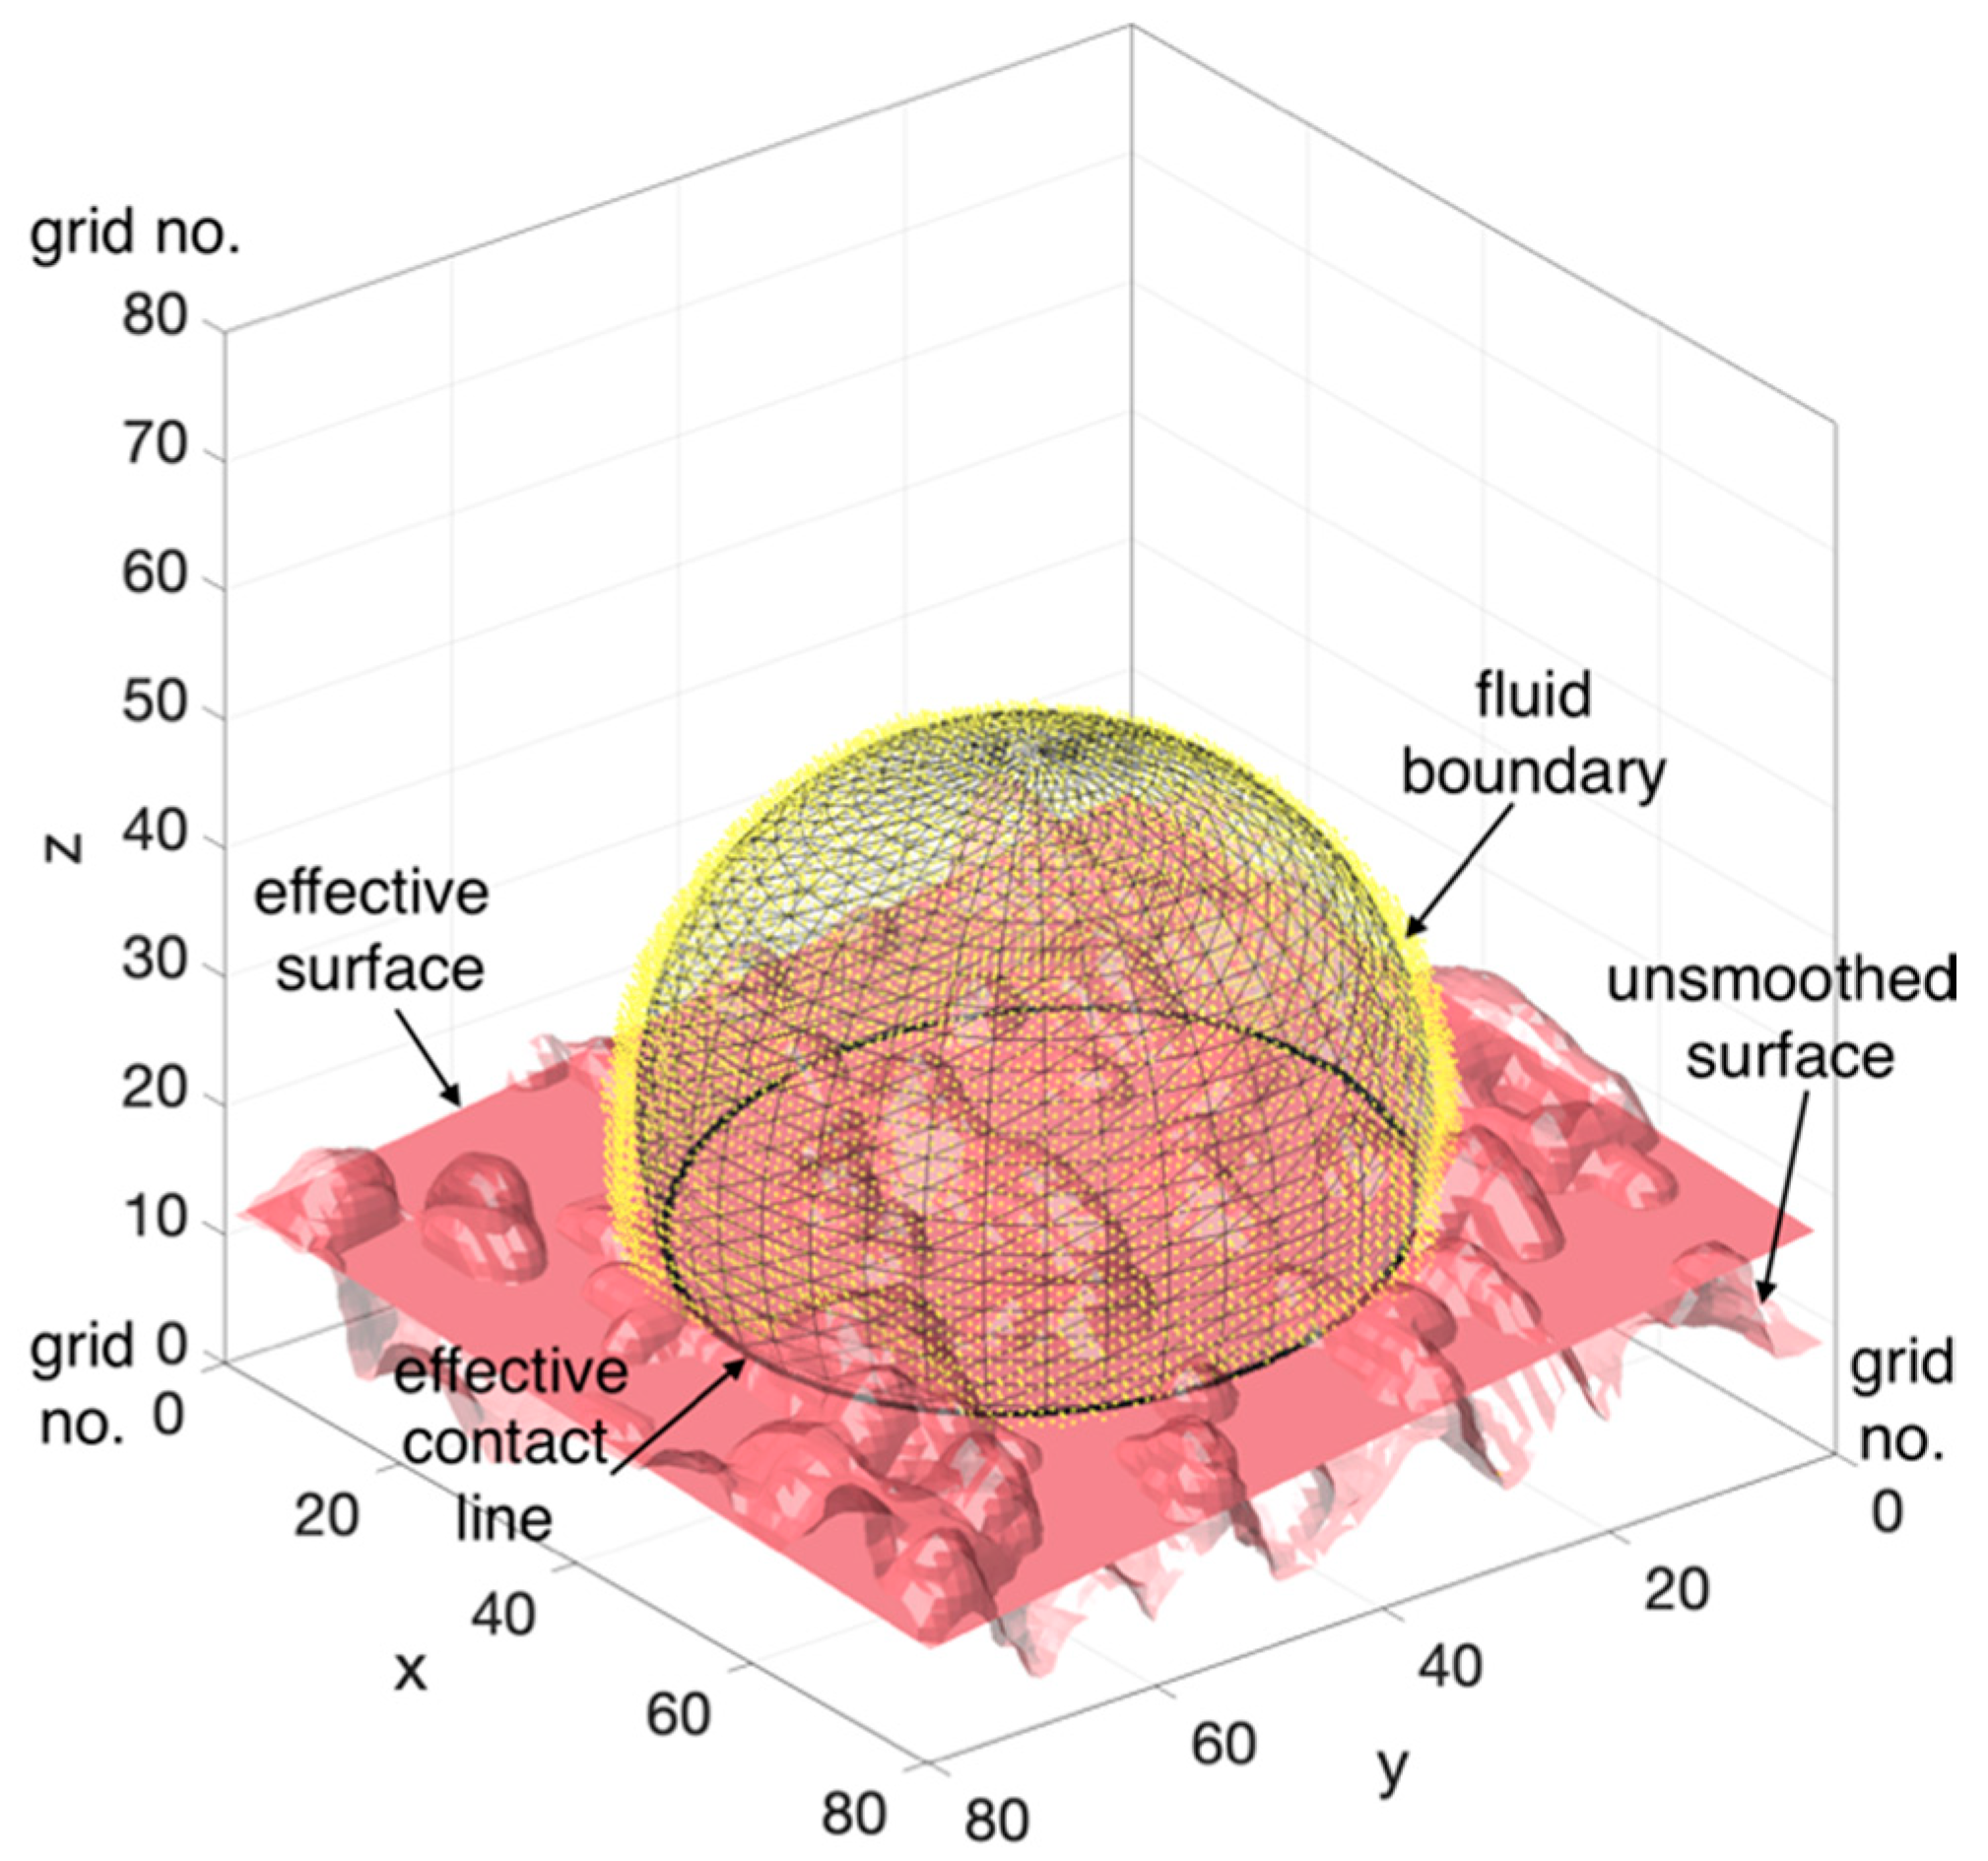
After segmenting and cleaning the fluid density image, a spherical cap was fitted to the liquid–vapor interface by minimizing the squared error between the spherical volume to the segmented droplet volume employing a MATLAB [92] script. Near the solid interface, the droplet’s shape locally deviated from a sphere. As these local deviations were found to disturb the fitting of the global droplet shape, fluid voxels near the solid surface (<2 voxels distance) were not taken into account for the least-squares algorithm. An example output of the fitting procedure is shown in Figure 5 for the example of the model surface with natural roughness, SS_E. The apparent contact angle was determined by computing the angle between the fitted spherical cap and an effective flat surface, which averaged out the rugosity. Another wetting metric that can be obtained here includes the curvature, which is given by the inverse of the radius of the fitted spherical cap. Alternative procedures for evaluating the contact angles have been presented before in the literature [55,62,93,94].

3. Results and Discussion

3.1. System Size Effect

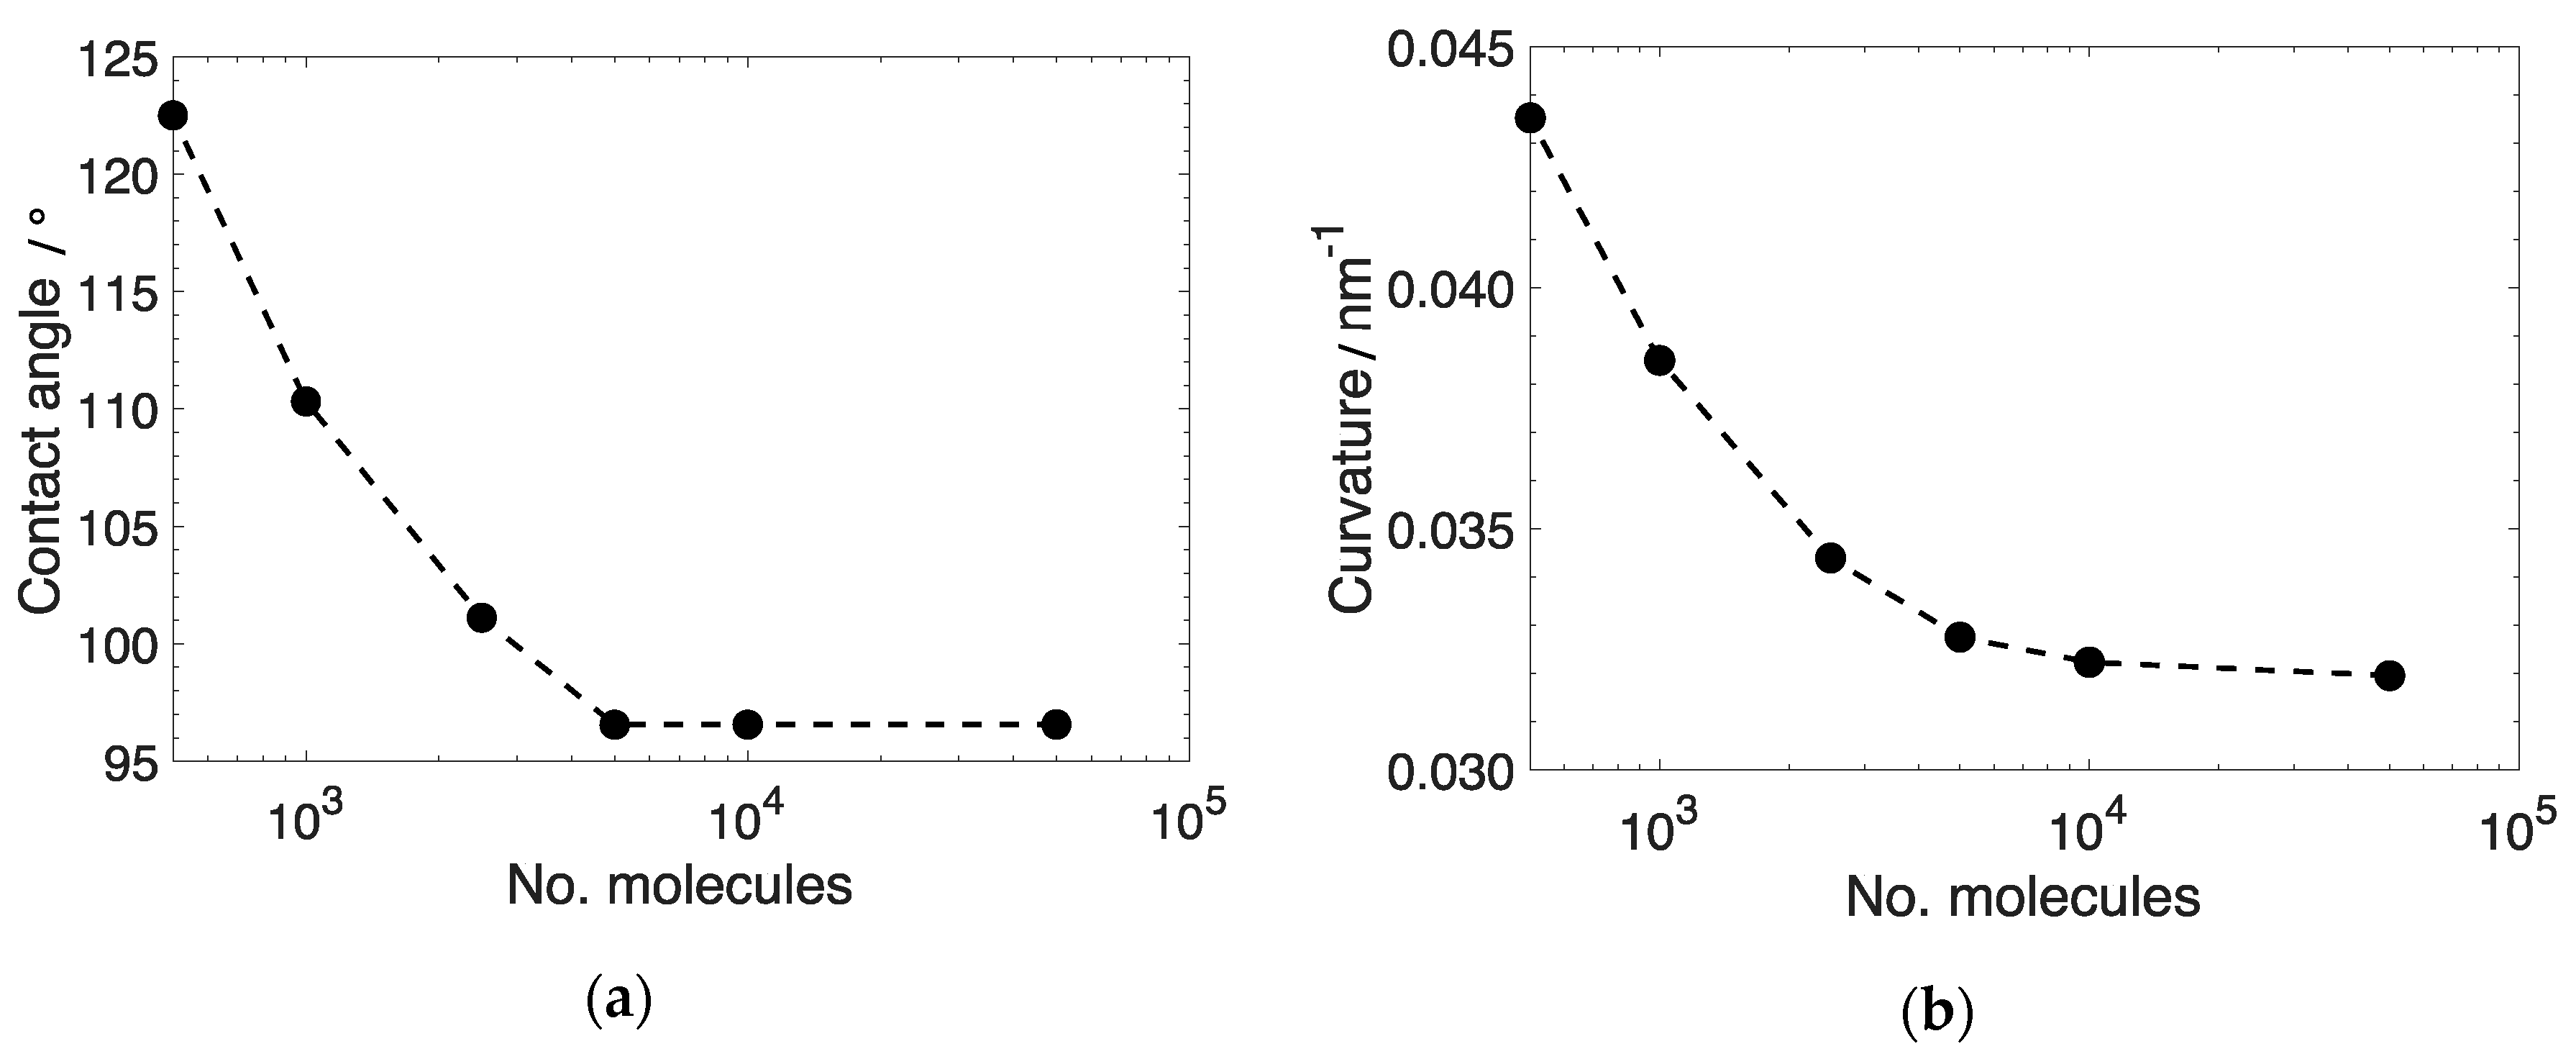
The dependence of the computed contact angle and curvature on the size of the droplet was tested by considering six scenarios with 500, 1000, 2500, 5000, 10,000, and 50,000 fluid molecules in the simulation. Figure 6 shows how the contact angle and curvature change with respect to the number of fluid molecules simulated.
As the droplet size grows, the contact angle initially declines rapidly and appears to reach a plateau, behavior which is attributed to the decreasing importance of the curvature of the contact line [55,95]. An analysis of the line tension effect shows that when the droplet contains 5000 or more fluid molecules, the effect becomes irrelevant. The line tension was calculated using the modified Young–Dupré equation in Bresme and Oettel’s work [96], corresponding to +4.2 pN, in line with literature data [53] that suggest that, at nanometer-length scales, an integration over the van der Waals interfacial potential gives rise to a mesoscale contribution between 1 and 100 pN. For systems with less than 5000 molecules, the line tension computed is large, up to 10−9 N, an order of magnitude exceeding theoretical expectations [53]; this is likely caused by the error of the spherical fitting process during the contact angle computations. To mitigate the effects mentioned, we chose to use 5000 molecules (15,000 beads) in the fluid droplet in the rest of this work as exceeding this value would result in very little change in the computed contact angles but a large increase in computational effort, which scales as O(N) to O(N2). Our observations are in line with a recent report by Khan and Singh [37], who studied by MD the crossover behavior of a water droplet from the Wenzel state to the Cassie state with a varying pillar height and surface fraction. They found that the contact angle of the droplet becomes constant beyond 5000 water molecules.
Another factor investigated was the number of frames extracted from the simulation trajectory for the purposes of computing the contact angle and curvature at equilibrium. Details of these studies are provided in the Supplementary Material, which details how the ensemble statistics affect the average contact angle or curvature. For subsequent wettability assessments, 100 equilibrium frames were used for computation in each scenario.

3.2. Contact Angle and Curvature Distribution

The apparent contact angles and its curvatures of the model fluid droplet on various sinusoidal surfaces were computed and compared to the case where the fluid was placed on the solid surface having the natural Ketton topology, i.e., SS_E. For each scenario, three simulations with slightly different initial configurations were performed, where the fluid was placed above the surface at three different random locations, resulting in different landing positions.
In Figure 7, the contact angle and curvature formed on the surface with Ketton topology with the results on the sinusoidal surfaces are compared. It is observed that the wetting is closest to cases SS_3 and SS_4, which have wavelengths of 7.553 and 5.664 nm, respectively, and are most similar to the Ketton surface. Therefore, it is possible to build a surrogate sinusoidal surface that exhibits very similar nanoscale wetting behavior as a surface having a natural roughness once the amplitude and the wavelengths of the natural roughness are known.
The contact angle and curvature results in Figure 7 suggest that when a surface is exceptionally jagged (SS_8 and SS_16) or perfectly flat (SS_0), placing the fluid at different locations results in almost no contact angle differences. On the other hand, in surfaces with a moderate wavelength, placing the fluid drop at different locations results in significantly different average droplet contact angles, up to a 41% span, and curvatures, up to an 8% difference. The discrepancies of the wetting over surface types of a moderate wavelength are presumably associated with the particulars of the pinning of the contact line, which is attributed to the topology of the rough surfaces, inducing a droplet shape distorted from the hemisphere. The pinning effect might be mitigated by running longer simulations, and while the equilibration time was extended to 15 ns for these cases, no apparent change on the results were observed. Given the size of the system, it seems to be unfeasible to run even longer simulations that have a significant impact on the results. Nevertheless, the results are consistent with other simulation studies, where the nanoscopic surface roughness was compared to a smooth surface [24,25,27], and it was found that the apparent contact angle, when it is larger than 90°, increases with the roughness.
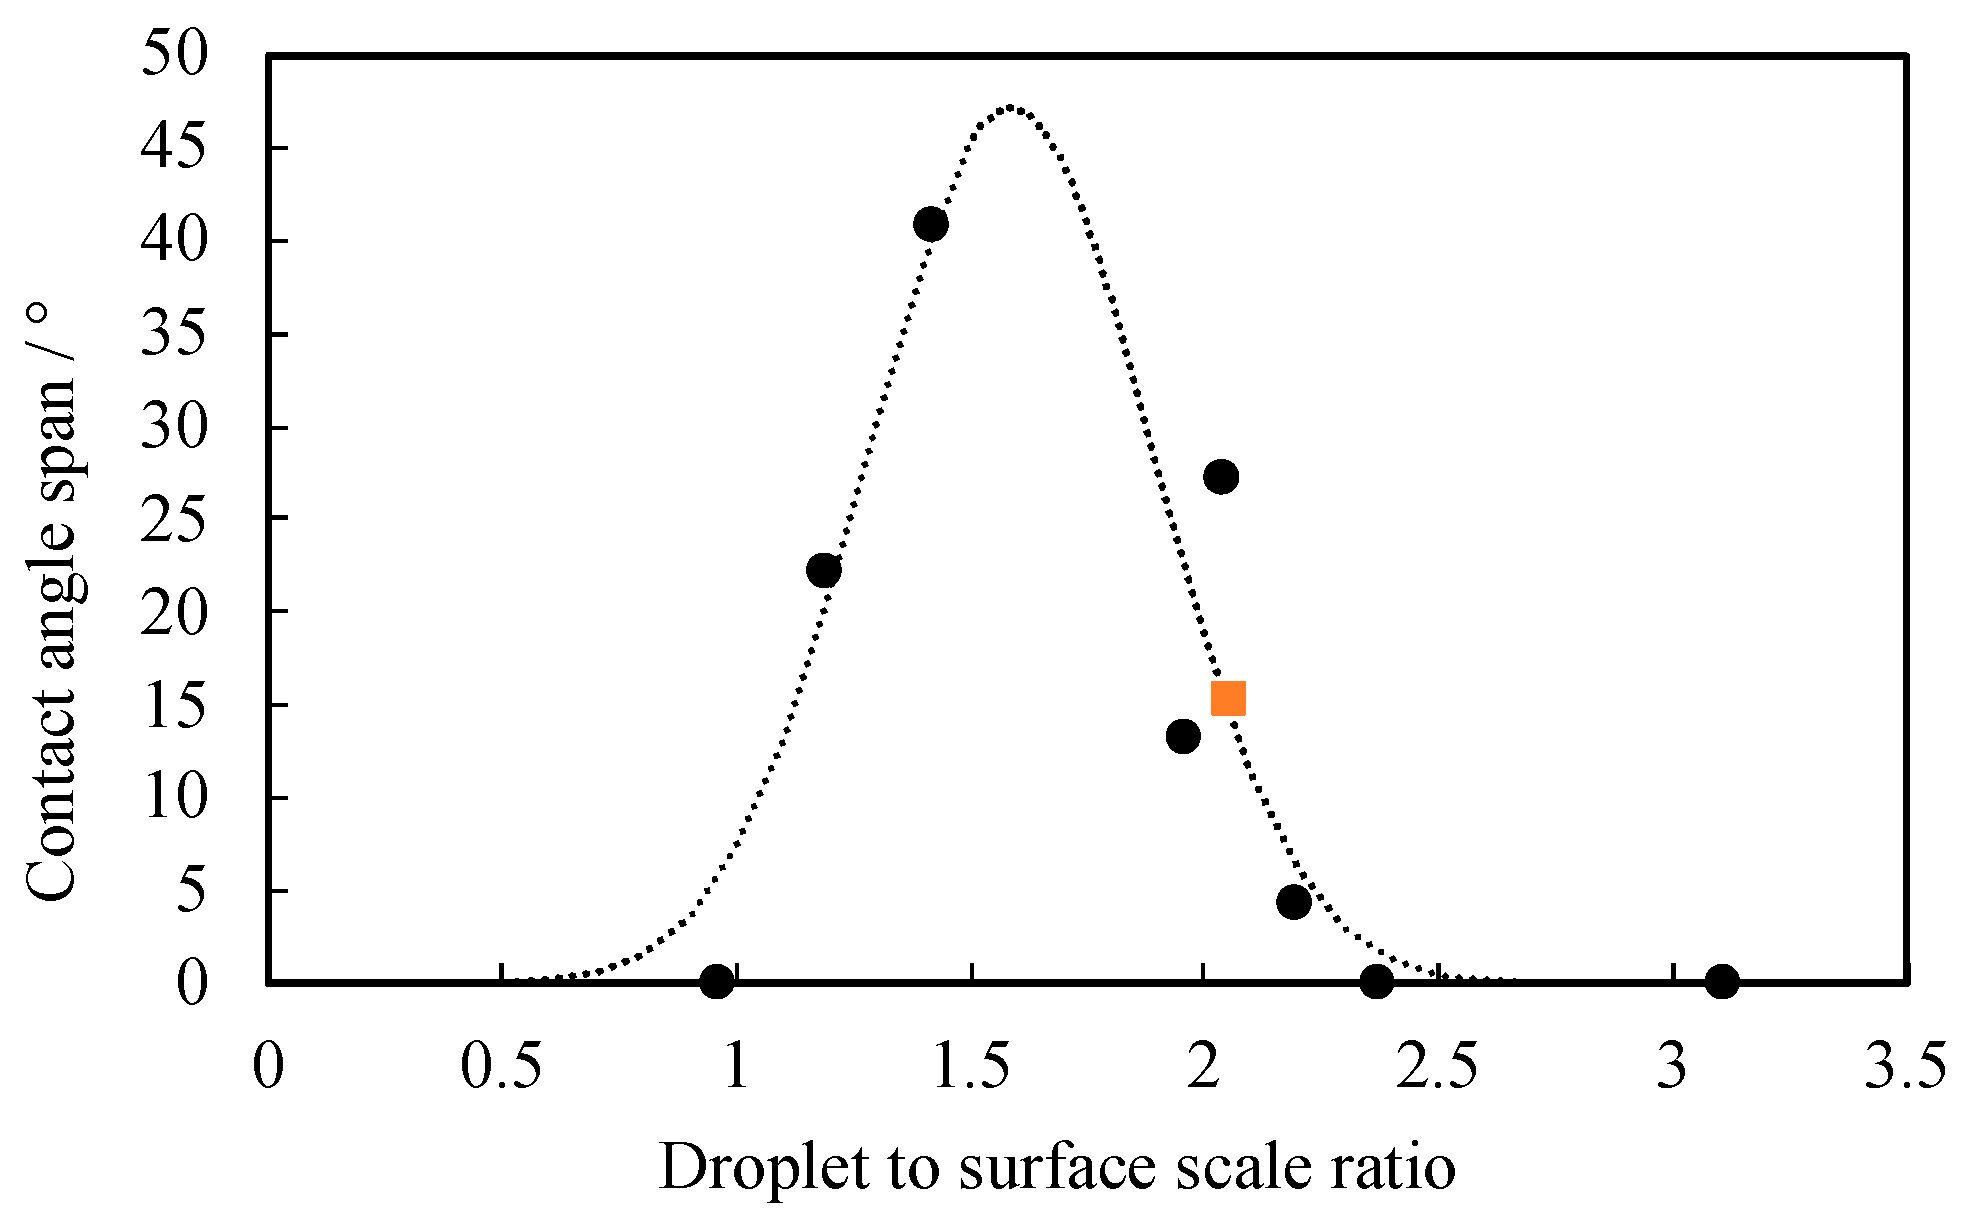
We investigated the contact angle span (uncertainty) by plotting it against the droplet to surface scale ratio in Figure 8. The surface scale was measured from the highest point of a sinusoidal surface to the bottom of its sinusoidal feature, i.e., the amplitude, which was fixed at 4 nm. The scale of the droplet was defined as the distance from the center of the fitted sphere (shown as the mashed sphere in Figure 5) to the bottom of the sinusoidal feature of the surface. As can be seen in Figure 8, the contact angle variation first increases then reduces, following a Gaussian curve. Hence, one may argue that the effect could be eliminated when the scale of the fluid drop is 2.5–3 times greater than the scale of the surface feature. Therefore, if a much larger fluid drop is used, say 10 times greater than the current droplet, the error bars may be reduced significantly.
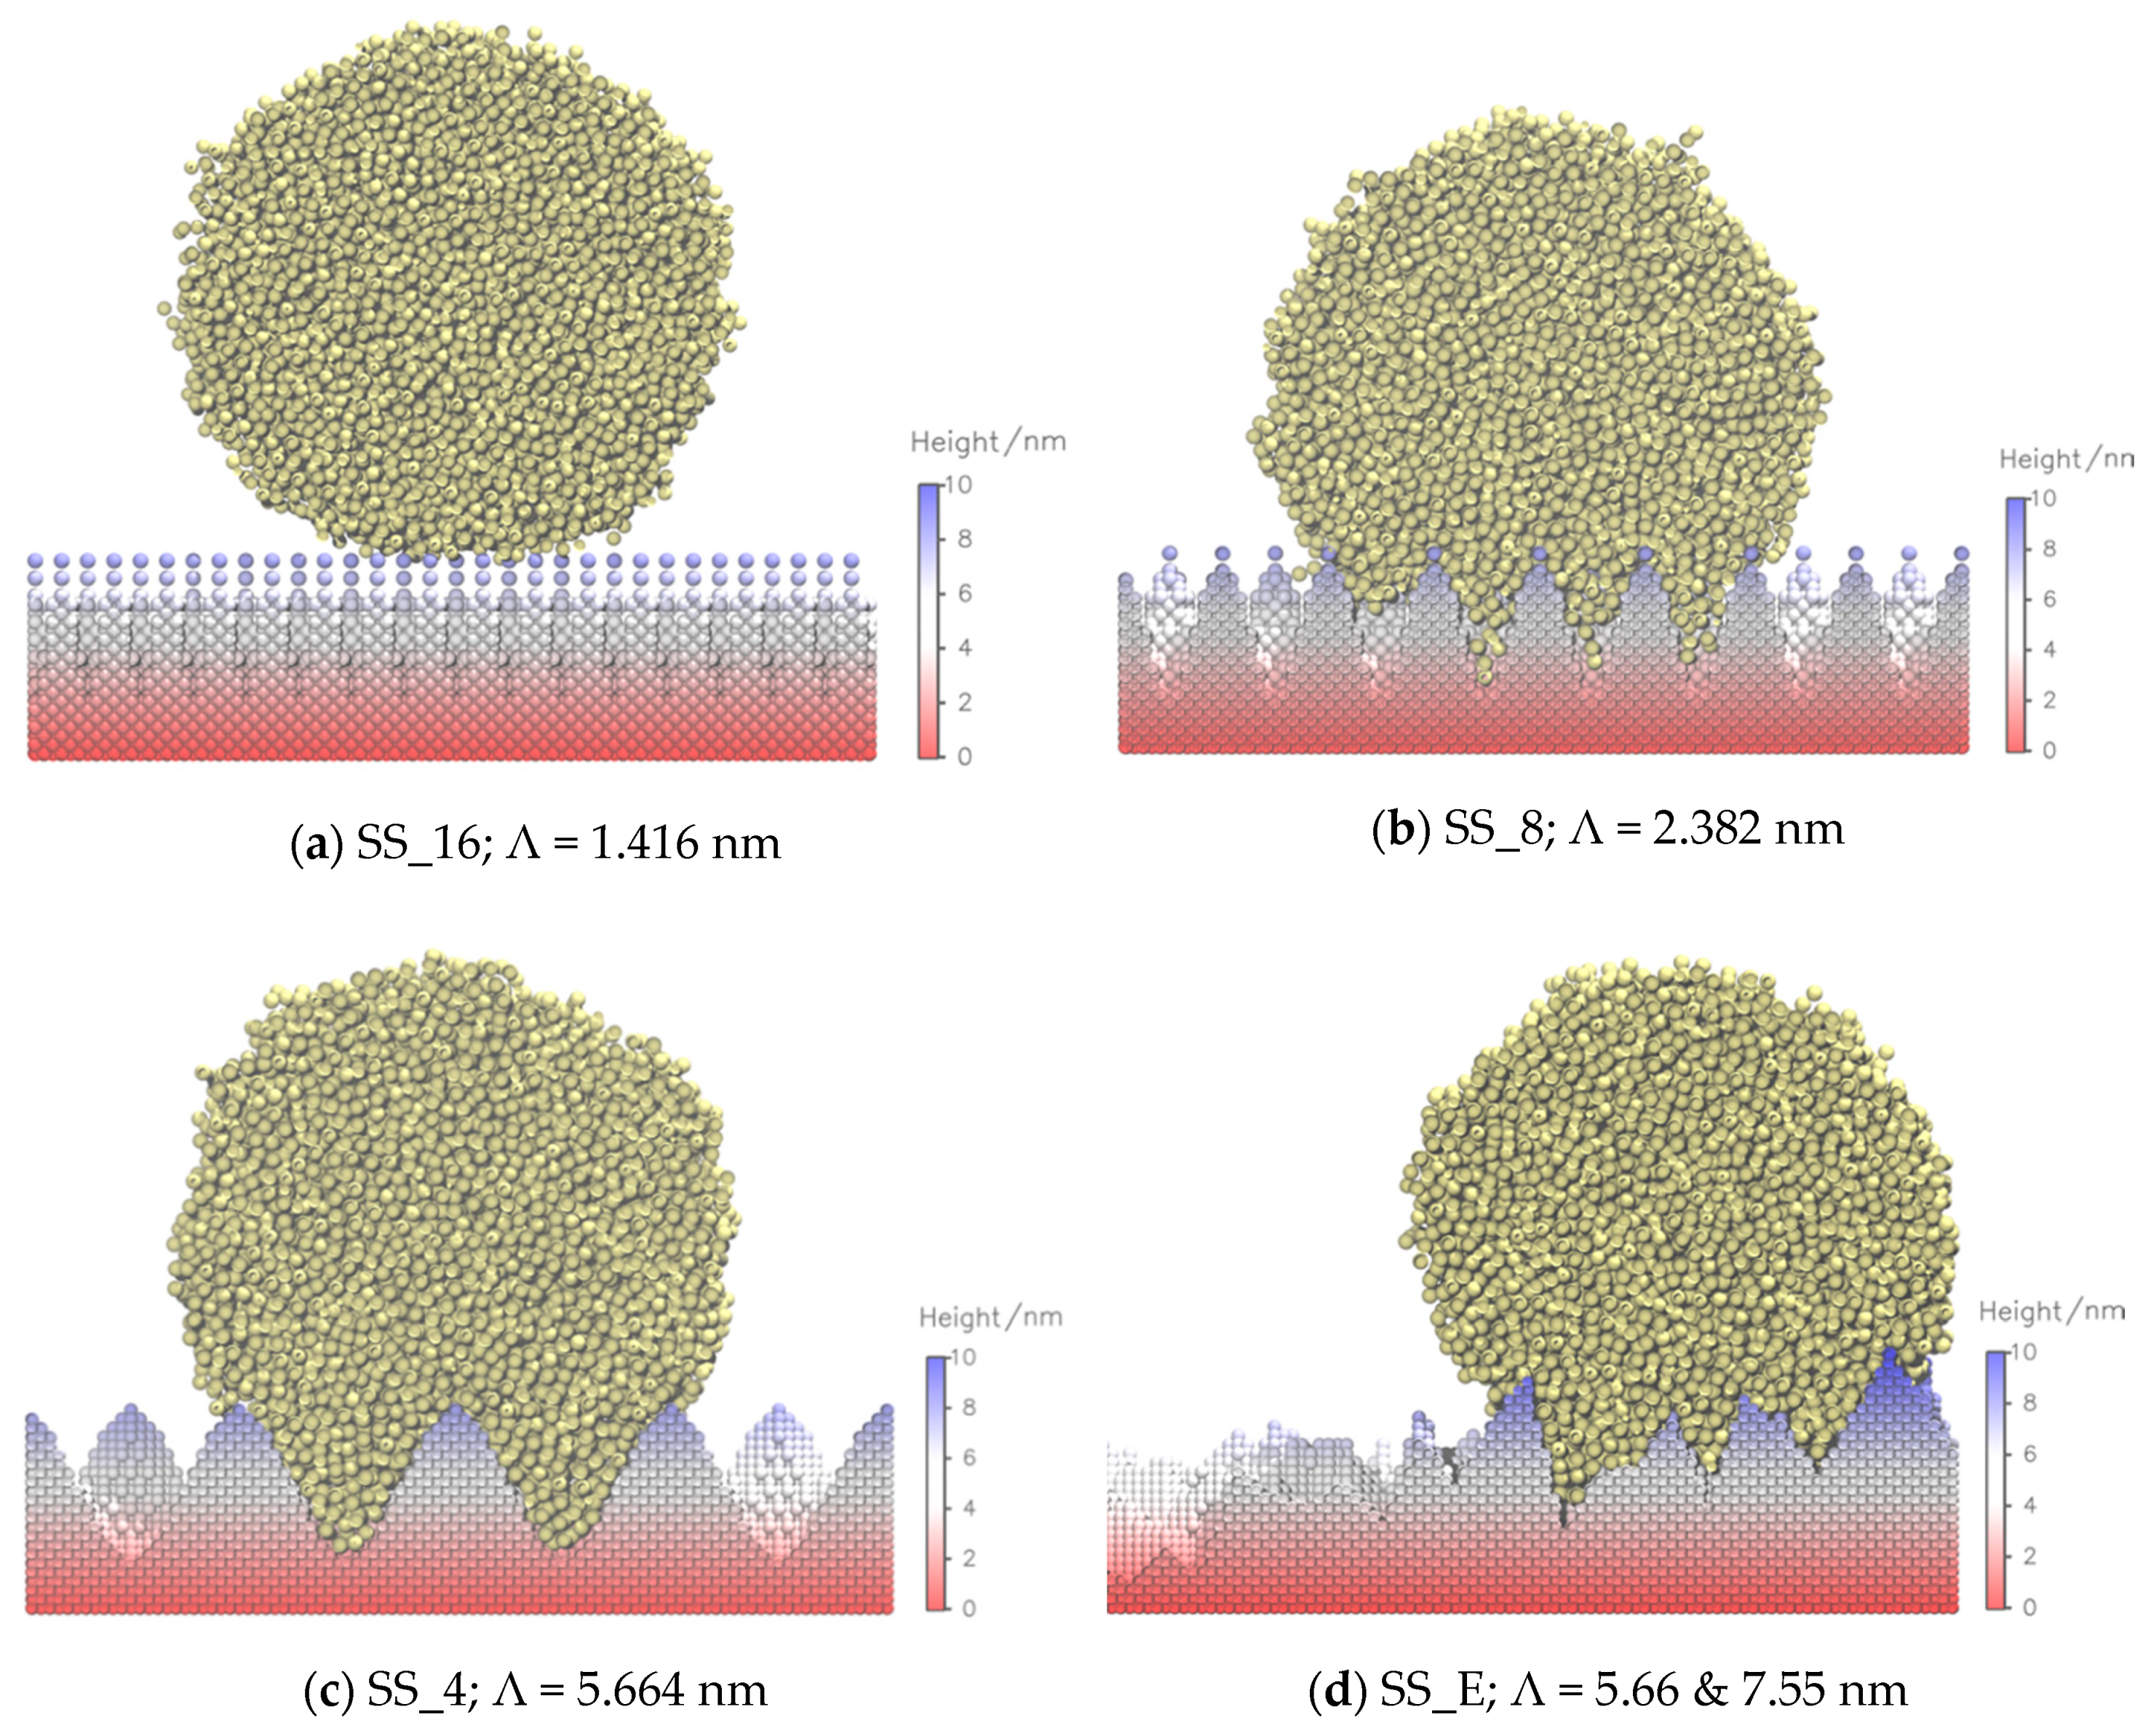
A surprising aspect of the results is the very significant change in the local wetting characteristics due to the surface rugosity. While a contact angle of 97° is characteristic of this fluid–solid combination on a flat surface, increasing the rugosity increases monotonically the perceived contact angle. For very spiked surfaces, the value reaches the limits of fluid-fobicity (ca. 160°), as shown in Figure 9a, a longitudinal section of the equilibrated drop. The system is exemplary of the Cassie–Baxter model, where the fluid does not wet the surface, leaving a space in the bottom of the sinusoidal features. The equation for the Cassie–Baxter apparent contact angle ( θ * ), when fluid vapor is trapped under the liquid drop, can be written as follows [97]:
γ   cos   θ * = Φ   ( γ VS γ LS ) ( 1 Φ )   γ ,
where γ is the liquid/vapor surface tension, γ α β is the vapor/solid and liquid/solid interfacial tensions, Φ is the fraction of solid trapped under the drop while the vapor fraction is 1 Φ . Substituting the Young equation (Equation (4)) into Equation (3) to replace ( γ VS γ LS ) , we have:
cos   θ 0 = γ V S γ L S γ ,
cos   θ * = Φ ( cos   θ 0 + 1 ) 1 ,
where θ 0 is the equilibrium contact angle formed on a flat surface. Over a less rugose surface, i.e., Figure 9b, gaps are filled by fluid molecules, and a vapor phase exists between sine asperities. Φ is large in this case, making θ * greater than θ 0 as observed from Table 1. The range from SS_8 to SS_16 corresponds to the so-called capillary drying effect, where the contact angle increases significantly relative to the angle obtained with the flat surface. The contact angle of the realistic surface (SS_E) is 120°, which is well captured by the surrogate surfaces SS_3 and SS_4. Figure 9c,d display the section of equilibrated fluid on SS_4 and SS_E surfaces, respectively, where the fluid has filled the surface gaps and the system seems to be entering the Wenzel state.
The Wenzel model, given in Equation (6), predicts the contact angle of the fluid in this work to grow as the roughness factor R increases:
cos   θ * = R   cos   θ 0 .
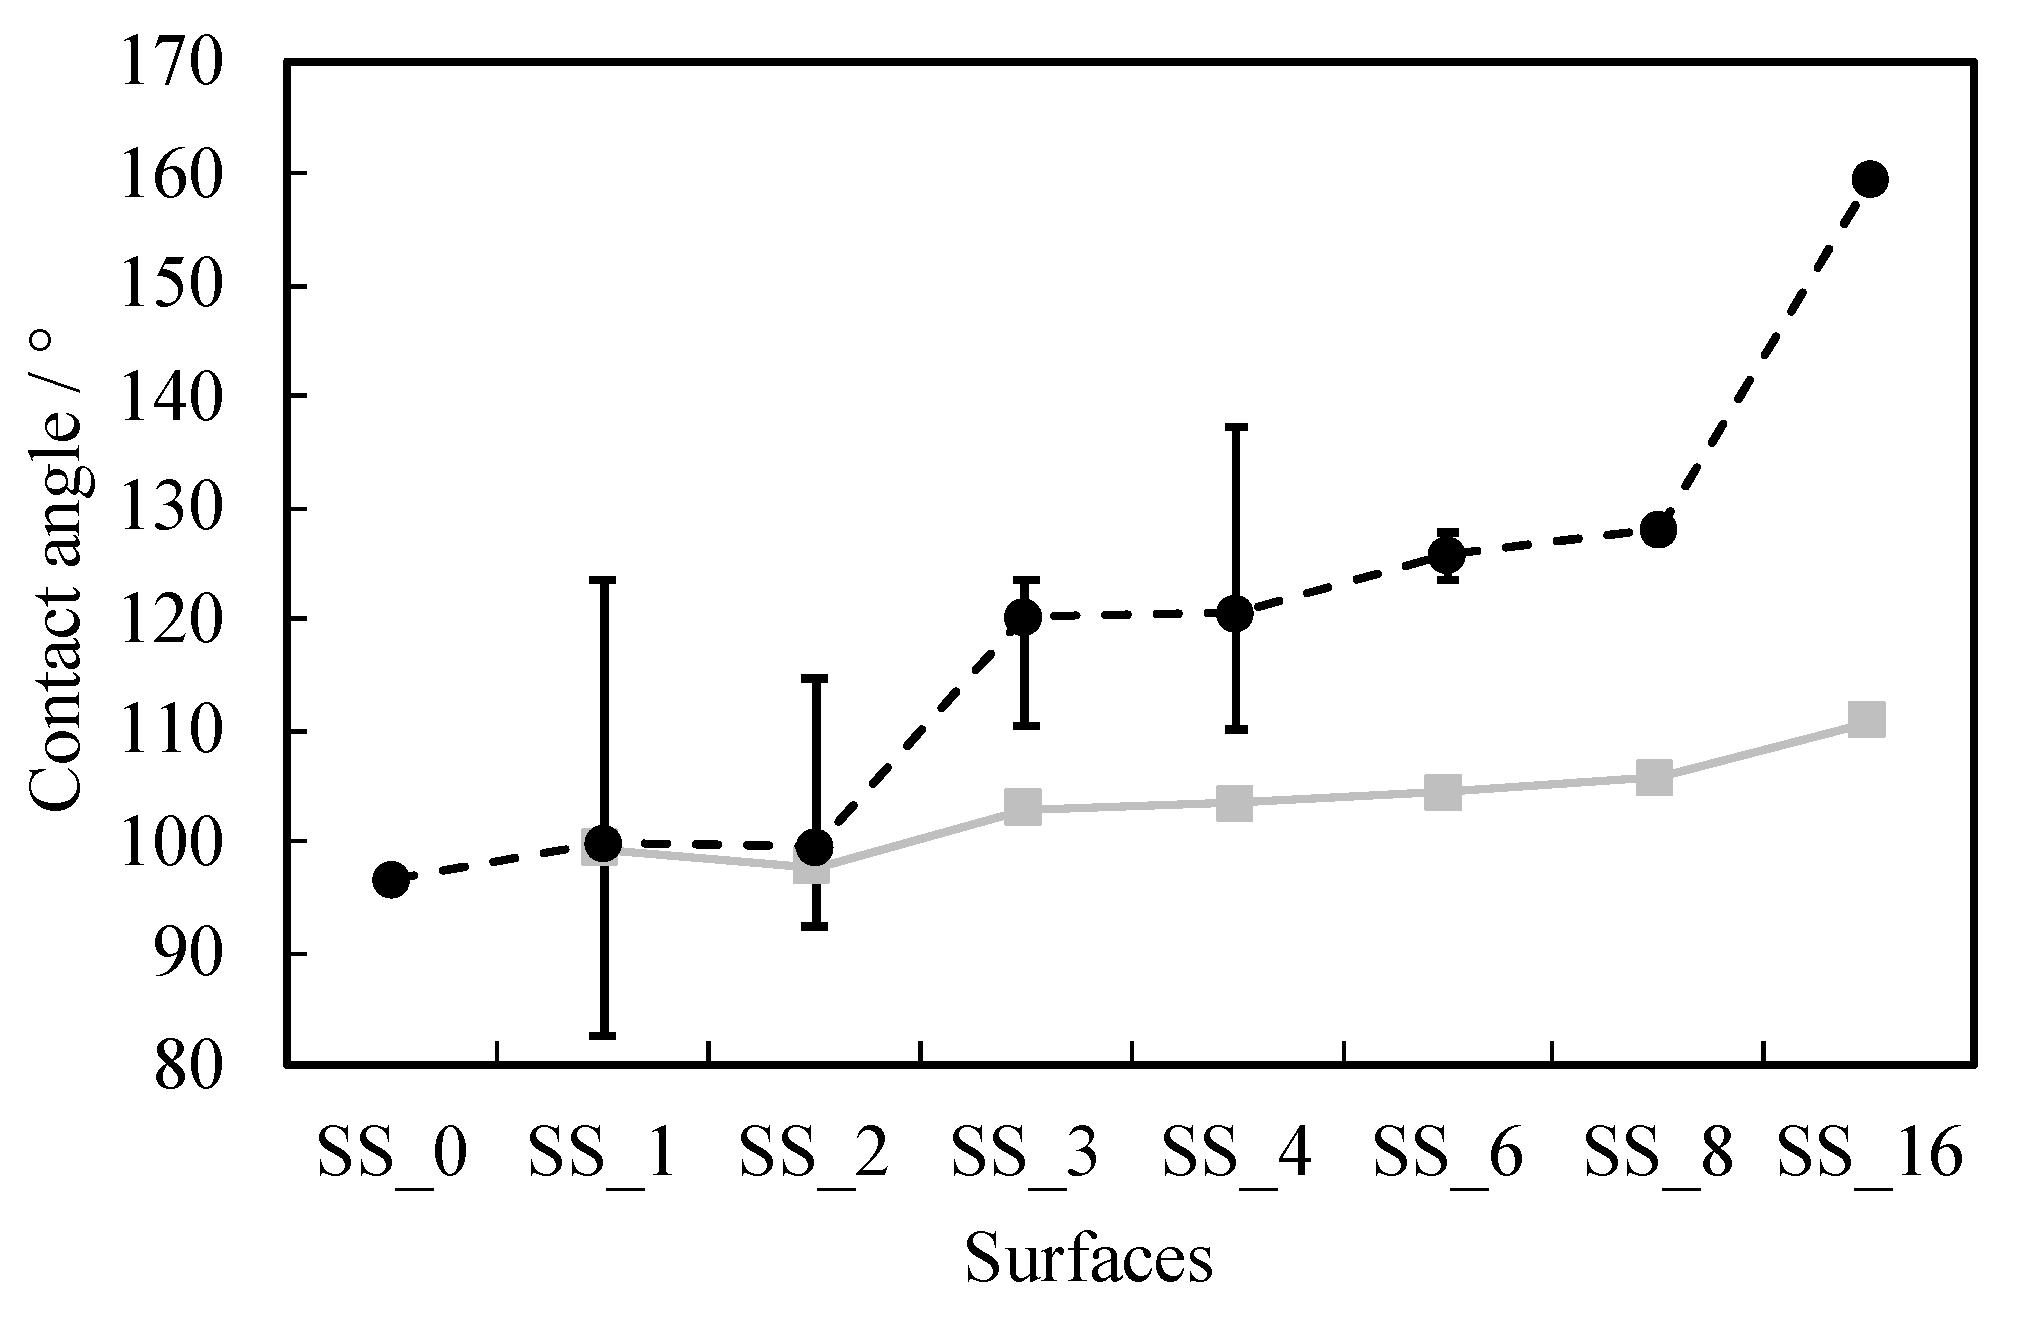
However, the Wenzel assumption is not always satisfied, particularly when the roughness is large, as R   cos   θ 0 could exceed the [−1, 1] boundary [1]. In particular, for a very large roughness, the lateral confinement might play a role, by preventing the complete filling of the porous structure due to geometrical considerations connected to the molecular size. In this case, we expect deviations between the simulated contact angles and the predictions of Wenzel equation. Indeed, we show in Figure 10 that the contact angle deviates from Wenzel’s prediction as early as SS_3, using the simulated contact angle value of 97°, corresponding to the flat surface SS_0 as θ 0 . The jumps on the simulated contact angle (SS_2 to SS_3 and SS_8 to SS_16) underline the lack of a smooth dependence of the contact angle on the surface roughness.
Figure 10 shows the system no longer follows Wenzel’s prediction as early as SS_3 using the simulated contact angle value of 97°, on the flat surface SS_0 as θ 0 .
The transition of the fluid configuration over SS_8 to SS_4 is consistent with the conclusion drawn by Yaghoubi and Foroutan [40], who found that the wettability of the nanodroplets over the groove-patterned surface increases if the depth of the grooves remains the same while their width increases. The variation in the contact angle due to rugosity suggests that, at least partially, the spread of the contact angle over 90° often seen in micro-CT experiments within Ketton rock for different fluids [98] can be attributed to the natural heterogeneities present in natural surfaces down to the nanoscale.

4. Conclusions

Here, we presented a methodology for systematically studying the effects of nanoscale topography with MD models, which are useful for measuring the nanoscale wettability. We suggest that one can build a surrogate sinusoidal surface that exhibits very similar nanoscale wetting behavior as a surface having a natural roughness. The use of AFM measurements allowed us to consider a baseline with a plausible rugosity that one would expect to see in a real rock sample. We stress that the point here is not the atomistic detail, which is not being accessed, but the fact that the features of the surface are characterized by amplitudes and wavelengths of a few nm. The proposed model differs from other proposals [99,100,101], where pillared structures were employed to describe the wetting states and/or the superhydrophobic surfaces. In these latter descriptions, sharp corners and edges presumably have an overpowering effect on the resulting local fluid structure. Clearly, other simple periodic geometries [102] might be used instead of the one proposed here with similar success. In any case, the proposed model can then be exploited for systematic sensitivity analysis, employed for further upscaling [103] or to provide for an in silico platform for testing advanced theories of wetting [64,104]. More importantly, it can be employed as a test system to understand outstanding inconsistencies between theories and simulations (and even resolving contradictions amongst simulations results), as pointed out by Svoboda et al. [105].
Finally, it is worth noting that although we did not specify a particular surface chemistry for the natural surface, it is possible to adjust the surface–fluid interactions based on reference contact angle information, should such information be available. For instance, the reported [83] macroscopic contact angle between n-decane and shale rocks is 22°, which can be attained by employing a stronger solid–fluid interaction. Once the surface is defined and built in a simulation box, coarse-grained molecular dynamics simulations (or Monte Carlo procedures [106]) allow for quantitative simulation of realistic systems.

Supplementary Materials

The following are available online at https://www.mdpi.com/1996-1073/13/11/2770/s1, PDF: AFM background noise evaluation, Fourier transform of the surfaces, Figures of surrogate model surfaces, Number of frames needed for evaluating contact angles, Visualization of drops on surfaces, AFM force mapping and QI mode. Zip: GROMACS files of surrogate and realistic surfaces.

Author Contributions

Conceptualization, L.Z. and E.A.M.; Investigation, L.Z., M.R. and T.B.; Methodology, L.Z., M.R. and T.B.; Project administration, A.G., M.M.M.-v.d.H. and J.P.M.T.; Supervision, A.G., M.M.M.-v.d.H., F.B., J.P.M.T. and E.A.M.; Validation, L.Z., M.R. and T.B.; Writing—original draft, L.Z., M.R.; Writing—review and editing, F.B., J.P.M.T. and E.A.M. All authors have read and agreed to the published version of the manuscript.

Funding

This research was funded by Shell Global Solutions International B.V. through the “Digital Rocks” program.

Acknowledgments

The authors acknowledge the generous support of Shell Global Solutions International B.V. through the “Digital Rocks” program. T.B. is currently a postdoctoral fellow of the Research Foundation–Flanders (FWO) under grant 12X0919N.

Conflicts of Interest

The authors declare no conflict of interest.

References

  1. Quéré, D. Wetting and roughness. Annu. Rev. Mater. Res. 2008, 38, 71–99. [Google Scholar] [CrossRef]
  2. Gittens, R.A.; McLachlan, T.; Olivares-Navarrete, R.; Cai, Y.; Berner, S.; Tannenbaum, R.; Schwartz, Z.; Sandhage, K.H.; Boyan, B.D. The effects of combined micron-/submicron-scale surface roughness and nanoscale features on cell proliferation and differentiation. Biomaterials 2011, 32, 3395–3403. [Google Scholar] [CrossRef] [PubMed] [Green Version]
  3. Shirtcliffe, N.J.; McHale, G.; Newton, M.I.; Chabrol, G.; Perry, C.C. Dual-scale roughness produces unusually water-repellent surfaces. Adv. Mater. 2004, 16, 1929–1932. [Google Scholar] [CrossRef]
  4. Mitik-Dineva, N.; Wang, J.; Truong, V.K.; Stoddart, P.; Malherbe, F.; Crawford, R.J.; Ivanova, E.P. Escherichia coli, Pseudomonas aeruginosa, and Staphylococcus aureus attachment patterns on glass surfaces with nanoscale roughness. Curr. Microbio. 2009, 58, 268–273. [Google Scholar] [CrossRef]
  5. Ramiasa, M.; Ralston, J.; Fetzer, R.; Sedev, R. Nanoroughness impact on liquid–liquid displacement. J. Phys. Chem. C 2012, 116, 10934–10943. [Google Scholar] [CrossRef]
  6. Murison, J.; Semin, B.; Baret, J.C.; Herminghaus, S.; Schröter, M.; Brinkmann, M. Wetting heterogeneities in porous media control flow dissipation. Phys. Rev. Appl. 2014, 2, 034002. [Google Scholar] [CrossRef] [Green Version]
  7. Herring, A.L.; Sheppard, A.; Andersson, L.; Wildenschild, D. Impact of wettability alteration on 3D nonwetting phase trapping and transport. Int. J. Greenh. Gas Control 2016, 46, 175–186. [Google Scholar] [CrossRef] [Green Version]
  8. Sajjad Rabbani, H.; Osman, Y.; Almaghrabi, I.; Azizur Rahman, M.; Seers, T. The Control of Apparent Wettability on the Efficiency of Surfactant Flooding in Tight Carbonate Rocks. Processes 2019, 7, 684. [Google Scholar] [CrossRef] [Green Version]
  9. Bultreys, T.; van Hoorebeke, L.; Cnudde, V. Simulating secondary waterflooding in heterogeneous rocks with variable wettability using an image-based, multiscale pore network model. Water Resour. Res. 2016, 52, 6833–6850. [Google Scholar] [CrossRef]
  10. Frank, F.; Liu, C.; Scanziani, A.; Alpak, F.O.; Riviere, B. An energy-based equilibrium contact angle boundary condition on jagged surfaces for phase-field methods. J. Coll. Interf. Sci. 2018, 523, 282–291. [Google Scholar] [CrossRef] [Green Version]
  11. Nakae, H.; Inui, R.; Hirata, Y.; Saito, H. Effects of surface roughness on wettability. Acta Mater. 1998, 46, 2313–2318. [Google Scholar] [CrossRef]
  12. Al Ratrout, A.; Blunt, M.J.; Bijeljic, B. Wettability in complex porous materials, the mixed-wet state, and its relationship to surface roughness. Proc. Nat. Acad. Sci. USA 2018, 115, 8901–8906. [Google Scholar] [CrossRef] [PubMed] [Green Version]
  13. Lin, G.; Zhang, Q.; Lv, C.; Tang, Y.; Yin, J. Small degree of anisotropic wetting on self-similar hierarchical wrinkled surfaces. Soft Matter 2018, 14, 1517–1529. [Google Scholar] [CrossRef] [PubMed]
  14. He, G.; Wang, K. The super hydrophobicity of ZnO nanorods fabricated by electrochemical deposition method. Appl. Surf. Sci. 2011, 257, 6590–6594. [Google Scholar] [CrossRef]
  15. Kim, T.I.; Tahk, D.; Lee, H.H. Wettability-controllable super water-and moderately oil-repellent surface fabricated by wet chemical etching. Langmuir 2009, 25, 6576–6579. [Google Scholar] [CrossRef] [PubMed]
  16. Choi, S.J.; Suh, K.Y.; Lee, H.H. Direct UV-replica molding of biomimetic hierarchical structure for selective wetting. J. Am. Chem. Soc. 2008, 130, 6312–6313. [Google Scholar] [CrossRef]
  17. Yu, Z.; Chen, L.; Wu, W.; Ge, H.; Chou, S.Y. Fabrication of nanoscale gratings with reduced line edge roughness using nanoimprint lithography. J. Vac. Sci. Tech. B 2003, 21, 2089–2092. [Google Scholar] [CrossRef] [Green Version]
  18. Bogue, R. Nanoscale fabrication: Techniques, limitations and future prospects. Assemb. Autom. 2011, 31, 304–308. [Google Scholar] [CrossRef]
  19. Doudrick, K.; Liu, S.; Mutunga, E.M.; Klein, K.L.; Damle, V.; Varanasi, K.K.; Rykaczewski, K. Different shades of oxide: From nanoscale wetting mechanisms to contact printing of gallium-based liquid metals. Langmuir 2014, 30, 6867–6877. [Google Scholar] [CrossRef]
  20. Gerd, B.; Quate, C.F.; Gerber, C. Atomic force microscope. Phys. Rev. Lett. 1986, 56, 930. [Google Scholar]
  21. Stipp, S.L.S.; Eggleston, C.M.; Nielsen, B.S. Calcite surface structure observed at microtopographic and molecular scales with atomic force microscopy (AFM). Geochim. Cosmochim. Acta 1994, 58, 3023–3033. [Google Scholar] [CrossRef]
  22. Giessibl, F.J. Advances in atomic force microscopy. Rev. Mod. Phys. 2003, 75, 949. [Google Scholar] [CrossRef] [Green Version]
  23. Ricci, M.; Spijker, P.; Stellacci, F.; Molinari, J.F.; Voïtchovsky, K. Direct visualization of single ions in the stern layer of calcite. Langmuir 2013, 29, 2207–2216. [Google Scholar] [CrossRef] [PubMed] [Green Version]
  24. Mugele, F.; Siretanu, I.; Kumar, N.; Bera, B.; Wang, L.; de Ruiter, R.; Maestro, A.; Duits, M.; van den Ende, D.; Collins, I. Insights from ion adsorption and contact-angle alteration at mineral surfaces for low-salinity waterflooding. SPE J. 2016, 21, 1–204. [Google Scholar] [CrossRef]
  25. Matthiesen, J.; Bovet, N.; Hilner, E.; Andersson, M.P.; Schmidt, D.A.; Webb, K.J.; Dalby, K.N.; Hassenkam, T.; Crouch, J.; Collins, I.R.; et al. How naturally adsorbed material on minerals affects low salinity enhanced oil recovery. Energy Fuels 2014, 28, 4849–4858. [Google Scholar] [CrossRef]
  26. Hassenkam, T.; Skovbjerg, L.L.; Stipp, S.L.S. Probing the intrinsically oil-wet surfaces of pores in North Sea chalk at subpore resolution. Proc. Nat. Acad. Sci. USA 2009, 106, 6071–6076. [Google Scholar] [CrossRef] [Green Version]
  27. Buckley, J.S.; Lord, D.L. Wettability and morphology of mica surfaces after exposure to crude oil. J. Pet. Sci. Eng. 2003, 39, 261–273. [Google Scholar] [CrossRef]
  28. Kumar, K.; Dao, E.; Mohanty, K.K. AFM study of mineral wettability with reservoir oils. J. Coll. Interf. Sci. 2005, 289, 206–217. [Google Scholar] [CrossRef]
  29. Dickinson, L.R.; Suijkerbuijk, B.M.; Berg, S.; Marcelis, F.H.; Schniepp, H.C. Atomic force spectroscopy using colloidal tips functionalized with dried crude oil: A versatile tool to investigate oil-mineral interactions. Energy Fuels 2016, 30, 9193–9202. [Google Scholar] [CrossRef]
  30. Hassenkam, T.; Pedersen, C.S.; Dalby, K.; Austad, T.; Stipp, S.L.S. Pore scale observation of low salinity effects on outcrop and oil reservoir sandstone. Coll. Surf. A 2011, 390, 179–188. [Google Scholar] [CrossRef]
  31. Rücker, M.; Bartels, W.-B.; Garfi, G.; Shams, M.; Bultreys, T.; Boone, M.; Pieterse, S.; Maitland, G.C.; Krevor, S.; Cnudde, V.; et al. Relationship between wetting and capillary pressure in a crude oil/brine/rock system: From nano-scale to core-scale. J. Colloid. Interf. Sci. 2020, 562, 159–169. [Google Scholar] [CrossRef] [PubMed]
  32. Yesufu-Rufai, S.; Rücker, M.; Berg, S.; Lowe, S.F.; Marcelis, F.; Georgiadis, A.; Luckham, P. Assessing the wetting state of minerals in complex sandstone rock in-situ by atomic force microscopy (AFM). Fuel 2020, 273, 117807. [Google Scholar] [CrossRef]
  33. Allen, M.P.; Tildesley, D.J. Computer Simulation of Liquids, 2nd ed.; Oxford University Press: Oxford, UK, 2017. [Google Scholar]
  34. Palmer, J.C.; Debenedetti, P.G. Recent advances in molecular simulation: A chemical engineering perspective. AICHE J. 2015, 61, 370–383. [Google Scholar] [CrossRef]
  35. Tenney, C.M.; Cygan, R.T. Molecular simulation of carbon dioxide, brine, and clay mineral interactions and determination of contact angles. Environ. Sci. Tech. 2014, 48, 2035–2042. [Google Scholar] [CrossRef]
  36. Lundgren, M.; Allan, N.L.; Cosgrove, T. Modeling of wetting: A study of nanowetting at rough and heterogeneous surfaces. Langmuir 2007, 23, 1187–1194. [Google Scholar] [CrossRef]
  37. Khan, S.; Singh, J.K. Wetting transition of nanodroplets of water on textured surfaces: A molecular dynamics study. Mol. Simul. 2014, 40, 458–468. [Google Scholar] [CrossRef]
  38. Nakamura, Y.; Carlson, A.; Amberg, G.; Shiomi, J. Dynamic wetting at the nanoscale. Phys. Rev. E 2013, 88, 33010. [Google Scholar] [CrossRef]
  39. Yong, X.; Zhang, L.T. Nanoscale wetting on groove-patterned surfaces. Langmuir 2009, 25, 5045–5053. [Google Scholar] [CrossRef]
  40. Yaghoubi, H.; Foroutan, M. Molecular investigation of the wettability of rough surfaces using molecular dynamics simulation. Phys. Chem. Chem. Phys. 2018, 20, 22308–22319. [Google Scholar] [CrossRef]
  41. Park, J.Y.; Ha, M.Y.; Choi, H.J.; Hong, S.D.; Yoon, H.S. A study on the contact angles of a water droplet on smooth and rough solid surfaces. J. Mech. Sci. Tech. 2011, 25, 323. [Google Scholar] [CrossRef]
  42. Amadei, C.A.; Santos, S.; Pehkonen, S.O.; Verdaguer, A.; Chiesa, M. Minimal invasiveness and spectroscopy-like footprints for the characterization of heterogeneous nanoscale wetting in ambient conditions. J. Phys. Chem. C 2013, 117, 20819–20825. [Google Scholar] [CrossRef] [Green Version]
  43. Teppen, B.J.; Rasmussen, K.; Bertsch, P.M.; Miller, D.M.; Schäfer, L. Molecular dynamics modeling of clay minerals. 1. Gibbsite, kaolinite, pyrophyllite, and beidellite. J. Phys. Chem. B 1997, 101, 1579–1587. [Google Scholar] [CrossRef]
  44. Kalinichev, A.G.; Wang, J.; Kirkpatrick, R.J. Molecular dynamics modeling of the structure, dynamics and energetics of mineral–water interfaces: Application to cement materials. Cem. Concr. Res. 2007, 37, 337–347. [Google Scholar] [CrossRef]
  45. Iglauer, S.; Mathew, M.S.; Bresme, F. Molecular dynamics computations of brine-CO2 interfacial tensions and brine-CO2-quartz contact angles and their effects on structural and residual trapping mechanisms in carbon geo-sequestration. J. Coll. Interf. Sci. 2012, 386, 405–414. [Google Scholar] [CrossRef] [Green Version]
  46. Yiapanis, G.; Maclaughlin, S.; Evans, E.J.; Yarovsky, I. Nanoscale wetting and fouling resistance of functionalized surfaces: A computational approach. Langmuir 2014, 30, 10617–10625. [Google Scholar] [CrossRef] [PubMed]
  47. Brekke-Svaland, G.; Bresme, F. Interactions between hydrated calcium carbonate surfaces at nanoconfinement conditions. J. Phys. Chem. C 2018, 122, 7321–7330. [Google Scholar] [CrossRef]
  48. De Leeuw, N.H.; Parker, S.C. Surface structure and morphology of calcium carbonate polymorphs calcite, aragonite, and vaterite: An atomistic approach. J. Phys. Chem. B 1998, 102, 2914–2922. [Google Scholar] [CrossRef]
  49. Tribello, G.A.; Bruneval, F.; Liew, C.; Parrinello, M. A molecular dynamics study of the early stages of calcium carbonate growth. J. Phys. Chem. B 2009, 113, 11680–11687. [Google Scholar] [CrossRef]
  50. Bhushan, B.; Jung, Y.C. Micro-and nanoscale characterization of hydrophobic and hydrophilic leaf surfaces. Nanotechnology 2006, 17, 2758. [Google Scholar] [CrossRef]
  51. Nosonovsky, M. Multiscale roughness and stability of superhydrophobic biomimetic interfaces. Langmuir 2007, 23, 3157–3161. [Google Scholar] [CrossRef]
  52. Becker, S.; Urbassek, H.M.; Horsch, M.; Hasse, H. Contact angle of sessile drops in Lennard-Jones systems. Langmuir 2014, 30, 13606–13614. [Google Scholar] [CrossRef] [PubMed] [Green Version]
  53. Law, B.M.; McBride, S.P.; Wang, J.Y.; Wie, H.S.; Paneru, G.; Betelu, S.; Ushijima, B.; Takata, Y.; Flanders, B.; Bresme, F. Line tension and its influence on droplets and particles at surfaces. Progr. Surf. Sci. 2017, 92, 1–39. [Google Scholar] [CrossRef]
  54. Swain, P.S.; Lipowsky, R. Contact angles on heterogeneous surfaces: A new look at Cassie’s and Wenzel’s laws. Langmuir 1998, 14, 6772–6780. [Google Scholar] [CrossRef] [Green Version]
  55. Santiso, E.E.; Herdes, C.; Müller, E.A. On the calculation of solid-fluid contact angles from molecular dynamics. Entropy 2013, 15, 3734–3745. [Google Scholar] [CrossRef] [Green Version]
  56. Theodorakis, P.E.; Müller, E.A.; Craster, R.V.; Matar, O.K. Modelling the superspreading of surfactant-laden droplets with computer simulation. Soft Matter 2015, 11, 9254–9261. [Google Scholar] [CrossRef] [Green Version]
  57. Wenzel, R.N. Surface roughness and contact angle. J. Phys. Chem. 1949, 53, 1466–1467. [Google Scholar] [CrossRef]
  58. Wenzel, R.N. Resistance of solid surfaces to wetting by water. Ind. Eng. Chem. 1936, 28, 988–994. [Google Scholar] [CrossRef]
  59. Cassie, A.B.D.; Baxter, S. Wettability of porous surfaces. Trans. Faraday Soc. 1944, 40, 546–551. [Google Scholar] [CrossRef]
  60. Cassie, A.B.D. Contact angles. Discuss. Faraday Soc. 1948, 3, 11–16. [Google Scholar] [CrossRef]
  61. Checco, A.; Guenoun, P.; Daillant, J. Nonlinear dependence of the contact angle of nanodroplets on contact line curvature. Phys. Rev. Lett. 2003, 91, 186101. [Google Scholar] [CrossRef] [Green Version]
  62. Škvára, J.; Škvor, J.; Nezbeda, I. Evaluation of the contact angle from molecular simulations. Mol. Simul. 2018, 44, 190–199. [Google Scholar] [CrossRef]
  63. Giro, R.; Bryant, P.W.; Engel, M.; Neumann, R.F.; Steiner, M.B. Adsorption energy as a metric for wettability at the nanoscale. Sci. Rep. 2017, 7, 46317. [Google Scholar] [CrossRef] [PubMed] [Green Version]
  64. Wu, D.; Wang, P.; Wu, P.; Yang, Q.; Liu, F.; Han, Y.; Xu, F.; Wang, L. Determination of contact angle of droplet on convex and concave spherical surfaces. Chem. Phys. 2015, 457, 63–69. [Google Scholar] [CrossRef]
  65. Leroy, F.; Müller-Plathe, F. Solid-liquid surface free energy of Lennard-Jones liquid on smooth and rough surfaces computed by molecular dynamics using the phantom-wall method. J. Chem. Phys. 2010, 13, 3044110. [Google Scholar] [CrossRef]
  66. Saville, G. Computer simulation of the liquid-solid-vapour contact angle. J. Chem. Soc. Faraday Trans. 2 1977, 73, 1122–1132. [Google Scholar] [CrossRef]
  67. Andrew, M. Reservoir-Condition Pore-Scale Imaging of Multiphase Flow. Ph.D. Thesis, Imperial College, London, UK, 2014. [Google Scholar]
  68. Hudson, J.D.; Clements, R.G. The middle Jurassic succession at Ketton, Rutland. Proc. Geol. Assoc. 2007, 118, 239–264. [Google Scholar] [CrossRef]
  69. Flügel, E. Microfacies of Carbonate Rocks: Analysis, Interpretation and Application; Springer: Berlin/Heidelberg, Germany, 2013. [Google Scholar]
  70. Andrew, M.; Bijeljic, B.; Blunt, M.J. Pore-scale contact angle measurements at reservoir conditions using X-ray microtomography. Adv. Water Resour. 2014, 68, 24–31. [Google Scholar] [CrossRef] [Green Version]
  71. Singh, K.; Bijeljic, B.; Blunt, M.J. Imaging of oil layers, curvature and contact angle in a mixed-wet and a water-wet carbonate rock. Water Resour. Res. 2016, 52, 1716–1728. [Google Scholar] [CrossRef] [Green Version]
  72. Rücker, M.; Bartels, W.B.; Singh, K.; Brussee, N.; Coorn, A.; van der Linde, H.A.; Bonnin, A.; Ott, H.; Hassanizadeh, S.M.; Blunt, M.J.; et al. The effect of mixed wettability on pore-scale flow regimes based on a flooding experiment in Ketton limestone. Geophys. Res. Lett. 2019, 46, 3225–3234. [Google Scholar] [CrossRef] [Green Version]
  73. Okrusch, M. Minralogy: An Introduction to Minerals, Rocks, and Mineral Deposits; Springer: Berlin/Heidelberg, Germany, 2018. [Google Scholar]
  74. Ramrattan, N.S.; Avendaño, C.; Müller, E.A.; Galindo, A. A corresponding-states framework for the description of the Mie family of intermolecular potentials. Mol. Phys. 2015, 113, 932–947. [Google Scholar] [CrossRef] [Green Version]
  75. Lafitte, T.; Apostolakou, A.; Avendaño, C.; Galindo, A.; Adjiman, C.S.; Müller, E.A.; Jackson, G. Accurate statistical associating fluid theory for chain molecules formed from Mie segments. J. Chem. Phys. 2013, 139, 154504. [Google Scholar] [CrossRef] [PubMed]
  76. Avendaño, C.; Lafitte, T.; Galindo, A.; Adjiman, C.S.; Jackson, G.; Müller, E.A. SAFT-γ force field for the simulation of molecular fluids. 1. A single-site coarse grained model of carbon dioxide. J. Phys. Chem. B 2011, 115, 11154–11169. [Google Scholar]
  77. Avendaño, C.; Lafitte, T.; Adjiman, C.S.; Galindo, A.; Müller, E.A.; Jackson, G. SAFT-γ force field for the simulation of molecular fluids: 2. Coarse-grained models of greenhouse gases, refrigerants, and long alkanes. J. Phys. Chem. B 2013, 117, 2717–2733. [Google Scholar]
  78. Lafitte, T.; Avendaño, C.; Papaioannou, V.; Galindo, A.; Adjiman, C.S.; Jackson, G.; Müller, E.A. SAFT-γ force field for the simulation of molecular fluids: 3. Coarse-grained models of benzene and hetero-group models of n-decylbenzene. Mol. Phys. 2012, 110, 1189–1203. [Google Scholar] [CrossRef]
  79. Müller, E.A.; Jackson, G. Force-field parameters from the SAFT-γ equation of state for use in coarse-grained molecular simulations. Annu. Rev. Chem. Biomolec. Eng. 2014, 5, 405–427. [Google Scholar] [CrossRef]
  80. Mejía, A.; Herdes, C.; Müller, E.A. Force fields for coarse-grained molecular simulations from a corresponding states correlation. Ind. Eng. Chem. Res. 2014, 53, 4131–4141. [Google Scholar] [CrossRef]
  81. Jiménez-Serratos, G.; Totton, T.S.; Jackson, G.; Müller, E.A. Aggregation behavior of model asphaltenes revealed from large-scale coarse-grained molecular simulations. J. Phys. Chem. B 2019, 123, 2380–2396. [Google Scholar] [CrossRef]
  82. Herdes, C.; Totton, T.S.; Müller, E.A. Coarse grained force field for the molecular simulation of natural gases and condensates. Fluid Phase Equilib. 2015, 406, 91–100. [Google Scholar] [CrossRef]
  83. Herdes, C.; Petit, C.; Mejía, A.; Müller, E.A. Combined experimental, theoretical, and molecular simulation approach for the description of the fluid-phase behavior of hydrocarbon mixtures within shale rocks. Energy Fuels 2018, 32, 5750–5762. [Google Scholar] [CrossRef] [Green Version]
  84. Herdes, C.; Ervik, Å.; Mejía, A.; Müller, E.A. Prediction of the water/oil interfacial tension from molecular simulations using the coarse-grained SAFT-γ Mie force field. Fluid Phase Equilib. 2018, 476, 9–15. [Google Scholar] [CrossRef] [Green Version]
  85. Herdes, C.; Forte, E.; Jackson, G.; Müller, E.A. Predicting the adsorption of n-perfluorohexane in BAM-P109 standard activated carbon by molecular simulation using SAFT-γ Mie coarse-grained force fields. Adsorpt. Sci. Tech. 2016, 34, 64–78. [Google Scholar] [CrossRef] [Green Version]
  86. Theodorakis, P.E.; Müller, E.A.; Craster, R.V.; Matar, O.K. Superspreading: Mechanisms and molecular design. Langmuir 2015, 31, 2304–2309. [Google Scholar] [CrossRef] [PubMed] [Green Version]
  87. Rahman, S.; Lobanova, O.; Jiménez-Serratos, G.; Braga, C.; Raptis, V.; Müller, E.A.; Jackson, G.; Avendaño, C.; Galindo, A. SAFT-γ force field for the simulation of molecular fluids. 5. Hetero-group coarse-grained models of linear alkanes and the importance of intramolecular interactions. J. Phys. Chem. B 2018, 122, 9161–9177. [Google Scholar] [CrossRef] [PubMed]
  88. Forte, E.; Haslam, A.J.; Jackson, G.; Müller, E.A. Effective coarse-grained solid-fluid potentials and their application to model adsorption of fluids on heterogeneous surfaces. Phys. Chem. Chem. Phys. 2014, 16, 19165–19180. [Google Scholar] [CrossRef]
  89. Jiménez-Serratos, G.; Cárdenas, H.; Müller, E.A. Extension of the effective solid-fluid Steele potential for Mie force fields. Mol. Phys. 2019, 117, 3840–3851. [Google Scholar] [CrossRef]
  90. Hess, B.; Kutzner, C.; Van Der Spoel, D.; Lindahl, E. GROMACS 4: Algorithms for highly efficient, load-balanced, and scalable molecular simulation. J. Chem. Theory Comp. 2008, 4, 435–447. [Google Scholar] [CrossRef] [Green Version]
  91. Jover, J.; Haslam, A.J.; Galindo, A.; Jackson, G.; Müller, E.A. Pseudo hard-sphere potential for use in continuous molecular-dynamics simulation of spherical and chain molecules. J. Chem. Phys. 2012, 137, 144505. [Google Scholar] [CrossRef]
  92. Jennings, A. Least-Squared Sphere Fit (Software), Matlab Central 2013. Available online: https://www.mathworks.com/matlabcentral/fileexchange/34129-sphere-fit-least-squared (accessed on 6 March 2020).
  93. Peng, H.; Nguyen, A.V.; Birkett, G.R. Determination of contact angle by molecular simulation using number and atomic density contours. Mol. Sim. 2012, 38, 945–952. [Google Scholar] [CrossRef]
  94. Sumith, Y.D. An efficient algorithm for contact angle estimation in molecular dynamics simulations. Int. J. Eng. 2015, 9, 1–8. [Google Scholar]
  95. Scocchi, G.; Sergi, D.; D’Angelo, C.; Ortona, A. Wetting and contact-line effects for spherical and cylindrical droplets on graphene layers: A comparative molecular-dynamics investigation. Phys. Rev. E 2011, 84, 61602. [Google Scholar] [CrossRef] [Green Version]
  96. Bresme, F.; Oettel, M. Nanoparticles at fluid interfaces. J. Phys. Condens. Matt. 2007, 19, 413101. [Google Scholar] [CrossRef] [PubMed]
  97. Whyman, G.; Bormashenko, E.; Stein, T. The rigorous derivation of young, Cassie-Baxter and Wenzel equations and the analysis of the contact angle hysteresis phenomenon. Chem. Phys. Lett. 2008, 450, 355–359. [Google Scholar] [CrossRef]
  98. Scanziani, A.; Singh, K.; Blunt, M.J.; Guadagnini, A. Automatic method for estimation of in situ effective contact angle from X-ray micro tomography images of two-phase flow in porous media. J. Colloid Interf. Sci. 2017, 496, 51–59. [Google Scholar] [CrossRef] [PubMed]
  99. Koishi, T.; Yasuoka, K.; Fujikawa, S.; Ebisuzaki, T.; Cheng, X. Coexistence and transition between Cassie and Wenzel state on pillared hydrophobic surface. Proc. Natl. Acad. Sci. USA 2009, 206, 8435–8440. [Google Scholar] [CrossRef] [Green Version]
  100. Koishi, T.; Yasuoka, K.; Zeng, X.C. Molecular dynamics simulation of water nanodroplet bounce back from flat and nanopillared surface. Langmuir 2017, 33, 10184–10192. [Google Scholar] [CrossRef]
  101. Hiratsuka, M.; Emoto, M.; Konno, A.; Ito, S. Molecular dynamics simulation of the influence of the nanoscale structure on water wetting and condensation. Micromachines 2019, 10, 587. [Google Scholar] [CrossRef] [Green Version]
  102. Song, F.; Ma, L.; Fan, J.; Chen, Q.; Zhang, L.; Li, B.Q. Wetting behaviors of a nano-droplet on a rough solid substrate under perpendicular electric field. Nanomaterials 2018, 8, 340. [Google Scholar] [CrossRef] [Green Version]
  103. Smith, E.R.; Müller, E.A.; Craster, R.V.; Matar, O.K. A Langevin model for fluctuating contact angle behaviour parametrised using molecular dynamics. Soft Matter 2016, 12, 9604–9615. [Google Scholar] [CrossRef] [Green Version]
  104. Sun, C.; McClure, J.E.; Mostaghimi, P.; Herring, A.L.; Berg, S.; Armstrong, R.T. Probing effective wetting in subsurface systems. Geophys. Res. Lett. 2020, 4, e2019GL086151. [Google Scholar] [CrossRef]
  105. Svoboda, M.; Malijevsky, A.; Lísal, M. Wetting properties of molecularly rough surfaces. J. Chem. Phys. 2015, 143, 104701. [Google Scholar] [CrossRef]
  106. Kumar, V.; Sridhar, S.; Errington, J.R. Monte Carlo simulation strategies for computing the wetting properties of fluids at geometrically rough surfaces. J. Chem. Phys. 2011, 135, 184702. [Google Scholar] [CrossRef] [PubMed]
Figure 1. (a) 512 × 512 pixel AFM scan of the Ketton carbonate sample with a pixel size of 0.943 nm; (b) shows a heatmap of the scan (a) interpolated twice into 2048 × 2048 grid cells or interpolated pixels, each grid cell has a side length of 0.236 nm; (c) is a zoomed version of region A. Region A contains 96 × 96 interpolated pixels, translating to an area of 22.656 nm × 22.656 nm. The color bar represents the elevation in nm in the z-axis.
Energies 13 02770 g001
Figure 2. Construction of the surface model with natural Ketton topography. (a) Illustrates how the beads are arranged into a surface with a face-centered cubic (FCC) structure over a 6 × 6 grid. The top image shows the arrangement viewing from the top of the surface, and a side view of the unit cell is placed below. The diameter of all beads is 0.33 nm. (b) Model surface constructed over the 96 × 96 selected grids; the elevation at each grid point is based on AFM measurements, given in Figure 1c. The color of the beads indicates their elevations in the z-direction.
Energies 13 02770 g002
Figure 3. Examples of four (ad) sinusoidal surfaces with a 4-nm amplitude and wavelength (Λ) from 1.416 nm to infinity. These surfaces have the same base area as the surface in Figure 2b. The wavelength range includes the wavelengths of Figure 2b characterized using Fourier transform. The color of the beads indicates their elevations (in nm) in the z-direction. Other examples are provided in the Supplementary Material.
Energies 13 02770 g003aEnergies 13 02770 g003b
Figure 4. Simulation box set-up (blue) where a flat surface structure SS_0 is used as an example. n-decane molecules (yellow) are initially placed in a cubic arrangement (not shown) in the middle of the simulation box, between the solid surface structure (red) and the top repulsive barrier (green). During the simulation, the fluid forms a drop and adsorbs on the surface, equilibrating in the form of a droplet. The surface thickness and the space above the barrier is designed to be greater than the 2-nm potential cut-off to prevent interactions between periodic images.
Energies 13 02770 g004
Figure 5. Least-squared spherical fitting over a density image generated by segmenting the simulation box into 80 × 80 × 80 cube voxels and classifying the voxels with more than 5 fluid particles per nm3 as fluid filled. A Gaussian filter is used to smooth the image and a median filter is applied to remove the isolated fluid voxels. The contact angle is measured within the fluid phase, between the fitted sphere and the effective flat surface.
Energies 13 02770 g005
Figure 6. Fluid droplet contact angle (a) and curvature on a flat surface (b) as a function of the number of fluid molecules. Dashed lines are used to guide the eye.
Energies 13 02770 g006
Figure 7. Contact angles and curvatures of the fluid droplet formed over model surfaces. The surfaces that are tested include eight surfaces of various sinusoidal wavelengths (Table 1) and one surface having the roughness of a Ketton rock. Three simulations were performed over each type of surface in which the droplet lands at different (x, y) locations on the surface. The (a) average contact angle and (b) curvature for each sinusoidal surface are plotted with black dots; the uncertainty associated with the data points are indicated with black error bars. These data points are benchmarked against the case when the surface topology resembles that of the Ketton surface, which is shown in orange squares and labeled with SS_E. The corresponding error span is also plotted in orange. Dashed lines are used to guide the eye.
Energies 13 02770 g007
Figure 8. Contact angle distribution as a function of the droplet to surface scale ratio. The results correspond to eight surfaces of various sinusoidal wavelengths, which are plotted with black dots. The span over the surface with Ketton roughness is shown in the orange square. These data points are fit to a Gaussian function (dashed lines), which is drawn as a guide to the eye.
Energies 13 02770 g008
Figure 9. Longitudinal section of an equilibrated configuration showing how the fluid fills the gaps between asperities on surfaces. Presented surfaces include the sinusoidal surrogates with wavelengths (Λ) of (a) 1.416, (b) 2.382, and (c) 5.664 nm, and (d) the surface with Ketton topography. The different fluid configurations indicate a transition from the Cassie–Baxter state to the Wenzel state. The color of the beads indicates their elevations (in nm) in the z-direction.
Energies 13 02770 g009
Figure 10. Contact angles of the fluid droplet formed over model surfaces of various sinusoidal wavelengths (Table 1). The black dots are data from the simulations while the gray square shows the prediction of the Wenzel model (Equation (6)) using the modeled contact angle on the flat surface SS_0 as the equilibrium contact angle θ 0 . Lines connecting the data points are used to guide to the eye.
Energies 13 02770 g010
Table 1. Roughness factor R and measured contact angle (°) of the model surfaces. SS_0 to SS_16 represent surfaces having 0 to 16 sinusoidal waves (c.f. Figure 3). SS_E represents the surface reproducing the Ketton topography (Figure 2b).
SurfaceΛ/nmRθ
SS_0 (flat)1.00(97 ± 1)°
SS_122.6561.07(100 ± 24)°
SS_211.3281.26(100 ± 15)°
SS_37.5521.51(120 ± 10)°
SS_45.6641.80(121 ± 17)°
SS_63.7762.40(126 ± 2)°
SS_82.3823.00(128 ± 1)°
SS_161.4165.00(160 ± 1)°
SS_E5.66, 7.551.74(116 ± 9)°
Table 2. SAFT CG force field parameters for fluid–fluid and solid–fluid interactions, kB is Boltzmann’s constant.
Intermolecular Parameters
Interactionσ/nm(ε/kB)/Kλm
fluid–fluid0.4584415.1920.923
fluid–solid0.395712515.701
Intramolecular Parameters
Componentkangle/(kJ·mol−1·rad−2) θ 0 kbond/(kJ·mol−1·nm−2) r 0 /nm
fluid22.18157.6°6309.50.4584