Economic Assessment of Distributed Generation Technologies: A Feasibility Study and Comparison with the Literature

 ,
,
Abstract
1. Introduction
2. Research Gaps and Contribution
3. The Current Indian Scenario
4. Basic Assumptions in Funding a Project
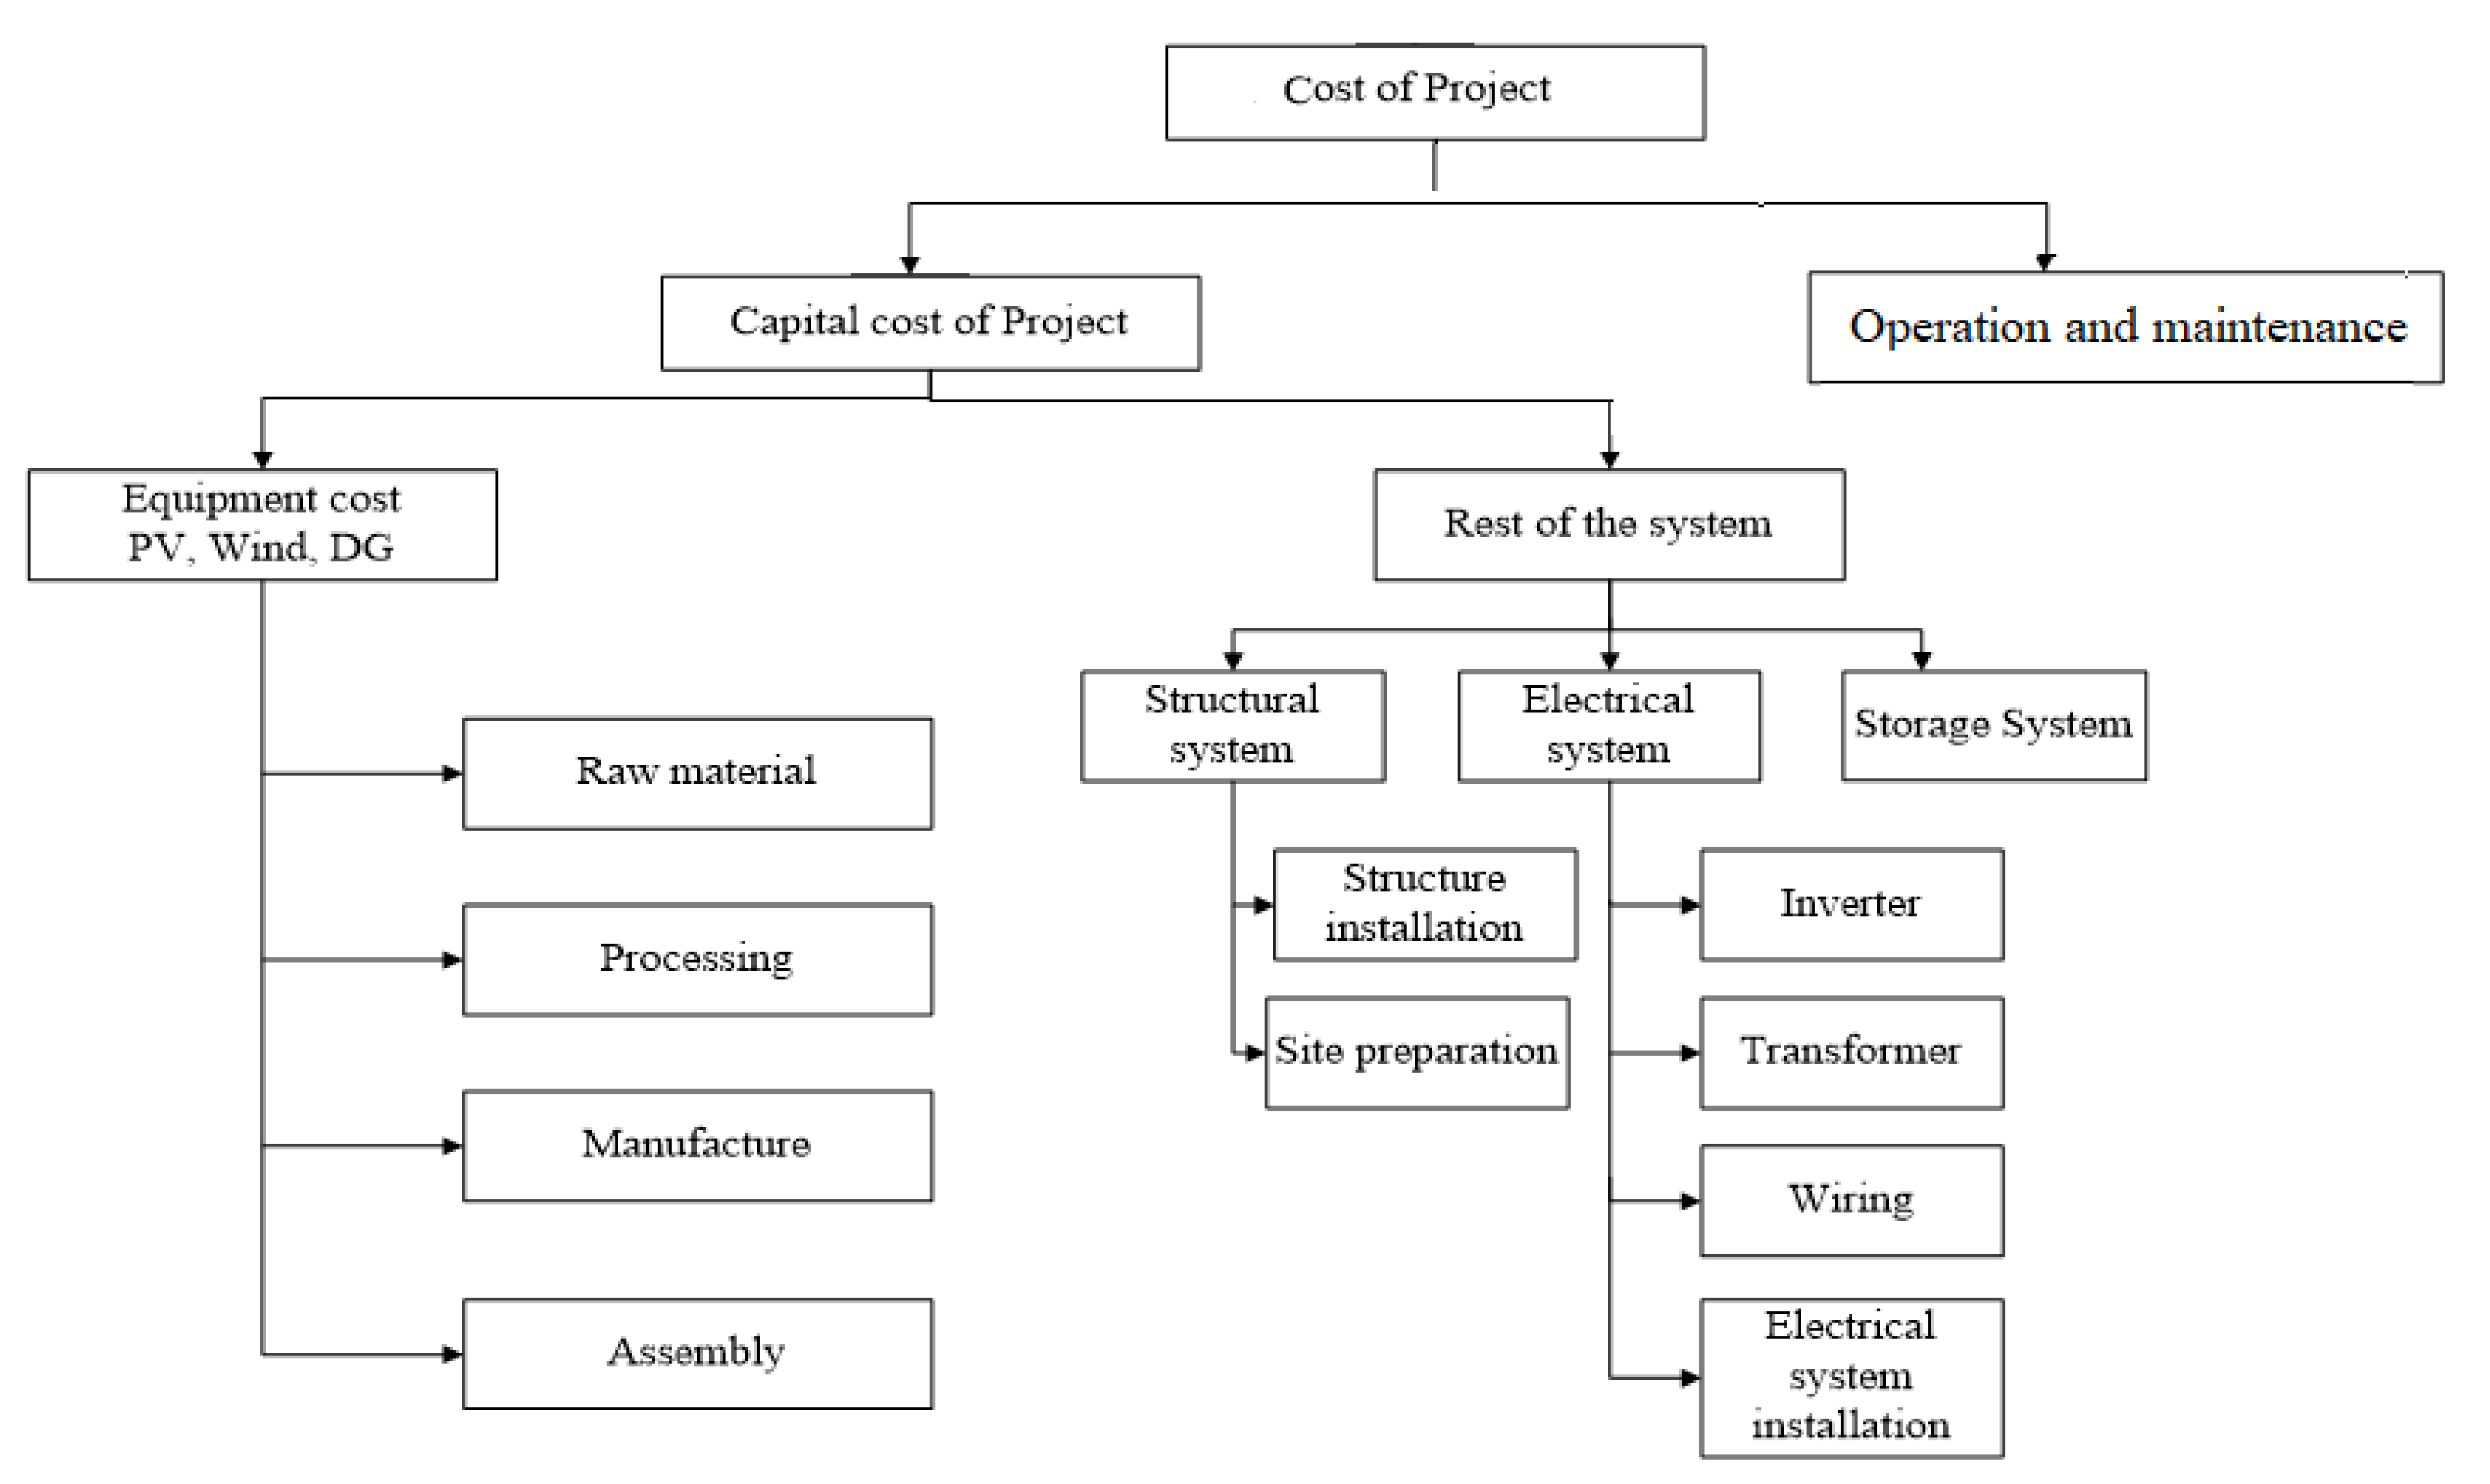
5. Project Associated Costs
6. Factors Governing Cash Flow
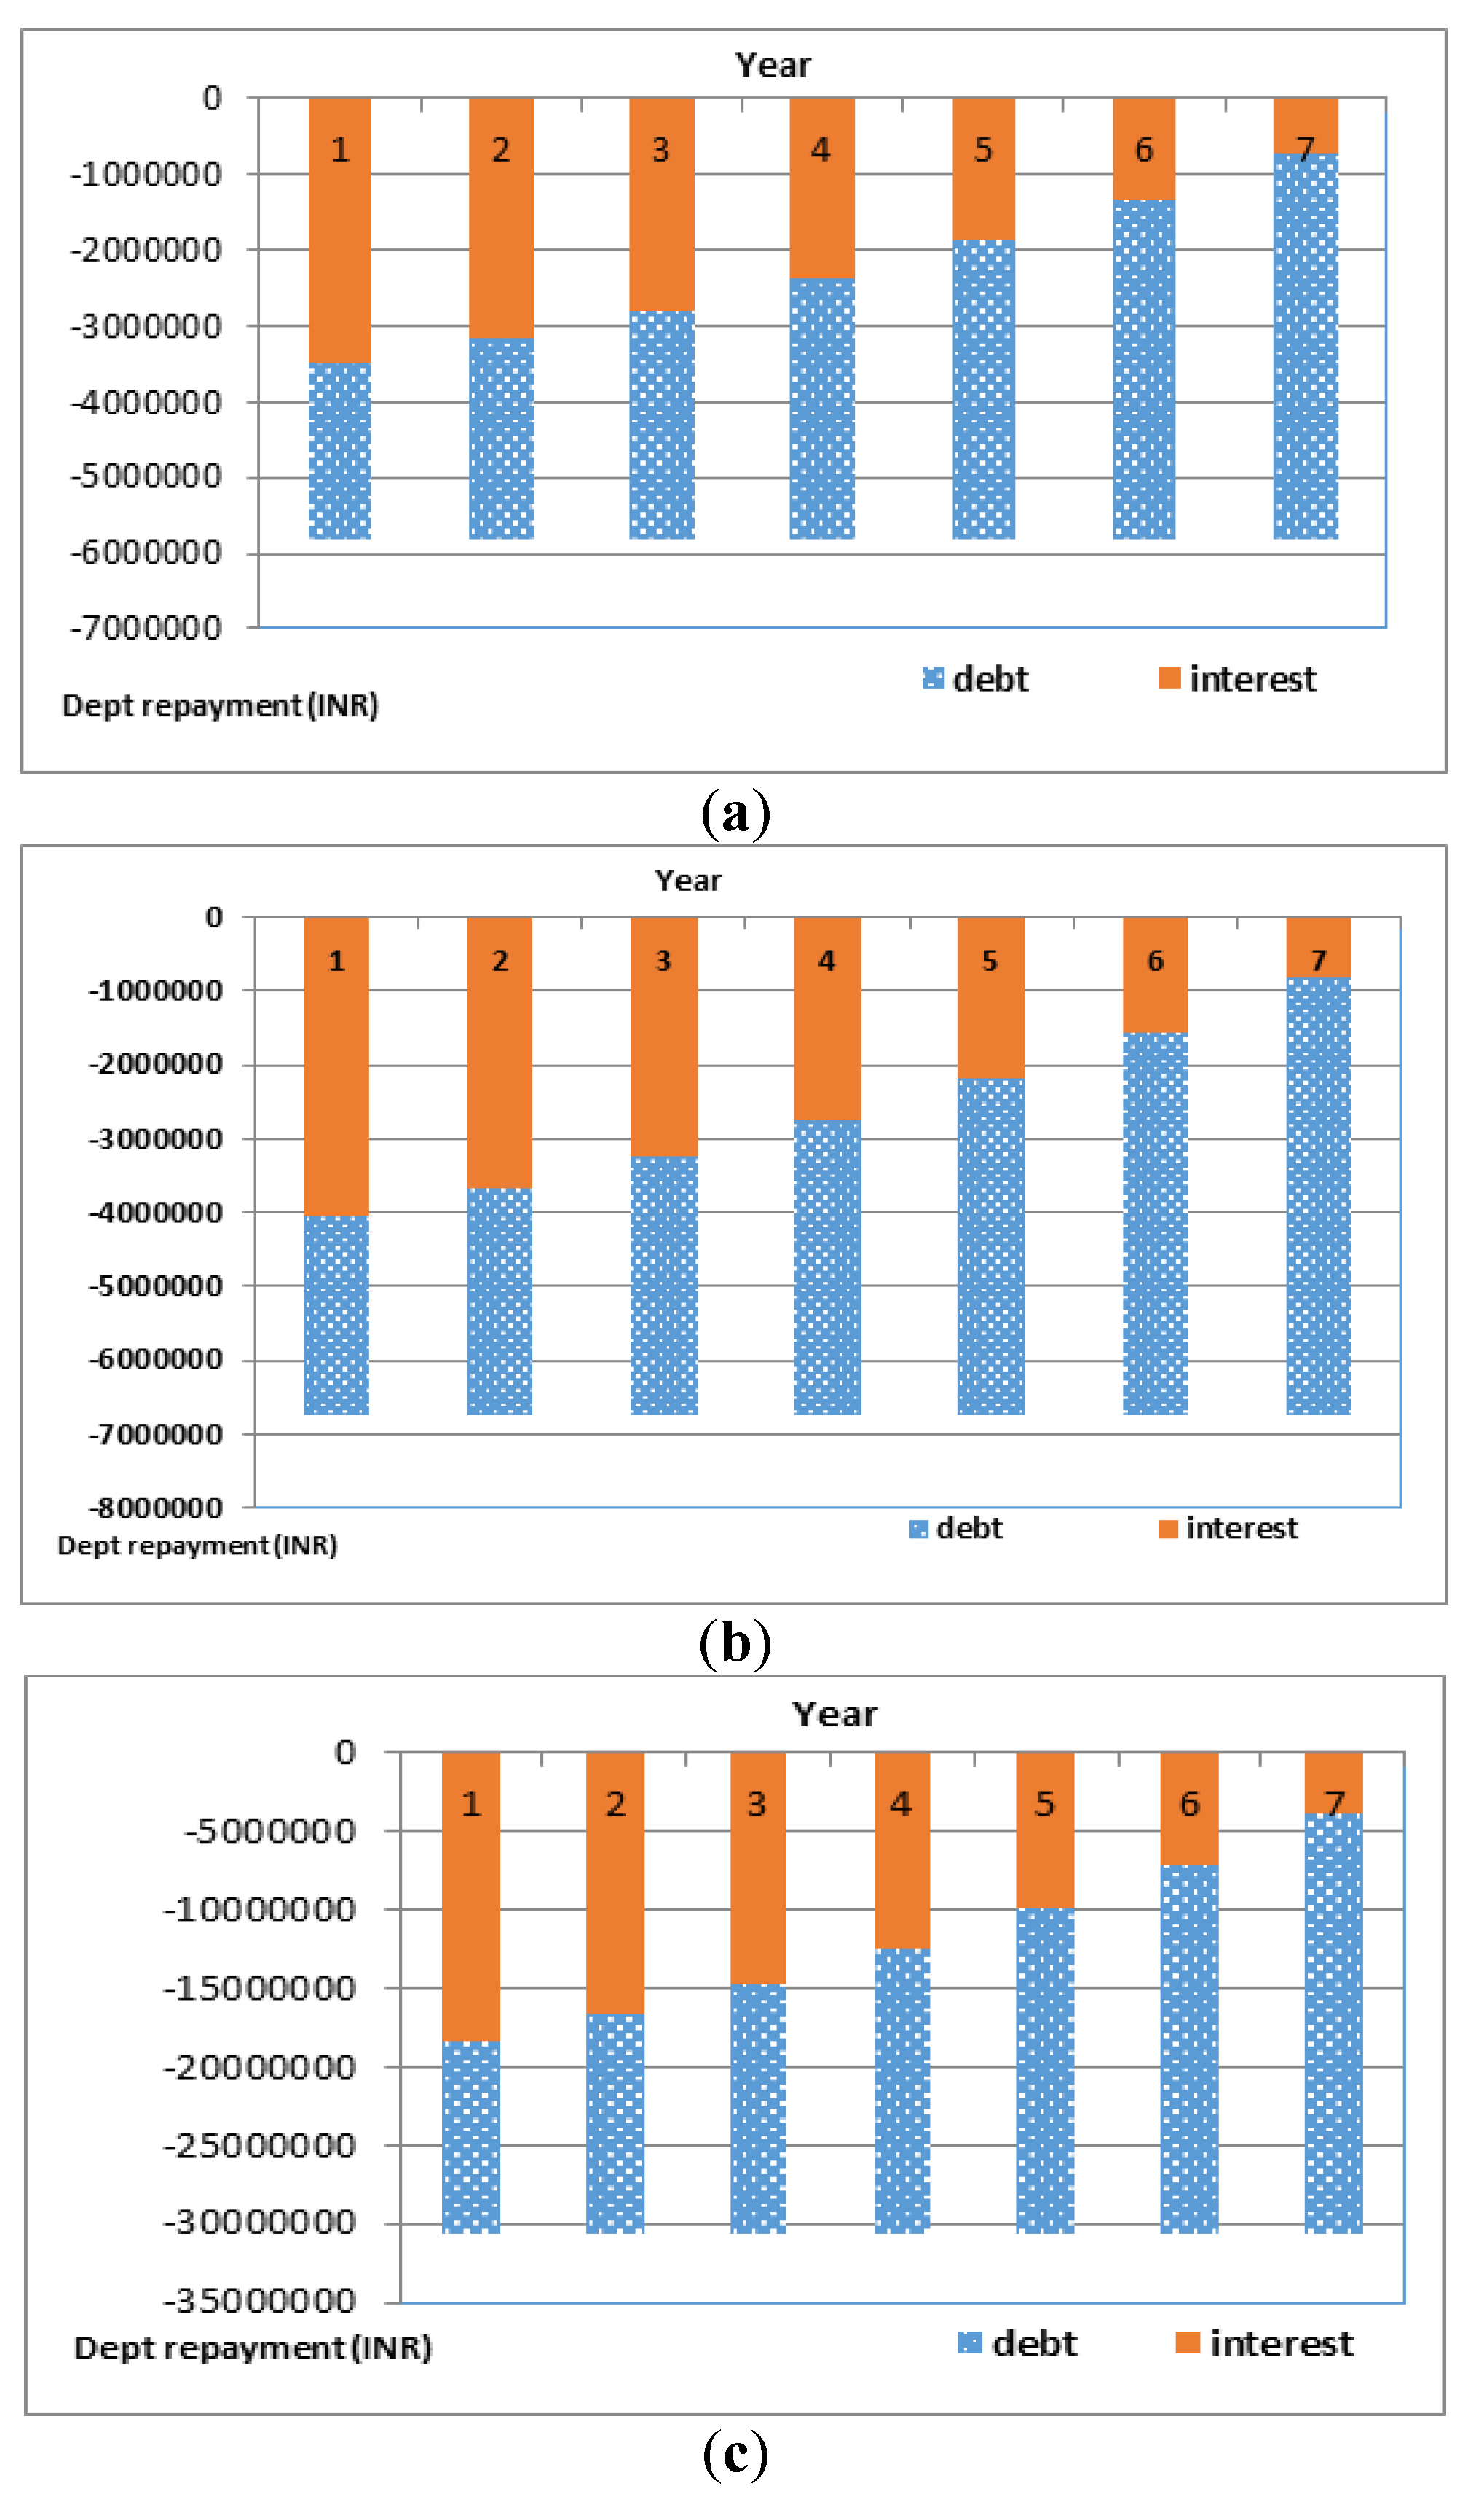
6.1. Dept Repayment
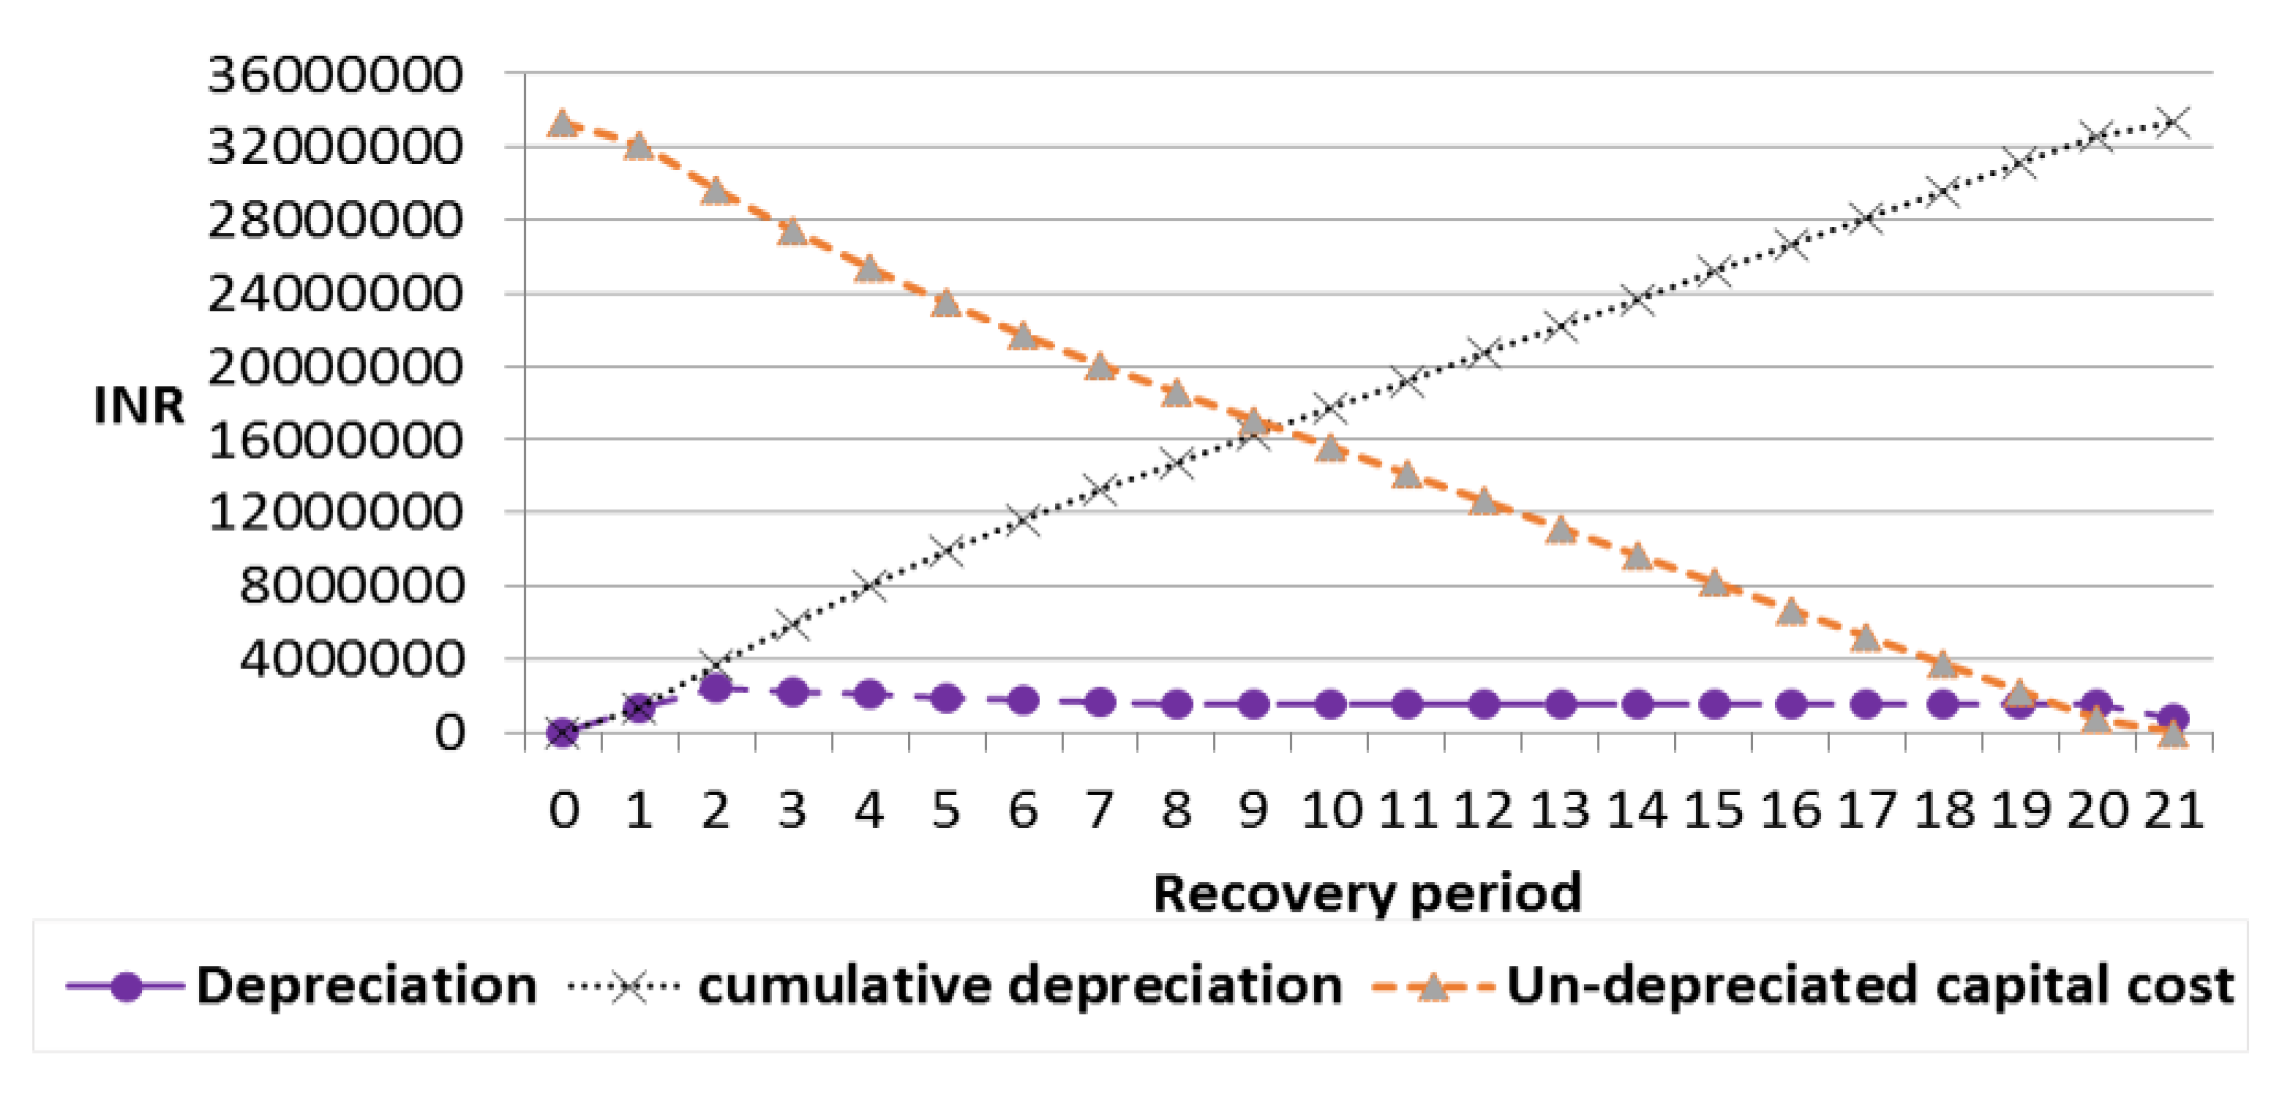
6.2. Project Depreciation
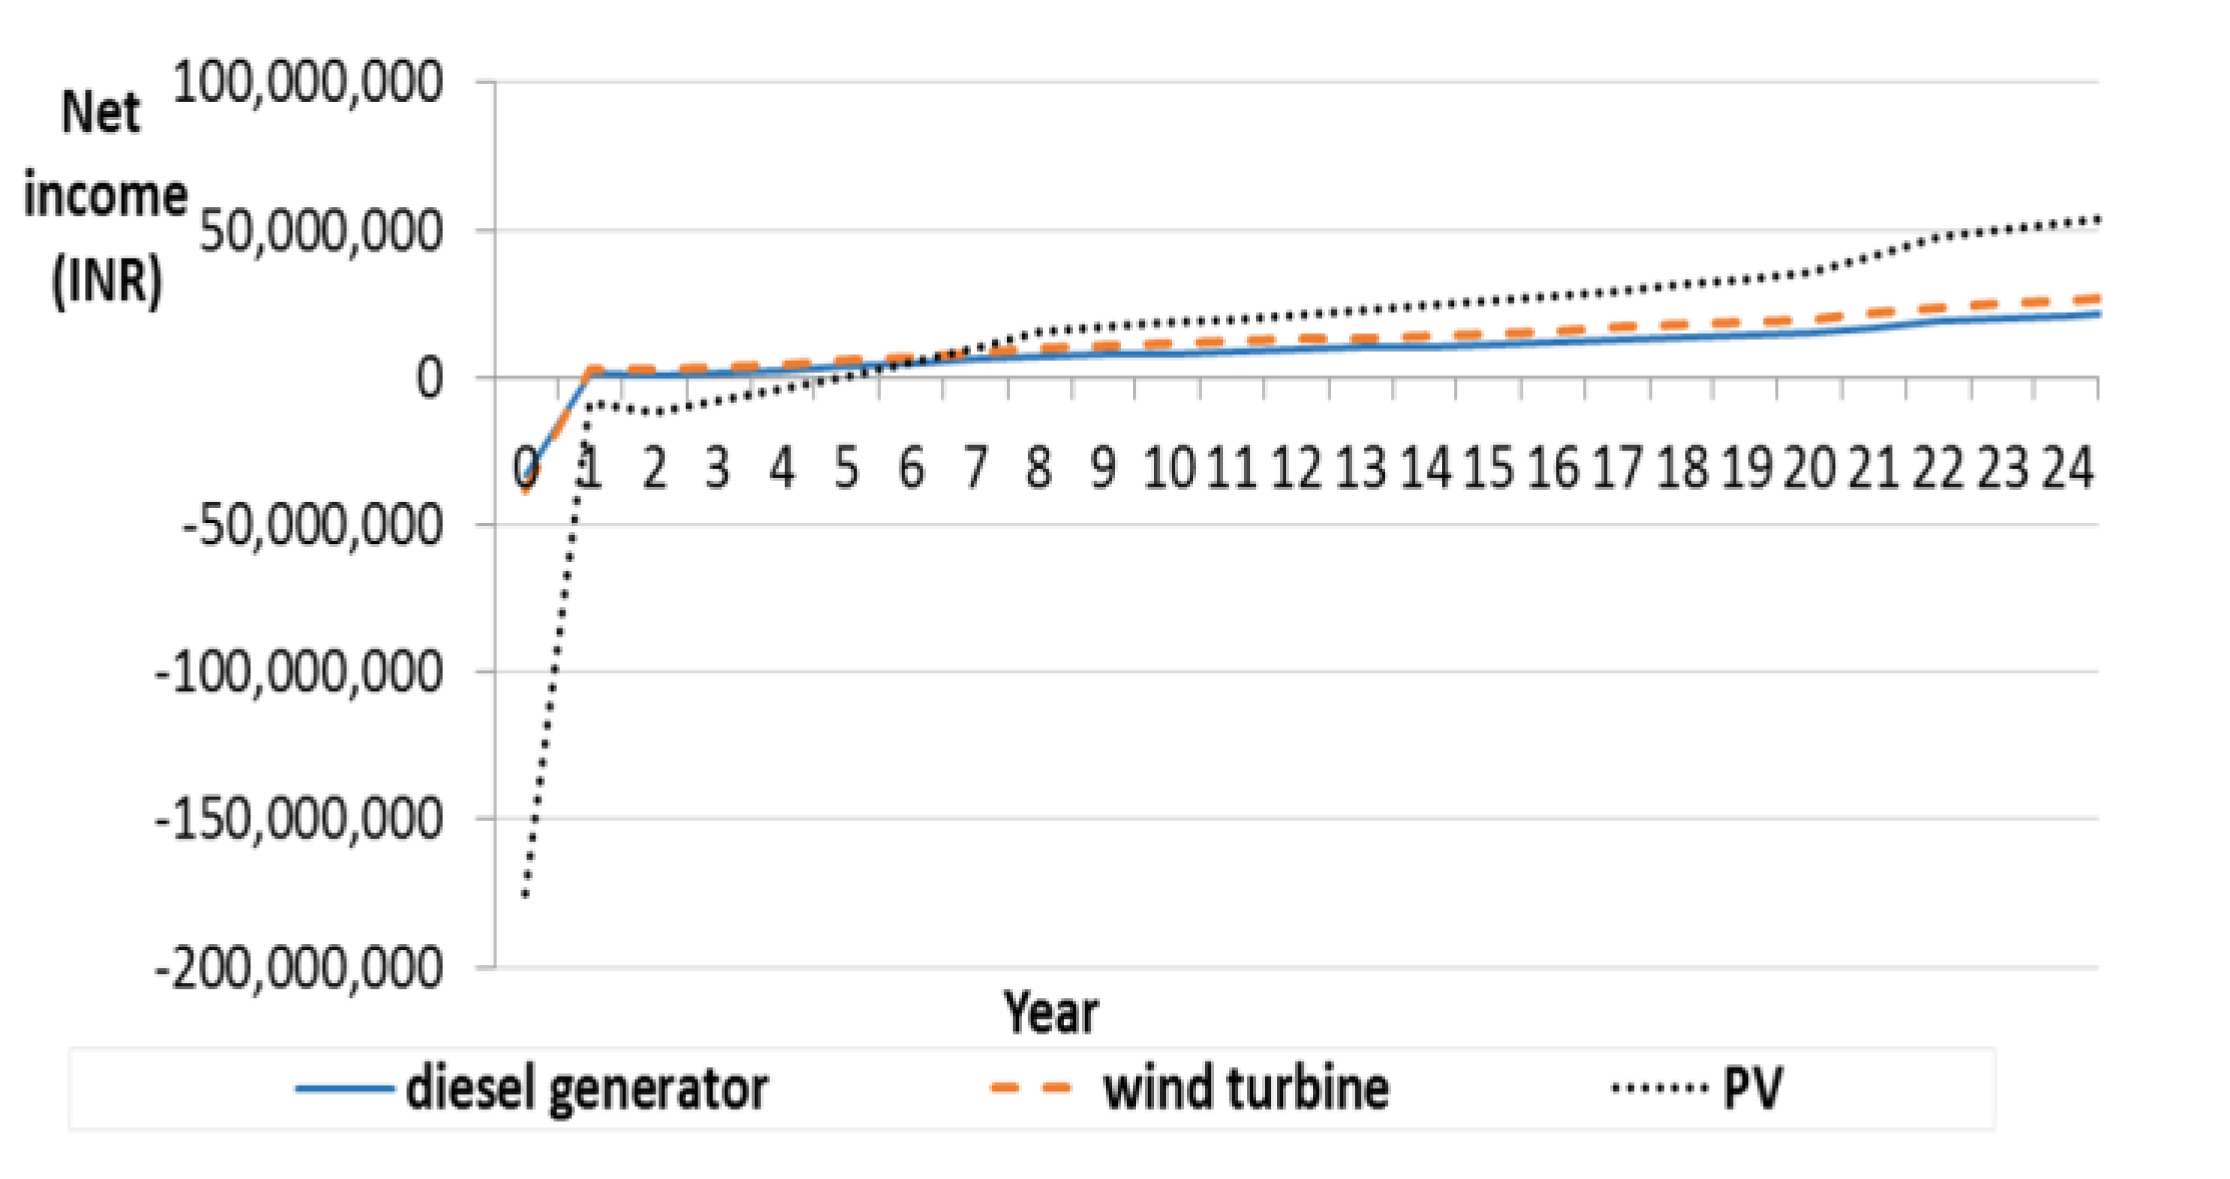
6.3. Cash Flow for Incremental Analysis
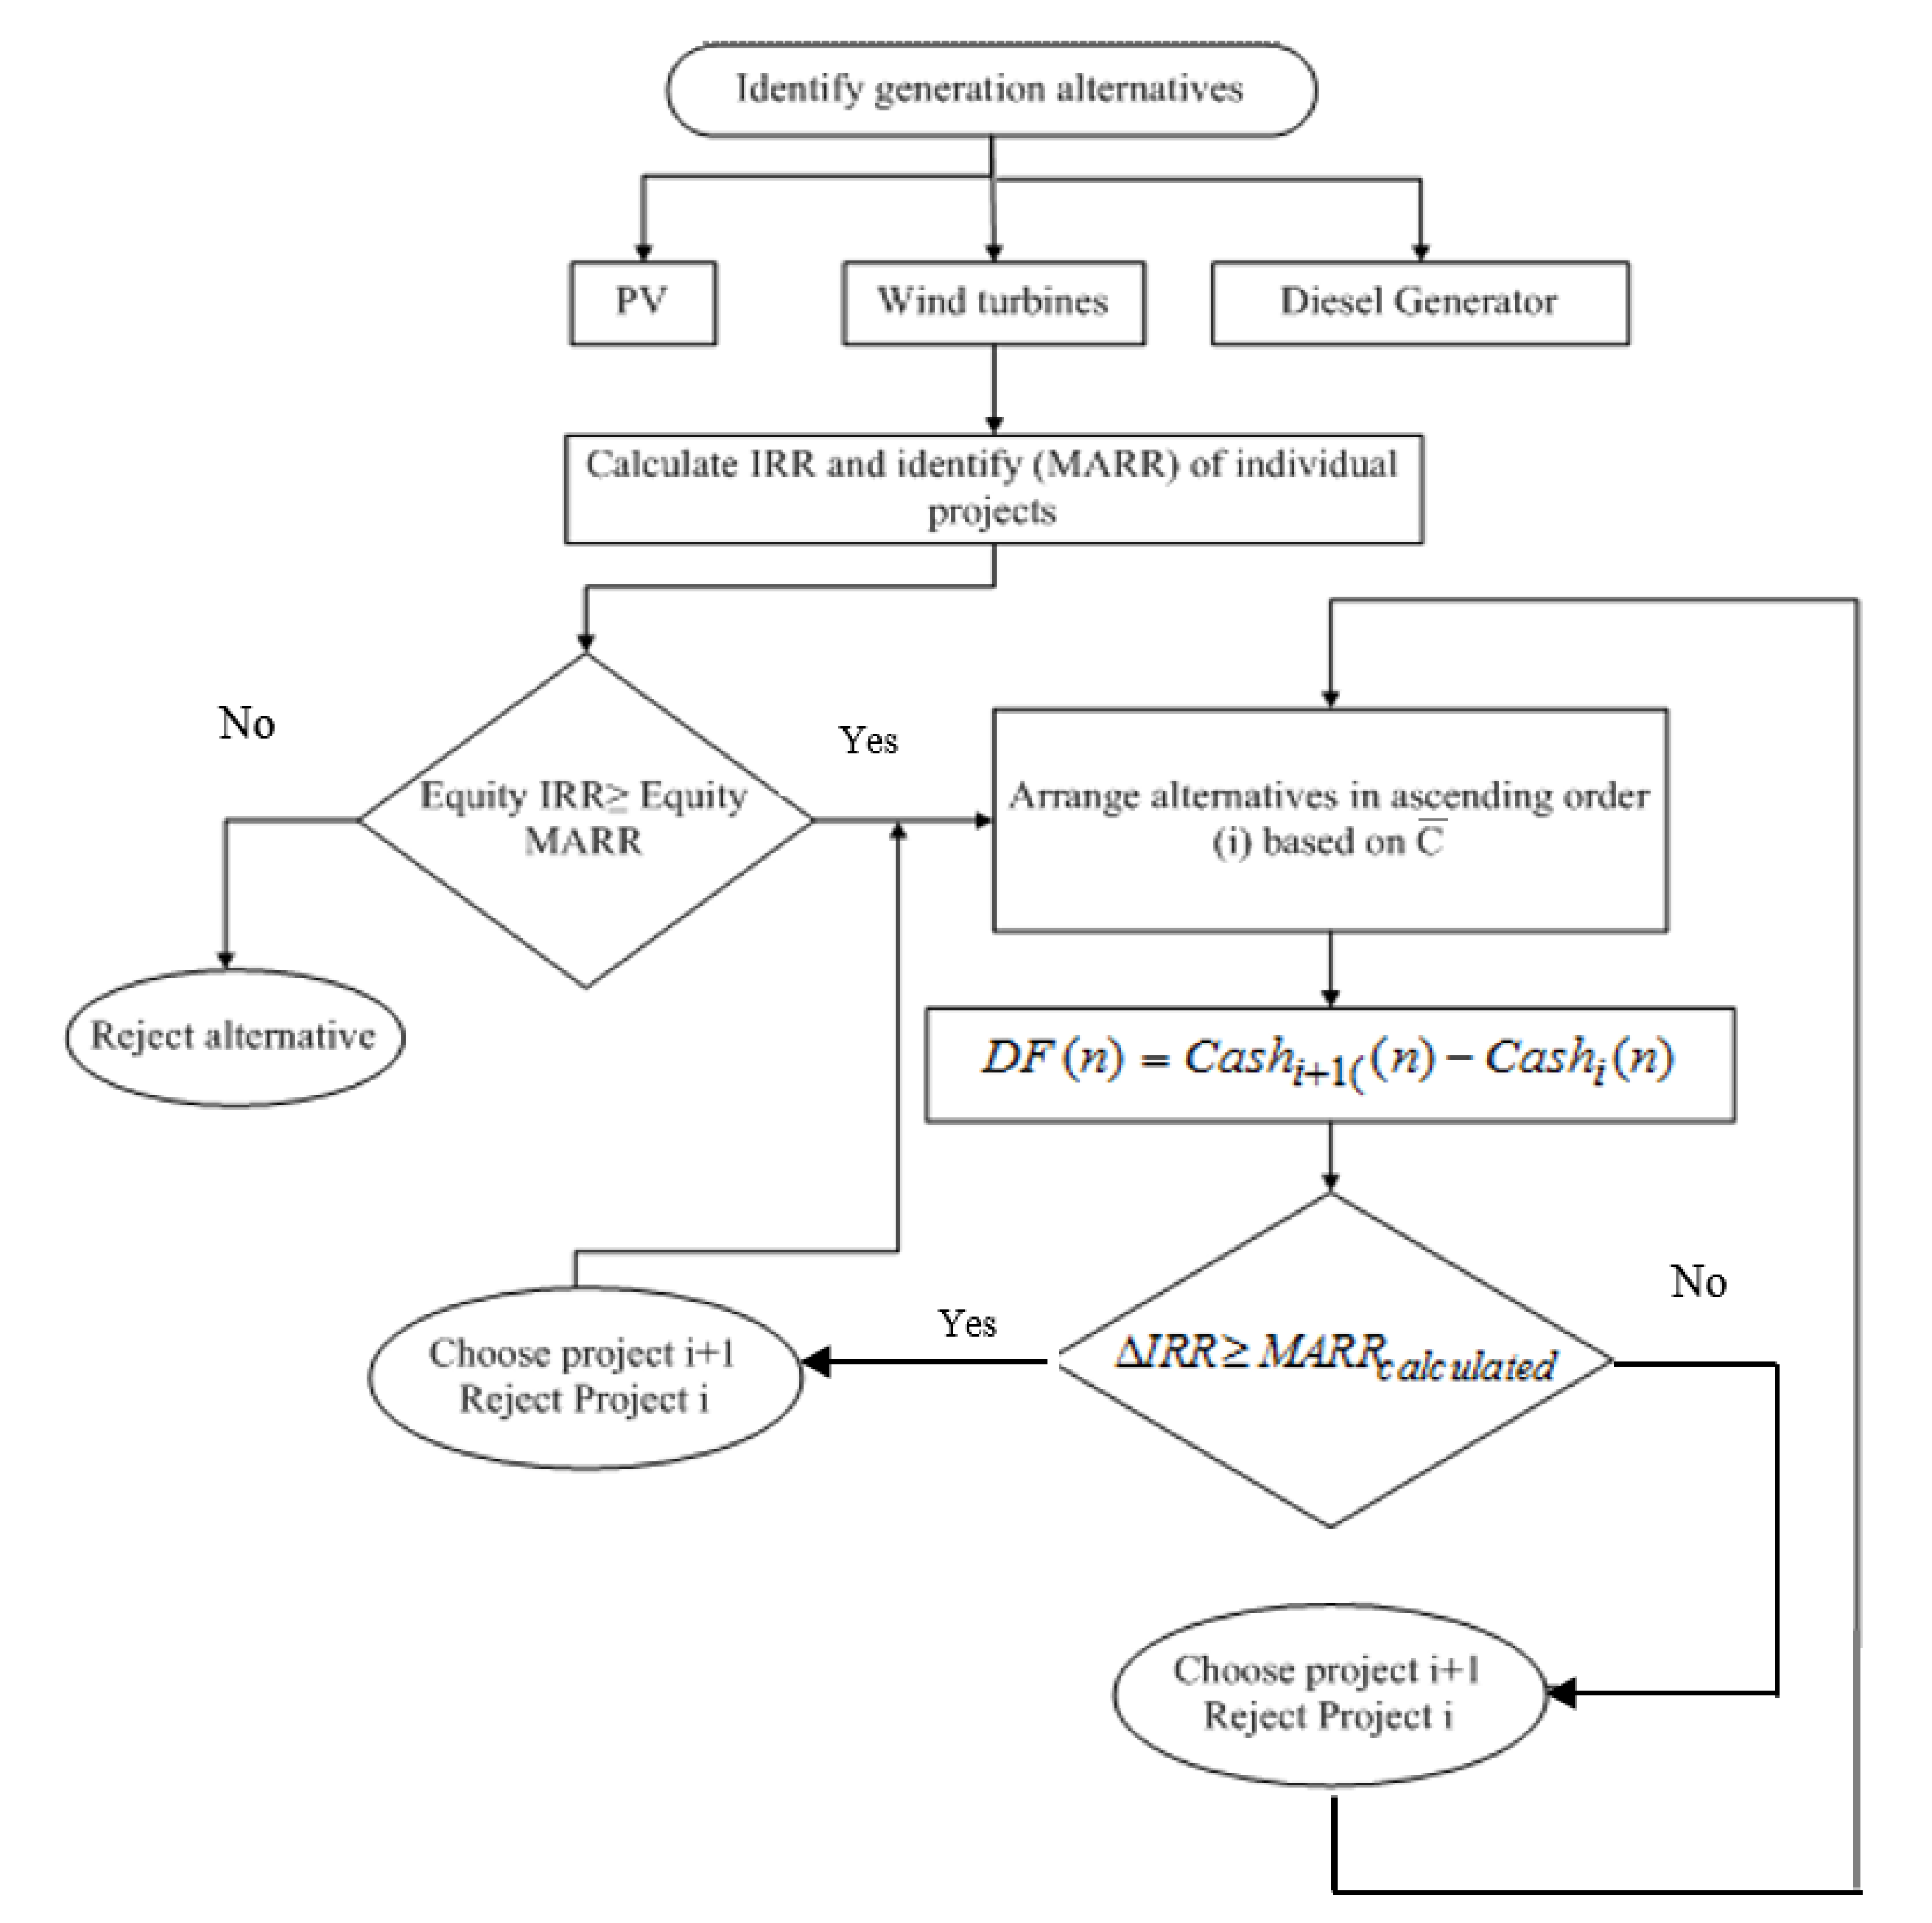
7. Incremental Rate of Return Analysis
8. Sensitivity Analysis and Decision Making
9. Incremental Benefit to Cost Ratio for Sensitivity Analysis on Diesel Cost Variation
10. Economic Analysis of the Projects: A Comparison with the Literature
11. Distributed Generation Technologies and Policy Implications
12. Conclusions
Author Contributions
Funding
Conflicts of Interest
References
- Al-Sumaiti, A.; Salama, M.M.A. Review on Issues Related to Electric Energy Demand in Distribution System for Developing Countries. In Proceedings of the 3rd IET International Conference on Clean Energy and Technology, Kuching, Sarawak, Malaysia, 24–26 November 2014. [Google Scholar] [CrossRef]
- World Energy Council-Indian Member Committee (WEC-IMC) and Power Grid Corporation of India Limited. Transmission and Distribution in India: A Report; A Joint Initiative of WECIMC and Power Grid Corporation of India Limited: India. Available online: http://npti.gov.in/sites/default/files/download-document/world_energy_council_report.pdf (accessed on 22 May 2020).
- REN21 Renewable Energy Policy Network for the 21st Century. Renewables 2018 Global Status Report, REN21. (Paris: REN21 Secretariat). 2018. Available online: https://www.ren21.net/wp-content/uploads/2019/05/GSR2018_Full-Report_English.pdf (accessed on 17 April 2020).
- Al-Sumaiti, A.S.; Salama, M.M.; El Moursi, M.S. Enabling electricity access in developing countries: A probabilistic weather driven house based approach. Appl. Energy 2017, 191, 531–548. [Google Scholar] [CrossRef]
- Al-Sumaiti, A.S.; Salama, M.; El Moursi, M.; Alsumaiti, T.S.; Marzband, M. Enabling electricity access: Revisiting load models for AC-grid operation-Part, I. IET Gener. Transm. Distrib. 2019, 13, 2563–2571. [Google Scholar] [CrossRef]
- Al-Sumaiti, A.S.; Salama, M.; El Moursi, M.; Alsumaiti, T.S.; Marzband, M. Enabling electricity access: A comprehensive energy efficient approach mitigating climate/weather variability-Part II. IET Gener. Transm. Distrib. 2019, 13, 2572–2583. [Google Scholar] [CrossRef]
- Konda, S.R.; Al-Sumaiti, A.S.; Panwar, L.K.; Panigrahi, B.K.; Kumar, R. Impact of Load Profile on Dynamic Interactions Between Energy Markets: A Case Study of Power Exchange and Demand Response Exchange. IEEE Trans. Ind. Inform. 2019, 15, 5855–5866. [Google Scholar] [CrossRef]
- Reddy, S.; Al Sumaiti, A.; Panwar, L.; Panigrahi, B.K.; Kumar, R. An Online Adaptive Intelligent Framework for Customer Willingness Interpretation in Demand Response Exchange. In Proceedings of the 2018 8th IEEE India International Conference on Power Electronics (IICPE), Institute of Electrical and Electronics Engineers (IEEE), Jaipur, India, 13–15 December 2018; pp. 1–6. [Google Scholar]
- Al-Sumaiti, A.S.; Ahmed, M.H.; Salama, M. Residential Load Management under Stochastic Weather Condition in Developing Countries. Electr. Power Components Syst. 2014, 42, 1452–1473. [Google Scholar] [CrossRef]
- Li, Q.; Yu, S.; Al-Sumaiti, A.; Turitsyn, K. Modeling and Co-Renewable Energy Policy Network for the 21st Century Optimization of A Micro Water-Energy Nexus for Smart Communities. In Proceedings of the 2018 IEEE PES Innovative Smart Grid Technologies Conference Europe (ISGT-Europe), Sarajevo, Bosnia-Herzegovina, 21–25 October 2018. [Google Scholar]
- Nguyen, H.; Al-Sumaiti, A.S.; Turitsyn, K.; Li, Q.; El Moursi, M.S. Further Optimized Scheduling of Micro Grids via Dispatching Virtual Electricity Storage Offered by Deferrable Power-Driven Demands. IEEE Trans. Power Syst. 2020, 1. [Google Scholar] [CrossRef]
- Mohandes, B.; Acharya, S.; El Moursi, M.S.; Al-Sumaiti, A.; Doukas, H.; Sgouridis, S. Optimal Design of an Islanded Microgrid with Load Shifting Mechanism Between Electrical and Thermal Energy Storage Systems. IEEE Trans. Power Syst. 2020, 1. [Google Scholar] [CrossRef]
- Singh, R.; Sood, Y.R.; Padhy, N.P. Development of renewable energy sources for indian power sector moving towards competitive electricity market. In Proceedings of the 2009 IEEE Power & Energy Society General Meeting, Calgary, AB, Canada, 26–30 July 2009; pp. 1–6. [Google Scholar] [CrossRef]
- Asgher, U.; Rasheed, M.B.; Al-Sumaiti, A.S.; Rahman, A.U.; Ali, I.; Alzaidi, A.; Alamri, A. Smart Energy Optimization Using Heuristic Algorithm in Smart Grid with Integration of Solar Energy Sources. Energies 2018, 11, 3494. [Google Scholar] [CrossRef]
- Javadi, M.; Marzband, M.; Akorede, M.; Godina, R.; Al-Sumaiti, A.S.; Pouresmaeil, E. A Centralized Smart Decision-Making Hierarchical Interactive Architecture for Multiple Home Microgrids in Retail Electricity Market. Energies 2018, 11, 3144. [Google Scholar] [CrossRef]
- Fouladfar, M.H.; Al Sumaiti, A.; Fenik, M.S.; Marzband, M.; Busawon, K.; Pouresmaeil, E. Energy Management of a Single Grid-Connected Home Microgrid for Determining Optimal Supply/Demand Bids. In Proceedings of the 2018 5th International Symposium on Environment-Friendly Energies and Applications (EFEA), Rome, Italy, 24–26 September 2018; pp. 1–8. [Google Scholar] [CrossRef]
- Al-Sumaiti, A.S.; Ahmed, M.H.; Salama, M.M.A. Smart Home Activities: A Literature Review. Electr. Power Components Syst. 2014, 42, 294–305. [Google Scholar] [CrossRef]
- Khatib, H. Renewable Energy in Developing Countries. In Proceedings of the International Conference on Renewable Energy-Clean Power 2001, IET, London, UK, 17–19 November 1993. [Google Scholar]
- Li, Q.; Yu, S.; Al-Sumaiti, A.; Turitsyn, K. Modeling and Co-Optimization of a Micro Water-Energy Nexus for Smart Communities. In Proceedings of the 2018 IEEE PES Innovative Smart Grid Technologies Conference Europe (ISGT-Europe), Sarajevo, Bosnia-Herzegovina, 21–25 October 2018; Volume 6, pp. 1–5. [Google Scholar] [CrossRef]
- Banhidarah, A.K.; Al-Sumaiti, A.S. Heuristic search algorithms for optimal locations and sizing of distributed generators in the grid: A brief recent review. In Proceedings of the 2018 Advances in Science and Engineering Technology International Conferences (ASET), Institute of Electrical and Electronics Engineers (IEEE), Abu Dhabi, United Arab Emirates, 6 February–5 April 2018; pp. 1–5. [Google Scholar]
- Al-Sumaiti, A.S. The role of regulation in the economic evaluation of renewable energy investments in developing countries. In Proceedings of the 2013 7th IEEE GCC Conference and Exhibition (GCC), Institute of Electrical and Electronics Engineers (IEEE), Doha, Qatar, 17–20 November 2013; pp. 39–43. [Google Scholar]
- Al-Sumaiti, A.S.; Salama, M.M.A.; Konda, S.R.; Kavousi-Fard, A.; Konda, S.R. A Guided Procedure for Governance Institutions to Regulate Funding Requirements of Solar PV Projects. IEEE Access 2019, 7, 54203–54217. [Google Scholar] [CrossRef]
- Al-Sumaiti, A.S. Power Generation Shortage in Developing Countries: Causes, Challenges and Solutions. Ph.D. Thesis, University of Waterloo, Waterloo, ON, Canada, 2015. [Google Scholar]
- Deo, P.; Jayaraman, S.S.; Verma, S.V.S.; Dayalan, S.M.D. In the Matter of Determination of Generic Levellised Generation Tariff for the FY2013-14 under Regulation 8 of the Central Electricity Regulatory Commission (Terms and Conditions for Tariff Determination from Renewable Energy Sources) Regulations. Central Electricity Regulatory Commission, New Delhi, India, Petition No. 243/SM/2012 (Suo-Motu). 2012. Available online: http://www.cercind.gov.in/2013/orders/SO243.pdf (accessed on 17 April 2020).
- Lalwani, M.; Kothari, D.P.; Singh, M. Viability Analysis by Techno-Economic Aspects of Grid Interactive Solar Photovoltaic Project in India. In Proceedings of the International Conference on Advances in Engineering Science and Management (ICASEM), Nagapattinam, Tamil Nadu, India, 30–31 March 2012; pp. 769–772. [Google Scholar]
- Natural Resources Canada. Teacher’s Note: Wind Energy Project (Grid Connected Wind Farm, Andhara Pradesh, India). Available online: www.retscreen.net/download.php/ang/33/2/WIND04-B.pdf (accessed on 28 May 2013).
- Noori, M.; Kucukvar, M.; Tatari, O. Economic Input–Output Based Sustainability Analysis of Onshore and Offshore Wind Energy Systems. Int. J. Green Energy 2014, 12, 939–948. [Google Scholar] [CrossRef]
- Castro-Santos, L.; Casas, V.D. Sensitivity analysis of floating offshore wind farms. Energy Convers. Manag. 2015, 101, 271–277. [Google Scholar] [CrossRef]
- IRENA. Renewable Energy Analysis: Cost Analysis Series. 2012. Available online: https://www.irena.org/ (accessed on 28 May 2020).
- Conover, K. Photovoltaic operation and maintenance evaluation. IEEE Trans. Energy Convers. 1990, 5, 279–283. [Google Scholar] [CrossRef]
- Shukla, A.K.; Sudhakar, K.; Baredar, P. Design, simulation and economic analysis of standalone roof top solar PV system in India. Sol. Energy 2016, 136, 437–449. [Google Scholar] [CrossRef]
- Rodrigues, S.; Torabi, R.; Faria, F.; Cafôfo, N.; Chen, X.; Ivaki, A.R.; Mata-Lima, H.; Morgado-Dias, F. Economic feasibility analysis of small scale PV systems in different countries. Sol. Energy 2016, 131, 81–95. [Google Scholar] [CrossRef]
- Al-Sumaiti, A.S.; Hassan, M.A.; Rivera, S.; Salama, M.A.A.; El Moursi, M.S.; Alsumaiti, T. A Stochastic PV Model for Power System Planning Applications. IET Renew. Power Gener. 2019, 13, 3168–3179. [Google Scholar] [CrossRef]
- Blechinger, P.; Cader, C.; Bertheau, P.; Huyskens, H.; Seguin, R.; Breyer, C. Global analysis of the techno-economic potential of renewable energy hybrid systems on small islands. Energy Policy 2016, 98, 674–687. [Google Scholar] [CrossRef]
- Mamaghani, A.H.; Escandon, S.A.A.; Najafi, B.; Shirazi, A.; Rinaldi, F. Techno-economic feasibility of photovoltaic, wind, diesel and hybrid electrification systems for off-grid rural electrification in Colombia. Renew. Energy 2016, 97, 293–305. [Google Scholar] [CrossRef]
- Fazelpour, F.; Soltani, N.; Rosen, M.A. Economic analysis of standalone hybrid energy systems for application in Tehran, Iran. Int. J. Hydrogen Energy 2016, 41, 7732–7743. [Google Scholar] [CrossRef]
- Banerjee, R. Comparison of options for distributed generation in India. Energy Policy 2006, 34, 101–111. [Google Scholar] [CrossRef]
- Ramli, M.; Hiendro, A.; Twaha, S. Economic analysis of PV/diesel hybrid system with flywheel energy storage. Renew. Energy 2015, 78, 398–405. [Google Scholar] [CrossRef]
- Kalinci, Y.; Hepbasli, A.; Dincer, I. Techno-economic analysis of a stand-alone hybrid renewable energy system with hydrogen production and storage options. Int. J. Hydrogen Energy 2015, 40, 7652–7664. [Google Scholar] [CrossRef]
- RETScreen® International. Clean Energy Project Analysis (RETScreen Engineering & Cases Textbook), 3rd ed.; Natural Resources Canada: Ottawa, ON, Canada, 2012. [Google Scholar]
- Newnan, D.G.; Eschenbach, T.G.; Lavelle, J.P. Engineering Economic Analysis, 9th ed.; Oxford University Press: New York, NY, USA, 2004. [Google Scholar]
- Wikipedia. Electricity Sector in India. Available online: https://en.wikipedia.org/wiki/Electricity_sector_in_India (accessed on 19 April 2020).
- Central Electricity Authority. Ministry of Power, Government of India, Executive Summary on Power Sector, October 2019. Available online: http://cea.nic.in/reports/monthly/executivesummary/2019/exe_summary-10.pdf (accessed on 15 April 2020).
- Central Electricity Authority, Ministry of Power, Government of India, New Delhi, ‘Growth of Electricity Sector in India from 1947–2019. Available online: http://www.cea.nic.in/reports/others/planning/pdm/growth_2019.pdf (accessed on 15 April 2020).
- Jaganmohan, M. Share of Peak Power Demand Across Maharashtra in India between FY 2016 and FY 2019. Available online: https://www.statista.com/statistics/1046700/india-maharashtra-peak-power-demand-share/ (accessed on 15 April 2020).
- Tiewsoh, L.S.; Jirásek, J.; Sivek, M. Electricity Generation in India: Present State, Future Outlook and Policy Implications. Energies 2019, 12, 1361. [Google Scholar] [CrossRef]
- Van Ruijven, B.; De Cian, E.; Wing, I.S. Amplification of future energy demand growth due to climate change. Nat. Commun. 2019, 10, 2762. [Google Scholar] [CrossRef] [PubMed]
- IEA. Global Energy & Co2 Status Report 2019. The Latest Trends in Energy and Emissions in 2018, Flagship Report-2019. Available online: https://www.iea.org/reports/global-energy-co2-status-report-2019 (accessed on 15 April 2020).
- Damm, A.; Köberl, J.; Prettenthaler, F.; Rogler, N.; Töglhofer, C. Impacts of +2 °C global warming on electricity demand in Europe. Clim. Serv. 2017, 7, 12–30. [Google Scholar] [CrossRef]
- World Energy Outlook 2019-Flagship Report, November 2019. Available online: https://www.iea.org/reports/world-energy-outlook-2019 (accessed on 15 April 2020).
- Bhaskar, U. China, India Are Driving Energy Demand Growth. Available online: https://www.livemint.com/Industry/pERzgaMh5HX5yewWrMCuiO/China-India-are-driving-energy-demand-growth.html (accessed on 15 April 2020).
- Central Statistics Office, Ministry of Statistics and Programme Implementation, Government of India, New Delhi, Energy Statistics 2019 (Twenty Sixth Issue). Available online: http://www.mospi.gov.in/sites/default/files/publication_reports/Energy%20Statistics%202019-finall.pdf (accessed on 15 April 2019).
- Seetharaman, G. Why India not Achieve Its 2022 Clean Energy Target. Available online: https://economictimes.indiatimes.com/industry/energy/power/why-india-may-not-achieve-its-2022-clean-energy-target/articleshow/71869684.cms?from=mdr (accessed on 15 April 2020).
- Government of India Ministry of Power Central Electricity Authority. Executive Summary on Power Sector Mar-19. Available online: http://www.cea.nic.in/reports/monthly/renewable/2019/renewable-03.pdf (accessed on 15 April 2020).
- Soori, H.; Khorasani-Zavareh, D.; Hamid, S.; Khorasani-Zavareh, D. Road traffic injuries measures in the Eastern Mediterranean Region: Findings from the Global Status Report on Road Safety-2015. J. Inj. Violence Res. 2019, 11, 149–158. [Google Scholar] [CrossRef]
- Mitavachan, H.; Gokhale, A.; Srinivasan, J. A Case Study of 3MW Scale Grid Connected Solar Photovoltaic Power Plant at Kolar, Karnataka: Performance Assessment & Recommendations; Report IISc-DCCC 11 RE; Systems Reports, Renewable Energy Divecha Centre for Climate Change; Indian Institute of Science: Bengaluru, Karnataka, India, 2011. [Google Scholar]
- Pauschert, D. Study of Equipment Prices in the Power Sector. ESMAP Technical Paper122/09. 2009. Available online: https://esmap.org/sites/default/files/esmap-files/TR122-09_GBL_Study_of_Equipment_Prices_in_the_Power_Sector.pdf (accessed on 19 June 2019).
- Mandal, A. A Report on Design Estimation of 1MW Solar PV Plant (Utility Scale). Available online: https://www.academia.edu/3369336/A_Report_on_Design_Estimation_of_1MW_Solar_PV_Plant_Utility_Scale (accessed on 19 June 2019).
- Eti, M.; Ogaji, S.; Probert, S. Reducing the cost of preventive maintenance (PM) through adopting a proactive reliability-focused culture. Appl. Energy 2006, 83, 1235–1248. [Google Scholar] [CrossRef]
- Diesel Fuel Consumption Chart. Available online: http://www.generatorjoe.net/html/fueluse.html (accessed on 8 May 2019).
- Central Electricity Regulatory Commission. Explanatory Memorandum for Tariff Norms for Solar Power Projects. July 2009. Available online: http://www.cercind.gov.in/2009/July09/Draft-Explanatory-Memorandum_Solar-Power-Projects.pdf (accessed on 19 June 2019).
- O’Neill, M. MACRS Depreciation. Available online: http://seattlecentral.edu/faculty/moneil/Lectures/macrs.htm (accessed on 8 May 2019).
- Campbell, H.; Brown, R. Benefit-Cost Analysis: Financial and Economic Appraisal Using Spreadsheets; Cambridge University Press: Cambridge, UK, 2003; p. 360. [Google Scholar]
- Trivedi, B. Solar Power Becomes Cheaper Than Diesel in India. Available online: http://www.renewableenergyworld.com/rea/news/article/2011/12/solar-power-becomes-cheaper-than-diesel-in-india (accessed on 23 June 2019).
- Maharashtra State Electricity Distribution Co. Ltd. Tariff of Non Conventional Energy (NCE)/Renewable Energy Projects for FY 2010-11, Mumbai. 2010. Available online: https://www.mahadiscom.in/consumer/wp-content/uploads/2018/03/Comm_Cir_122-12Oct.pdf (accessed on 19 June 2019).
- Maharashtra Electricity Regulatory Commission. Terms and Conditions for Determination of Re-Tariff, Mumbai 2010. Available online: http://www.mercindia.org.in/pdf/Order%2058%2042/Final_MERC_RE_Tariff_Regulation_2010.pdf (accessed on 19 June 2019).
- Raja, S.V.P.; Sonavani, S.V.L. In the Matter of Determination of Generic Tariff under Regulation 8 of the Maharashtra Electricity Regulatory Commission (Terms and Conditions for Determination of Renewable Energy Tariff) Regulations. 2010. Available online: http://www.mercindia.org.in/pdf/Order%2058%2042/Case_20_of_2010Final_RE_Order.pdf (accessed on 19 June 2019).
- Obukhov, S.; Ibrahim, A.; Diab, A.A.Z.; Al-Sumaiti, A.S.; Aboelsaud, R. Optimal Performance of Dynamic Particle Swarm Optimization Based Maximum Power Trackers for Stand-Alone PV System Under Partial Shading Conditions. IEEE Access 2020, 8, 20770–20785. [Google Scholar] [CrossRef]
- Nguyen, H.T.; Al-Sumaiti, A.S.; Vu, V.P.; Al-Durra, A.; Do, T.D. Optimal Power Tracking of PMSG Based Wind Energy Conversion Systems by Constrained Direct Control with Fast Convergence Rates. Int. J. Electr. Power Energy Syst. 2020, 118, 105807. [Google Scholar] [CrossRef]
- Bothra, N. Vinod Kothari & Company. Carbon Credits–Unravelling Regulatory, Taxation & Accounting Issues. Available online: http://india-financing.com/Carbon_Credits-Regulatory_,_Taxation_&_Accounting%20issues.pdf (accessed on 5 June 2013).
- Shively, G.; Galopin, M. An Overview of Benefit-Cost Analysis. Available online: http://www.agecon.purdue.edu/staff/shively/COURSES/AGEC406/reviews/bca.htm (accessed on 1 January 2015).
- NPTEL. Lecture 14: Incremental Benefit-Cost Ratio Analysis. Available online: http://nptel.ac.in/courses/105103023/22 (accessed on 8 May 2019).
- Bahaskar, S. Cashing on the Sun: Financial Attractiveness of On-Grid Solar PV and Thermal Projects in India, India. 2010. Available online: https://www.browneandmohan.com/wp-content/uploads/2020/05/Cashing-on-the-Sun.pdf (accessed on 22 May 2020).
- Vashishtha, S.; Nair, S. Understanding Accelerated Depreciation in Solar Projects. Available online: https://firstgreenconsulting.wordpress.com/2013/05/21/understanding-accelerated-depreciation-in-solar-projects/ (accessed on 8 May 2019).
- Park, C.S. Fundamentals of Engineering Economics: Corporate Taxes (Lecture No.25). 2005. Available online: http://faculty.kfupm.edu.sa/SE/atique/SE307_Engineering_Economics/ (accessed on 8 May 2019).
- Bales, R. Chapter 9: Project Cash Flow Analysis. Available online: https://eng.ucmerced.edu/people/rbales/Courses/ENGR155files (accessed on 19 June 2019).
- Lipsett, M.G. ENGM 401 & 620–X1: Fundamentals of Engineering Finance, Lecture 28: After Tax Cash Flow. Available online: http://www.ualberta.ca/~mlipsett/ENGM401_620/ENGM401_620.htm (accessed on 8 May 2019).
- Mursau, A. Depreciation Accounting (MACRS vs. GAAP Book Depreciation Effect on Taxable Income). Available online: https://www.youtube.com/watch?v=T2mkxmDqGhU (accessed on 8 May 2019).
- Canadian Wind Energy Association. Small Wind Turbine Purchasing Guide: Off-Grid, Residential, Farm & Small Business Applications. Available online: https://www.canadianpoultrymag.com/images/stories/small_wind_purchasing_guide.pdf (accessed on 14 April 2020).
- Wood, D.; Freere, P. 5—Stand-Alone Wind Energy Systems. Stand-Alone and Hybrid Wind Energy Systems, Technology, Energy Storage and Applications; Kaldellis, J.K., Ed.; Woodhead Publishing Series in Energy. Publisher Woodhead Publishing Limited: Cambridge, UK, 2010. Available online: https://www.sciencedirect.com/science/article/pii/B9781845695279500056 (accessed on 14 April 2020).
- Aathmika, Gujarat Solar Policy, Cost of 1 mw Solar Project in Gujarat, Solar Subsidies and Incentives for Off Grid Solar, Steps Involved in Roof-top Solar PV System Designing with Battery Backup. 2012. Available online: http://www.eai.in/club/users/aathmika/blogs/1074/ (accessed on 14 April 2020).
- Zipp, K. What Are Some Common Types of Solar PV and Storage Installations? Available online: https://www.solarpowerworldonline.com/2015/10/what-are-some-common-types-of-solar-pv-and-storage-installations/ (accessed on 14 April 2020).
- Leahy, M.J.; Connolly, D.; Buckley, D.N. Chapter 12: Wind Energy Storage Technologies. Available online: https://www.witpress.com/Secure/elibrary/papers/9781845642051/9781845642051021FU1.pdf (accessed on 14 April 2020).
- Energy Storage Association. Policies & Issues, ESA Policy Statements, Positions that Broadly Represent Energy Storage Industry Interests. Available online: https://energystorage.org/policies-issues/esa-policy-statements/ (accessed on 16 April 2020).
- Condon, M.; Revesz, R.L.; Unel, B. Managing the Future of Energy Storage, Implications for Greenhouse Gas Emissions. 2018. Available online: https://policyintegrity.org/files/publications/Managing_the_Future_of_Energy_Storage.pdf (accessed on 16 April 2020).


| Capital cost decomposition of various 1 MW projects | |||||||
| 1 MW DG | 1 MW WT | 1 MW PV | |||||
| Component | Cost (INR) | % of capital cost | Cost (INR) | % of capital cost | Cost (INR) | % of capital cost | |
| a) energy equipment | 25,000,000 | 74.98% | 30,800,000 | 79.78% | 145,000,000 | 82.79% | |
| b) the rest of the system | 6,752,676.37 | 20.25% | 5,969,750 | 15.46% | 21,799,800 | 12.45% | |
| contingencies (5% of a and b) | 1,587,633.82 | 4.76% | 1,838,488 | 4.76% | 8,339,990 | 4.76% | |
| Total | 33,340,310.19 | 100% | 38,608,238 | 100% | 175,139,790 | 100% | |
| Annual cost of electricity generation projects | |||||||
| Cost (INR/year) | 1 M DG | 1 MW WT | 1 MW PV | ||||
| fuel cost to undergo 5% escalation as in Equation (6) | 37,723,052 | 0 | 0 | ||||
| operation and maintenance | 2,190,000 | 671,500 | 900,000 | ||||
| Contingencies | 10% | 10% | 10% | ||||
| total without fuel cost | 2,409,000 | 738,650 | 990,000 | ||||
| INR/Year | Diesel Generator | Wind Turbine | PV |
|---|---|---|---|
| A | −5,831,029.645 | −6,752,360.014 | −30,630,948 |
| Equity IRR (%) | |||
|---|---|---|---|
| Depreciation | MACRS | Declining Balance | Straight Line |
| 1 MW WT | 27.39 | 32.02 | 26.43 |
| 1 MW PV | 10.25 | 10.57 | 9.98 |
| 1 MW DG | 22.27 | 24.64 | 21.50 |
| Rejected project based on equity IRR | Reject PV | Reject PV | Reject PV |
| Project IRR (%) | |||
| Depreciation | MACRS | Declining Balance | Straight Line |
| WT | 21.62 | 23.29 | 21.21 |
| PV | 11.33 | 11.58 | 11.11 |
| DG | 19.09 | 20.20 | 18.70 |
| Ascending order based on capital cost | 1) DG, 2) WT | ||
| Incremental IRR | (WT, DG) = 37.88% | (WT,DG) = 45.94% | (WT,DG) = 37.40% |
| Decision | Choose wind | Choose wind | Choose wind |
| Type | Capital Cost Variation | Project IRR | Status and Private IRR. Accept only if EquityIRR > Equity MARR | Order | ∆IRR & Decision |
|---|---|---|---|---|---|
| PV | −20% | 13.74 | Accept: 13.62% | 3 | First step: (WT:DG) = 45.74% > 14% Second step: (WT,PV) = 9.56% < 14% Decision: Choose WT |
| WT | 25.56 | Accept: 36.53% | 2 | ||
| DG | 22.46 | Accept: 28.90% | 1 | ||
| PV | −15% | 13.05 | Accept, 12.64% | 3 | First step: (WT:DG) = 45.01% > 14% Second step: (WT,PV) = 9.02% < 14% Decision: Choose WT |
| WT | 24.42 | Accept, 33.70% | 2 | ||
| DG | 21.03 | Accept, 26.88% | 1 | ||
| PV | −10% | 12.43 | Reject: 11.75% | - | (WT,DG) = 41.39% Decision: Choose WT |
| WT | 23.40 | Accept: 31.29% | 2 | ||
| DG | 20.61 | Accept: 25.13% | 1 | ||
| PV | −5% | 11.85 | Reject 10.96% | - | (WT,DG) = 39.55% > 14% Decision: Choose WT |
| WT | 22.47 | Accept: 29.20% | 2 | ||
| DG | 19.82 | Accept: 23.61% | 1 | ||
| PV | −2.5% | 11.58 | Reject: 10.60% | - | (WT,DG) = 38.69% > 14% Decision: Choose WT |
| WT | 22.04 | Accept: 28.87% | 2 | ||
| DG | 19.45 | Accept: 22.92% | 1 | ||
| PV | 0% | 11.33 | Reject: 10.25% | - | (WT,DG) = 37.88% > 14% Decision: Choose WT |
| WT | 21.62 | Accept: 27.39% | 2 | ||
| DG | 19.09 | Accept: 22.27% | 1 | ||
| PV | 2.5% | 11.08 | Reject: 9.92% | - | (WT,DG) = 37.11% > 14% Decision: Choose wind |
| WT | 21.23 | Accept: 26.57% | 2 | ||
| DG | 18.75 | Accept: 21.65% | 1 | ||
| PV | 5% | 10.84 | Reject: 9.60% | - | (WT,DG) = 36.38% > 14% Decision: Choose WT |
| WT | 20.85 | Accept: 25.80% | 2 | ||
| DG | 18.42 | Accept: 21.07% | 1 | ||
| PV | 10% | 10.38 | Reject: 9.01% | - | (WT,DG) = 35.00% > 14% Decision: Choose WT |
| WT | 20.14 | Accept: 24.39% | 2 | ||
| DG | 17.81 | Accept: 19.91% | 1 | ||
| PV | 15% | 9.96 | Reject: 8.46% | - | (WT,DG) = 34.05% > 14% Decision: Choose WT |
| WT | 19.48 | Accept: 23.13% | 2 | ||
| DG | 17.20 | Accept: 18.99% | 1 | ||
| PV | 20% | 9.56 | Reject: 7.96% | - | (WT,DG) = 32.78% > 14% Decision: Choose WT |
| WT | 18.87 | Accept: 22.00% | 2 | ||
| DG | 16.69 | Accept: 18.15% | 1 |
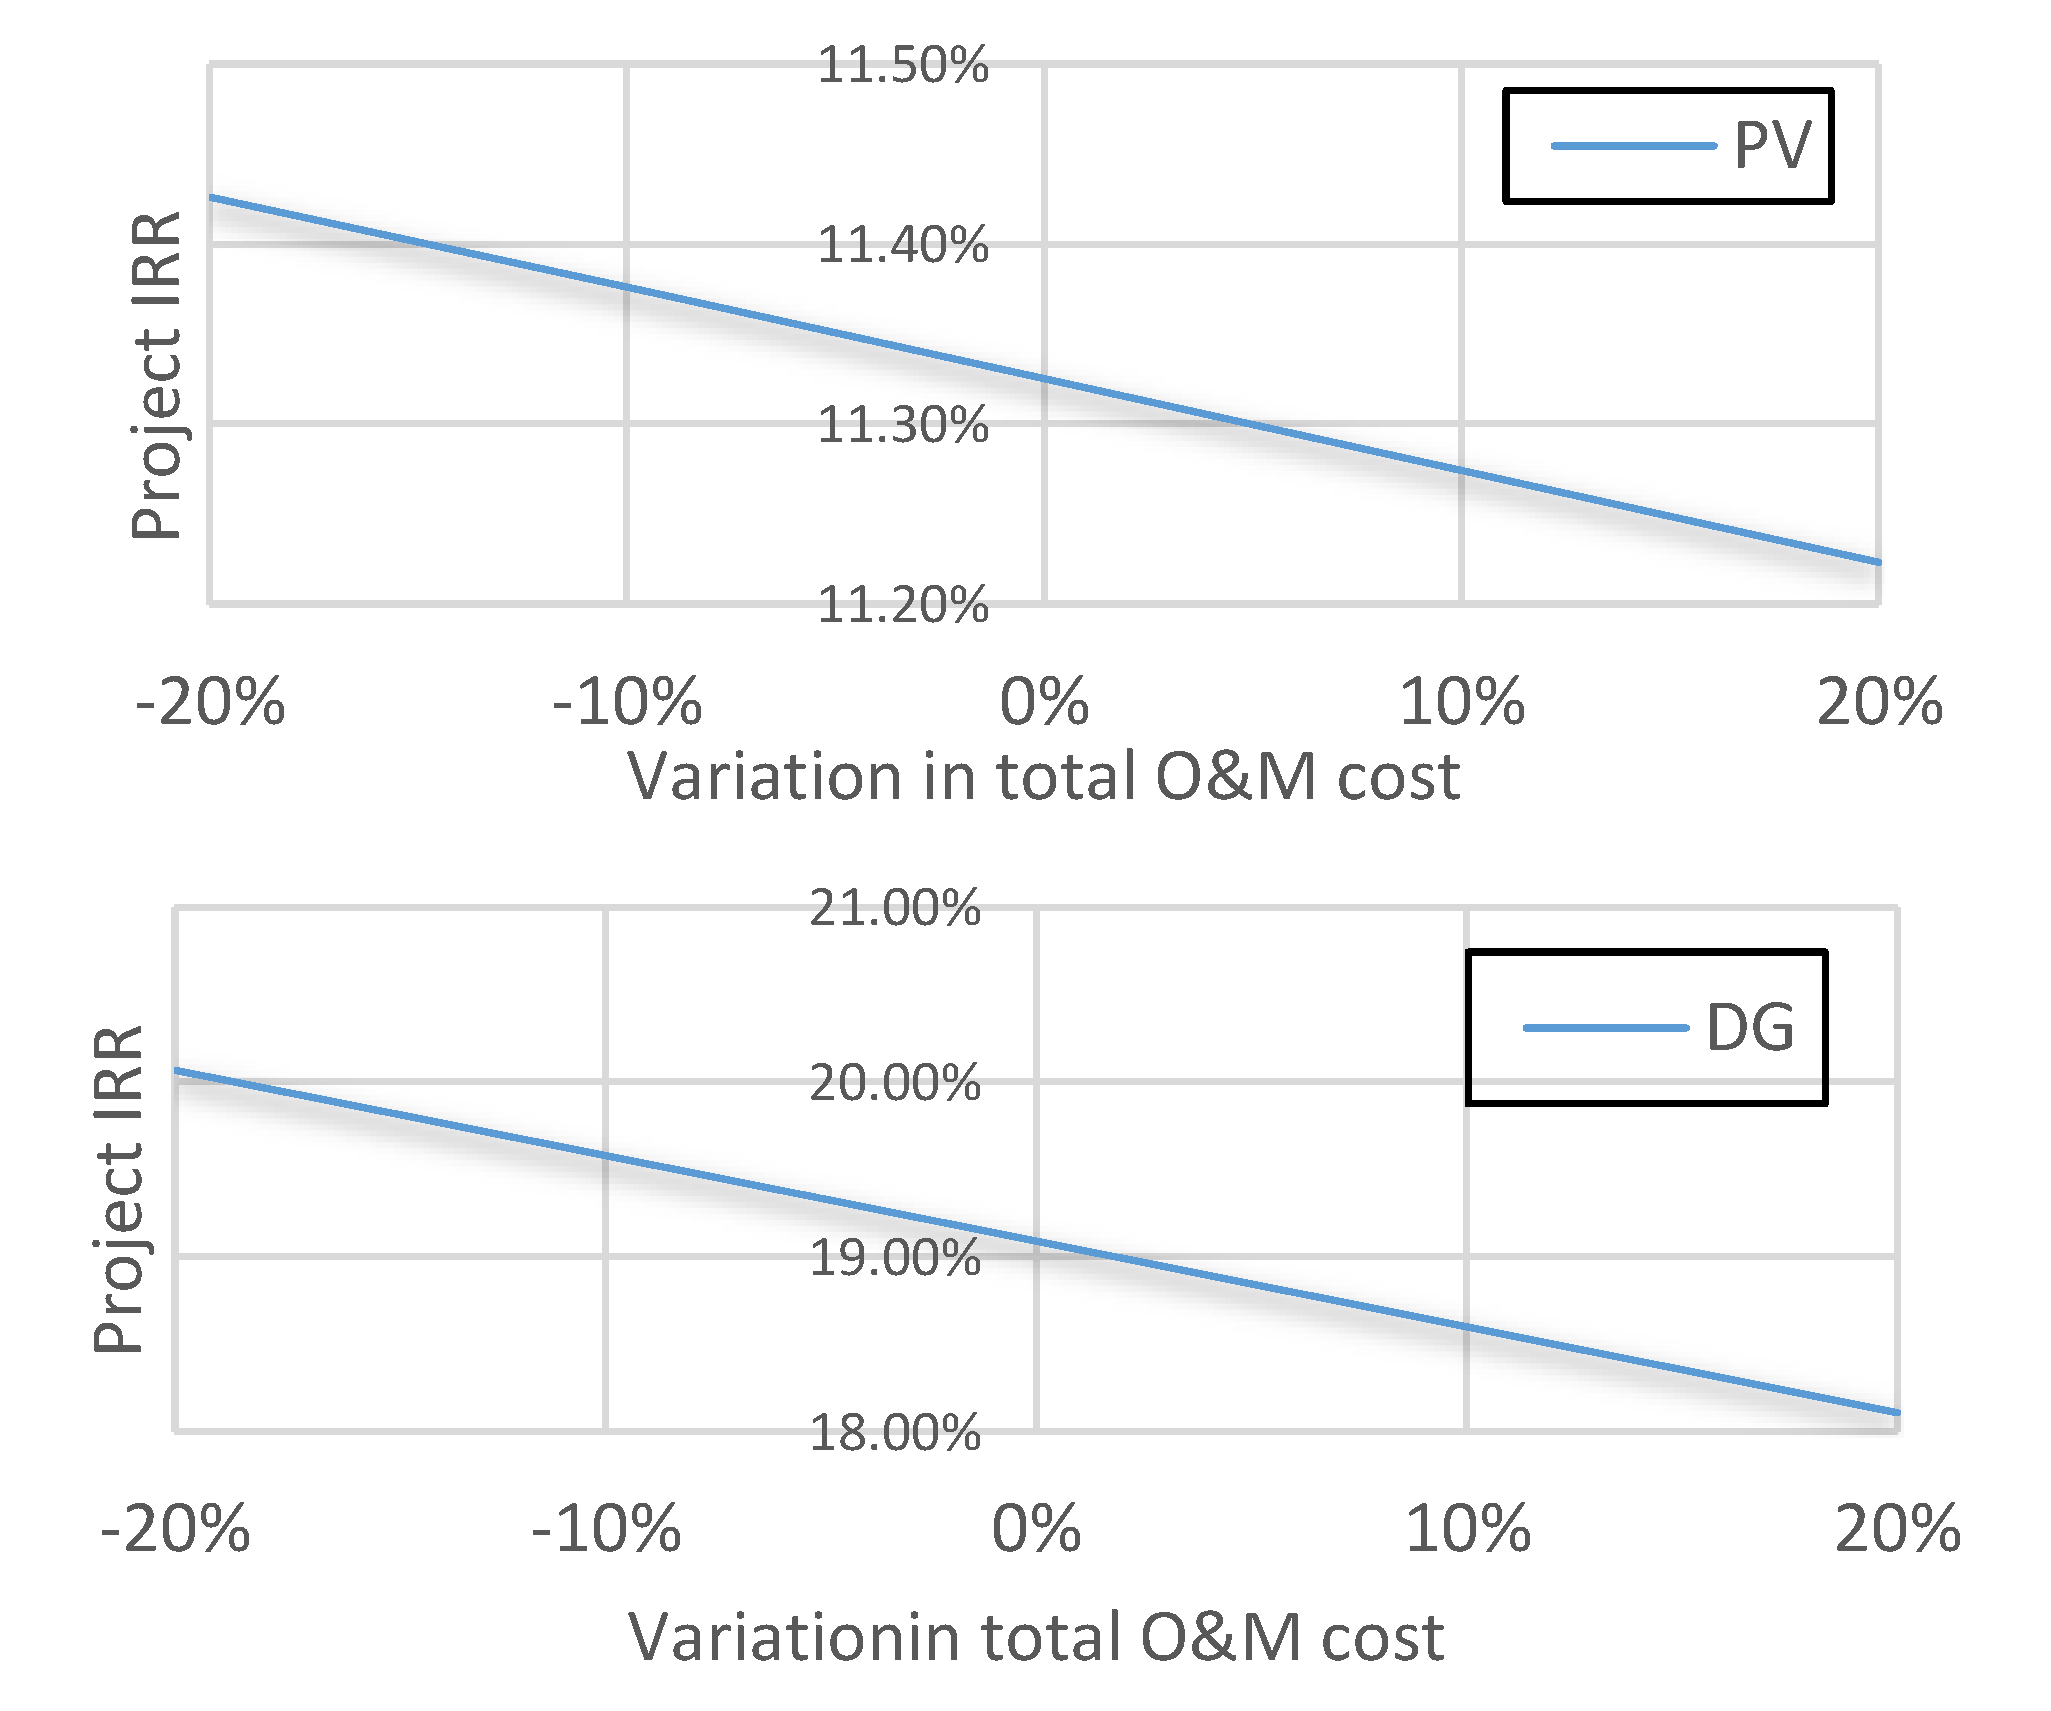
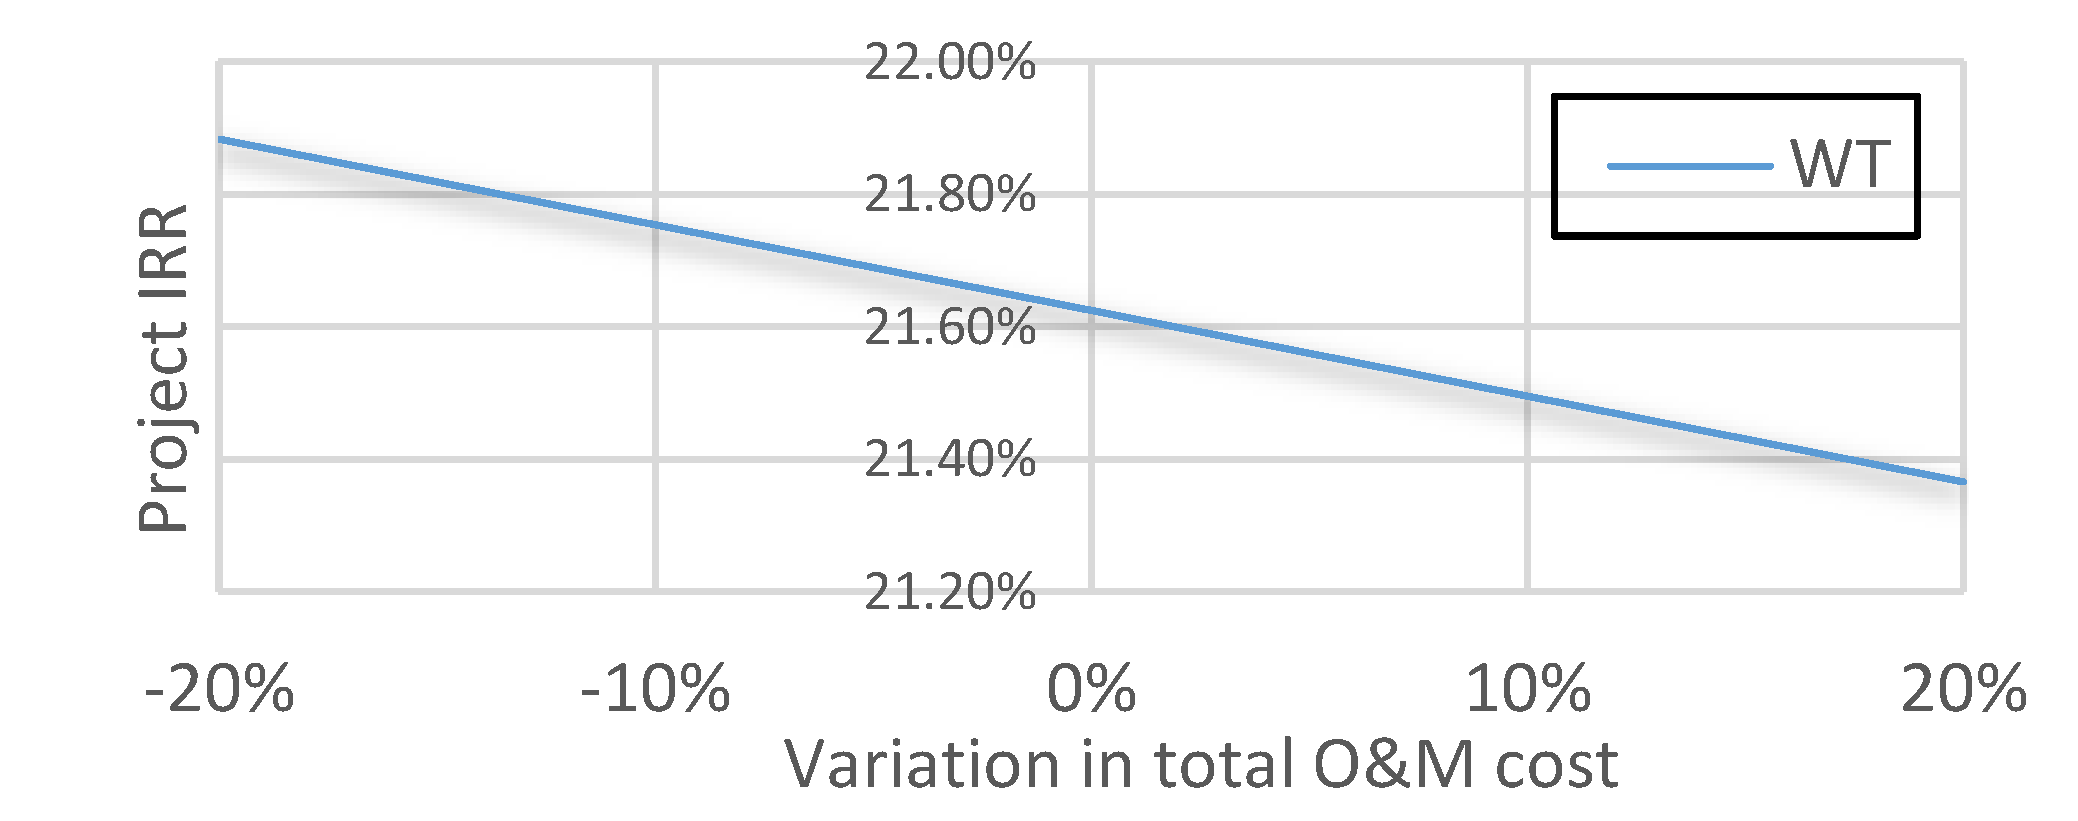
| Type | O&M Cost Variation | Project IRR | Status and Private IRR Accept only if (EquityIRR > Equity MARR) | Order | ∆IRR & Decision |
|---|---|---|---|---|---|
| PV | −20% | 11.43 | Reject: 10.38% | - | (WT,DG) = 33.59% > 14% Decision: Choose WT |
| WT | 21.88 | Accept: 27.96% | 2 | ||
| DG | 20.07 | Accept: 31.62% | 1 | ||
| PV | −15% | 11.40 | Reject: 10.35% | - | (WT,DG) = 34.67% > 14% Decision: Choose WT |
| WT | 21.82 | Accept: 27.81% | 2 | ||
| DG | 19.82 | Accept: 28.69% | 1 | ||
| PV | −10% | 11.38 | Reject: 10.32% | - | (WT,DG) = 35.74% > 14% Decision: Choose WT |
| WT | 21.75 | Accept: 27.67% | 2 | ||
| DG | 19.58 | Accept: 26.22% | 1 | ||
| PV | −5% | 11.35 | Reject: 10.28% | - | (WT,DG) = 36.81% > 14% Decision: Choose WT |
| WT | 21.69 | Accept: 27.53% | 2 | ||
| DG | 19.34 | Accept: 24.10% | 1 | ||
| PV | −2.5% | 11.34 | Reject: 10.27% | - | (WT,DG) = 37.35% > 14% Decision: Choose WT |
| WT | 21.66 | Accept: 27.46% | 2 | ||
| DG | 19.21 | Accept: 23.15% | 1 | ||
| PV | 0% | 11.33 | Reject: 10.25% | - | (WT,DG) = 37.88% > 14% Decision: Choose WT |
| WT | 21.62 | Accept: 27.39% | 2 | ||
| DG | 19.09 | Accept: 22.27% | 1 | ||
| PV | 2.5% | 11.31 | Reject: 10.23% | - | (WT,DG) = 38.42% > 14% Decision: Choose WT |
| WT | 21.59 | Accept: 27.32% | 2 | ||
| DG | 18.97 | Accept: 21.43% | 1 | ||
| PV | 5% | 11.30 | Reject: 10.22% | - | (WT,DG) = 38.96% > 14% Decision: Choose WT |
| WT | 21.56 | Accept: 27.25% | 2 | ||
| DG | 18.85 | Accept: 20.65 % | 1 | ||
| PV | 10% | 11.27 | Reject: 10.18% | - | (WT,DG) = 40.03% > 14% Decision: Choose WT |
| WT | 21.50 | Accept: 27.11% | 2 | ||
| DG | 18.60 | Accept: 19.17% | 1 | ||
| PV | 15% | 11.25 | Reject: 10.15% | - | (WT,DG) = 41.10% > 14% Decision: Choose WT |
| WT | 21.43 | Accept: 26.98% | 2 | ||
| DG | 18.35 | Accept: 17.92% | 1 | ||
| PV | 20% | 11.22 | Reject: 10.12% | - | (WT,DG) = 42.16% > 14% Decision: Choose WT |
| WT | 21.37 | Accept: 26.84% | 2 | ||
| DG | 18.11 | Accept: 16.71%: | 1 |
| Variation in price | −5% | −2.5% | 0 | 2.5% | 5% |
| Project IRR | 23.48% | 21.32% | 19.09% | 16.76% | 14.18% |
| Equity IRR | 22.78% | 22.52% | 22.27% | 22.01% | 21.75% |
| Order based on compared to other projects | - | 1 | 1 | 1 | 1 |
| Cannot be determined | 23.82% | 37.88% | 51.22% | 68.35% | |
| Decision | Follow benefit to cost ratio technique (Section 9) | WT | WT | WT | WT |
| |||||||
| Equity IRR% | Project IRR % | ||||||
| Depreciation | MACRS | Declining balance | Straight line | Depreciation | MACRS | Declining balance | Straight line |
| 1 MW WT | 28.50 | 32.05 | 27.55 | WT | 22.00 | 23.30 | 21.62 |
| 1 MW PV | 10.30 | 10.58 | 10.07 | PV | 11.48 | 11.58 | 11.18 |
| 1 MW DG | 22.85 | 24.65 | 22.16 | DG | 19.35 | 20.20 | 19.01 |
| Based on equity IRR | Reject PV | Reject PV | Reject PV | Incremental IRR | (WT, DG) = 39.80% | (WT, DG) = 45.99% | (WT, DG) = 38.99% |
| Decision | wind | wind | Wind | ||||
| |||||||
| Equity IRR% | Project IRR % | ||||||
| Depreciation | MACRS | Declining balance | Straight line | Depreciation | MACRS | Declining balance | Straight line |
| 1 MW WT | 27.39 | 31.80 | 26.18 | WT | 21.62 | 23.19 | 21.10 |
| 1 MW PV | 10.25 | 10.54 | 9.95 | PV | 11.33 | 11.55 | 11.08 |
| 1 MW DG | 22.27 | 24.44 | 21.30 | DG | 19.09 | 20.09 | 18.60 |
| Based on equity IRR | Reject PV | Reject PV | Reject PV | Incremental IRR | (WT, DG) = 37.88% | (WT, DG) = 45.88% | (WT, DG) = 37.27% |
| Decision | wind | wind | Wind | ||||
| |||||||
| Equity IRR% | Project IRR% | ||||||
| Depreciation | MACRS | Declining balance | Straight line | Depreciation | MACRS | Declining balance | Straight line |
| 1 MW WT | 25.57 | 31.95 | 25.12 | WT | 20.79 | 21.02 | 20.59 |
| 1 MW PV | 9.32 | 10.57 | 9.16 | PV | 10.62 | 11.58 | 10.49 |
| 1 MW DG | 20.75 | 24.61 | 20.39 | DG | 18.27 | 20.18 | 18.08 |
| Based on equity IRR | Reject PV | Reject PV | Reject PV | Incremental IRR | (WT, DG) = 36.98% | (WT, DG) = 28.23% | (WT, DG) = 36.74%. |
| Decision | wind | wind | wind | ||||
| |||||||
| Equity IRR% | Project IRR% | ||||||
| Depreciation | MACRS | Declining balance | Straight line | Depreciation | MACRS | Declining balance | Straight line |
| 1 MW WT | 27.39 | 27.09 | 25.75 | WT | 21.62 | 21.47 | 20.92 |
| 1 MW PV | 10.25 | 10.22 | 9.91 | PV | 11.33 | 11.27 | 11.02 |
| 1 MW DG | 22.27 | 22.50 | 21.15 | 24.61 | 19.09 | 19.19 | 18.52 |
| Based on equity IRR | Reject PV | Reject PV | Reject PV | Incremental IRR | (WT, DG) = 37.88% | (WT, DG) = 35.76% | (WT, DG) = 36.25% |
| Decision | wind | wind | wind | ||||
| |||||||
| Equity IRR% | Project IRR% | ||||||
| Depreciation | MACRS | Declining balance | Straight line | Depreciation | MACRS | Declining balance | Straight line |
| 1 MW WT | 27.39 | 27.09 | 25.90 | WT | 21.62 | 21.47 | 20.98 |
| 1 MW PV | 10.25 | 10.18 | 9.93 | PV | 11.33 | 11.25 | 11.04 |
| 1 MW DG | 22.27 | 22.49 | 21.25 | DG | 19.09 | 19.19 | 18.57 |
| Based on equity IRR | Reject PV | Reject PV | Reject PV | Incremental IRR | (WT, DG) = 37.88% | (WT, DG) = 35.76% | (WT, DG) = 36.41% |
| Decision | wind | wind | wind | ||||
© 2020 by the authors. Licensee MDPI, Basel, Switzerland. This article is an open access article distributed under the terms and conditions of the Creative Commons Attribution (CC BY) license (http://creativecommons.org/licenses/by/4.0/).
Share and Cite
Saad Al-Sumaiti, A.; Kavousi-Fard, A.; Salama, M.; Pourbehzadi, M.; Reddy, S.; Rasheed, M.B. Economic Assessment of Distributed Generation Technologies: A Feasibility Study and Comparison with the Literature. Energies 2020, 13, 2764. https://doi.org/10.3390/en13112764
Saad Al-Sumaiti A, Kavousi-Fard A, Salama M, Pourbehzadi M, Reddy S, Rasheed MB. Economic Assessment of Distributed Generation Technologies: A Feasibility Study and Comparison with the Literature. Energies. 2020; 13(11):2764. https://doi.org/10.3390/en13112764
Chicago/Turabian StyleSaad Al-Sumaiti, Ameena, Abdollah Kavousi-Fard, Magdy Salama, Motahareh Pourbehzadi, Srikanth Reddy, and Muhammad Babar Rasheed. 2020. "Economic Assessment of Distributed Generation Technologies: A Feasibility Study and Comparison with the Literature" Energies 13, no. 11: 2764. https://doi.org/10.3390/en13112764
APA StyleSaad Al-Sumaiti, A., Kavousi-Fard, A., Salama, M., Pourbehzadi, M., Reddy, S., & Rasheed, M. B. (2020). Economic Assessment of Distributed Generation Technologies: A Feasibility Study and Comparison with the Literature. Energies, 13(11), 2764. https://doi.org/10.3390/en13112764