Abstract
Although there are many studies available in literature about biomass pyrolysis or devolatilization using thermogravimetric analysis (TGA), the effects of important operating parameters have infrequently been investigated for pine wood particle combustion. Consequently, the present study investigates the influence of particle size (63 µm to 1 mm), heating rate (5 to 243 °C/min), and air flow rate (10 to 150 mL/min) on the mass loss of pine wood using TGA. Additionally, the kinetic parameters considering the different conditions were determined to be incorporated in a numerical model. The effect of the heating rate on the thermal decomposition behavior has shown that the thermogravimetric and derivative thermogravimetric curves were shifted to higher temperatures with the increase in the heating rate. In this way, the heating rate affects the temperature at which the highest mass loss rate occurs as well as its value. Furthermore, comparing the higher and lower heating rate, the time to complete the combustion and the release are around 22 times higher when a higher heating rate is applied. On the other hand, the effects of four different air flow rates were compared and similar results were obtained. Regarding the kinetic analysis, it was verified at various heating and air flow rates with different particle sizes that the highest activation energy was mostly obtained during char combustion (~131–229 kJ/mol). Furthermore, in the second stage higher heating rates had the highest reactivity, and in the third stage there were not too many changes. In terms of the effect of air flow rates, a maximum variation of 15 kJ/mol was obtained in the third stage and, therefore, no significant effect on the reactivity for all particles was found.
1. Introduction
Biomass is a renewable energy source and an important fuel for heating and power generation for two main reasons: it is an easily available renewable energy source and it is considered neutral in carbon dioxide emissions [1]. These are important factors since there is an energy dependence on fossil fuels, whose reserves are limited, and carbon dioxide emissions from these energy sources are related to global warming and the greenhouse effect. In this way, biomass appears to be a sustainable and alternative renewable energy source to contribute to a significant reduction in carbon dioxide in the atmosphere [2].
Combustion is an efficient technology to convert biomass into energy, making it the technology of choice for both conventional power plants and domestic boilers [3]. Particularly in Portugal, biomass has been widely used for power generation and pellet production over the last two decades in order to meet the targets defined by the government [4]. Since 2017—when devastating wildfires flogged the central and northern regions of Portugal—to now, new dedicated biomass power plants have been built with a total capacity of around 100 MW, and there are currently more than 20 solid biomass power plants delivering more than 600 MW to the national power grid [5]. Regarding the pellets’ production, there are more than twenty companies identified for the Portuguese National Pellets Association with an estimated consumption of more than 1.77 million tons of biomass [6]. Furthermore, Portugal is a country where the forest area is significant and represents about 36% of the territory, making Portugal a country with great potential for the exploitation of forest biomass [7]. Viana et al. [8] estimated that, in Portugal, the total amount of biomass averages around 1.097 million dry tons/year, with 579.91 thousand dry tons/year from maritime pine, the main solid biomass species of Portugal.
However, biomass combustion is a complex process that consists of various consecutive homogeneous and heterogeneous reactions: heating, drying, devolatilization (producing char and volatiles), volatiles combustion, and char combustion [9]. Therefore, it is important to understand the physical and chemical processes involved at the particle level to enable the proper understanding and modeling of small and/or large-scale biomass combustion systems in order to reduce pollutant emissions and improve the combustion efficiency [10,11]. To understand these phenomena, thermogravimetric analysis (TGA) is a powerful tool to study the devolatilization rate during the biomass combustion process and obtain important parameters which are essential in characterizing and understanding the behavior of biomass combustion [12,13]. TGA is a thermo-analytical method widely implemented to investigate and compare thermal degradation events and kinetics during the combustion of solid materials such as coal and biomass [14]. The decrease in mass is measured under controlled conditions while the thermal process is taking place, as the temperature along with the time increases. Non-isothermal experiments are generally adopted for the determination of kinetic parameters due to them being considered more reliable and less time-consuming when compared with isothermal experiments [15]. Moreover, TGA is very useful in studying the kinetics of biomass combustion because it is a simple and effective way to obtain information on the processes taking place for determining the kinetic parameters [16,17,18,19]. In addition, the ignition and burnout temperatures and the temperature at which biomass reaches its maximum combustion rate are important fuel parameters, especially in establishing the residence time in the combustion chamber. Such parameters can be determined from the first derivative of the TGA curve. However, there are several factors that affect the thermogravimetric and kinetic results, such as fuel type (physical and chemical composition of the samples), reaction conditions (heating rate and atmosphere), and the experimental data analysis methodology post-processing.
To date, several studies have considered these different parameters, including particle size [20,21,22] and heating rate [15,23,24,25,26,27,28,29,30,31,32,33,34,35,36,37,38,39,40], to study their influence on the thermal degradation behavior and kinetics. According to Vamvuka et al. [20], decreasing the oxygen concentration and increasing the particle size and moisture content will cause the ignition and burnout temperature to increase. Consequently, these variations will increase the residence time in the combustion chamber. Furthermore, Vamvuka et al. [20] reported that the composition of the gases, tars, and chars derived from biomass combustion depends on the heating rate and final temperature among other factors. Mani et al. [21] also investigated the influence of different parameters and found that the curves corresponding to the third stage of pyrolysis differ for variations in the particle size, initial weight, and heating rate of the pyrolysis process. Furthermore, an increase in the particle size and heating rate increases the char yield at the end of the experiments. Boriouchkine et al. [22] investigated the combustion of different particle sizes of spruce bark and wood residues. This study revealed that larger particles produced the highest maximum mass loss rate when compared to smaller particles. Regarding studies where the heating rate effect was studied, Yorulmaz et al. [31] analyzed the combustion kinetics of treated and untreated waste wood using TGA under three different heating rates. This study revealed that by increasing the heating rate, the peak and burnout temperatures for all the samples were also increased, and higher temperatures were detected for the same weight loss. Shen et al. [32] examined the effect of heating rate on the combustion of four different biomass species, and the experimental results were used to develop a two-step reaction kinetic scheme with activation energy values from different heating rate experiments. There have also been some studies that analyzed the effect of different heating rates on biomass decomposition under inert atmospheres [15,23,26,29,30,37,40]. However, as reported by Shen et al. [28] and Anca-Couce et al. [27], the presence of oxygen enhances biomass decomposition and promotes char combustion. Furthermore, the kinetic parameters derived from oxidative environments differ remarkably from experiments in the absence of oxygen [41]. Therefore, in order to simulate combustion conditions, it is important to study thermal behavior and kinetics in an oxygen atmosphere. In this sense, Kok and Özgür [24], Garcia-Maraver et al. [36], and Álvarez et al. [33] have studied the combustion behavior and kinetics of agricultural residuals. Soria-Verdugo et al. [35,39] have studied the validity of a kinetic model when the kinetic parameters from lower heating rate curves are extrapolated and used in applications such as industrial systems where higher heating rates are present. Additionally, the uncertainties of the experimental results were evaluated and a minimum of five different heating rates were needed in order to neglect the effect of uncertainties of the heating rate and temperature on the activation energy calculation.
Heating rate is one of the most relevant parameters in TGA as it affects thermal decomposition and, usually, experiments need to be performed with several heating rates in order to solve possible compensation effects [36]. In this way, the Kinetics Committee of the International Confederation for Thermal Analysis and Calorimetry recommends that no less than three different temperature programs should be applied to obtain quality kinetic data [42]. However, White et al. [43] reported that many factors could affect the kinetic parameters, including the process conditions, systematic errors, heterogeneity of the sample, heat and mass transfer limitations, and processing of the TGA results. Consequently, a wide range of kinetic parameters values have been reported in the literature and, therefore, direct comparisons are not possible. Furthermore, most of the TGA experiments have been performed under low heating rate conditions, and thus the kinetic parameters estimated from these experiments cannot be used in numerical models as thermal degradation in real equipment occurs at high heating rates [44].
The present work presents a parametric investigation including the variation in heating rate and air flow rate on thermogravimetric experiments, complemented by a kinetic analysis of the combustion of pine wood particles with different particle sizes. This works aims to evaluate the effect of different heating and air flow rates on combustion behaviour and kinetic parameters. Although there are several studies available in the literature about biomass pyrolysis and/or combustion using TGA, the effects of important parameters such as particle size, heating rate, and air flow rate have infrequently been investigated for pine wood particles. This is an important investigation, as understanding transport phenomena at particle level is central to the proper understanding and modeling of biomass combustion equipment and to provide valuable information for power and energy generation.
2. Materials and Methods
2.1. Materials
Commercial wood pellets, certificated according to the European Standard 14961-2 and ENPlus® A1, were milled into powdered samples and sieved into three different batches according to their particle size. Consequently, experimental tests with three particle sizes—smaller than 0.0063 mm, 0.125 up to 0.25 mm, and larger than 1 mm—were performed. The wood particles employed in this study are shown in Figure 1, and their composition is summarized in Table 1.
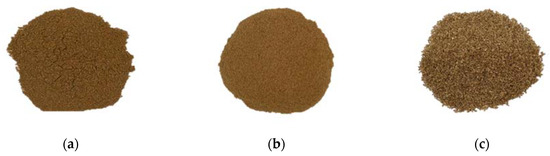
Figure 1.
Samples of the fuels used in the experiments: (a) < 0.063 mm, (b) 0.125 up to 0.25 mm, and (c) > 1 mm.

Table 1.
Elemental analysis of pine wood pellets.
The ultimate and proximate analysis values, as well as the calorific value of the pine wood samples, correspond to the samples obtained after the milling process. The proximate and ultimate analyses were performed according to the technical specification of European standards and the sulfur content of the samples was measured by a Leco TruSpec Series. The heating value measurement was also performed according to specific procedures from a standard and it was measured by a calorimeter, Leco AC500. The pine wood lower heating value estimated was 17.10 MJ/kg.
2.2. Experimental Approach
In TGA experiments, a wide combination of airflow and heating rates was applied. Regarding the heating rate, four levels were selected for all samples: 5, 10, 20, and 50 °C/min. Furthermore, the heating rates of 100 and 243 °C/min (maximum value of the equipment) were applied but only for a particle size of 0.125 up to 0.25 mm. In this set of experiments, dry air (H2O < 3 ppm) with a constant flow rate of 100 mL/min was used. However, experiments with air flow rates of 10, 50, and 150 were performed for the three different classes of particle size, while the heating rate was maintained at 10 °C/min. In all the experiments, the initial mass of the samples was approximately 6 ± 0.7 mg and the final temperature was 750 °C. The first initial condition was based on previous experiments that were performed to ensure there was no possible effect on the mass and heat transfer during the biomass decomposition. Regarding the final temperature value, experiments at higher temperatures beyond 750 °C were performed and there were no significant differences in the final mass, which ensured that any temperature increase did not contribute to the further weight loss of the sample.
Various parameters were measured and recorded along with the time using the TA INSTRUMENTS SDT 2960 simultaneous thermogravimetric and calorimetric analysis (DSC-TGA): the weight of the sample (mg), temperature (°C), and heat flow (W). The TGA and the derivative thermogravimetric curve (DTG) profiles obtained during the experiments enabled the identification of different key temperatures: initial decomposition (Tin), peak (Tmax), and burnout (Tb). Tin corresponds to the beginning of the weight loss and is defined as the temperature at which the rate of weight loss reaches 1%/min after the initial moisture loss peak in the DTG profile. Tmax is the point at which the maximum reaction rate occurs. Tb is identified when the last peak comes to the end and is the temperature at which the sample is completely oxidized. It is taken as the point immediately before the reaction ceases, when the rate of weight loss is down to 1%/min [45]. The ignition temperature (Tig) is obtained by applying the TG-DTG tangent methods [46].
Furthermore, these experiments enable the identification of the combustion rate and heat released at different temperatures and times. All this information allows the thermal decomposition characterization of the pine wood samples. The experimental procedure and the most important points are illustrated in Figure 2.
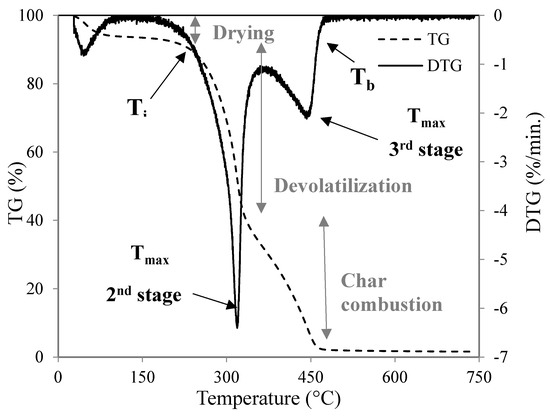
Figure 2.
Interpretation of the thermogravimetric and calorimetric analysis (DSC-TGA) results. Mass loss as a function of temperature (dashed line) and derivative thermogravimetric curve (DTG) curve (continuous line) during the combustion of wood.
Furthermore, these experiments allow the identification of the combustion rate and the heat released at different temperatures and times. All this information allows the characterizing of the thermal decomposition of the pine wood samples. In this way, in addition to the characteristic temperatures, two combustibility indexes from the mass loss rate data can be determined to provide a more accurate measure of the reactivity. The first one, the ignition index (D), indicates the ignition performance defining how fast or slowly the fuel is ignited. This index is defined by Equation (1) [20]:
where is the maximum mass loss rate (wt.%/min) and tmax and tig (min) are the times corresponding to the maximum combustion rate and ignition, respectively.
The second index, the combustion index (S), indicates the comprehensive characteristics of the fuel. The higher its values, the more significantly the samples are burned and the faster the char is burned out [47]. This index is defined by Equation (2):
where is the average mass loss rate (wt.%/min). These two indexes were calculated for all the samples to enable a more rigorous measure of the reactivity of each fuel in each particular condition since different heating and air flow rates were applied.
2.3. Determination of Kinetic Parameters
For understanding and modeling the biomass combustion in furnaces, knowledge of the biomass combustion kinetics is essential. Furthermore, this knowledge is also mandatory for the design and operation of biomass combustion equipment [48]. The solid-state transformation rate from solid-state to volatile products is generally described by Equation (3):
where t is the time; f(α) is a function called the reaction model, which describes the dependence of the reaction model on the conversion rate (α); and k is the thermal dependence term that can be defined by the Arrhenius equation (Equation (4)):
where E is the activation energy (kJ/mol), T is the absolute temperature (K), R is the universal gas constant (kJ/mol.K), and A is the pre-exponential factor (min−1). Regarding α, this can be defined as a relation between the initial (m0), final (mf), and instantaneous (mt) sample mass. These data can be obtained from each thermogravimetric experiment and defined by Equation (5):
For non-isothermal experiments, at a constant heating rate (β = dT/dt), Equation (3) can be expressed as a function of temperature at a constant heating rate:
The experimental conditions and reaction stage are used to study the influence of the reaction model. However, as it is considered a first order reaction, this function can be expressed as (1 − α) [46,49]. After this consideration, Equation (6) can be simplified as:
The left side of Equation (7) is a function of the conversion rate and the right side is a function of the temperature. By integrating both sides of Equation (7), Equation (8) is obtained:
Equation (8) has no exact solution and there are two main mathematical approaches to solve Equation (8) and obtain the kinetics data from the thermogravimetric analysis: 1) model-free methods and 2) model-based methods [36]. The Coats–Redfern method, from the model-based method category, has been frequently used and is considered appropriate for the calculation of the frequency factor, apparent reaction order, and activation energy [15,33,36,50,51]. Therefore, the Coats–Redfern method is the model applied in this work. The model uses the asymptotic series expansion for approximating the exponential integral in Equation (8) [52]. According to this model, the kinetic parameters can be determined by Equation (9):
The term 2RT/E can be considered much lower than one and, therefore, it can be neglected. With this assumption, Equation (9) can be expressed as:
According to Equation (10), a plot of the term in the left side versus 1/T corresponds to a straight line with a slope −E/R and an intercept of ln (AR/βE), from which the values of E and A can be obtained. This method can be applied to the second stage (between Tin and the temperature between the 2nd and 3rd peak), where the release and combustion of volatile matter occurs, to the third stage (the temperature between the 2nd and 3rd peak and Tb), which is the char combustion and overall range (between Tin and Tb).
3. Results and Discussion
3.1. Combustion Analysis
The experiments using TGA, as mentioned before, were performed with different heating and air flow rates to study their influence on the thermal decomposition as a function of different particle sizes. The next sections will present the results.
3.1.1. Influence of the Heating Rate
One of the significant factors in the thermal decomposition of pine wood particles is the heating rate. In this way, to analyze its effect Figure 3a–c presents the variation in mass loss during combustion in a thermogravimetric (TG) curve (dashed lines) and shows the heat flow (continuous lines) during the experiment for the three pine wood particle sizes examined. The first derivative of the TG curve—called a derivative thermogravimetric (DTG) curve—showing the rate of change in mass is also presented in Figure 3d–f. Based on the TG, DTG, and heat flow curves, the characteristic temperatures and characteristic parameters of the combustion process for each particle size under all heating rates were determined. All these parameters are presented in Table 2 and Table 3. These data include the most relevant variables that identify the various transitions occurring during the couplet combustion of biomass.
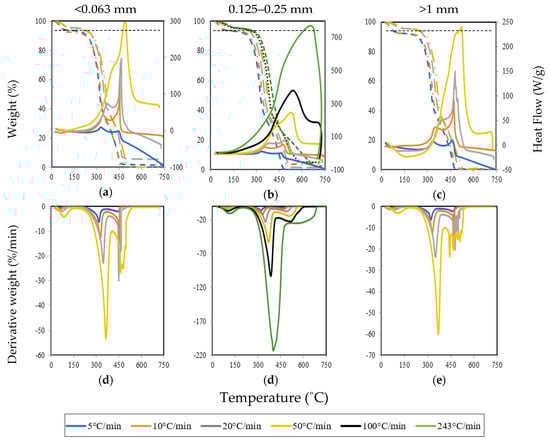
Figure 3.
Thermogravimetric (TG) and heat flow ((a), (b), and (c)) and DTG ((d), (e), and (f)) profiles for the different particle sizes under different heating rates.
Table 2.
Characteristic temperatures and burnout time for all particle sizes under different heating rates.
Table 3.
Characteristic parameters obtained from the DTG and heat flow curves.
The dashed lines in Figure 3a–c allow the identification of three different stages of biomass combustion: moisture evaporation (drying), devolatilization, and char combustion. It is possible to observe that the heating rate affects the behavior of the weight loss curves. The figures also include a horizontal dashed line at the moisture content of the samples (≈7%). As can be observed in Figure 3d–f, the thermal decomposition for all the particle sizes examined starts at approximately 260 °C for lower heating rates and 211 °C for higher heating rates. Therefore, as the heating rate increases, the initial decomposition temperature decreases. This is because, at low heating rates (<10 °C/min), the heat release took place at a slower rate and allowed enough time for water to be removed completely from the sample.
However, at higher heating rates (>20 °C/min), the initial decomposition starts at a lower temperature, as increasing the heating there is not enough time for the moisture to be fully removed from the sample and, therefore, the drying phase is controlled by the water diffusion inside the biomass structure. This was indicated by the mass loss of the sample that is below 7% after the initial decomposition.
A major mass loss follows, where the main devolatilization occurs with a maximum combustion rate between 319 to 365 °C for particles smaller than 0.063 mm—321 to 401 °C for particles between 0.125 and 0.25 mm and from 321 to 369 °C for particles larger than 1 mm. In this way, as the particle size and heating rate increase, the maximum combustion rate increases, although the effect of the heating rate is stronger. This means that the residence time of the sample in the furnace decreases with an increasing heating rate.
Furthermore, during the thermal decomposition, as can be observed in the heat flow curves, there are two different exothermic reaction regions. The first region is associated with the combustion of the light volatile matter which provides the reactivity of biomass fuels. The second region is associated with the char combustion [33]. Consequently, heat, in general, is released between approximately 300 °C and 500 °C, reaching the highest value close to 450 °C for all pine wood particles analyzed at lower heating rates (5, 10, and 20 °C/min). However, for higher heating rates, as in the case of 243 °C/min, the temperature range is wider and the highest value is close to 680 °C. Therefore, according to the DTG curves, as presented in Figure 3d–f, when the heating rate was increased, the thermal decomposition peaks were shifted to a higher magnitude. According to Kok and Özgür [24], the reason for these shifts is due to the different heat transfer and kinetic rates delaying the sample decomposition. Additionally, as the thickness of the gas cushion around the particle and the intensity of degassing increase, a temporary slow-down in the intensity of convective heat transfer to the interior of the particle occurs [53]. Another effect is that heat transfer is not as effective and efficient at slower heating rates and, therefore, the minimum heat required for particles’ cracking is reached later at higher temperatures [21]. Conversely, at lower heating rates, the heating of pine wood samples occurs more slowly, leading to a better heat transfer to the particles and, consequently, a more effective fuel cracking. The heat flow was higher at higher heating rates and the temperatures at which the maximum heat flow occurred corresponded to the char combustion stage where the volatiles were almost completely oxidized.
The peak temperature in the DTG curves is a measure of the reactivity of the char. As the peak temperature decreases, the easier the ignition of the pine wood particles will be. The combustion reactivity regions are proportional to the height of the DTG peak and, therefore, at higher heating rates a more reactive combustion takes place. The reactivity is due to the combustion of the volatiles and the energy released is mainly due to the combustion of the fixed carbon, as can be concluded from the third peak of the heat flow curves for all the pine wood particles examined.
However, when it is applied higher heating rates on large particles, as can be observed in Figure 3b,c, only one peak is visible. In such conditions, the heat released was very high, the material reached high temperatures in less time, and the thermal decomposition started earlier than at lower heating rates (see Table 2). For instance, at 243 °C/min, the time to complete the combustion was only about 4 minutes. It is also observed that, as the heating rate increases, there is a shift to higher ignition temperatures. This increase in temperature is independent of the particle size, which suggests that the temperature gradients inside the sample push the initiation of the decomposition to higher temperatures [54]. This is a result of the decrease in the heat transfer efficiency in the sample [20,54]. Furthermore, the combustion rate and temperatures of the second and third peak in the DTG curves increase significantly with the heating rate. Consequently, the maximum combustion rate increases as the heating rate increases and, therefore, the heat released during the experiments also increases. It is important to note that similar results were obtained for all particle sizes.
Also, increasing the heating rate increases the residue at the end of the experiments, as revealed by Mani et al. [21]. However, as presented in Figure 4, this feature was not observed in the present work, which shows that there is no consistent trend as far as the heating rate is concerned.
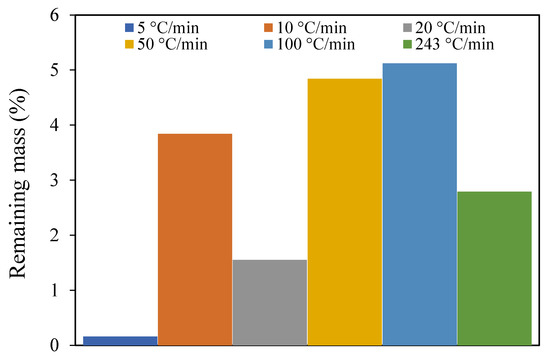
Figure 4.
Remaining mass at different heating rates for particles between 0.125 and 0.25 mm.
This result may be influenced by the uncertainty either from the instruments or the random selection of the sample from the batch of pine wood samples. To verify the randomness hypothesis, three tests with the same conditions at 10 °C/min, 100 mL/min, and the middle particle size range (0.125 and 0.25 mm) were conducted. Figure 5 presents the results of the three different experiments and the different values of the remaining mass that were obtained. This observation approves the previous hypothesis as the effect of the randomness in the sample.
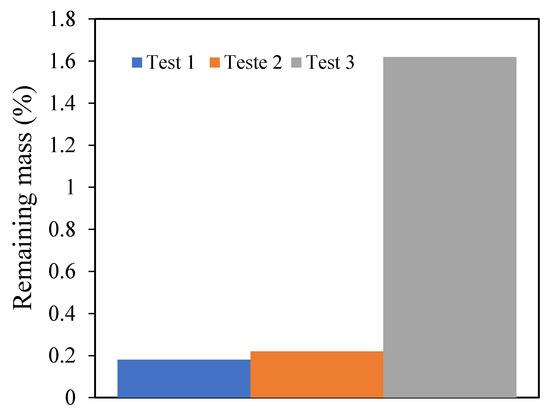
Figure 5.
The remaining mass of the three tests in the same condition with the middle particle size.
Following the procedure previously described, the ignition (D) and combustion (S) indexes are presented in Figure 6 for different heating rates. The results show that the D index is correlated with the Tig. Higher ignition indexes were observed when a better ignition performance was obtained. The S value also follows a similar trend, where the value increases with the increasing heating rate. Furthermore, as reported by Vamvuka et al. [20], there was no significant effect of particle size on the ignition and combustion indexes.
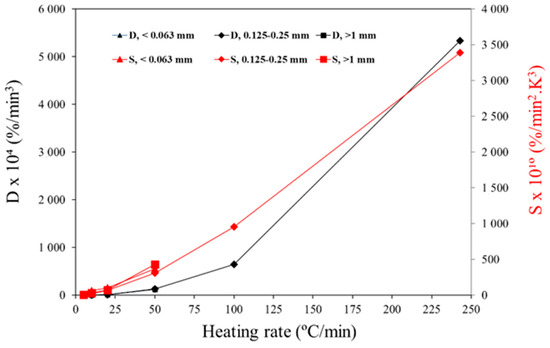
Figure 6.
Combustion indexes of the pine wood particles at different heating rates.
3.1.2. Influence of the Air Flow Rate
Figure 7 presents the TG, DTG, and heat flow curves for the three pine wood particle sizes at four different air flow rates: 10, 50, 100, and 150 mL/min. Based on the TG and DTG curves, the characteristic temperatures and characteristic parameters of the combustion process for each particle size under all air flow rates were determined. All these parameters are presented in Table 4 and Table 5.
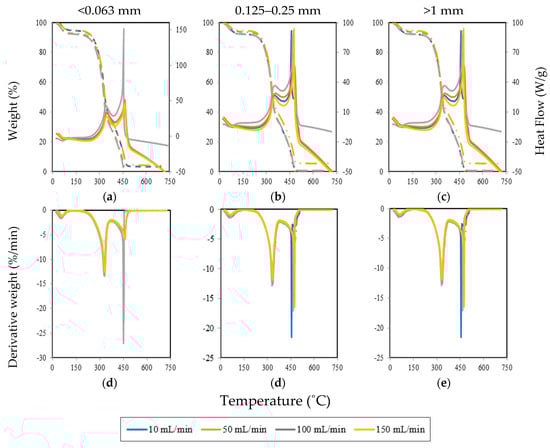
Figure 7.
TG and heat flow ((a), (b), and (c)) and DTG ((d), (e), and (f)) profiles for the different particle sizes under different air flow rates.
Table 4.
Characteristic temperatures for all the particle sizes under different air flow rates.
Table 5.
Characteristic parameters obtained from the DTG and heat flow curves.
The dashed lines in Figure 7a present the mass loss for particles smaller than 0.063 mm. It is possible to see that the mass loss at different air flow rates has similar behavior. However, after the devolatilization stage, there are differences between the mass loss behavior. In this way, at an air flow rate of 50 and 100 mL/min, the mass loss occurred earlier when compared with other air flow rates. These differences can be seen in the DTG profile in Figure 7d–f in the second peak for the 100 mL/min air flow rate. Therefore, at 100 mL/min during the char combustion, the mass loss increased and, consequently, in the heat flow curve (continuous lines of Figure 7) it is possible to see that more heat was released at 100 mL/min during the devolatilization and char combustion stages.
For particles between 0.125 and 0.25 mm, similar results were obtained (Figure 7b,e). However, during char combustion, the mass loss is independent of the air flow rate and the heat flow decreases significantly when compared with the results presented previously for 100 mL/min. Furthermore, as can be seen in Figure 7b, at 50 mL/min the heat flow was higher, which means that increasing the particle size caused the air flow rate necessary to release more energy to be lower.
Regarding the experimental results with particles larger than 1 mm, in Figure 7c,e at 10 and 100 mL/min, the mass loss during the drying process occurred earlier and during devolatilization and char combustion the mass loss was slower, at 150 mL/min. Figure 7f, at the second peak, presents a similar trend, as the results were obtained with particles smaller than 0.063 mm. However, the second peak occurred at 100 mL/min and also at 10 mL/min and 150 mL/min. Consequently, the heat flow curve (Figure 7c) displays a higher value at the second peak for 10, 100, and 150 mL/min.
It should be noted that although the maximum heat flow peak is higher in the case of particles smaller than 0.063 mm at 100 mL/min, more heat was released in the experiments with particles greater than 1 mm for various airflows rate in this study, except at 50 mL/min. From these results, it can be said that there is a negligible influence of the airflow rate on the thermal decomposition of the biomass particles. The main devolatilization occurs at a maximum combustion rate between 328 to 332 °C for particles smaller than 0.063 mm, 332 to 334 °C for particles between 0.125 and 0.25 mm, and 330 to 335 °C for particles larger than 1 mm. In this value, as the particle size and airflow rates increase, the maximum combustion rate increases slightly. This may result from the surface area of the particle, where an increase in the surface area of the particles minimizes the mass and heat transfer limitations and improves the conversion efficiency [55].
However, as presents in Table 5, the heat released was in general higher when the air flow rate of 100 mL/min was applied to the different particle sizes. Consequently, with this air flow rate the oxidation took place close to the stoichiometric conditions and, with the other values, the combustion happened in an excess of comburent in the case of 150 mL/min and with a lack of stoichiometric comburent in the remaining cases.
Regarding the ignition and combustion indexes, Figure 8 presents their variation with different air flow rates used in the experiments with distinct particle sizes. The results show that there is no consistent trend regarding the effect of increasing and/or decreasing the air flow rate on the indexes. However, an interesting trend was observed when decreasing the particle size, as higher values of the combustion indexes were obtained for high air flow rates. For instance, for particles smaller than 0.063 mm the ignition and combustion indexes were higher for 100 mL/min, while for particles larger than 1 mm the highest indexes were observed for 10 mL/min.
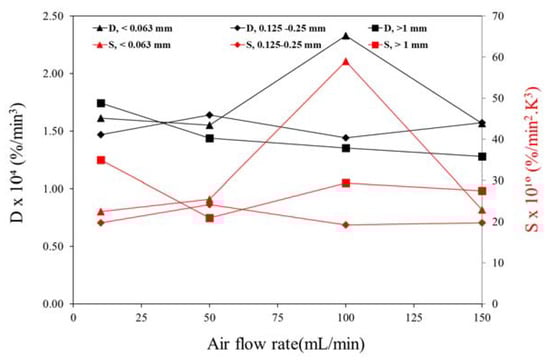
Figure 8.
Combustion indexes of the pine wood particles at different heating rates.
3.2. Kinetics Analysis
A kinetic analysis of the biomass combustion using the TGA for different heating and air flow rates to study their influence on the thermal decomposition of different particle sizes was performed. The kinetic parameters of the second stage and third stage of the biomass combustion process were determined based on the first order Coats–Redfern method. Figure 9 presents the application of the method followed to determine the kinetic parameters. This method can be applied separately to the second or the third stages (defined by the first temperature and second temperature peaks, respectively) or to the overall temperature range. The second stage data are highlighted by a dashed line, the third stage data by a dashed dot line, and the global combustion data by a continuous line. A linear regression curve was determined for each stage to obtain the first-order equation that will allow determining the kinetic parameters. In the following sub-sections, the kinetic results are presented for different operating conditions.
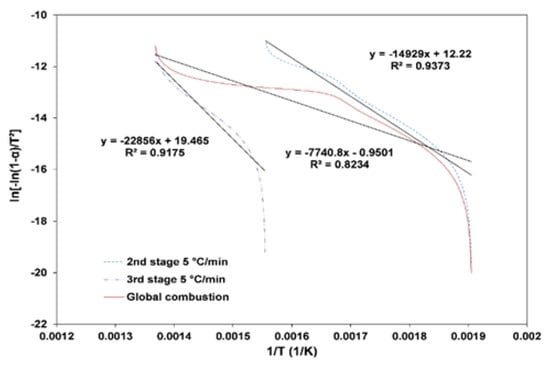
Figure 9.
Illustration of the method used to determine the kinetic parameters.
3.2.1. Influence of the Heating Rate
The dependence of the activation energy on the heating rate was significant, and it is illustrated in Figure 10 for all particle sizes. As can be observed in Figure 10, the activation energy value in the second stage decreases with increasing the heating rate. This means that the reaction occurs faster if we increase the heating rate because, as the heating rate increases, the heat transfer inside the particle is enhanced, causing the reactivity of the biomass and its constituents to increase [36]. Regarding the third combustion stage, higher activation energy values than in the second stage were obtained, which indicates a slower reactivity. Similar results were obtained by Garcia-Maraver et al. [36] and Álvarez et al. [33]. This condition was observed for all different particle sizes. However, for this last combustion stage, there was no general trend of the heating rate effect. For instance, for particles smaller than 0.063 mm the activation energy value increased with increasing the heating rate, except for a heating rate of 10 °C/min, while for particles larger than 1 mm the opposite effect was obtained. On the other hand, for the intermediate particle size, the activation energy value fluctuated substantially when the heating rate was increased.
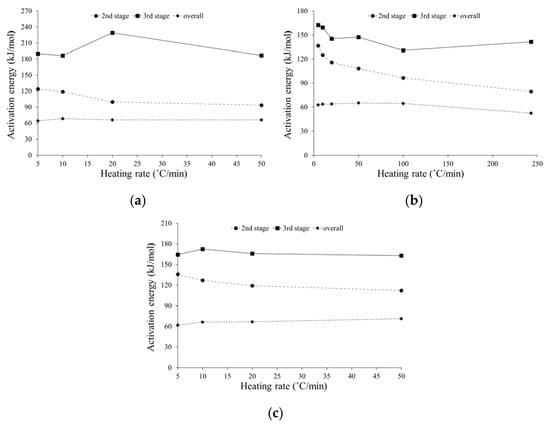
Figure 10.
Estimated activation energy as a function of the heating rate for: (a) particles lower than 0.063 mm, (b) particles between 0.125 and 0.25 mm, and (c) particles larger than 1 mm.
Furthermore, Table 6 presents the temperature range, pre-exponential factor, and correlation coefficient obtained using the Coats–Redfern method for each combustion stage, including the overall one. It can be seen from Table 6 that the correlation coefficient is very high for all the heating rates evaluated, so it shows that the first order kinetic model revealed a good data fit for all the fuel samples (R2 > 0.90) and, therefore, can be considered feasible. However, for the overall process the correlation coefficient is not as good (R2 > 0.80).
Table 6.
Temperature intervals, correlation coefficients, and pre-exponential factors for each stage of combustion for all particles studied under different heating rates.
Regarding the pre-exponential factor for both the second and third combustion stages, when the heating rate was increased this value decreased. As with the previous observations for the activation energy values in the different combustion stages, higher values of the pre-exponential factor in the third stage were recorded.
3.2.2. Influence of the Air Flow Rate
The influence of four different air flow rates on the activation energy for three different particle sizes is presented in Figure 11. Table 7, as in the previous section, also presents the temperature range, pre-exponential factor, and correlation coefficient obtained using the Coats–Redfern method.
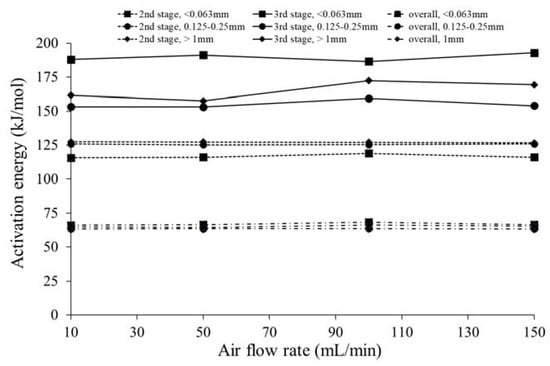
Figure 11.
Estimated activation energy as a function of the air flow rate for the three different particle sizes.
Table 7.
Temperature intervals, correlation coefficients, and pre-exponential factors for each stage of combustion for all particles studied under different air flow rates.
In general, for all the particle sizes and combustion stages, the effect of different air flow rates on the activation energy values was marginal and there was no direct relationship between the activation energy and air flow rate. The value of activation energy in the second stage and overall combustion was not too different. In the third stage for the different particle sizes, the activation energy did not show a clear trend. In addition, only the smallest of the particles showed an activation energy that was significantly different from the other sizes for the second and third stages, although the influence on the overall value was negligible. From the data, it is observed that in the second stage (early step of devolatilization at a lower temperature), the smaller particles were the most reactive, while the large ones exhibited the highest activation energy. As the presence of lignin is associated with lower decomposition rates, it was expected that the fine grinding of biomass may break the larger molecules of lignin and so contribute to a higher reactivity [56]. Harun et al. [57] stated that less collision occurs by increasing the particle sizes and therefore a slower reaction will take place, thus causing the thermal degradation characteristics and kinetic parameters to decrease, regardless of the reaction zones.
As can be seen in Table 7, similar trends were obtained for the pre-exponential factor, except for particles with a size between 0.125 and 0.25 mm in the transition from 10 mL/min to 50 mL/min, where there was a change in the order of magnitude of this parameter. Furthermore, for the third combustion stage in all particles studied, there were some variations in the pre-exponential factor when the air flow rate increased, but there was no direct influence of the air flow rate on the pre-exponential factor.
4. Conclusions
This paper presented an analysis of the effect of different operating conditions on the thermal decomposition in the air atmosphere of pine wood particles complemented by kinetic analysis. In this way, a widespread method such as TGA was performed to investigate and understand the transport phenomena at the particle level with different operating conditions. In this research work:
- The thermal decomposition was analyzed by changing the particle size (from 63 µm up to more than 1 mm), air flow rate (10, 50, 100, and 150 mL/min), and heating rate (5, 10, 20, 50, 100, and 243 °C/min);
- The biomass used in the experiments was derived from certified commercial wood pellets that were milled into powdered samples;
- The kinetics was evaluated through the Coats–Redfern method and considering the first-order reaction. This method was applied to the second stage (devolatilization), the third stage (char combustion), and to the overall combustion stage.
The results and key findings led to the following conclusions:
- With TGA, it was possible to identify three different phases that occur during the combustion of the particles. These phases are related to the drying, devolatilization, and char combustion steps.
- The TG and DTG curves presented different mass loss characteristics that were influenced mainly as the heating rate increased and they led to different kinetic parameters. A comparison between the different heating rates presented a small displacement of the DTG profiles to higher temperatures. For instance, the thermal decomposition for all particle sizes examined started at approximately 260˚C for lower heating rates and at 211 °C for higher heating rates.
- It was possible to observe that the duration of devolatilization was shorter when compared to drying and char combustion and decreased with an increasing heating rate. It was also observed that the particle size influenced the heat flow and, consequently, the energy released during the experiments. For instance, at 243 °C/min, the time to complete the combustion was only about 4 minutes, while around 90 minutes were necessary at 5 °C/min. Furthermore, the heat released in the experiment at 243 °C/min was 22 times higher than the experiment with the lower heating rate.
- The effect of the heating rate was more noticeable when compared to the effect of the air flow rate. The weight loss curve for the three particle sizes had almost the same behavior except during the drying and char combustion stage; there were slight differences for different air flow rates. In this way, with middle air flow rates—50 and 100 mL/min—the mass loss occurred earlier. However, during the char combustion, the mass loss increased and, consequently, in the heat flow curve it was possible to see that more heat was released at the 100 mL/min air flow rate during the devolatilization and char combustion stage.
- Regarding the kinetic study for various air flow and heating rates with different particle sizes, the highest activation energy was mostly obtained during the third stage (~131–229 kJ/mol). For the second stage and for all particles analyzed, through increasing the heating rate lower values were obtained. This means that the reaction occurred faster if we increased the heating rate because, as the heating rate increased, the heat transfer inside the particle was enhanced. Therefore, the heating rate has a significant effect on the activation energy and the pre-exponential factor values.
- For the experiments with different air flow rates, no significant effect of different air flow rates on the reactivity for all particles were observed. For instance, in the second stage a maximum difference of 3 kJ/mol was verified when compared the effect of the air flow rate on samples with the same size. However, in the third stage higher variations were identified (~15kJ/mol).
Author Contributions
Conceptualization, L.G.F., J.S., J.T., M.F.; methodology, L.G.F., J.S., J.T., D.S.; investigation, L.G.F., J.S.; writing—original draft preparation, L.G.F., J.S., J.T., S.T.; writing—review and editing, L.G.F., J.S., J.T., S.T.; supervision, J.T., M.F., D.S. All authors have read and agreed to the published version of the manuscript.
Funding
This work was supported by Portuguese Foundation for Science and Technology (FCT) within the R&D Units Project Scope UIDB/00319/2020 (ALGORITMI), R&D Units Project Scope UIDP/04077/2020 (MEtRICs) and R&D Units Project Scope UIDB/04436/2020 (CMEMS).
Acknowledgments
The second author would like to express his gratitude for the support given by FCT through the PhD Grant SFRH/BD/130588/2017.
Conflicts of Interest
The authors declare no conflict of interest.
Nomenclature
| A | pre-exponential factor, min−1 |
| D | ignition index, %/min3 |
| E | activation energy, kJ/mol |
| k | rate of the chemical reaction, min−1 |
| m | mass, mg |
| R | universal gas contant, kJ/(mol.K) |
| S | combustion index, %/(min2·K3) |
| t | time, min−1 |
| T | temperature, °C |
| Greek symbols | |
| α | conversion rate, - |
| β | heating rate, °C/min |
| Subscripts and superscripts | |
| 0 | initial |
| 2 | second peak |
| 3 | third peak |
| a | air |
| avg | average |
| b | burnout |
| f | final |
| ig | ignition |
| in | initial decomposition |
| max | maximum |
| t | time |
References
- Saidur, R.; Abdelaziz, E.A.; Demirbas, A.; Hossain, M.; Mekhilef, S. A review on biomass as a fuel for boilers. Renew. Sustain. Energy Rev. 2011, 15, 2262–2289. [Google Scholar] [CrossRef]
- Mandova, H.; LeDuc, S.; Wang, C.; Wetterlund, E.; Patrizio, P.; Gale, W.; Kraxner, F. Possibilities for CO2 emission reduction using biomass in European integrated steel plants. Biomass Bioenergy 2018, 115, 231–243. [Google Scholar] [CrossRef]
- Malico, I.; Pereira, R.N.; Gonçalves, A.C.; Sousa, A. Current status and future perspectives for energy production from solid biomass in the European industry. Renew. Sustain. Energy Rev. 2019, 112, 960–977. [Google Scholar] [CrossRef]
- Enes, T.; Aranha, J.; Fonseca, T.F.; Lopes, D.; Alves, A.; Lousada, J. Thermal properties of residual agroforestry biomass of northern portugal. Energies 2019, 12, 1418. [Google Scholar] [CrossRef]
- DGEG, Direcção Geral de Energia e Geologia. Renováveis-Estatíticas Rápidas No 181, 2020; DGEG: Lisbon, Portugal, 2020.
- Ferreira, S.; Monteiro, E.; Brito, P.; Vilarinho, C. Biomass resources in Portugal: Current status and prospects. Renew. Sustain. Energy Rev. 2017, 78, 1221–1235. [Google Scholar] [CrossRef]
- ICNF. 6o Inventário Florestal Nacional - Áreas dos usos e das espécies florestais de Portugal Continental. 2015. [Google Scholar]
- Viana, H.; Cohen, W.B.; Lopes, D.; Aranha, J. Assessment of forest biomass for use as energy. GIS-based analysis of geographical availability and locations of wood-fired power plants in Portugal. Appl. Energy 2010, 87, 2551–2560. [Google Scholar] [CrossRef]
- Williams, A.; Jones, J.; Ma, L.; Pourkashanian, M. Pollutants from the combustion of solid biomass fuels. Prog. Energy Combust. Sci. 2012, 38, 113–137. [Google Scholar] [CrossRef]
- Silva, J.P.; Teixeira, J.; Teixeira, S.; Preziati, S.; Cassiano, J. CFD modeling of combustion in biomass furnace. Energy Procedia 2017, 120, 665–672. [Google Scholar] [CrossRef]
- Silva, J.; Fraga, L.; Ferreira, M.E.; Chapela, S.; Porteiro, J.; Teixeira, S.F.C.F.; Teixeira, J. Combustion modelling of a 20 kW pellet boiler. Energy 2018, 6, 36. [Google Scholar] [CrossRef]
- Biagini, E.; Guerrini, L.; Nicolella, C. Development of a variable activation energy model for biomass devolatilization. Energy Fuels 2009, 23, 3300–3306. [Google Scholar] [CrossRef]
- Fraga, L.; Silva, J.; Soares, D.; Ferreira, M.; Teixeira, S.; Teixeira, J.C. Study of devolatilization rates of pine wood and mass loss of wood pellets. Energy 2017, 6, 9. [Google Scholar] [CrossRef]
- Gil, M.V.; Casal, D.; Pevida, C.; Pis, J.; Rubiera, F. Thermal behaviour and kinetics of coal/biomass blends during co-combustion. Bioresour. Technol. 2010, 101, 5601–5608. [Google Scholar] [CrossRef] [PubMed]
- Mishra, R.K.; Mohanty, K. Pyrolysis kinetics and thermal behavior of waste sawdust biomass using thermogravimetric analysis. Bioresour. Technol. 2018, 251, 63–74. [Google Scholar] [CrossRef] [PubMed]
- Skreiberg, A.; Skreiberg, O.; Sandquist, J.; Sørum, L. TGA and macro-TGA characterisation of biomass fuels and fuel mixtures. Fuel 2011, 90, 2182–2197. [Google Scholar] [CrossRef]
- Magdziarz, A.; Wilk, M. Thermogravimetric study of biomass, sewage sludge and coal combustion. Energy Convers. Manag. 2013, 75, 425–430. [Google Scholar] [CrossRef]
- Grammelis, P.; Basinas, P.; Malliopoulou, A.; Sakellaropoulos, G. Pyrolysis kinetics and combustion characteristics of waste recovered fuels. Fuel 2009, 88, 195–205. [Google Scholar] [CrossRef]
- Biswas, S.; Choudhury, N.; Sarkar, P.; Mukherjee, A.; Sahu, S.; Boral, P.; Choudhury, A. Studies on the combustion behaviour of blends of Indian coals by TGA and Drop Tube Furnace. Fuel Process. Technol. 2006, 87, 191–199. [Google Scholar] [CrossRef]
- Vamvuka, D.; Sfakiotakis, S. Combustion behaviour of biomass fuels and their blends with lignite. Thermochim. Acta 2011, 526, 192–199. [Google Scholar] [CrossRef]
- Mani, T.; Murugan, P.; Abedi, J.; Mahinpey, N. Pyrolysis of wheat straw in a thermogravimetric analyzer: Effect of particle size and heating rate on devolatilization and estimation of global kinetics. Chem. Eng. Res. Des. 2010, 88, 952–958. [Google Scholar] [CrossRef]
- Boriouchkine, A.; Sharifi, V.; Swithenbank, J.; Jämsä-Jounela, S.-L. A study on the dynamic combustion behavior of a biomass fuel bed. Fuel 2014, 135, 468–481. [Google Scholar] [CrossRef]
- Wang, X.; Hu, M.; Hu, W.; Chen, Z.; Liu, S.; Hu, Z.; Xiao, B. Thermogravimetric kinetic study of agricultural residue biomass pyrolysis based on combined kinetics. Bioresour. Technol. 2016, 219, 510–520. [Google Scholar] [CrossRef] [PubMed]
- Kök, M.V.; Özgür, E. Thermal analysis and kinetics of biomass samples. Fuel Process. Technol. 2013, 106, 739–743. [Google Scholar] [CrossRef]
- Granada-Álvarez, E.; Eguía-Oller, P.; Comesaña, J.A.; Patiño, D.; Porteiro, J.; Miguez, J.L. Devolatilization behaviour and pyrolysis kinetic modelling of Spanish biomass fuels. J. Therm. Anal. Calorim. 2012, 113, 569–578. [Google Scholar] [CrossRef]
- Slopiecka, K.; Bartocci, P.; Fantozzi, F. Thermogravimetric analysis and kinetic study of poplar wood pyrolysis. Appl. Energy 2012, 97, 491–497. [Google Scholar] [CrossRef]
- Anca-Couce, A.; Zobel, N.; Berger, A.; Behrendt, F. Smouldering of pine wood: Kinetics and reaction heats. Combust. Flame 2012, 159, 1708–1719. [Google Scholar] [CrossRef]
- Shen, D.; Gu, S.; Jin, B.; Fang, M. Thermal degradation mechanisms of wood under inert and oxidative environments using DAEM methods. Bioresour. Technol. 2011, 102, 2047–2052. [Google Scholar] [CrossRef]
- Seo, D.K.; Park, S.S.; Hwang, J.; Yu, T.-U. Study of the pyrolysis of biomass using thermo-gravimetric analysis (TGA) and concentration measurements of the evolved species. J. Anal. Appl. Pyrolysis 2010, 89, 66–73. [Google Scholar] [CrossRef]
- Kim, S.-S.; Kim, J.; Park, Y.-H.; Park, Y.-K. Pyrolysis kinetics and decomposition characteristics of pine trees. Bioresour. Technol. 2010, 101, 9797–9802. [Google Scholar] [CrossRef]
- Yorulmaz, S.Y.; Atimtay, A.T. Investigation of combustion kinetics of treated and untreated waste wood samples with thermogravimetric analysis. Fuel Process. Technol. 2009, 90, 939–946. [Google Scholar] [CrossRef]
- Shen, D.; Gu, S.; Luo, K.; Bridgwater, T.; Fang, M. Kinetic study on thermal decomposition of woods in oxidative environment. Fuel 2009, 88, 1024–1030. [Google Scholar] [CrossRef]
- Álvarez, A.; Pizarro, C.; García, R.; Bueno, J.; Lavín, A.; García, C.P. Determination of kinetic parameters for biomass combustion. Bioresour. Technol. 2016, 216, 36–43. [Google Scholar] [CrossRef]
- Yu, N.; Chen, M.; Wei, Y.; Niu, S.; Xue, F. An assessment on co-combustion characteristics of Chinese lignite and eucalyptus bark with TG–MS technique. Powder Technol. 2016, 294, 463–471. [Google Scholar] [CrossRef]
- Soria-Verdugo, A.; Goos, E.; García-Hernando, N. Effect of the number of TGA curves employed on the biomass pyrolysis kinetics results obtained using the Distributed Activation Energy Model. Fuel Process. Technol. 2015, 134, 360–371. [Google Scholar] [CrossRef]
- Garcia-Maraver, A.; Pérez-Jiménez, J.A.; Serrano-Bernardo, F.; Zamorano, M. Determination and comparison of combustion kinetics parameters of agricultural biomass from olive trees. Renew. Energy 2015, 83, 897–904. [Google Scholar] [CrossRef]
- Mishra, G.; Kumar, J.; Bhaskar, T. Kinetic studies on the pyrolysis of pinewood. Bioresour. Technol. 2015, 182, 282–288. [Google Scholar] [CrossRef]
- Chen, Z.; Zhu, Q.; Wang, X.; Xiao, B.; Liu, S. Pyrolysis behaviors and kinetic studies on Eucalyptus residues using thermogravimetric analysis. Energy Convers. Manag. 2015, 105, 251–259. [Google Scholar] [CrossRef]
- Soria-Verdugo, A.; Garcia-Gutierrez, L.; Blanco-Cano, L.; García-Hernando, N.; Ruiz-Rivas, U. Evaluating the accuracy of the Distributed Activation Energy Model for biomass devolatilization curves obtained at high heating rates. Energy Convers. Manag. 2014, 86, 1045–1049. [Google Scholar] [CrossRef]
- Chen, D.; Zheng, Y.; Zhu, X. In-depth investigation on the pyrolysis kinetics of raw biomass. Part I: Kinetic analysis for the drying and devolatilization stages. Bioresour. Technol. 2013, 131, 40–46. [Google Scholar] [CrossRef]
- Peters, B.; Raupenstrauch, H. Modeling moving and fixed bed combustion. Handb. Combust. 2010, 4, 413–425. [Google Scholar] [CrossRef]
- Vyazovkin, S.; Burnham, A.K.; Criado, J.M.; A Perez-Maqueda, L.; Popescu, C.; Sbirrazzuoli, N. ICTAC Kinetics Committee recommendations for performing kinetic computations on thermal analysis data. Thermochim. Acta 2011, 520, 1–19. [Google Scholar] [CrossRef]
- White, J.E.; Catallo, W.J.; Legendre, B.L. Biomass pyrolysis kinetics: A comparative critical review with relevant agricultural residue case studies. J. Anal. Appl. Pyrolysis 2011, 91, 1–33. [Google Scholar] [CrossRef]
- Mehrabian, R.; Scharler, R.; Obernberger, I. Effects of pyrolysis conditions on the heating rate in biomass particles and applicability of TGA kinetic parameters in particle thermal conversion modelling. Fuel 2012, 93, 567–575. [Google Scholar] [CrossRef]
- Yüzbasi, N.S.; Selçuk, N. Air and oxy-fuel combustion characteristics of biomass/lignite blends in TGA-FTIR. Fuel Process. Technol. 2011, 92, 1101–1108. [Google Scholar] [CrossRef]
- Magalhaes, D.; Kazanç, F.; Riaza, J.; Erensoy, S.; Kabaklı, Ö.; Chalmers, H. Combustion of Turkish lignites and olive residue: Experiments and kinetic modelling. Fuel 2017, 203, 868–876. [Google Scholar] [CrossRef]
- Lin, Y.; Ma, X.; Ning, X.; Yu, Z. TGA–FTIR analysis of co-combustion characteristics of paper sludge and oil-palm solid wastes. Energy Convers. Manag. 2015, 89, 727–734. [Google Scholar] [CrossRef]
- Sánchez, M.; Otero, M.; Gómez, X.; Morán, A. Thermogravimetric kinetic analysis of the combustion of biowastes. Renew. Energy 2009, 34, 1622–1627. [Google Scholar] [CrossRef]
- Bahng, M.-K.; Mukarakate, C.; Robichaud, D.J.; Nimlos, M.R. Current technologies for analysis of biomass thermochemical processing: A review. Anal. Chim. Acta 2009, 651, 117–138. [Google Scholar] [CrossRef]
- Fang, X.; Jia, L.; Yin, L. A weighted average global process model based on two L stage kinetic scheme for biomass combustion. Biomass Bioenergy 2012, 48, 43–50. [Google Scholar] [CrossRef]
- Ebrahimi-Kahrizsangi, R.; Abbasi, M. Evaluation of reliability of Coats-Redfern method for kinetic analysis of non-isothermal TGA. Trans. Nonferrous Met. Soc. China 2008, 18, 217–221. [Google Scholar] [CrossRef]
- Coats, A.W.; Redfern, J.P. Kinetic parameters from thermogravimetric data. Nature 1964, 201, 68–69. [Google Scholar] [CrossRef]
- Kluska, J.; Ronewicz, K. Characteristics of single wood particle pyrolysis using particle image velocimetry Transport processes during pyrolysis. Arch. Thermodyn. 2018, 39, 3–13. [Google Scholar] [CrossRef]
- Guo, F.; Liu, Y.; Wang, Y.; Li, X.; Li, T.; Guo, C. Pyrolysis kinetics and behavior of potassium-impregnated pine wood in TGA and a fixed-bed reactor. Energy Convers. Manag. 2016, 130, 184–191. [Google Scholar] [CrossRef]
- Manouchehrinejad, M.; Van Giesen, I.; Mani, S. Grindability of torrefied wood chips and wood pellets. Fuel Process. Technol. 2018, 182, 45–55. [Google Scholar] [CrossRef]
- Burhenne, L.; Messmer, J.; Aicher, T.; Laborie, M.-P. The effect of the biomass components lignin, cellulose and hemicellulose on TGA and fixed bed pyrolysis. J. Anal. Appl. Pyrolysis 2013, 101, 177–184. [Google Scholar] [CrossRef]
- Harun, N.Y.; Afzal, M.T.; Shamsudin, N. Reactivity studies of sludge and biomass combustion. Int. J. Eng. 2009, 3, 413–425. [Google Scholar]
© 2020 by the authors. Licensee MDPI, Basel, Switzerland. This article is an open access article distributed under the terms and conditions of the Creative Commons Attribution (CC BY) license (http://creativecommons.org/licenses/by/4.0/).