Article

How Does the Rate of Photovoltaic Installations and Coupled Batteries Affect Regional Energy Balancing and Self-Consumption of Residential Buildings?

Department of Geography, LMU Munich, Luisenstr. 37, 80333 Munich, Germany
*
Author to whom correspondence should be addressed.
Energies 2020, 13(11), 2738; https://doi.org/10.3390/en13112738
Submission received: 20 April 2020 / Revised: 20 May 2020 / Accepted: 27 May 2020 / Published: 29 May 2020
(This article belongs to the Special Issue Assessment of Photovoltaic-Battery Systems)

Abstract

:
The strong expansion of residential rooftop photovoltaic (PV) and battery storage systems of recent years is expected to rise further. However, it is not yet clear to which degree buildings will be equipped with decentral energy producers. This study seeks to quantify the effects of different PV and battery installation rates on the residential residual loads and grid balancing flows. A land surface model with an integrated residential energy component is applied, which maintains spatial peculiarities and allows a building-specific set-up of PV systems, batteries, and consumption loads. The study area covers 3163 residential buildings located in a municipality in the south of Germany. The obtained results show minor impacts on the residual loads for a PV installation rate of less than 10%. PV installation rates of one third of all residential buildings of the study region lead to the highest spatial balancing via the grid. The rise in self-consumption when utilizing batteries leads to declined grid balancing between the buildings. For high PV installation rates, regional balancing diminishes, whereas energy excesses rise to 60%. They can be decreased up to 10% by the utilization of battery systems. Therefore, we recommend subsidy programs adjusted to the respective PV installation rates.

Graphical Abstract

1. Introduction

The global energy supply has been identified as a major driver of anthropogenic climate change. In 2010 for instance, the generation of electricity and heat accounted for 26% of the anthropogenic greenhouse gas emissions [1]. In recent years, the global CO2-emissions arising from the combustion of fossil fuels have continuously increased by 1% p.a. on average [2]. Therefore, the transformation of the energy systems to renewable sources is an essential mitigation measure [3].
The expansion of non-fossil resources will increase the demand for space. In contrast to conventional combustion plants, renewable production systems usually have a low energy density [4]. This means that a larger area is needed to produce the same amount of electrical energy as by a conventional plant. The expansion of renewables can especially in highly populated regions raise the potential for land-use conflicts [5]. As an exception, photovoltaic (PV) systems mounted on rooftops can significantly contribute to the reduction of greenhouse gas emissions in the residential electrical sector [6] but their installation does not intensify this competition for land. Thus, this renewable energy resource belongs to the most accepted by the public [7]. Consequently, the expansion of rooftop PV is an integral part in the energy policies of many countries. Germany for instance, has introduced a law, which includes a fixed minimum remuneration for PV energy [8]. China has enacted the 13th Five Year Plan for energy, which offers special feed-in tariffs for small-scale, residential systems [9].
Due to the attractive economic conditions, more and more PV systems have been installed on rooftops. In 2018 for instance, the worldwide performance of rooftop PV accounted for 27.9 GWp in total [10]. Until 2023, it is expected that the installation rates continue to rise by between 14.3 GW and 46.8 GW in total [10]. However, the growing decentralization of the energy production presents a challenge to the local electricity networks. This development fundamentally changes the structure of the regional energy systems [11]. Rising amounts of grid-connected PV systems can lead to poor power quality, when the residential PV excesses are fed into the grid [12].
Coincidently with the expansion of rooftop PV, the utilization of residential battery storage systems has also strongly increased. In Germany, every second newly installed PV system was coupled to a battery storage in 2017 [13]. This may be reasoned in the higher profitability of the residential PV systems when additionally utilizing batteries [14]. The storages increase the degree of self-consumption by 13–24% [15], as they balance mismatches between the production rate of the PV system and the residential consumption. Due to this, they have the potential of decreasing harmful backflows into the grids [16]. The potential impact of PV and battery systems on the grids is assessed by detailed analyses of single systems or small parts of the local voltage grids. Various pricing schemes and management strategies for residential batteries have been developed, which target the integration into the grids apart from maximizing the benefits for the owners [17,18,19]. These studies offer detailed analyses of single systems and their effects on grid flows.
Emerging challenges of the expansion of PV systems and the impact of batteries are also analyzed on a larger spatial scale. In these regional analyses, the interrelations of the residential energy systems can be assessed when multiple buildings are equipped with PV and residential batteries. The PV energy yields are subject to significant spatial variations when regarding technical, meteorological, social, and economic constraints [20,21]. Even on neighborhood level, the PV potential is subject to strong variation, which also influences the integration of rooftop PV [22]. The spatial variations in the potential consequently affect the residual loads, which can be partly balanced via the grids [23].
The majority of the studies focus on high PV installation rates on the selected rooftops. However, it is not clear when and to which extent consumers will decide for the installation of residential PV and additional battery systems [24]. Therefore, the future role of rooftop PV production in the energy systems is still unknown. This raises the question how the energy flows are influenced in a regional energy system if the residential buildings are partially equipped with PV and batteries. There is still a lack of understanding of the influence of the PV and battery installation rate on the relation between regional grid balancing, energy excesses and self-consumption rates on regional scale. In this context, the study sets out to quantify the influence of the PV and battery installation rate on the regional energy excesses and self-consumption of residential buildings. We evaluate how far the residual energy flows can be balanced in dependency of the degree of PV and battery installation due to spatial variations in the potentials. The study further aims to assess how far the partial utilization of PV and residential batteries affects the residual loads of the residential buildings on a regional scale.
To address these objectives, we apply a land surface model with an integrated domestic energy system component. This tool enables the simulation of power flows from various residential buildings considering local differences in consumption, PV plants and batteries designs, as well as the topographical and weather conditions. We use statistical data combined with spatial information to dimension residential consumption rates and PV systems. In this way, we are able to evaluate the effects of different PV installation and battery-coupling rates on self-consumption, regional balancing, and the energy excesses in a regional energy system.

2. Materials and Methods

2.1. Model Environment

In order to simulate the residential energy flows of the residential buildings we apply the Processes of Radiation, Mass, and Energy Transfer (PROMET) land surface model. It offers an integrated residential energy system component and has been tested successfully in various study areas at different scales [25,26]. The PROMET model is fully spatially distributed and raster-based. This means that each building in the study area can be attributed to a grid point in the raster and the processes are simulated in spatially explicit way. This model approach allows the assessment of regional PV and battery effects with physically based simulations of PV production rates and battery flows.
The temporal and spatial resolution in the following study is set to 1 h and 100 m. The meteorological input for the PROMET model includes temperature, precipitation, wind speed, cloud cover, and air humidity. Provided as point values at installed stations, the weather conditions are interpolated to the raster points with the inverse squared distance weighting method considering local statistical dependencies of the meteorological parameters on topographical conditions. The radiation fluxes relevant for the PV model are determined on the raster resolution from air temperature and degree of cloudiness using a simple atmospheric radiative transfer model. Snow depth and coverage impeding the production of PV energy are estimated from the precipitation sums, radiation fluxes, heat fluxes, and air temperature [25,26].
The domestic energy system component embedded in the PROMET model consists of three submodules [23], which are interconnected in the following way: First, the hourly electrical energy production is simulated by the PV model considering the building-specific slopes and orientations of the roofs. The amount of direct and diffuse solar irradiation and the reflection striking the PV panels is determined from the spatially resolved radiation fluxes derived from the meteorological input data. The electrical energy yield is calculated from the hourly irradiation conditions following the method of [27] under the constraints of temperature effects, module efficiencies, ageing losses. At snow depth exceeding 2 cm it is assumed that the PV systems are fully covered by snow and the production is stopped due to suboptimal radiation conditions [28,29]. The losses from the MPP-tracker are considered by constant efficiency parameters. The PV model is further described comprehensively in a technical report [30]. The PV model was successfully validated with hourly measurement data of several PV systems located in the study area.
In the consumption module, the magnitude of the residential energy load is determined on hourly scale. The input of this component includes the average, annual consumption rates, which are spatially resolved to raster resolution according to the building locations. The yearly consumption rates are calculated from these reference values using annual adjustment parameters. The temporal course of the energy consumption is determined from the obtained annual consumption rates by hourly load profiles [31,32]. The derivation of hourly consumption rates is further described in a dedicated modelling documentation [33]. The consumption component was successfully validated with 15 min measurement data of the study area.
In the next step, the differences between production and consumption rates are determined on building scale. The PV energy is transformed to alternative current (AC) via inverter assuming a constant efficiency. The PV self-consumption is determined as the amount of energy produced by the PV panel which is simultaneously consumed by the building.
The third submodule also includes the simulation of the battery storages, if coupled to PV systems. The battery model calculates the charging and discharging flows of the battery storages from the available energy excess or deficit of the residential energy system before the conversion to AC [34,35]. It is assumed that the battery systems are rechargeable and always connected to the grid. The magnitude of the charging and discharging flows are determined considering the maximum charging and discharging power, self-discharging, ageing effects, and the influences of temperature and current. The selected operation strategy maximizes the self-consumption of the PV production, which is currently the common management strategy for residential buildings employed by the battery retailers [36]. This means that the battery is charged as soon as excess energy is generated by the PV system and discharged when the hourly energy consumption exceeds the production.
The residual load is defined as the energy flow between the public and residential grid network. Grid supply is defined as a positive residual load, whereas negative loads denote PV excesses fed into the grids. The amount of PV excesses available in the grids and consumed by the other residential buildings is termed as regional balancing flow. It is assumed that the energy flows between the buildings are not constrained by grid limitations. In this way, the upper bounds for the supply with regionally generated PV energy from rooftop-mounted systems can be quantified. PV self-consumption is defined as the annual share of PV energy that can be directly consumed by the building, whereas self-sufficiency denotes the percentage of consumption that is produced by the residential PV plant per year. The energy production, which is neither consumed by the own household nor by the other residential buildings is termed as energy excess.
Three different energy supply options exist for each building in the study area: (1) full grid supply, (2) supply by a rooftop PV system and the grid, and (3) supply by PV, an additional battery and the grid. It is assumed that PV and battery systems are jointly used in buildings with multiple households, so that only one PV and battery system is potentially installed per building. The regional effects of the partial equipment with PV systems and coupled batteries are assessed sequentially by the increase of the installation rates in increments of 1%. The buildings, which are equipped with PV systems and additional batteries, are selected randomly. The resulting energy flows are first determined on building scale and then aggregated to raster resolution.

2.2. Description of the Study Area
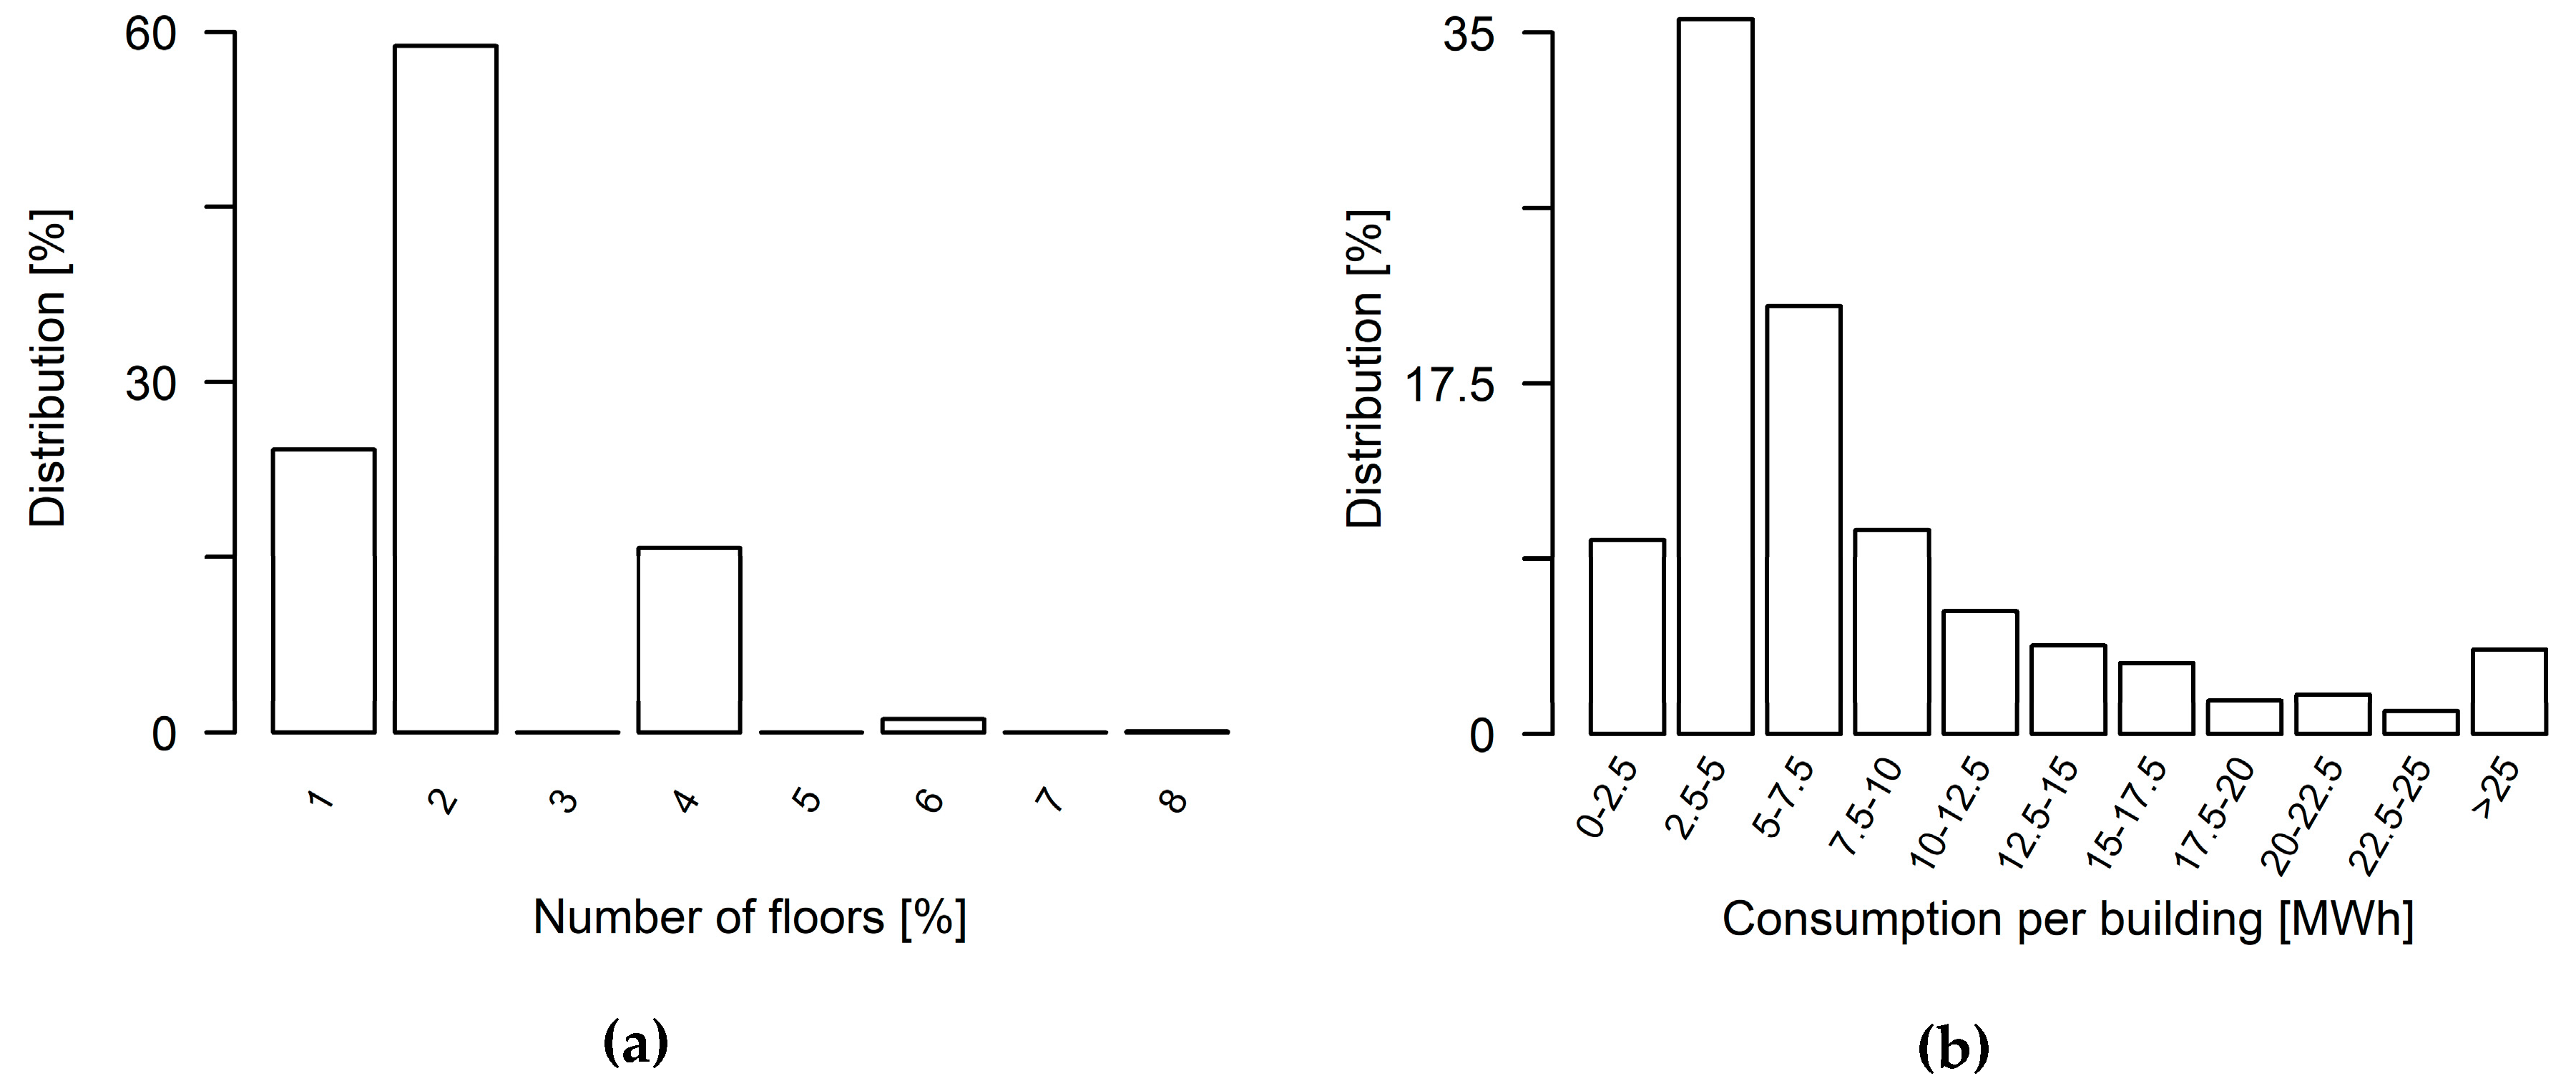
The study area covers the district town Bad Tölz, which is located in the Alpine foreland in the southeast of Germany (see Figure 1). The study area belongs to a region in Germany characterized by a high potential for photovoltaic energy production. Within the municipal area, the average global incoming irradiation ranges between 1.167 kWh/m2 in the north and 1.145 kWh/m2 in the south at higher elevation levels [37].
The city covers 3080 ha with an average population density of 564 persons per km2 [41]. In total, 20.1% of the study region is classified as residential and traffic area, of which 233 ha belong to residential settlements. In 2017, 18,647 inhabitants living in 3289 residential buildings were registered in Bad Tölz (see Figure 1). One or two person households account for the most common form of housing [41]. An average building has 2.75 apartments with 84.2 m2 and 5.67 residents. The city of Bad Tölz has an annual energy consumption of 69.693 GWh (measured between 2013 and 2016), of which 38.0% are contributed to the residential sector [42]. On average, the households in the study region consumed 3093 kWh of electrical energy per year, which is similar to the German mean of 3168 kWh/yr [43].

2.3. Input Data

The period of five years from 2014 to 2018 is simulated using hourly climate data from 1236 measurement stations of the German weather service, of which 44 are located within or in max. 50 km distance to the study region. The essential input for the land surface model PROMET includes spatially resolved data sets for elevation [38] and land use [44]. The domestic energy system component needs further input data for the PV, battery and consumption component. Table 1 shows the values of the PV and battery parameters, which are kept constant for all systems. We assumed that the PV systems featured crystalline silicon type solar panels, which is the dominant configuration used in the past few years [45]. The use of lithium-ion accumulators is simulated, as this is currently the primarily purchased type for residential applications [13].

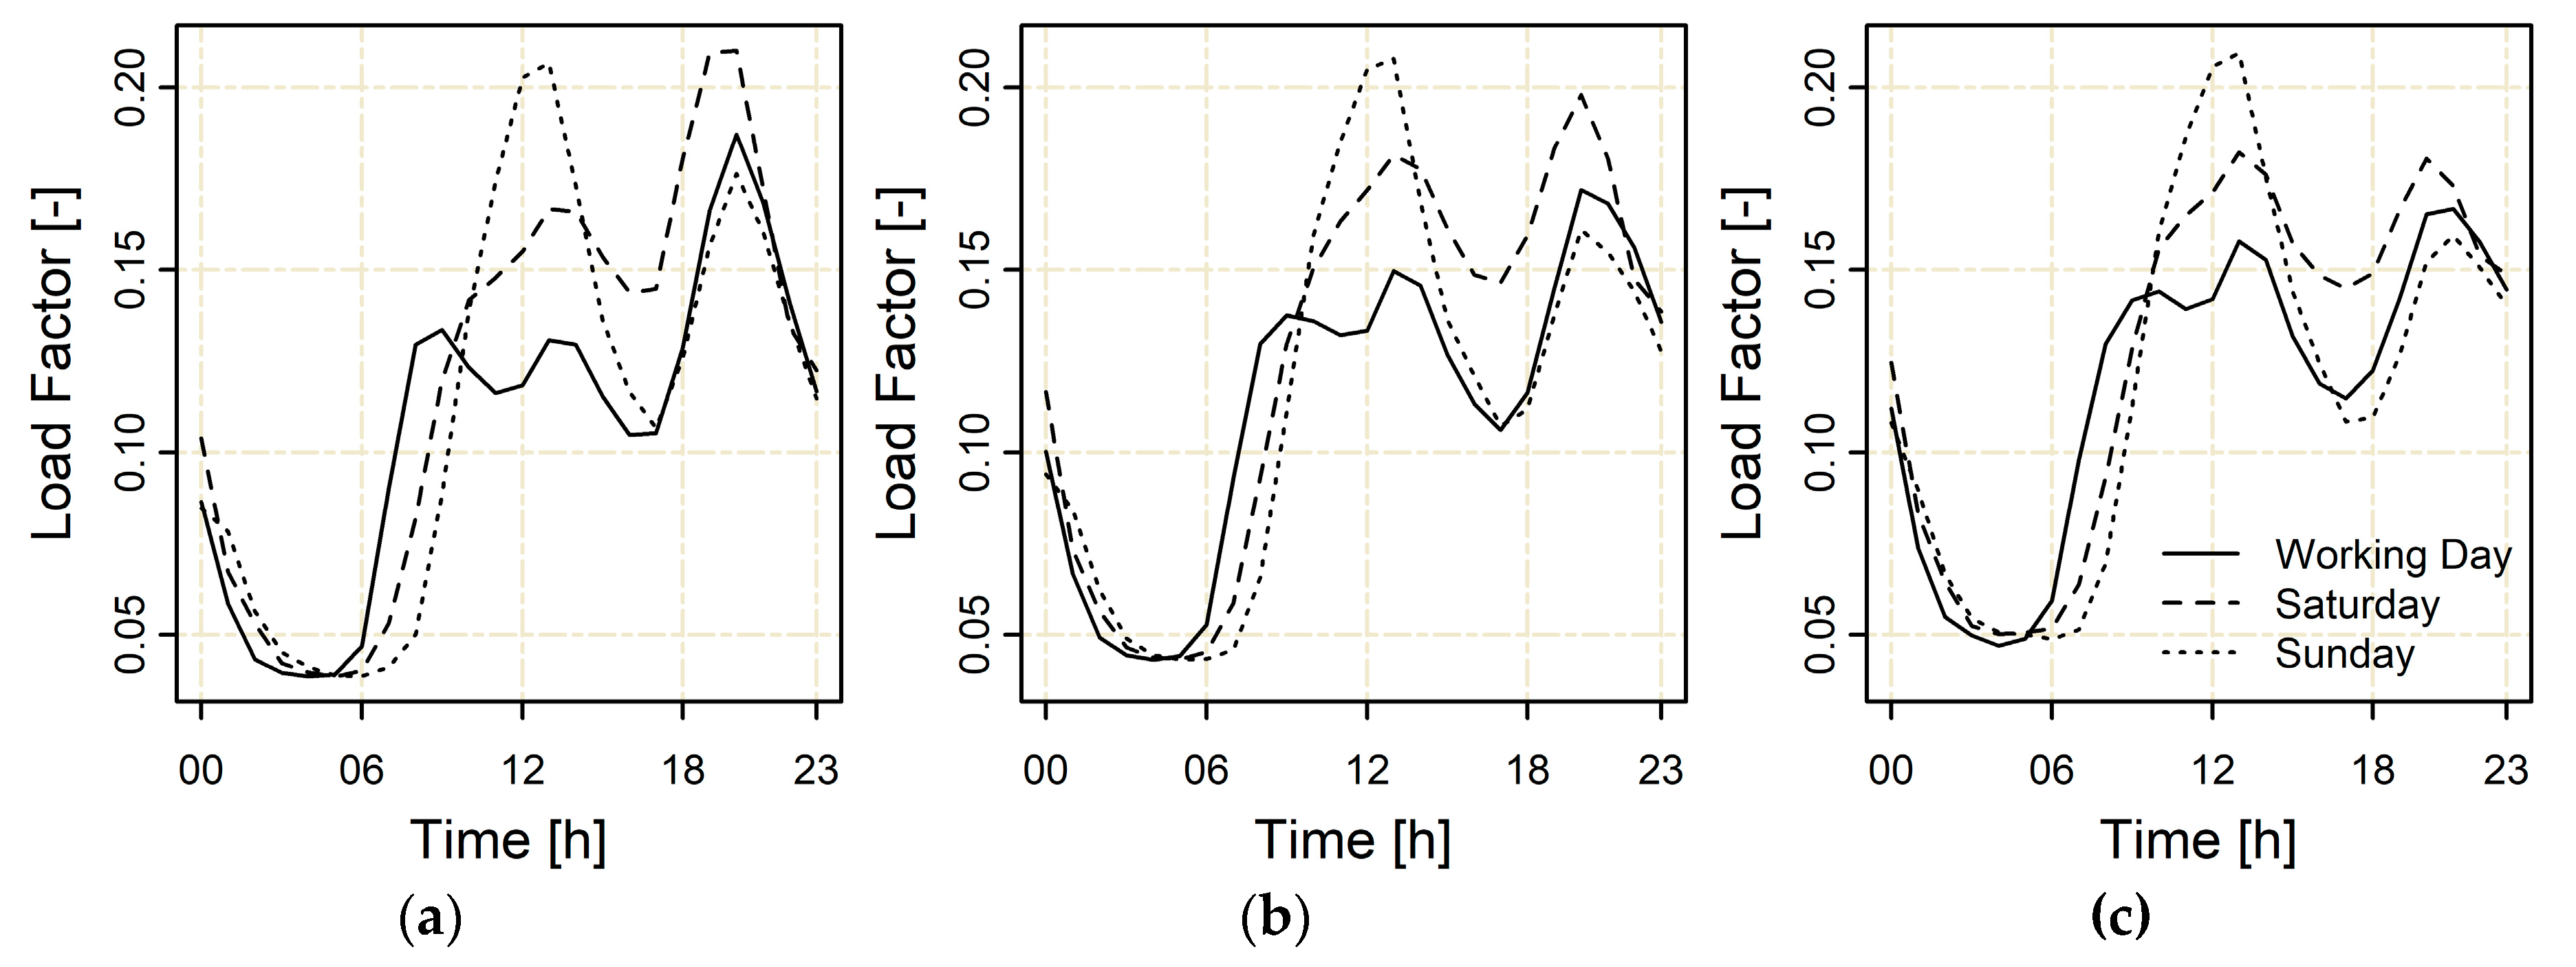
2.4. Temporal and Spatial Downscaling of the Consumption Rates

For the presented analysis we use 3163 residential buildings located in our study region, which we extracted from a digital building model provided by the Bavarian Agency for Digitization, High-Speed Internet and Surveying [39].
This data set contains georeferenced, building-specific information as construction heights, base areas, roof shapes, and the types of utilization for instance. It was generated from airborne laser scanning data and the national real estate cadaster.
The annual residential consumption rates are provided by the local energy supplier and cover the years 2014 to 2016 [42]. As the energy consumption of electrically based heating systems is reported separately in this data set, the applied residential consumption loads exclude the additional energy demand from heating pumps. The energy consumption rates for the years 2017 and 2018 are extrapolated using the moving average of the previous two years. Standardized load profiles for households are applied to temporally downscale the annual consumption rates (see Figure A1) [32,33].
As the use of building-specific energy loads allows the determination of the PV self-consumption, the annual consumption rates are spatially downscaled from the municipal to the building level. The method applied in this study is based on the assumption that the electrical energy consumption is proportional to the living space. The exact positions of the buildings provided by the digital building model are transformed to the grid system used in the applied land surface processes model.
The building-specific consumption rates are derived in the following way:
In the first step, the number of floors NF is determined for each building B of the study area according to Equation (1).
N F ( B ) = ( H E ( B ) H B ( B ) H 0 ) / ( H R + H C )
The altitude of the building is calculated from eaves heights HE and the ground level HB provided by the building data set. For H0, which is the distance from the ground surface to the first floor, we use a height of 0.85 m. This value is reasonable for regions, which are prone to flooding and have consequently raised ground floors for flood protection. We further assume an average room height HR of 2.50 m. This is in line with the room heights of the dwellings constructed in Germany in the recent decades. Since more than 70% of the residential buildings in Bad Tölz were built in the second half of 20th century [48], the assumed room height is a reasonable value for the study area. We further assume a thickness of 0.4 m for the height of the ceiling construction Hc as the sum of 20 cm height for the load-bearing layer and 20 cm for the floor construction. These are typical heights for the current construction heights of German dwellings.
Equation (2) shows the determination of the total living area AL based on the obtained numbers of floor NF, the effective area for living Nea, and the gross floor AB, which is provided by the digital building model. According to the guidelines of the Association of German Engineers (VDI), the percentage of the effective living area to the gross floor is between 59% and 71% for residential buildings [49]. Based on this, we assume an effective area for living Nea of 65%:
A L ( B ) = N F ( B ) · N e a · A B ( B )
The applied dimensioning approach results in a high share of residential buildings with two floors (see Figure 2). This seems plausible, as the study area is characterized by a large number of detached two-story houses. The resulting living area of 229.87 m2 per building is in line with the statistical mean of 229.61 m2 obtained in the municipality of Bad Tölz for 2014 [50].
In the next step, the consumption rate is spatially distributed based on the obtained living areas of the buildings. It is assumed that the annual, municipal energy consumption is equally distributed over the living areas. In total, the residential energy use of the municipality accounted for 26,603.86 MWh on average and varies by 0.3%, which amounts to 36.10 kWh/m2 between 2014 to 2016 [42]. The obtained annual consumption rates presented in Figure 2 range between 0.88 MWh and 67.70 MWh per building at an average of 8.30 MWh.

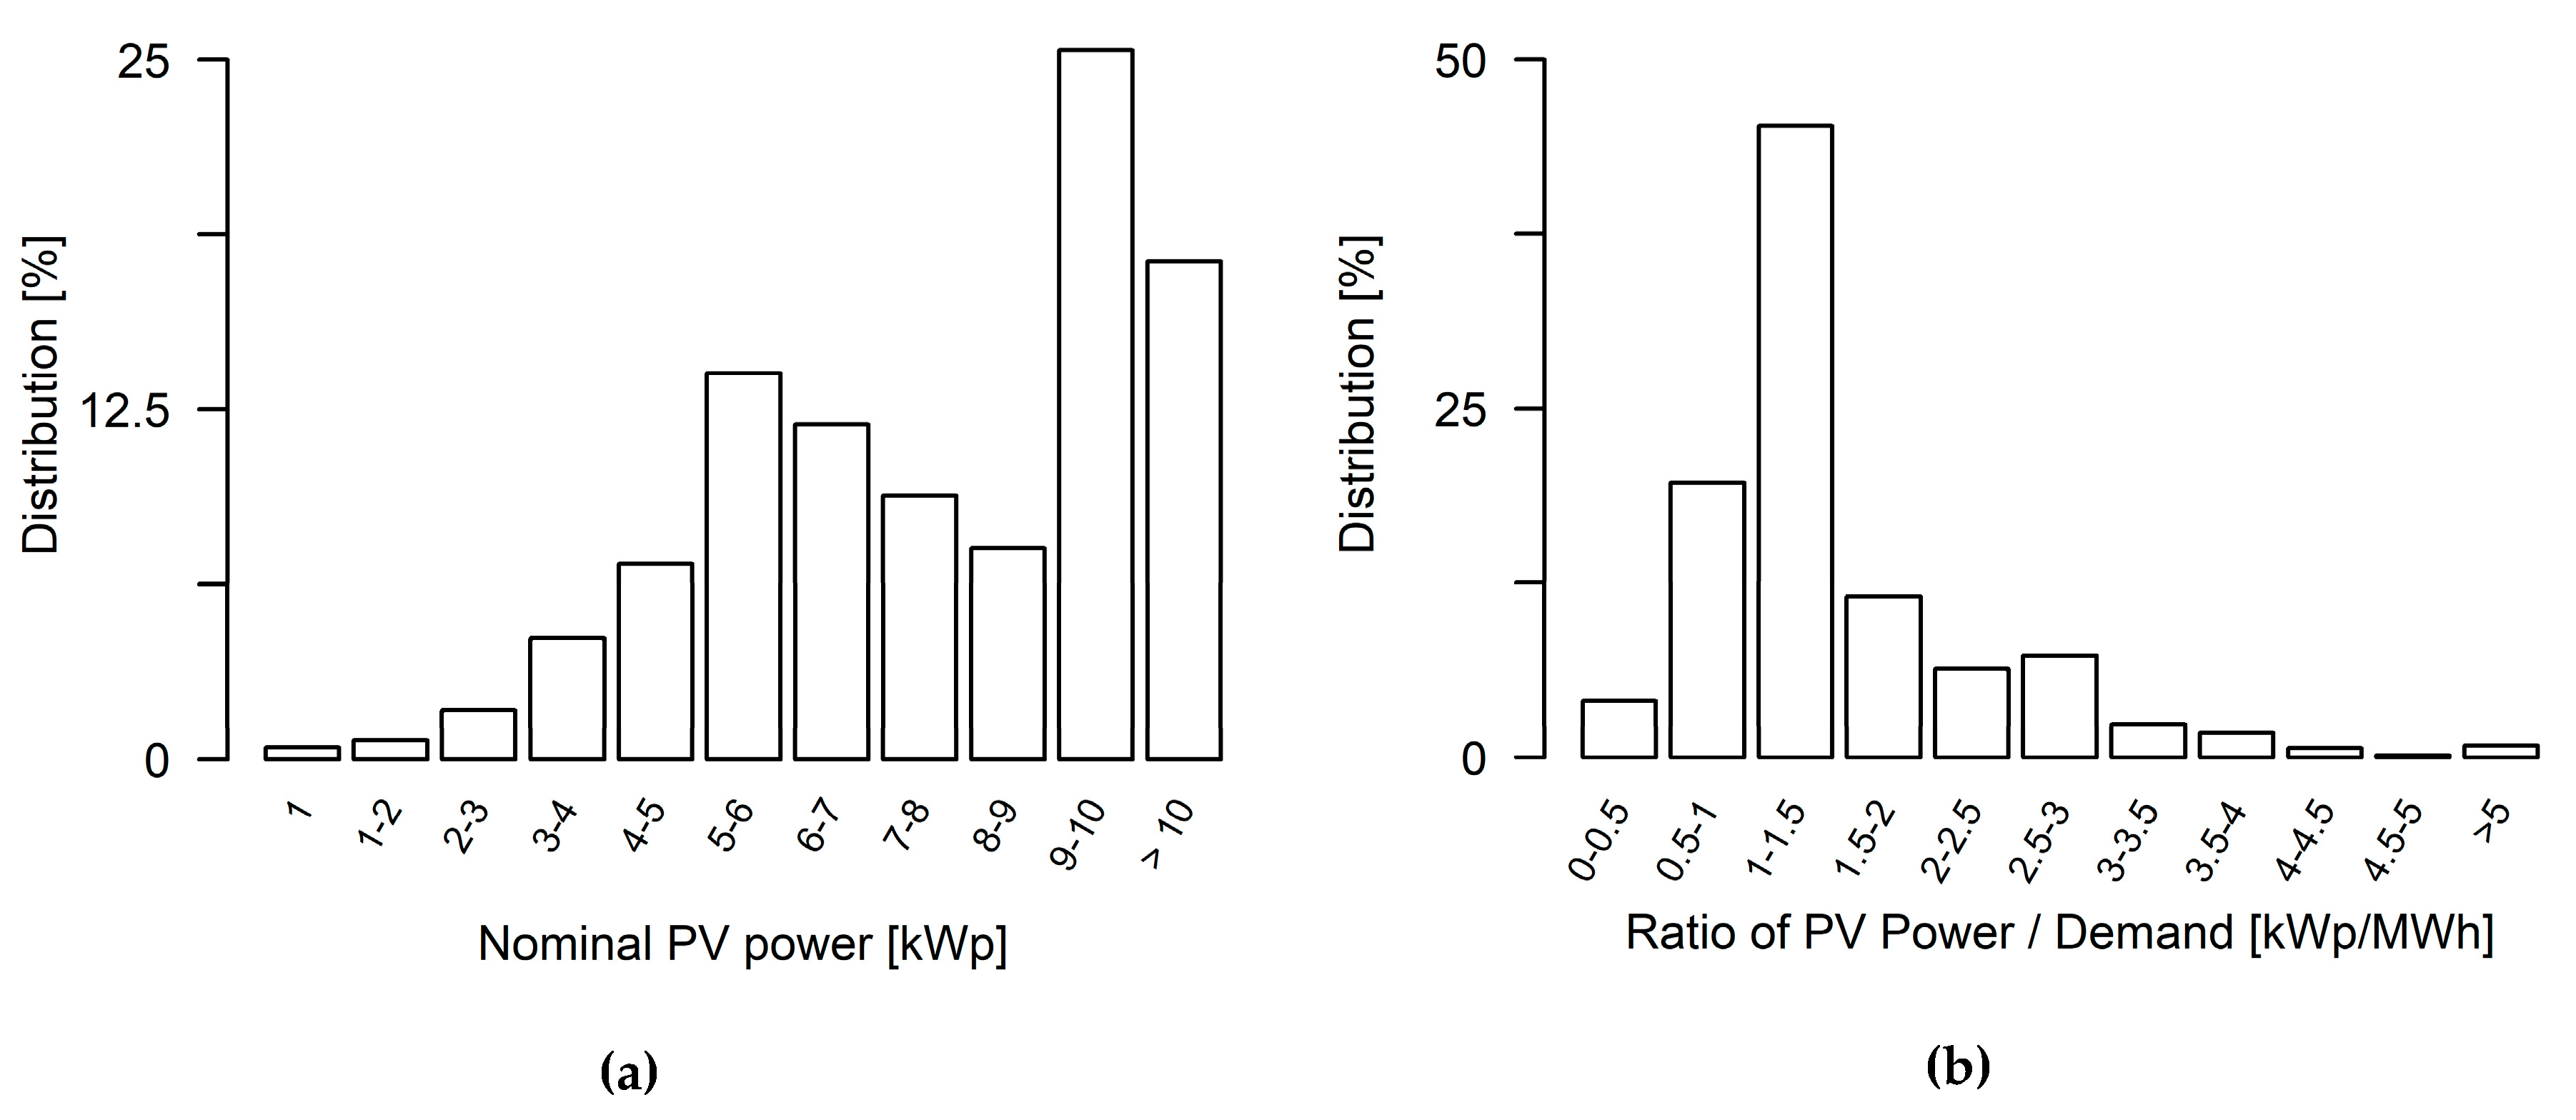
2.5. Dimensioning of the PV Systems and Batteries
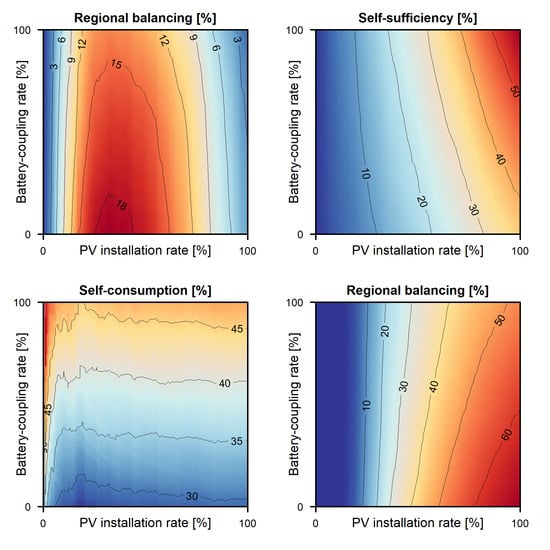
The installed capacities of residential PV systems underlie a high variability, as they are influenced by several factors. The installation of rooftop mounted PV systems is not allowed for buildings kept under a preservation order. This applies to 1% of the residential buildings located in the study region, which are excluded from the potential for a PV and battery expansion.
PV sizes are subject to technical and spatial constraints concerning the inclination angels of the roofs, the available areas, and the orientations of the buildings relative to the sun. Apart from these limitations, different motivations with the purchase but also the development of the incentives and prices have a strong influence on the installation capacities of the PV systems [13]. In our study, we consider both aspects by dimensioning the PV system sizes in two steps.
First, the spatial constraints of the potential PV systems are determined individually for each building. For this purpose, we calculate the statistical energy yields PVpot for the available rooftops R of each building B (see Equation (3)). The information for areas AR, orientations OR, and inclination angels θR of the roofs is taken from the building model [39]:
P V p o t ( R , B ) = 0.9 · A R ( R , B ) · s = 1 12 I R ( s ) · c ( s , O R ( R , B ) , θ R ( R , B ) )
The size of the potential PV system is curtailed to 90% of the roof area AR to consider roof areas covered by windows, snow guards, chimneys, and the space needed for installation and access. It is assumed that the orientation OR and the inclination of the PV panels θR correspond to those of the rooftops. The statistical irradiation striking the roof areas is based on the average monthly incoming global irradiation IR on the horizontal plane [37]. The inclinations between the solar irradiation and the PV panels are considered through seasonal correction factors c, which are adjusted for Bavarian conditions [51].
For each building, we determine the rooftop with the highest estimated energy yield as the technical potential. The nominal potential PV power is derived from the available roof area assuming a rated power of 170 W/m2 [45].
To consider the actual variability of the PV installation capacities and not only technical constraints, we use the statistical distribution of the nominal PV power rates obtained from central registry of renewable energy systems, which is operated by the German Federal Network Agency [52]. Based on this data set, the panel areas of the selected PV systems are further reduced to reproduce the different shares of the PV sizes. Figure 3a shows the resulting distribution of the PV installation rates with an average nominal power of 9.30 kWp. For almost half of the buildings the ratio between the PV production capacity and annual electrical energy demand is 1.0−1.5 kWp/MWh (see Figure 3b).
The sizes of battery storages are dimensioned from the nominal PV power of the systems with one kWp per kWh useable battery storage capacity. This ratio follows the average dimensioning rate of the new-installations in 2017 [13].

3. Results

3.1. Regional Balancing and Self-Sufficiency

In order to assess the impact of the PV and battery installation rate on municipal scale, the rate of installed PV systems and coupled battery storages is increased in 1% steps leading to 10,201 simulation runs.
The PV installation and battery-coupling rate has different effects on the regional balancing and self-sufficiency. Figure 4 shows the share of regional balancing and self-sufficiency of the total energy consumption as functions of the PV installation rate and the percentage of battery coupling.
The degree of rooftops with installed PV systems has a higher impact on the regional balancing than the additional utilization of batteries. As presented in Figure 4 left, the PV installation rate influences the regional balancing of the residual loads in a non-linear way. The maximum amount of the consumed energy, which is produced externally by the PV systems of other residential buildings, reaches 18.7% at a PV rate of 32%. With the further increase of the PV rate, the regional balancing effect declines. At a PV installation rate of 99% for instance, the regional balancing is marginal with a value of only 3.5%.
The utilization of residential batteries reduces the regional balancing effects as the mismatches between PV production and consumption are already levelled within the building. The impact of batteries is apparent in particular for the PV installation rates around 30%. The balancing effects are decreased by 4.4% by equipping all PV systems with additional batteries. At high PV installation rates, a change of the battery coupling rate has only minor influence.
In contrast to the regional balancing, the degree of residential self-sufficiency rises linearly with increasing the PV or battery installation rates (see Figure 4 right). If only PV-systems are expanded, the regional self-sufficiency reaches a maximum of 36.3%, when all buildings are equipped with PV systems. Batteries additionally raise the self-supply due to the balancing of residential energy excesses and deficits. The strongest effect of the storages is observable at a PV installation rate of 99%. The additional utilization of batteries increases residential self-sufficiency by 21.3% to 57.6%.

3.2. Self-Consumption and Energy Surplusses

The PV installation rate and the share of systems coupled to storages influence the PV self-consumption and excesses in different ways as presented in Figure 5. The degree of direct self-consumption stays more or less constant at 28.9% on average for all PV rates (Figure 5b). For higher shares of buildings equipped with PV, the charging and discharging of residential storages increases the self-consumption from 28.9% to a mean value of 46.8% depending on the battery-coupling rate. However, for low PV installation rates the degree of self-consumption reaches its maximum at 55.8%.
In contrast, the energy excesses are strongly determined by the PV installation rate. At PV installation rates of less than 10%, the total amount of generated PV power is so low that the residential buildings fully consume the available production rates by either self-consumption or regional balancing. If the PV installation rate exceeds this threshold, the degree of energy surpluses rises linearly. At an installation rate of 99%, the highest share of excesses is obtained with 67.9%.
With the additional equipment of the residential energy systems with battery storages, the production surpluses are partially damped, as mismatches between PV production and consumption of the residential energy systems are balanced by the storages. With a reduction of 16.3% to 51.2%, the highest effect of battery utilization is obtained for a PV installation rate of 99%.

3.3. Residual Loads and Regional Balancing Flows

We first analyze the impact of the PV installation rate on the energy flows without the utilization of the residential storage systems. Figure 6 shows the distributions of the total residual loads and regional grid balancing flows between the residential buildings by indicating the number of hours, at which a certain value is exceeded.
Increasing PV installation rates raises the hours and the magnitudes of energy excesses. The expansion of PV systems leads to a reduction of the positive residual loads in the medium range between 4.0 MW and 2.0 MW, whereas the peak hours with maximum consumption are not significantly affected. In contrast, the magnitudes and hours of negative residual loads rise with increased PV capacities. At an installation rate of 99% for instance, the maximum excess is equivalent to 69.1% of the installed capacity.
The balancing flows are in contrast to the distribution of the residual load. Whereas an installation rate of 32% leads to the maximum total balancing effects, the highest magnitude of power flows between the buildings is obtained at PV installation rate of 40%. A further increase of the PV rate reduces the balancing flows in the medium range, whereas the extrema stay more or less constant.
Figure 7 shows the residual loads and balancing flows for different battery-coupling rates for the PV installation rate of 32%. The impact of residential battery storages systems is analyzed exemplarily for this degree of PV expansion as it shows in the highest regional balancing effects.
As the batteries partially balance the energy excesses and deficits already within the buildings, the utilization of the storages leads to a decrease of the residential residual loads. However, this effect is not equally distributed over the year. Figure 7 shows that the residual loads are mainly reduced in hours of medium residential deficits between 2.5 MW and 5.0 MW. The additional equipment of battery storages reduces the remaining energy demand by up to 22.2%. The fraction of hours per year with energy excesses declines from 16.8% to 12.5% when additionally using batteries. However, hours with peak demand are not affected by the utilization of batteries. The analysis of the regional residential energy excesses follows a similar distribution. The utilization of batteries significantly reduces the lower positive excesses flows of less than 2.5 MW. Feed-in peaks remain unaffected if residential buildings are additionally equipped with batteries that are managed with the goal of maximizing self-consumption.
Similar to the residual load, the storage operations of the batteries influence the flows between the residential buildings mainly in the medium range. They reduce the regional balancing by up to 90%, if all PV systems are coupled to batteries. The balancing flows peaking 3.0 MW remain constant independently of the degree of coupled batteries.
Figure 8 shows that for high PV expansions, the impact of storages on residual load and balancing flows is reversed. The residual loads are reduced in a much stronger way than the balancing flows if the PV systems are additionally coupled to batteries. Especially the energy excesses in the medium ranges are decreased by the utilization of batteries. The decline of the negative grid flows between 0 MW and −16.5 MW ranges from 0.5 kW to 2.5 kW if all residential buildings are equipped with PV systems and batteries. However, the highest PV excesses of less than −16.5 MW remain constant independently of the degree of battery utilization. When analyzing the energy deficits, the storage effect becomes also visible for the range of positive residual loads by a reduction of 19.5% on average.
In contrast to the residual loads, the balancing flows are marginal at the PV installation rate of 99%. Consequently, the decreasing effect of the battery storages on grid balancing is much weaker than for lower PV installation rates. Especially, in the medium range, the balancing flows decline by less than 1% when simulating the additional utilization of the battery storages. The highest reduction from 3.26 MW to 2.56 MW is obtained at the peak load when all PV systems are additionally equipped with batteries.

4. Discussion

4.1. Relation Between Regional Balancing, Energy Surplusses and Self-Consumption

In this paper, we analyzed the effects of PV installation rates and battery coupling on self-consumption and excesses in a regional case study. We used the example of a real distribution of houses in Southern Germany and the hourly electricity consumption patterns to study through simulations the effects.
The integration of residential PV energy and the potential effects of battery storages are strongly dependent on the installation and coupling rates. At PV installation rates of less than 10%, the decentral energy production has limited impact on the residual load of the residential buildings. As the majority of buildings are entirely supplied by the grid, backflows arising from PV surpluses can be fully consumed by the residential buildings. As the PV production is low compared to the total energy consumption, the influence of PV systems and residential batteries on the energy flows is marginal on regional scale.
This is different for a higher PV installation rate as balancing effects and self-sufficiency rise when increasing the PV installation rate. In our example, the spatial grid balancing due to differences in the residual loads reaches its maximum if one third of the buildings are equipped with PV systems. Residential buildings with positive residual loads can partly consume PV excesses from the grids. For this reason, a higher share of PV energy can be used for the supply of the residential buildings additionally to self-consumption.
The additional utilization of battery storage systems reduces these grid-balancing effects by raising self-consumption, which is especially observable at PV installation rate around 30%. Energy excesses, which would supply the other residential buildings, are then used for charging the batteries. The shifts in the energy flows also become apparent in the distribution of the residual loads. The utilization of batteries generally reduces the negative residual loads. However, the hours with residential energy deficits are increased by up to 4%, as the higher self-consumption leads to less energy surpluses in the grids available for regional balancing. Consequently, the share of energy consumption covered by residential PV energy production remains at the same level. The decrease of the total energy excesses through the storages is limited.
As the grids are not simulated in our study, bottlenecks impeding the energy exchange between the buildings are not considered. It is assumed that the grid enables the full energy exchange between the residential buildings. This means that the obtained values are upper bounds for the spatial balancing effects, which can be reached if the grid infrastructure is adjusted to the obtained flows.
For a high PV installation rate of more than 80%, the grid balancing effects diminish, whereas self-sufficiency rises. This can be explained by the increasing number of buildings equipped with PV systems. The high self-supply reduces the residential energy deficits, so that rising PV surpluses can be less effectively balanced via the grid. For PV rates of 99% for instance, the consumption of the PV power production is solely dependent on residential self-consumption, as the regional balancing effect decreases to almost zero.
Consequently, high PV installation rates have strong effects on the residual loads leading to an extreme rise of backflows. At full PV expansion, the maximum negative residual load is increased up to three times the peak demand.
The utilization of batteries significantly reduces the arising energy excesses to the benefit of increasing self-consumption rates. As the regional balancing effect diminishes for high PV installation rates, the storages are charged by PV surpluses, which would otherwise entirely lead to excesses in the grids. Especially negative residual loads in the lower and medium range are decreased when using the batteries.
The average increase in self-consumption of 29% obtained in this study exceeds the values found in Ref. [15]. This may be explained by increased efficiency rates of PV and battery systems compared to earlier studies. We consider the obtained results to be robust due to the large numbers of buildings with varying PV sizes, battery capacities, and consumption loads. The temporal extent of the simulations set to five years is also long enough in order to represent average meteorological conditions for PV production.
However, the utilization of residential battery storage systems does not contribute to the reduction of extreme backflows, as the highest negative residual loads remain unaffected by the utilization of storages. This can be explained by the selected battery charging strategy optimized for maximizing self-consumption. The obtained peaks usually occur in summer days, when the inclinations between panels and sun have reached the optimum and a large amount of PV energy is produced. During these days, the PV surplus of the late midday hours is completely fed into the grids as the batteries are already fully charged by the energy excesses of the morning hours. Our results are in line with previous studies [17,18,23] showing that on sunny days reverse power flows are likely despite the utilization of the storages.

4.2. Applicability of the Results to Other Municipalities

Two factors decide about the direct transferability of the obtained findings to other regions: The first aspect is the irradiation potential, which decides on the productivity of the PV systems. With an average annual irradiation of 1150 kWh/m2, the study region is representative e.g., for the mid-latitudes of Central Europe. For areas with higher PV potentials, grid-balancing effects will probably reach their maxima already at lower PV installation rates. Residential energy excesses occur at lower shares of buildings equipped with PV systems, which are available for the other households of the community. In order to understand how far grid balancing effects and the PV installation rate are influenced under higher natural potentials, further research is necessary at this point. However, the impact of residential battery storages, which increase self-consumption rates at declining grid-balancing effects, remains similar.
One aspect, which is not considered in this study, is the effect of shading of neighboring buildings, vegetation, or obstacles on the roofs. Their incorporation would impose unsatisfiable requirements to the availability of data and computational resources and is thus neglected in the study design. Although it is assumed that these effects are eliminated as far as possible by the optimal selection of the PV location, they still can reduce the PV production of a building especially in months of low solar inclination angles. It is not yet clear, how far these effects become apparent on regional scale.
The second factor affecting the transferability to other municipalities is the distribution of the residential energy consumption. The results obtained in this study are valid for regions with a similar relation between PV potential and energy consumption rates shown in Figure 2b. This accounts for municipalities in rural or suburban areas with high shares of detached and terraced houses. In these regions, shading effects by neighboring buildings could be of lower impact compared to cities which are commonly characterized by much smaller site areas.
The results cannot be directly applied to heavily urbanized communities with high shares of multistory buildings. These types of buildings have smaller ratios of their PV production potentials to consumption rates due to the limited space for rooftop mounted PV systems at a high number of residents. This indicates that the degree of self-consumption is much higher compared to detached houses, which reduces regional balancing effects. In these cases, the PV installation rate, which maximizes grid balancing, is shifted from 30% as obtained for the study region to higher values.
Apart from the utilization of batteries, heat pumps or electric cars also have the potential to decrease residential PV energy excesses within a house grid network. The utilization of an electrically powered heating or car raises consumption rates and varies residual loads due to different load profiles. These two parameters strongly influence the degree of self-consumption of a building and the magnitude of energy excesses fed into the grids. For this reason, at a high degree of electrification of traffic and heating in a municipality, the presented approach will need to undergo an update of the framework condition.

4.3. Policy Implications

Several conclusions can be drawn concerning political incentives facilitating the transition to renewable energy systems in regions dominated by detached or terraced residential buildings. At low shares of residential PV systems, financial support for PV systems can be offered without leading to significant changes in the residential residual loads in a regional energy system. The expansion of net metering models could contribute to the PV integration more efficiently than subsidies for battery storages. At medium PV-rates of 30%, the financial support of residential batteries would not lead to an enhanced grid integration of PV systems, as the batteries raise self-consumption at the expense of the regional balancing. A sufficiently large grid infrastructure between the residential buildings leads to similar effects as the broad utilization of batteries. Therefore, potential funding could better focus on the expansion and reinforcement of the local grids than on the expansion of batteries, if regional balancing flows are limited by an insufficient grid infrastructure.
If a large share of residential buildings is already equipped with PV systems, the utilization of the residential storages can help to reduce energy excesses. In this case, incentives for battery systems could be a suitable instrument to motivate households to purchase residential storages. If the energy systems are dominated by the residential sector, additional measures like central storages or feed-in limits are necessary in order to reduce the extreme energy excesses.

5. Conclusions

In the transition to renewable energy systems, residential PV and battery storage systems are among the most popular technologies for house owners. Consequently, they are often fostered by governmental institutions. The expansion of rooftop PV power fundamentally changes the structure of the energy systems posing new challenges to the grid suppliers. The impact of the prosumers on the residential residual loads and resulting requirements for their integration is thereby dependent on the PV and battery installation rate:
  • If less than 10% of the residential buildings are equipped with PV systems, the prosumers induce minor changes of the residential residual load on regional scale under the assumption of an adequate grid infrastructure. This is also valid, if batteries are additionally utilized. State subsidies for residential PV can be fully offered without constraints.
  • For PV installation rates of one third, the balancing arising from differences in the residual loads of the buildings reaches a peak value. At the maximum, 18% of the total residential consumption is produced on other buildings. The utilization of decentral battery storage systems mainly decreases this balancing effect while raising self-consumption. The magnitudes of energy excesses are not significantly reduced by the storages. Due to this, financial supporting schemes should concentrate on grid expansion and the removal of bottlenecks to enable the full energy exchange between the buildings. Incentives for residential storages do not lead to the further integration of the PV systems.
  • For high degrees of buildings equipped with rooftop mounted PV systems, two third of the produced PV power cannot be consumed by the residential buildings. In this case, residential batteries can contribute to a better grid integration of residential PV by reducing low and intermediate negative residual loads. With the utilization of batteries, the residential degree of self-sufficiency reaches the maximum of 58%. The energy excesses, which cannot be consumed by the residential buildings, still account for half of the total PV production. If the residential PV expansion has already reached these high levels, state incentives should set the focus on the increased purchase of battery storage systems instead of single PV systems, as the storages help to reduce backflows into the local grids. Additional mitigation measures become mandatory for energy systems dominated by the residential sector in order to prevent power quality issues.
The obtained results are valid for rural or suburban municipalities at mid-latitudes with high shares of detached or terraced houses and sufficient potential for installing PV systems on their roofs. For these areas of application, we recommend a flexible adjustment of governmental subsidies for battery systems to the current levels of residential PV expansion in order to push the energy transition forward and reduce the efforts for the grid integration of rooftop PV. For rural regions with higher PV potentials, the maximum of regional balancing flows will be obtained at lower PV installation rates. This paper shows that further research is necessary to assess the needs for grid strengthening between the residential buildings for the partial PV expansion and battery utilization.

Author Contributions

Conceptualization, A.R. and M.D.; Data curation, A.R. and V.L.; Formal analysis, A.R.; Funding acquisition, W.M.; Investigation, A.R.; Methodology, A.R.; Project administration, M.D.; Resources, W.M.; Software, A.R., V.L. and W.M.; Supervision, W.M.; Validation, V.L.; Visualization, A.R.; Writing – original draft, A.R.; Writing – review & editing, V.L., M.D. and W.M. All authors have read and agreed to the published version of the manuscript.

Funding

This research was funded by the German Federal Ministry of Education and Research (BMBF), grant number 033L155AN.

Acknowledgments

The authors would like to thank Dr. Monika Prasch (LfL) and Bürgerstiftung Energiewende Oberland (EWO) for their support and the German weather service DWD for the data provision.

Conflicts of Interest

The authors declare no conflict of interest. The funders had no role in the design of the study; in the collection, analyses, or interpretation of data; in the writing of the manuscript, or in the decision to publish the results.

Appendix A

Figure A1. The load factors for three different daily profiles and the seasons (a) winter, (b) spring, and (c) summer represent the hourly percentage of the annual consumption in 1.000kWh/a of a residential building (Source: [32,33]).
Energies 13 02738 g0a1

References

  1. Bruckner, T.; Bashmakov, I.A.; Mulugetta, Y.; Chum, H.; De la Vega Navarro, A.; Edmonds, J.; Faaij, A.; Fungtammasan, B.; Garg, A.; Hertwich, E.; et al. Energy Systems; Climate Change 2014: Mitigation of Climate Change. Contribution of Working Group III to the Fifth Assessment Report of the Intergovernmental Panel on Climate Change; Edenhofer, O., Pichs-Madruga, R., Sokona, Y., Farahani, E., Kadner, S., Seyboth, K., Adler, A., Baum, I., Brunner, S., Eickemeier, P., et al., Eds.; Cambridge University Press: Cambridge, UK; New York, NY, USA, 2014. [Google Scholar]
  2. International Energy Agency IEA. Data and Statistics. CO2 Emissions from Electricity and Heat by Energy Source, World 1990–2018. Available online: https://www.iea.org/data-and-statistics (accessed on 19 November 2019).
  3. Rogelj, J.; Shindell, D.; Jiang, K.; Fifita, S.; Forster, P.; Ginzburg, V.; Handa, C.; Kheshgi, H.; Kobayashi, S.; Kriegler, E.; et al. Mitigation Pathways Compatible with 1.5 °C in the Context of Sustainable Development; Global Warming of 1.5 °C. An IPCC Special Report on the impacts of global warming of 1.5 °C above pre-industrial levels and related global greenhouse gas emission pathways, in the context of strengthening the global response to the threat of climate change, sustainable development, and efforts to eradicate poverty; Masson-Delmotte, V., Zhai, P., Pörtner, H.O., Roberts, D., Skea, J., Shukla, P.R., Pirani, A., Moufouma-Okia, W., Péan, C., Pidcock, R., et al., Eds.; 2018; In Press. [Google Scholar]
  4. Layton, B.E. A comparison of energy densities of prevalent energy sources in units of Joules per cubic meter. Int. J. Green Energy 2008, 5, 438–455. [Google Scholar] [CrossRef]
  5. Huber, N.; Hergert, R.; Price, B.; Zäch, C.; Hersperger, A.M.; Pütz, M.; Kienast, F.; Bolliger, J. Renewable energy sources: Conflicts and opportunities in a changing landscape. Reg. Environ. Chang. 2017, 17, 1241–1255. [Google Scholar] [CrossRef]
  6. Schram, W.; Louwen, A.; Lampropoulos, I.; Van Sark, W. Comparison of the greenhouse gas emission reduction potential of energy communities. Energies 2019, 12, 4440. [Google Scholar] [CrossRef] [Green Version]
  7. Sütterlin, B.; Siegrist, M. Public acceptance of renewable energy technologies from an abstract versus concrete perspective and the positive imagery of solar power. Energy Policy 2017, 106, 356–366. [Google Scholar] [CrossRef]
  8. EEG. Erneuerbare-Energien-Gesetz (Renewable Energy Sources Act) 2017; Bundesgesetzblatt I: Bonn, Germany, 2014; p. 1066. [Google Scholar]
  9. Gosens, J.; Kåberger, T.; Wang, Y. China’s next renewable energy revolution: Goals and mechanisms in the 13th Five Year Plan for energy. Energy Sci. Eng. 2017, 5, 141–155. [Google Scholar] [CrossRef]
  10. SolarPower Europe. Global Market Outlook For Solar Power 2019–2023; Solar Power Europe: Brussels, Belgium, 2019; Available online: https://www.solarpowereurope.org/wp-content/uploads/2019/07/SolarPower-Europe_Global-Market-Outlook-2019-2023.pdf (accessed on 11 November 2019).
  11. Bauknecht, D.; Funcke, S.; Vogel, M. Is small beautiful? A framework for assessing decentralised electricity systems. Renew. Sustain. Energy Rev. 2020, 118, 109543. [Google Scholar] [CrossRef]
  12. Haque, M.M.; Wolfs, P. A review of high PV penetrations in LV distribution networks: Present status, impacts and mitigation measures. Renew. Sustain. Energy Rev. 2016, 62, 1195–1208. [Google Scholar] [CrossRef]
  13. Figgener, J.; Haberschusz, D.; Kairies, K.P.; Wessels, O.; Tepe, B.; Sauer, D.U. Wissenschaftliches Mess- und Evaluierungsprogramm Solarstromspeicher 2.0—Jahresbericht 2018; Institut für Stromrichtertechnik und Elektrische Antriebe der RWTH Aachen: Aachen, Germany, 2018; Available online: http://www.speichermonitoring.de/fileadmin/user_upload/Speichermonitoring_Jahresbericht_2018_ISEA_RWTH_Aachen.pdf (accessed on 3 November 2019).
  14. Malhotra, A.; Battke, B.; Beuse, M.; Stephan, A.; Schmidt, T. Use cases for stationary battery technologies: A review of the literature and existing projects. Renew. Sustain. Energy Rev. 2016, 56, 705–721. [Google Scholar] [CrossRef]
  15. Luthander, R.; Widén, J.; Nilsson, D.; Palm, J. Photovoltaic self-consumption in buildings: A review. Appl. Energy 2015, 142, 80–94. [Google Scholar] [CrossRef] [Green Version]
  16. Moshövel, J.; Kairies, K.-P.; Magnor, D.; Leuthold, M.; Bost, M.; Gährs, S.; Szczechowicz, E.; Cramer, M.; Sauer, D.U. Analysis of the maximal possible grid relief from PV-peak-power impacts by using storage systems for increased self-consumption. Appl. Energy 2015, 137, 567–575. [Google Scholar] [CrossRef]
  17. Resch, M.; Ramadhani, B.; Bühler, J.; Sumper, A. Comparison of control strategies of residential PV storage systems. In Proceedings of the 9th International Renewable Energy Storage Conference and Exhibition (IRES 2015), Düsseldorf, Germany, 9–11 March 2015; pp. 1–18. [Google Scholar]
  18. Young, S.; Bruce, A.; MacGill, I. Potential impacts of residential PV and battery storage on Australia’s electricity networks under different tariffs. Energy Policy 2019, 128, 616–627. [Google Scholar] [CrossRef]
  19. Fares, R.L.; Webber, M.E. The impacts of storing solar energy in the home to reduce reliance on the utility. Nat. Energy 2017, 2, 17001. [Google Scholar] [CrossRef]
  20. Lee, M.; Hong, T.; Jeong, K.; Kim, J. A bottom-up approach for estimating the economic potential of the rooftop solar photovoltaic system considering the spatial and temporal diversity. Appl. Energy 2018, 232, 640–656. [Google Scholar] [CrossRef]
  21. Hong, T.; Lee, M.; Koo, C.; Jeong, K.; Kim, J. Development of a method for estimating the rooftop solar photovoltaic (PV) potential by analyzing the available rooftop area using hillshade analysis. Appl. Energy 2017, 194, 320–332. [Google Scholar] [CrossRef]
  22. Litjens, G.; Kausika, B.; Worrell, E.; van Sark, W. A spatio-temporal city-scale assessment of residential photovoltaic power integration scenarios. Sol. Energy 2018, 174, 1185–1197. [Google Scholar] [CrossRef]
  23. Reimuth, A.; Prasch, M.; Locherer, V.; Danner, M.; Mauser, W. Influence of different battery charging strategies on residual grid power flows and self-consumption rates at regional scale. Appl. Energy 2019, 238, 572–581. [Google Scholar] [CrossRef]
  24. Agnew, S.; Dargusch, P. Effect of residential solar and storage on centralized electricity supply systems. Nat. Clim. Chang. 2015, 5, 315–318. [Google Scholar] [CrossRef]
  25. Mauser, W.; Bach, H. PROMET—Large scale distributed hydrological modelling to study the impact of climate change on the water flows of mountain watersheds. J. Hydrol. 2009, 376, 362–377. [Google Scholar] [CrossRef]
  26. Mauser, W.; Bach, H.; Frank, T.; Hank, T.; Koch, F.; Marke, T.; Muerth, M.; Prasch, M.; Strasser, U.; Zabel, F. PROMET–Processes of Mass and Energy Transfer. An Integrated Land Surface Processes and Human Impacts Simulator for the Quantitative Exploration of Human-Environment Relations. Part 1: Algorithms Theoretical Baseline Document. Available online: https://www.geographie.uni-muenchen.de/department/fiona/forschung/projekte/promet_handbook/promethandbook1.pdf (accessed on 11 September 2019).
  27. Quaschning, V. Regenerative Energiesysteme. Technlogie—Berechnung—Simulation; Carl Hanser Verlag: München, Germany, 2013. [Google Scholar]
  28. Giddings, J.; LaChapelle, E. Diffusion theory applied to radiant energy distribution and albedo of snow. J. Geophys. Res. 1961, 66, 181–189. [Google Scholar] [CrossRef]
  29. Andrews, R.W.; Pollard, A.; Pearce, J.M. The effects of snowfall on solar photovoltaic performance. Sol. Energy 2013, 92, 84–97. [Google Scholar] [CrossRef] [Green Version]
  30. Locherer, V. Technical Release No. 1: INOLA Software Documentation. The Solar Energy Component. Solar Power and Solar Heat Modules; Department of Geography at LMU Munich: Munich, Germany, 2018. [Google Scholar] [CrossRef]
  31. Stadtwerke Unna. VDEW Lastprofile. Version October 10, 2015. Available online: http://www.gipsprojekt.de/featureGips/Gips;jsessionid=36DBE8EAF15E68329A3F6493121749DB?Session-Man-dant=sw_unna&Anwendung=EnWGKnotenAnzeigen&PrimaryId=133029&Mandantkuerzel=sw_unna&Navigation=J (accessed on 20 December 2019).
  32. VDEW. Repräsentative VDEW-Lastprofile; VDEW: Frankfurt, Germany, 1999; Available online: https://www.bdew.de/media/documents/1999_Repraesentative-VDEW-Lastprofile.pdf (accessed on 7 November 2019).
  33. Prasch, M.; Reimuth, A. Technical Release No. 5: INOLA Software Documentation. The Energy Consumption Component; Department of Geography at LMU Munich: Munich, Germany, 2018. [Google Scholar] [CrossRef]
  34. Reimuth, A. Technical Release No. 6: INOLA Software Documentation. The Energy Storage Component; Department of Geography at LMU Munich: Munich, Germany, 2017. [Google Scholar] [CrossRef]
  35. Reimuth, A. Technical Release No. 7: INOLA Software Documentation. The Energy Management Component; Department of Geography at LMU Munich: Munich, Germany, 2017. [Google Scholar] [CrossRef]
  36. Olaszi, B.D.; Ladanyi, J. Comparison of different discharge strategies of grid-connected residential PV systems with energy storage in perspective of optimal battery energy storage system sizing. Renew. Sustain. Energy Rev. 2017, 75, 710–718. [Google Scholar] [CrossRef]
  37. DWD Climate Data Center (CDC). Rasterdaten der Vieljährigen Mittleren Monatssummen und der Vieljährigen Mittleren Jahressumme für die Globalstrahlung auf die Horizontale Ebene für Deutschland basierend auf Boden- und Satellitenmessungen, Version V003. 17 August 2016. Available online: https://opendata.dwd.de/climate_environment/CDC/grids_germany/multi_annual/radiation_global/ (accessed on 5 November 2019).
  38. Bayerisches Landesamt für Digitalisierung, Breitband und Vermessung. Digital Terrain Model (25 m); Munich, Germany, 2015. [Google Scholar]
  39. Bayerisches Landesamt für Digitalisierung, Breitband und Vermessung. 3D-Building Model (LoD2); Munich, Germany, 2015. [Google Scholar]
  40. Bayerische Vermessungsverwaltung. Administrative Boundaries. Available online: www.geodaten.bayern.de (accessed on 11 November 2019).
  41. Bayerisches Landesamt für Statistik. Statistik Kommunal 2018. Stadt Bad Tölz. 09 173 112. Eine Auswahl Wichtiger Statistischer Daten. Available online: https://www.statistik.bayern.de/mam/produkte/statistik_kommunal/2018/09173112.pdf (accessed on 11 November 2019).
  42. Stadtwerke Bad Tölz. Feed-in data of Bad Tölz; Unpublished dataset, Stadtwerke Bad Tölz: Bad Tölz, Germany, 2019. [Google Scholar]
  43. DESTATIS. Material- und Energieflüsse. Stromverbrauch der Privaten Haushalte nach Haushaltsgrößenklassen. Available online: https://www.destatis.de/DE/Themen/Gesellschaft-Umwelt/Umwelt/Materialfluesse-Energiefluesse/Tabellen/stromverbrauch-haushalte.html (accessed on 4 November 2019).
  44. Arbeitsgemeinschaft der Vermessungsverwaltungen der Länder der Bundesrepublik Deutschland. ATKIS ® Basis DLM25 (AAA). 2015. Available online: https://www.ldbv.bayern.de/file/pdf/8479/basis-dlm-aaa.pdf (accessed on 11 November 2019).
  45. Fraunhofer, I.S.E. Recent Facts about Photovoltaics in Germany. Version of October 14, 2019; Fraunhofer ISE: Freiburg, Germany, 2019; Available online: https://www.pv-fakten.de (accessed on 11 November 2019).
  46. Opiyo, N. Energy storage systems for PV-based communal grids. J. Energy Storage 2016, 7, 1–12. [Google Scholar] [CrossRef] [Green Version]
  47. Schoop, E. Stationäre Batterieanlagen. Auslegung, Installation und Wartung, 1st ed.; HUSS-Medien: Berlin, Germany, 2013. [Google Scholar]
  48. Statistische Ämter des Bundes und der Länder. Gebäude mit Wohnraum nach Baujahr (Jahrzwanzigste) und Art des Gebäudes. Auszählungsergebnis aus der Gebäude- und Wohnungszählung. Stadt Bad Tölz. Zensus Mai 2011. Available online: https://ergebnisse.zensus2011.de/#StaticContent:091730112112,GWZ_1_2_1,m,table (accessed on 5 November 2019).
  49. VDI. VDI Guideline 3807; Characteristic consumption values for buildings; Beuth-Verlag: Berlin, Germany, 2013. [Google Scholar]
  50. Bayerisches Landesamt für Statistik. Gebäude- und Wohnungsbestand: Gemeinden, Wohngebäude, Wohnungen, Wohnfläche, Stichtag. Fortschreibung des Wohngebäude- und Wohnungsbestandes. 31 December 2014. Available online: https://www.statistikdaten.bayern.de/genesis/online/ (accessed on 5 December 2019).
  51. Bayerisches Staatsministerium für Wirtschaft und Medien, Energie und Technologie. Bayerischer Solaratlas. Solare Energiegewinnnung; Bayerisches Staatsministerium für Wirtschaft und Medien, Energie und Technologie: Munich, Germany, 2015; Available online: https://www.stmwi.bayern.de/fileadmin/user_upload/stmwi/Publikationen/2015/2015-11-09-Bayerischer_Solaratlas.pdf (accessed on 20 December 2019).
  52. Bundesnetzagentur. PV Data Registrations (Excluding Ground-Mounted Installations). Data Submissions from 1 July 2017 to 31 January 2019. Available online: https://www.bundesnetzagentur.de/EN/Areas/Energy/Companies/RenewableEnergy/Facts_Figures_EEG/Register_data_tariffs/EEG_registerdata_payments_node.html (accessed on 11 November 2019).
Figure 1. Location of the study area and distribution of residential buildings (Data source: [38,39,40]).
Energies 13 02738 g001
Figure 2. (a) Distribution of floor numbers used for the estimation of the living areas; (b) distribution of the average consumption rates per building.
Energies 13 02738 g002
Figure 3. (a) Distribution of the nominal PV power dimensioned according to the current German distribution considering the technical constraints of the buildings; (b) distribution of the ratios between nominal PV power and annual demand (right side).
Energies 13 02738 g003
Figure 4. (a) Regional balancing and (b) self-sufficiency for different PV installation and battery-coupling rates as percentage of consumption (with the PV installation rate of 32% in dashed grey).
Energies 13 02738 g004
Figure 5. (a) Self-consumption and (b) energy excesses for different PV installation and battery-coupling rates as percentage of consumption (with the PV installation rate of 32% in dashed grey).
Energies 13 02738 g005
Figure 6. Duration curves of (a) residual loads of the residential buildings and (b) balancing flows between the buildings for different PV installation rates without the utilization of battery storage systems. The residual load and distribution of the balancing flows for PV installation rate leading to the highest regional balancing are marked in black.
Energies 13 02738 g006
Figure 7. Duration curves of (a) residual loads and (b) balancing flows for different battery-coupling rates at a PV installation rate of 32%.
Energies 13 02738 g007
Figure 8. Duration curves of (a) residual loads and (b) balancing flows for different battery-coupling rates at a PV installation rate of 99%.
Energies 13 02738 g008
Table 1. Specification of the input parameters of the PV and battery model.
ParameterValueSource
PV modelEfficiency module [–]0.173[45]
Efficiency inverter [–]0.98[45]
Temperature coefficient [–]0.45[28]
Constant [–]30.5[28]
Ageing factor [–]0.001[45]
Battery modelNominal voltage [V]3.6[46]
Power energy density ratio [W/Wh]1[46]
Maximum number of cycles [–]3000[46]
Hourly losses [–]0.00000625[47]
(Dis-) Charging Efficiency [–]0.99[46]
Initial maximum depth of discharge [–]0.60[46]

