Article

Influence of Rotation Speed and Air Pressure on the Down the Hole Drilling Velocity for Borehole Heat Exchanger Installation

1
Laboratory of Geoenergetics, AGH University of Science and Technology in Krakow, al. Adama Mickiewicza 30, 30-059 Krakow, Poland
2
Faculty of Engineering and Applied Science, University of Ontario Institute of Technology, 2000 Simcoe Street North, Oshawa, ON L1G 0C5, Canada
*
Author to whom correspondence should be addressed.
Energies 2020, 13(11), 2716; https://doi.org/10.3390/en13112716
Submission received: 4 April 2020 / Revised: 17 May 2020 / Accepted: 18 May 2020 / Published: 28 May 2020
(This article belongs to the Special Issue Drilling Technologies for the Next Generations)

Abstract

:
The relation between rotation speed, air pressure and the velocity of air-rotary drilling using the down the hole method is determined in an empirical manner. For the study, velocity measurements are obtained for combinations of the aforementioned parameters during fieldwork for the installation of borehole heat exchangers near Lublin, Poland. The tests consider three drill bit diameters—110, 127 and 140 mm; three rotational speeds—20, 40 and 60 1/min; and three air pressures—16, 20 and 24 bar. The borehole heat exchangers need 100 m deep wells. The lithology consists mainly of loess and clays to 24 m, sand and carbonate rocks to 36 m, and marls and limestone to 100 m. It is found that the highest drilling velocity is achieved when the greatest pressure is applied, while the lowest drilling velocity is connected to the lowest pressure. However, the relation between rotation speed and drilling velocity is more complex, as drilling velocity seems to be more affected by depth. Therefore, lithology can be a major factor. The results may find direct use in drilling, and provide a basis for further studies on the optimization of drilling technology.

1. Introduction

Heat pumps were first described in the mid-19th century. In 1852, it was proposed to use them for space heating, as an open cycle tool connected to a compressor, and two water tanks serving as upper and lower heat sources. However, the idea never came to fruition, despite multiple tries. The first practical use for the heat pump came much later—in 1928, T.G. Haldane created an installation for heating his own house [1,2]. First, industrial, high-power heat pumps were used in the interwar period in the USA. In the post-war period, a significant increase in the use of heat pumps was noted in various countries [3].
There are two basic usage modes for geothermal heat pumps (also referred to as ground-source heat pumps). The first is ground coupled (vertical and horizontal), closed loop systems (ground-coupled heat exchangers) [4], the other is groundwater, open loop systems [5,6]. The heat pump allows for the increase of the temperature, to make it useful for devices like radiators. Note also that heat pumps can be used advantageously in hybrid systems for space heating/cooling [7].
This process can be compared to the work cycle of a circulator pump, where the pumped medium serves as the heat itself, and there is a relation between pressure and temperature. In order to pump the liquid, the circulator pump creates higher pressure which potentially leads to the movement of a mass. Similarly, the heat pump increases the temperature of the working medium, which makes the heat exchange easier. Circulator pumps force fluid flow at the expense of the supplied energy, which increases the pressure. The aim of the heat pump is to create heat flow due to the increase of temperature—the heat flow potential [8,9]. Heat pumps are in constant development. Nowadays, hybrid heat pumps are in use [10].
Geothermal heat pumps together with heat exchangers form systems. There are many types of heat exchangers used in geothermal systems, such as: borehole heat exchangers, horizontal in series, horizontal in parallel, tube in trench, spiral horizontal, spiral vertical [11], manifold trench, and energy piles [12,13].
Borehole heat exchangers (BHE) are most often divided into the following categories: single U-tube, double U-tube, and coaxial systems. The source of heat or cold (rock mass) must provide a certain amount of energy to the receiving system through the whole year. The number, depth and placement of borehole heat exchangers, along with their type and construction, significantly influences the economic conditions of geothermal projects. Most frequently, single U-tube installations up to 200 m in depth are applied. Deeper installations tend to be coaxial [14,15]. The heat exchanged with the rock mass is mainly influenced by the thermal conductivity of the rocks [3,16,17]. Underground water flow and rock fracturing can also improve the efficiency of BHE fields [18,19,20].
The design of borehole heat exchangers has been considered by Aresti et al. [21]. Moreover, there is a growing interest in the geothermal resources available at shallow depths beneath areas of urban infrastructure [22]. To this end, oblique BHEs are used with increasing frequency [23,24].
Computer modeling and simulation are used to properly design installations of BHEs [25,26]. Efficiency is an important parameter, concerning both the thermal efficiency [27,28] and the efficiency of structural elements [9,29,30]. The main thermal parameters considered in modeling and simulation are effective thermal conductivity [31,32] and thermal resistivity [32,33,34].
One of the main tests performed to understand the properties of rocks, and simultaneously the appropriate selection of BHEs for system designs, is the Thermal Response Test (TRT) [35,36,37]. TRTs are also performed for energy piles [38,39].
During both the planning and execution of drilling procedures, effectiveness is a key parameter [40]. Effective drilling can be achieved with the proper choice of equipment, and the use of a well-chosen drilling method [41].
One of the most effective and universally applied methods is the air method [42]. It is a beneficial option, both from the optimization perspective (being economically viable, having reasonable time and maintenance needs), as well as through its reduced environmental impact [43]. Among the many advantages of the method, the following are highlighted: the possibility of maximum rock penetration, longer life span of the drill bit, and maintaining cleanliness of the borehole, which is connected to better control of all processes occurring during drilling [44]. As for the need to constantly decrease the impact of drilling on the environment and the need to acquire samples for further research, cleanliness is a significant advantage of the air method in comparison to other methods, both in terms of the method itself (generally a “cleaner” one) and the output (which is less contaminated) [45,46].
The down the hole (DTH) method, using the air technique, tends to exhibit optimal results when drilling in hard rock. This is especially true if it is close to the surface, although it is similarly efficient in other rock formations [47].
Down the hole drilling uses an air-activated rotary drill bit, which in terms of its working manner is reminiscent of a jackhammer. Its components are made from alloy steel and tungsten carbide, which form the cutting and crushing surfaces, and are prone to continuous deterioration and even eventual destruction. They can later be replaced or rearranged in order to improve operation.
In the process of down the hole drilling, the hammer located at the bottom of the drill string circulates to ensure even penetration in drilling. During the drilling procedure, the drill bit face maintains constant contact with the surface. The placing of the pistons behind the drill bit face and the pressure they place on the drill bit leads to crushing of the rock. Air, together with drill cuttings, is taken from the borehole after each stroke of the pistons. Therefore, the drill bit always hits a clean surface [48]. This is where the aforementioned effectiveness and cleanliness of the method is particularly visible, as the drilling surface is always clean with down the hole drilling, whereas with other drilling methods the drill bit hits silt or crushed rock [49].
The down the hole method is sometimes considered expensive, as there is a need of purchasing air compressors, as well as constant maintenance and repairs of both the drill bit and the compressors [50]. However, the fast penetration of hard rock formations with the method normally compensates for the cost [51]. The down the hole method also poses little to no risk for the environment—in case drilling takes place through an aquifer, it is not affected by chemicals from drilling mud. In terms of equipment, the method compensates also by avoiding the need for mud pumps as well as their maintenance and repairs. Due to the characteristics of the DTH method, the life of the drill bit is considerably longer in comparison with other methods [52]. Moreover, the method enables calculation of the effectiveness of drilling. It is also the method most independent of the weather conditions [52,53].
An optimization process is possible for the down the hole drilling approach with the air method. The main parameters to consider in evaluation of the drilling method and potential improvements of its effectiveness have been identified by agencies such as the United States Department of Energy, and include time, costs, yield, progress and productivity [54]. Ratios of the aforementioned parameters can also be considered as effectiveness factors in a broad sense. Optimization of the drilling process then involves an evaluation and comparison of the pressure, rotation speed and drill bit diameter.
The tests considered in this study were conducted in Poland, in the city of Lublin, capital of the Lublin Voivodeship, which lies in the Lublin Basin. The region can be characterized as having a high geothermal ratio [55], and according to many sources, is valuable in terms of extraction of shale gas [56], due to being rich in organic matter in the form of Ordovician and Silurian clay-mudstone shales. This region has various drilling activities ongoing for a range of purposes [57].
The aim of this article is to improve understanding of the impact of rotational speed, drill bit diameter and air pressure on drilling velocity for the down the hole drilling method, for a given lithology. Such an enhanced understanding could permit improvement and optimization of drilling projects, such as those in the Lublin Basin in Poland. The results may find widespread use due to the growing interest in renewable energy technologies such as BHEs. The results of this field study can be used to optimize the down the hole hammer drilling process for borehole heat exchanger (BHE) installations for various locations.
To date, no BHE research aimed at reducing costs due to drilling has been reported, to the best of the authors’ knowledge. Often, hundreds or even thousands [58] of drilling operations are undertaken for BHE installations. It is prudent that the first drilled boreholes should be used for technical research. Then, based on the results, optimization can be undertaken to reduce both drilling costs and the entire investment cost for a system based on geothermal heat pumps.

2. Methods of Measurement and Preparation of Study

Drilling was conducted with a self-propelled drilling rig (Figure 1), using the down the hole method and air. Drilling time was recorded for depths between 54 and 108 m below ground surface, for each of the nine boreholes. The measured interval was further divided into three sections, in which each of the three parameters was varied: diameter of the drill bit, rotation speed and the air pressure.
After each section was drilled, each of the carbide buttons located on the drill bit was measured and checked in order to assess if any damage occurred (Figure 2). In all cases, no damage was observed.
The boreholes were drilled by the SATOR company. They were constructed for the purpose of installation of borehole heat exchangers (Figure 3).

3. Experiment Procedure

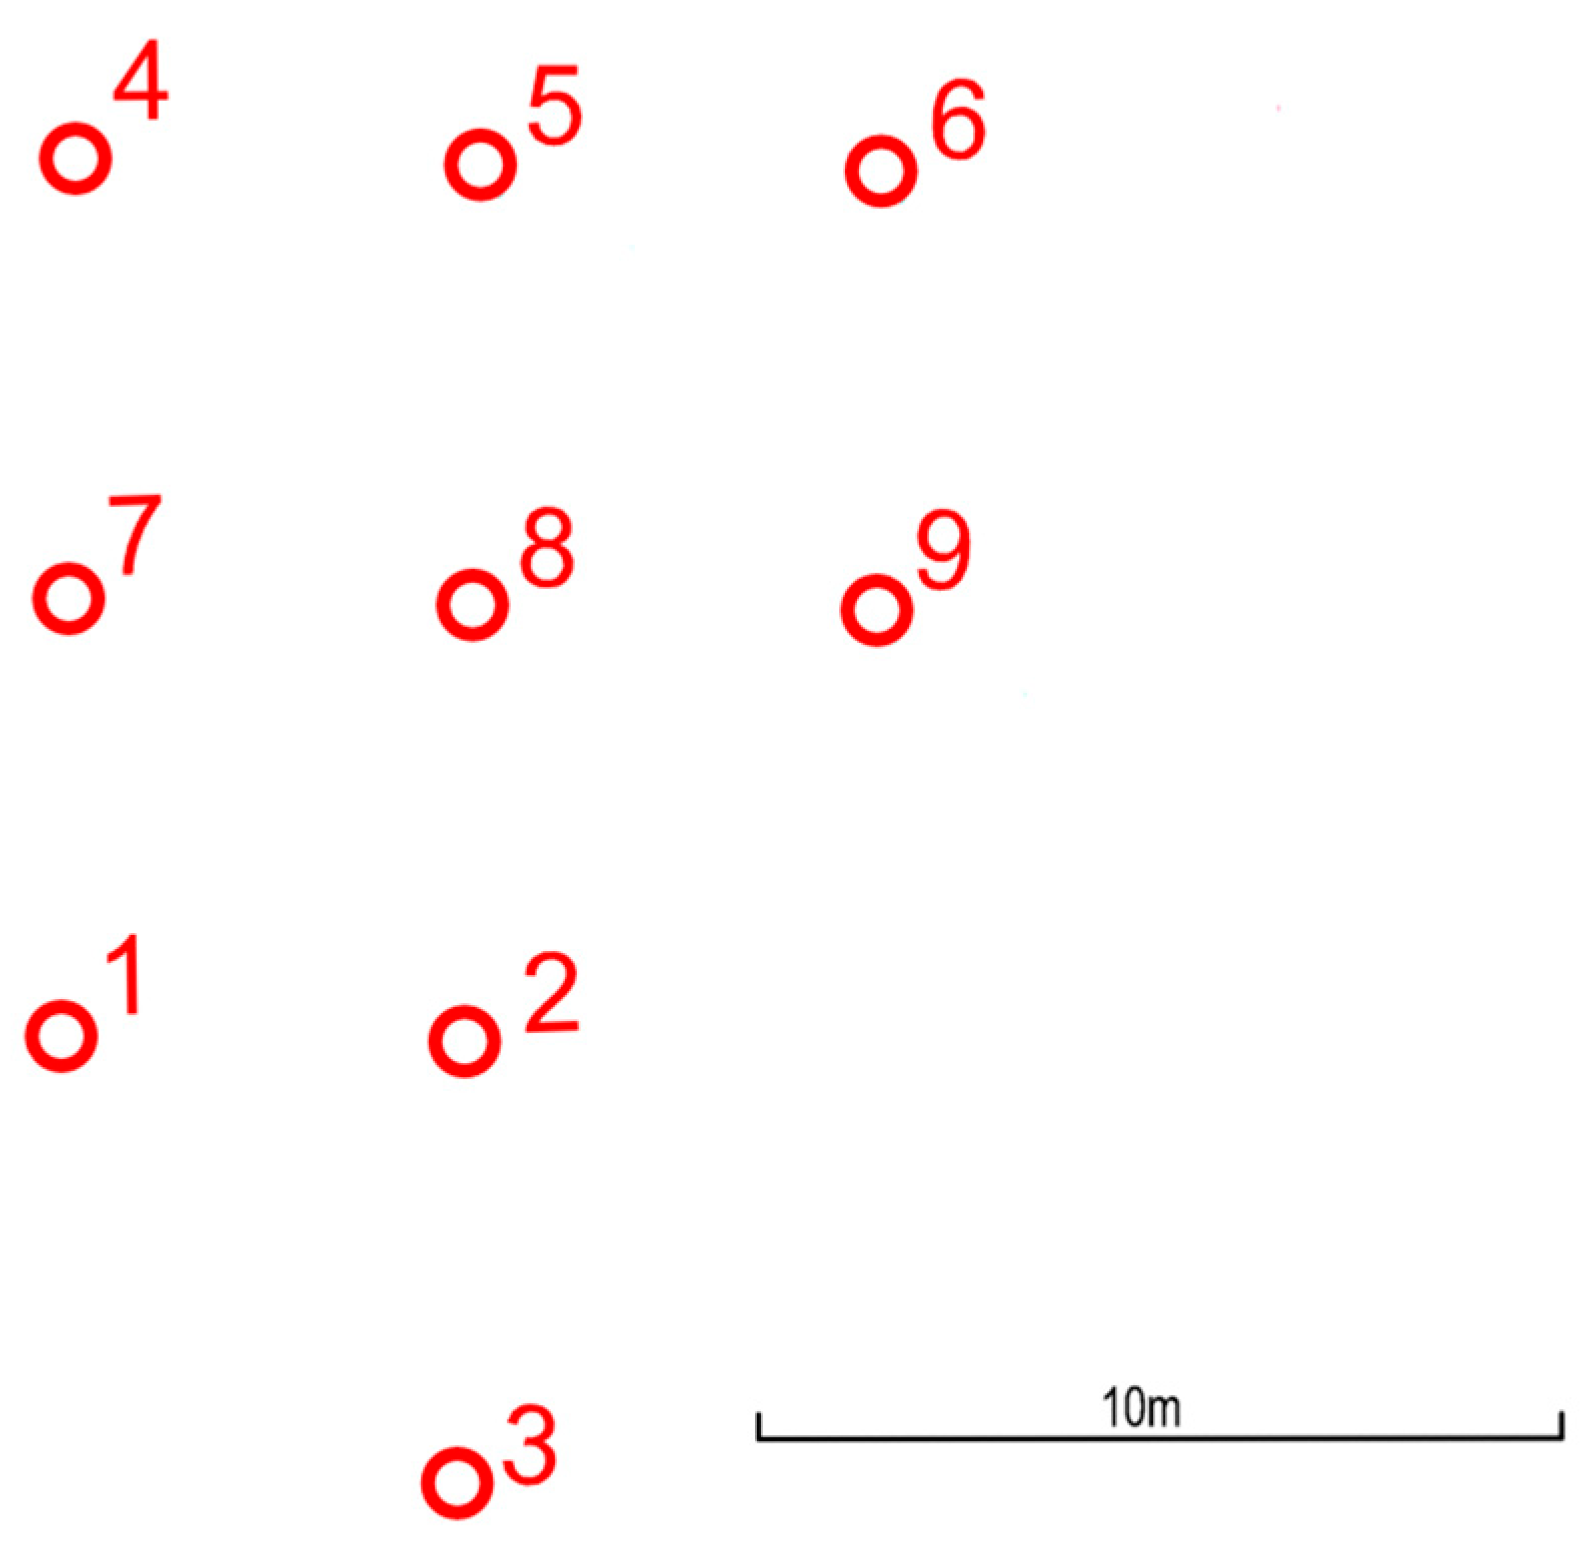
In order to conduct the study, nine boreholes were drilled using the rotary down the hole drilling with air method. All the boreholes in the study share a common geological profile (Figure 3) and the horizontal distance on the surface of the land to any other borehole is no more than six meters (Figure 4). A DTH 4 inch hammer was used for every borehole.
During the study, the working time of the hammer during the drilling procedure was measured. The drilling velocity was calculated by dividing the drilled interval (basic interval of one drilling pipe, assumed to be 3 m) by this time. The measurements were done for the section between 54 and 108 m below ground level, for each of the boreholes under study. These 54 m sections were divided into 6 m intervals (i.e., the length of double drill pipes, where one drill pipe length is 3 m), so there were nine measured intervals. The drilling procedure for each 6 m interval consisted of:
(a)
mining rock with a drill bit for an interval equal to the length of a single drill pipe (3 m),
(b)
unscrewing the drill head and drill string to add the next pipe and screw it on,
(c)
mining rock with a drill bit with an interval equal to the length of a single drill pipe (3 m),
(d)
unscrewing the drill head and drill string to add next pipe and screw it on.
During the drilling of consecutive intervals, the number of rotations per minute was varied between 20 and 60. For these settings, there are three measurement cycles with rotational speeds of 20, 40, 60 per minute.
Apart from the rotational speed, drill bit diameter and the pressure of compressed air were also varied. The three diameters examined for the drill bit were 110 mm, 127 mm and 140 mm, and the three pressure values were 16 bar, 20 bar and 24 bar.

4. Results

The relation between drilling velocity and rotations per minute is shown in this section for the considered drill bit diameters and air pressures. The clearest presentation of the results is achieved by further dividing the measured section 54–108 m below ground surface into three smaller sections: 54–72 m, 72–90 m and 90–108 m. The drill time in each section is the sum of the time of drilling two 3 m intervals, connected with the length of drill pipes. Then the changing tendencies at different depths can be observed. The changes due to the variations in geological profile and other external factors are not the subject of this study. The chosen method of interpretation leads to the possibility of observing the distinct relations between drilling velocity, pressure, drill bit diameter and rotation speed.

4.1. 110 mm Diameter Drill Bit

Figure 5, Figure 6 and Figure 7 present the results for the 110 mm drill bit.

4.2. 127 mm Diameter Drill Bit

Figure 8, Figure 9 and Figure 10 show the results for the 127 mm drill bit.

4.3. 140 mm Diameter Drill Bit

Figure 11, Figure 12 and Figure 13 show the results for the 140 mm drill bit.

5. Analysis and Discussion of Results

This section assesses and interprets the results of drilling individual borehole heat exchangers in similar lithology. The drilling was carried out with three drill bits at several working pressures of the hammer. Interpretations for each case are presented below.

5.1. Interpretation of Results for 110 mm Diameter Drill Bit

Boreholes number 1, 2 and 3 (Figure 4) were drilled with a 110 mm diameter drill bit. The highest drilling velocity in the section can be observed at the highest pressure, 24 bar. The lowest drilling velocity is linked to the lowest pressure (16 bar), except for one case (for depth 57–72 m and rotation speed of 60 rotations per minute), where the lowest drilling velocity was achieved with an air pressure of 20 bar.
Table 1, Table 2 and Table 3 show the changes in drilling velocity in various air pressures for the 110 mm diameter drill bit, at following intervals: 54–72 m, 72–90 m and 90–108 m.
In the first interval (54–72 m), it can be observed, for the 110 mm diameter drill bit, that drilling velocity decreases as the rotation speed increases. The difference between the velocity values for given pressures has a downward trend. Drilling velocity is higher at a higher pressure except one case mentioned above—for rotation speed of 60 1/min, drilling velocity value is slightly lower at pressure of 20 bar than at 16 bar. This is due to the down the hole hammer becoming caught in the side of the borehole, because of its small diameter and the geological profile. Therefore, the result should be considered erroneous, and should be neglected. Nevertheless, such an incident is significant, as it points towards the need for optimization, indicating that the drilling procedure should take into consideration various parameters to avoid such risks and complications. During this occurrence, 18 m of drill stem was removed from the borehole, which slightly influenced the working speed of the hammer, but had strong impact on the overall borehole drilling time.
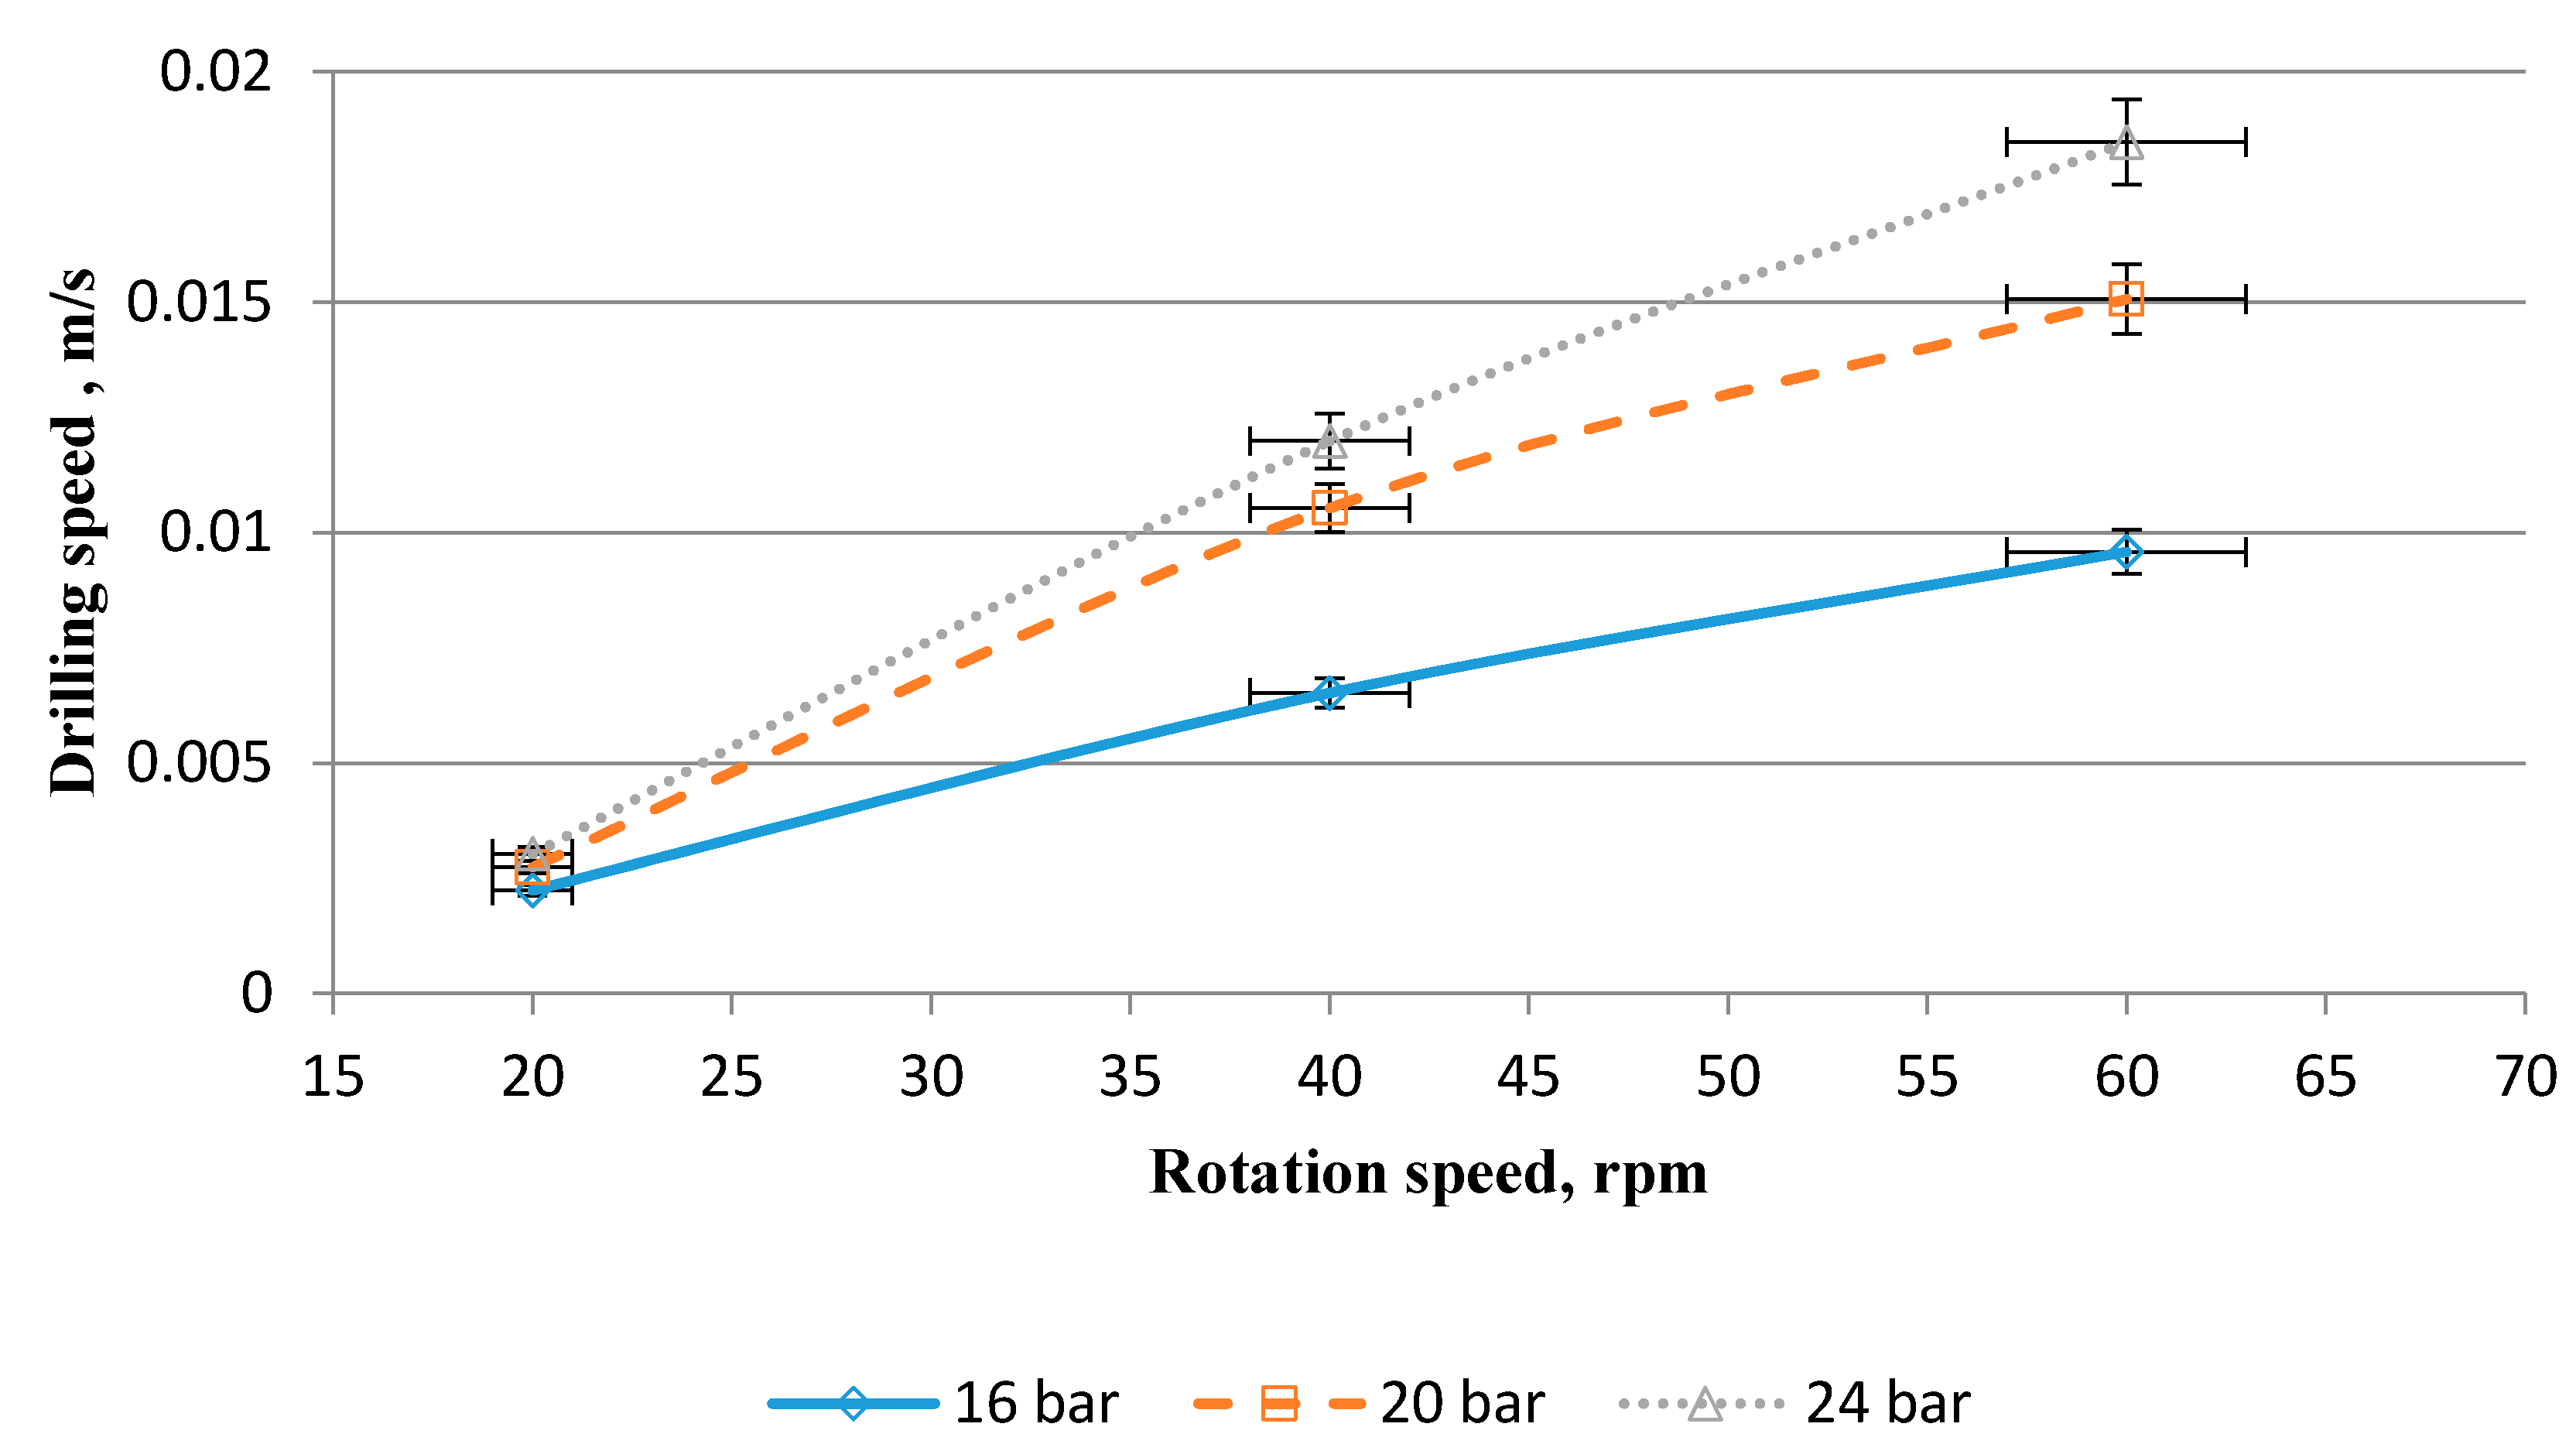
In the second interval, between 72 and 90 m (Figure 6), the drilling velocity increases as the rotation speed increases. Moreover, the figures of tested parameters for different pressures are increasingly divergent. The most rapid increase of drill bit rotation speed is observed at the highest pressure. Conversely, the lower the drilling pressure, the lower the increase of the drilling velocity. Still, the highest drilling velocity is achieved at the highest pressure, and it diminishes as the pressure declines.
In both the first and the second intervals, the difference in the drilling velocity for drilling pressures of 16 bar and 20 bar is very close to the difference occurring between drilling pressures of 20 bar and 24 bar.
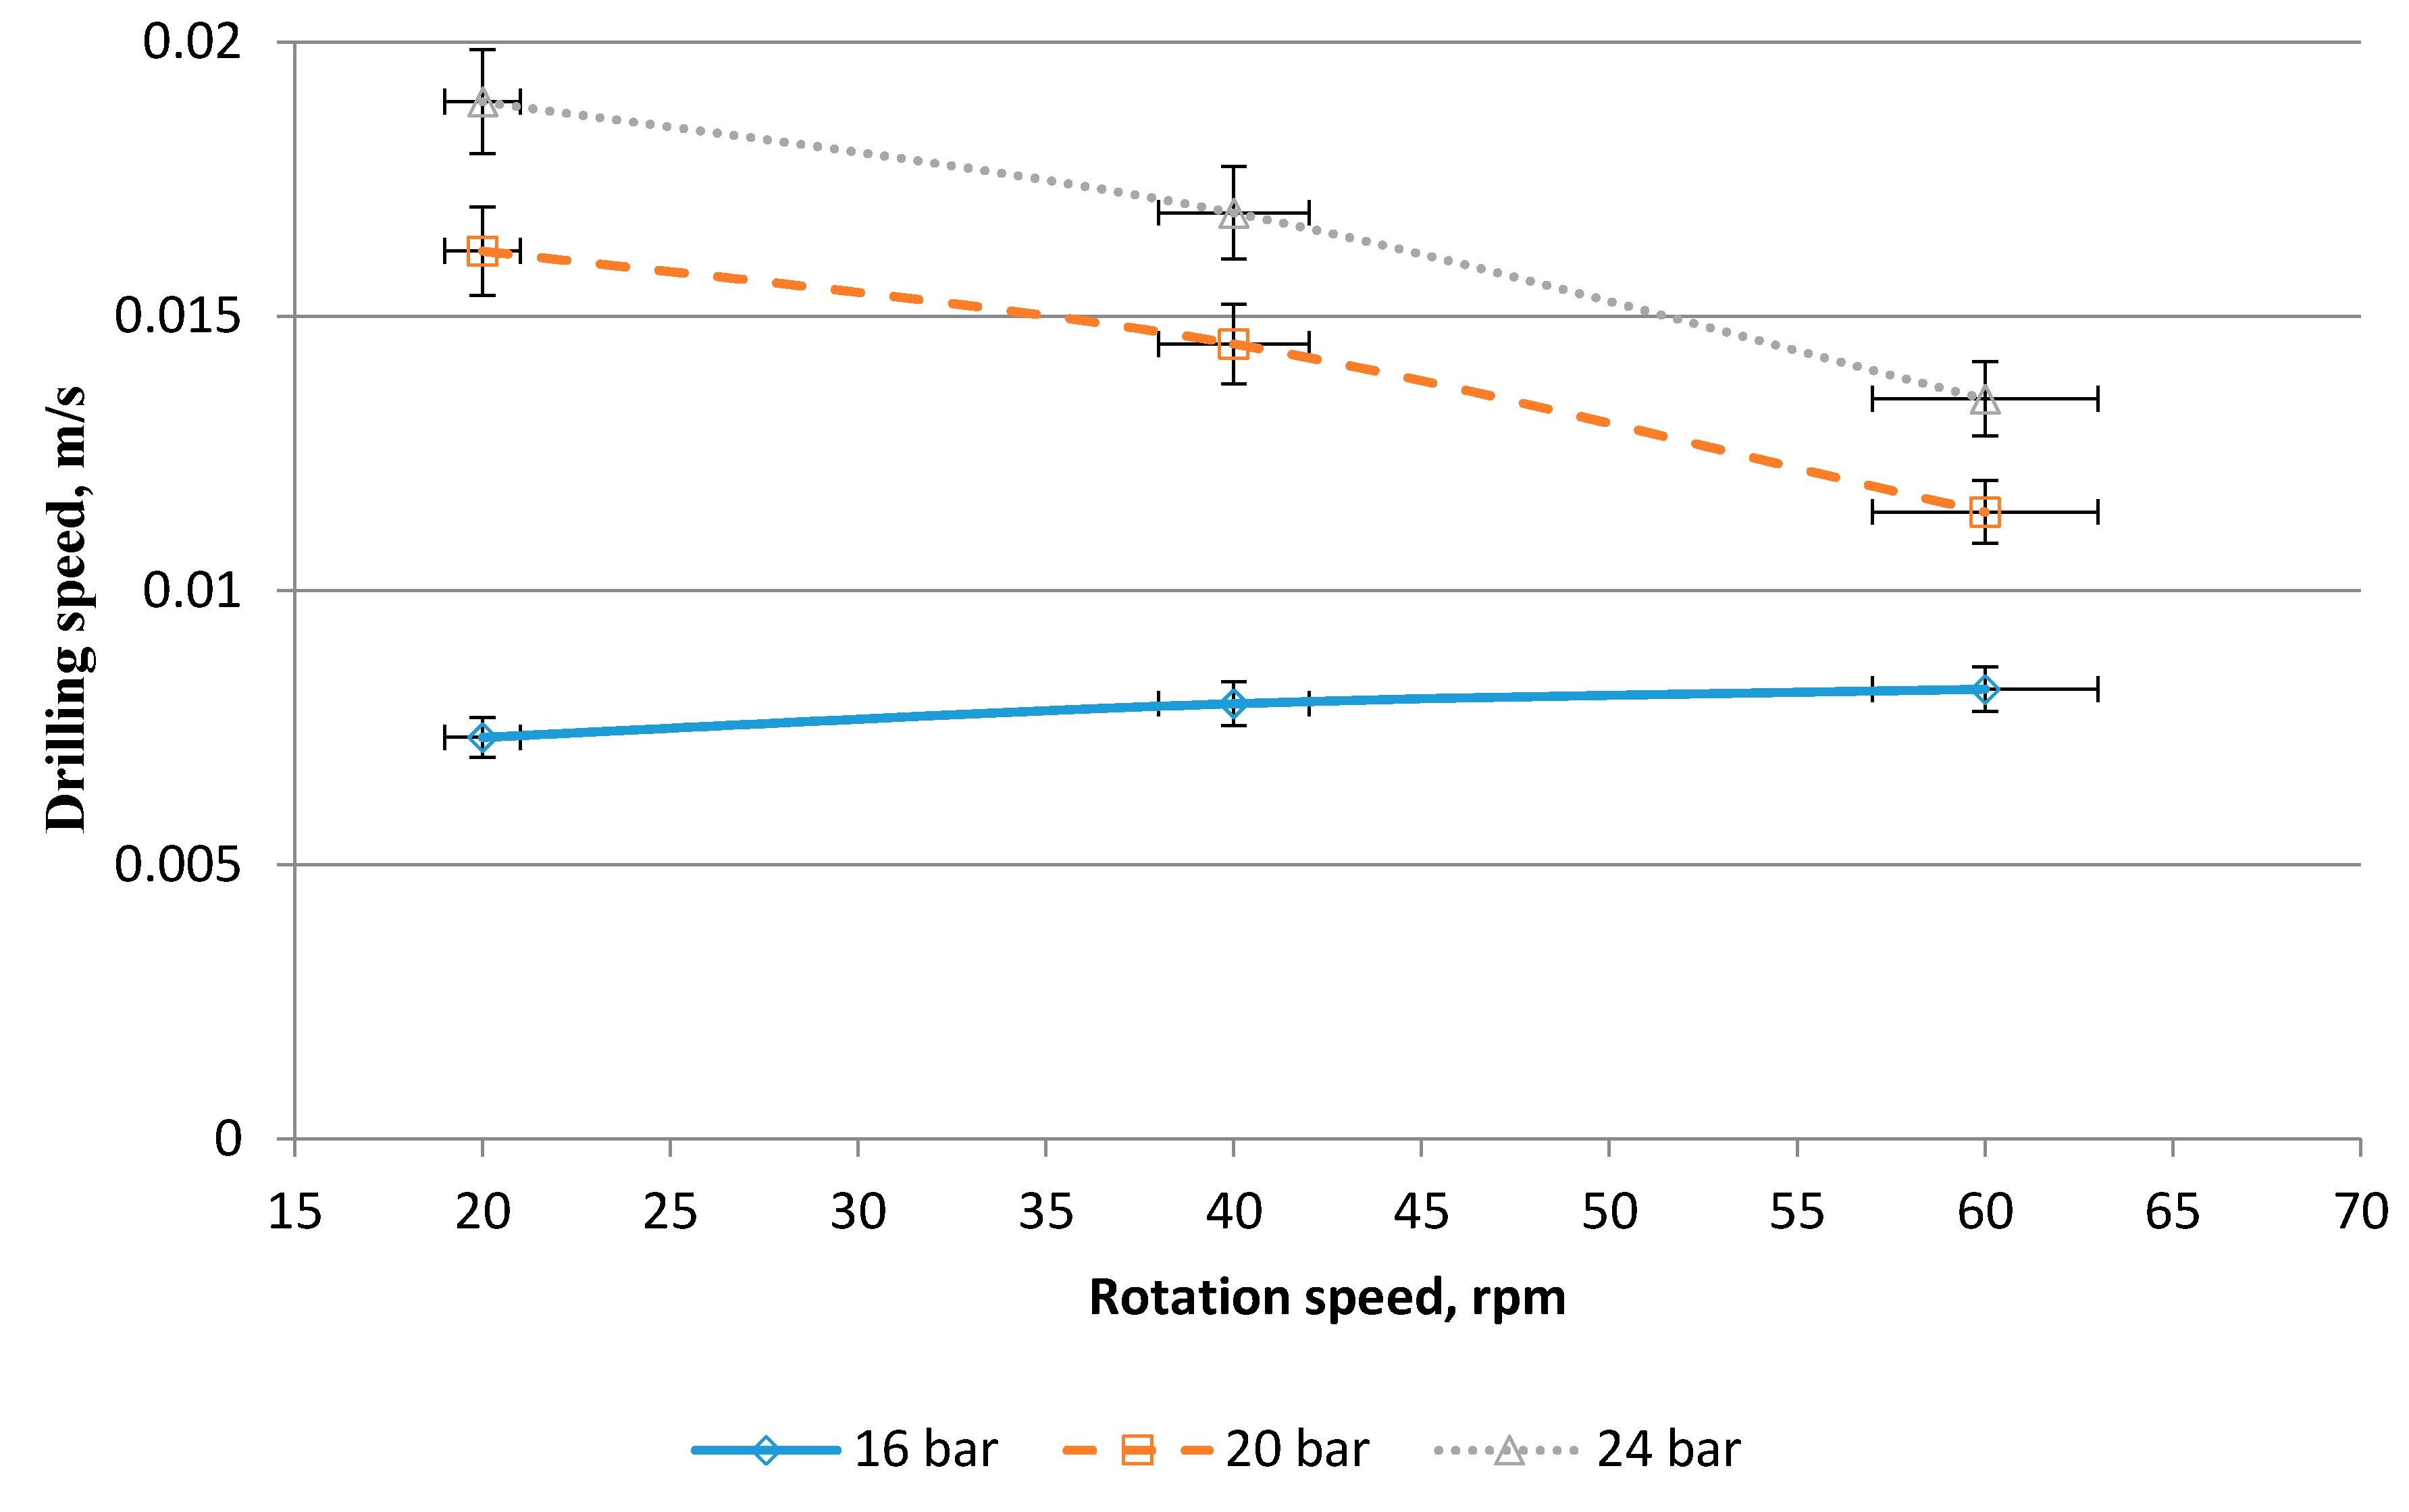
In the interval of 90–108 m (Figure 7), for air pressures of 20 and 24 bar, the value of drilling velocity decreases slightly when rotational speed increases. For the pressure of 16 bar the drilling velocity increases with higher rotation speed. Again, the drilling velocity is higher for higher pressures.
When drilling with the 110 mm diameter drill bit, the difference between drilling velocity values measured for pressures of 16, 20 and 24 bar becomes smaller with the increase of the rotation speed (see Table 1, Table 2 and Table 3).
It may appear that the choice of the air pressure has less influence on the value of drilling velocity than the choice of rotational speed. However, the depth at which this statement is valid is the depth of mudstones of low thickness. Therefore, a likely reason for the above is limiting the drilling velocity due to the geological profile.

5.2. Interpretation of Results for 127 mm Diameter Drill Bit

Boreholes number 4, 5 and 6 were drilled with a drill bit of 127 mm diameter (Figure 4). Table 4, Table 5 and Table 6 show the changes in drilling velocity for various air pressures and rotation speeds of the 127 mm diameter drill bit, at following intervals: 54–72 m, 72–90 m and 90–108 m.
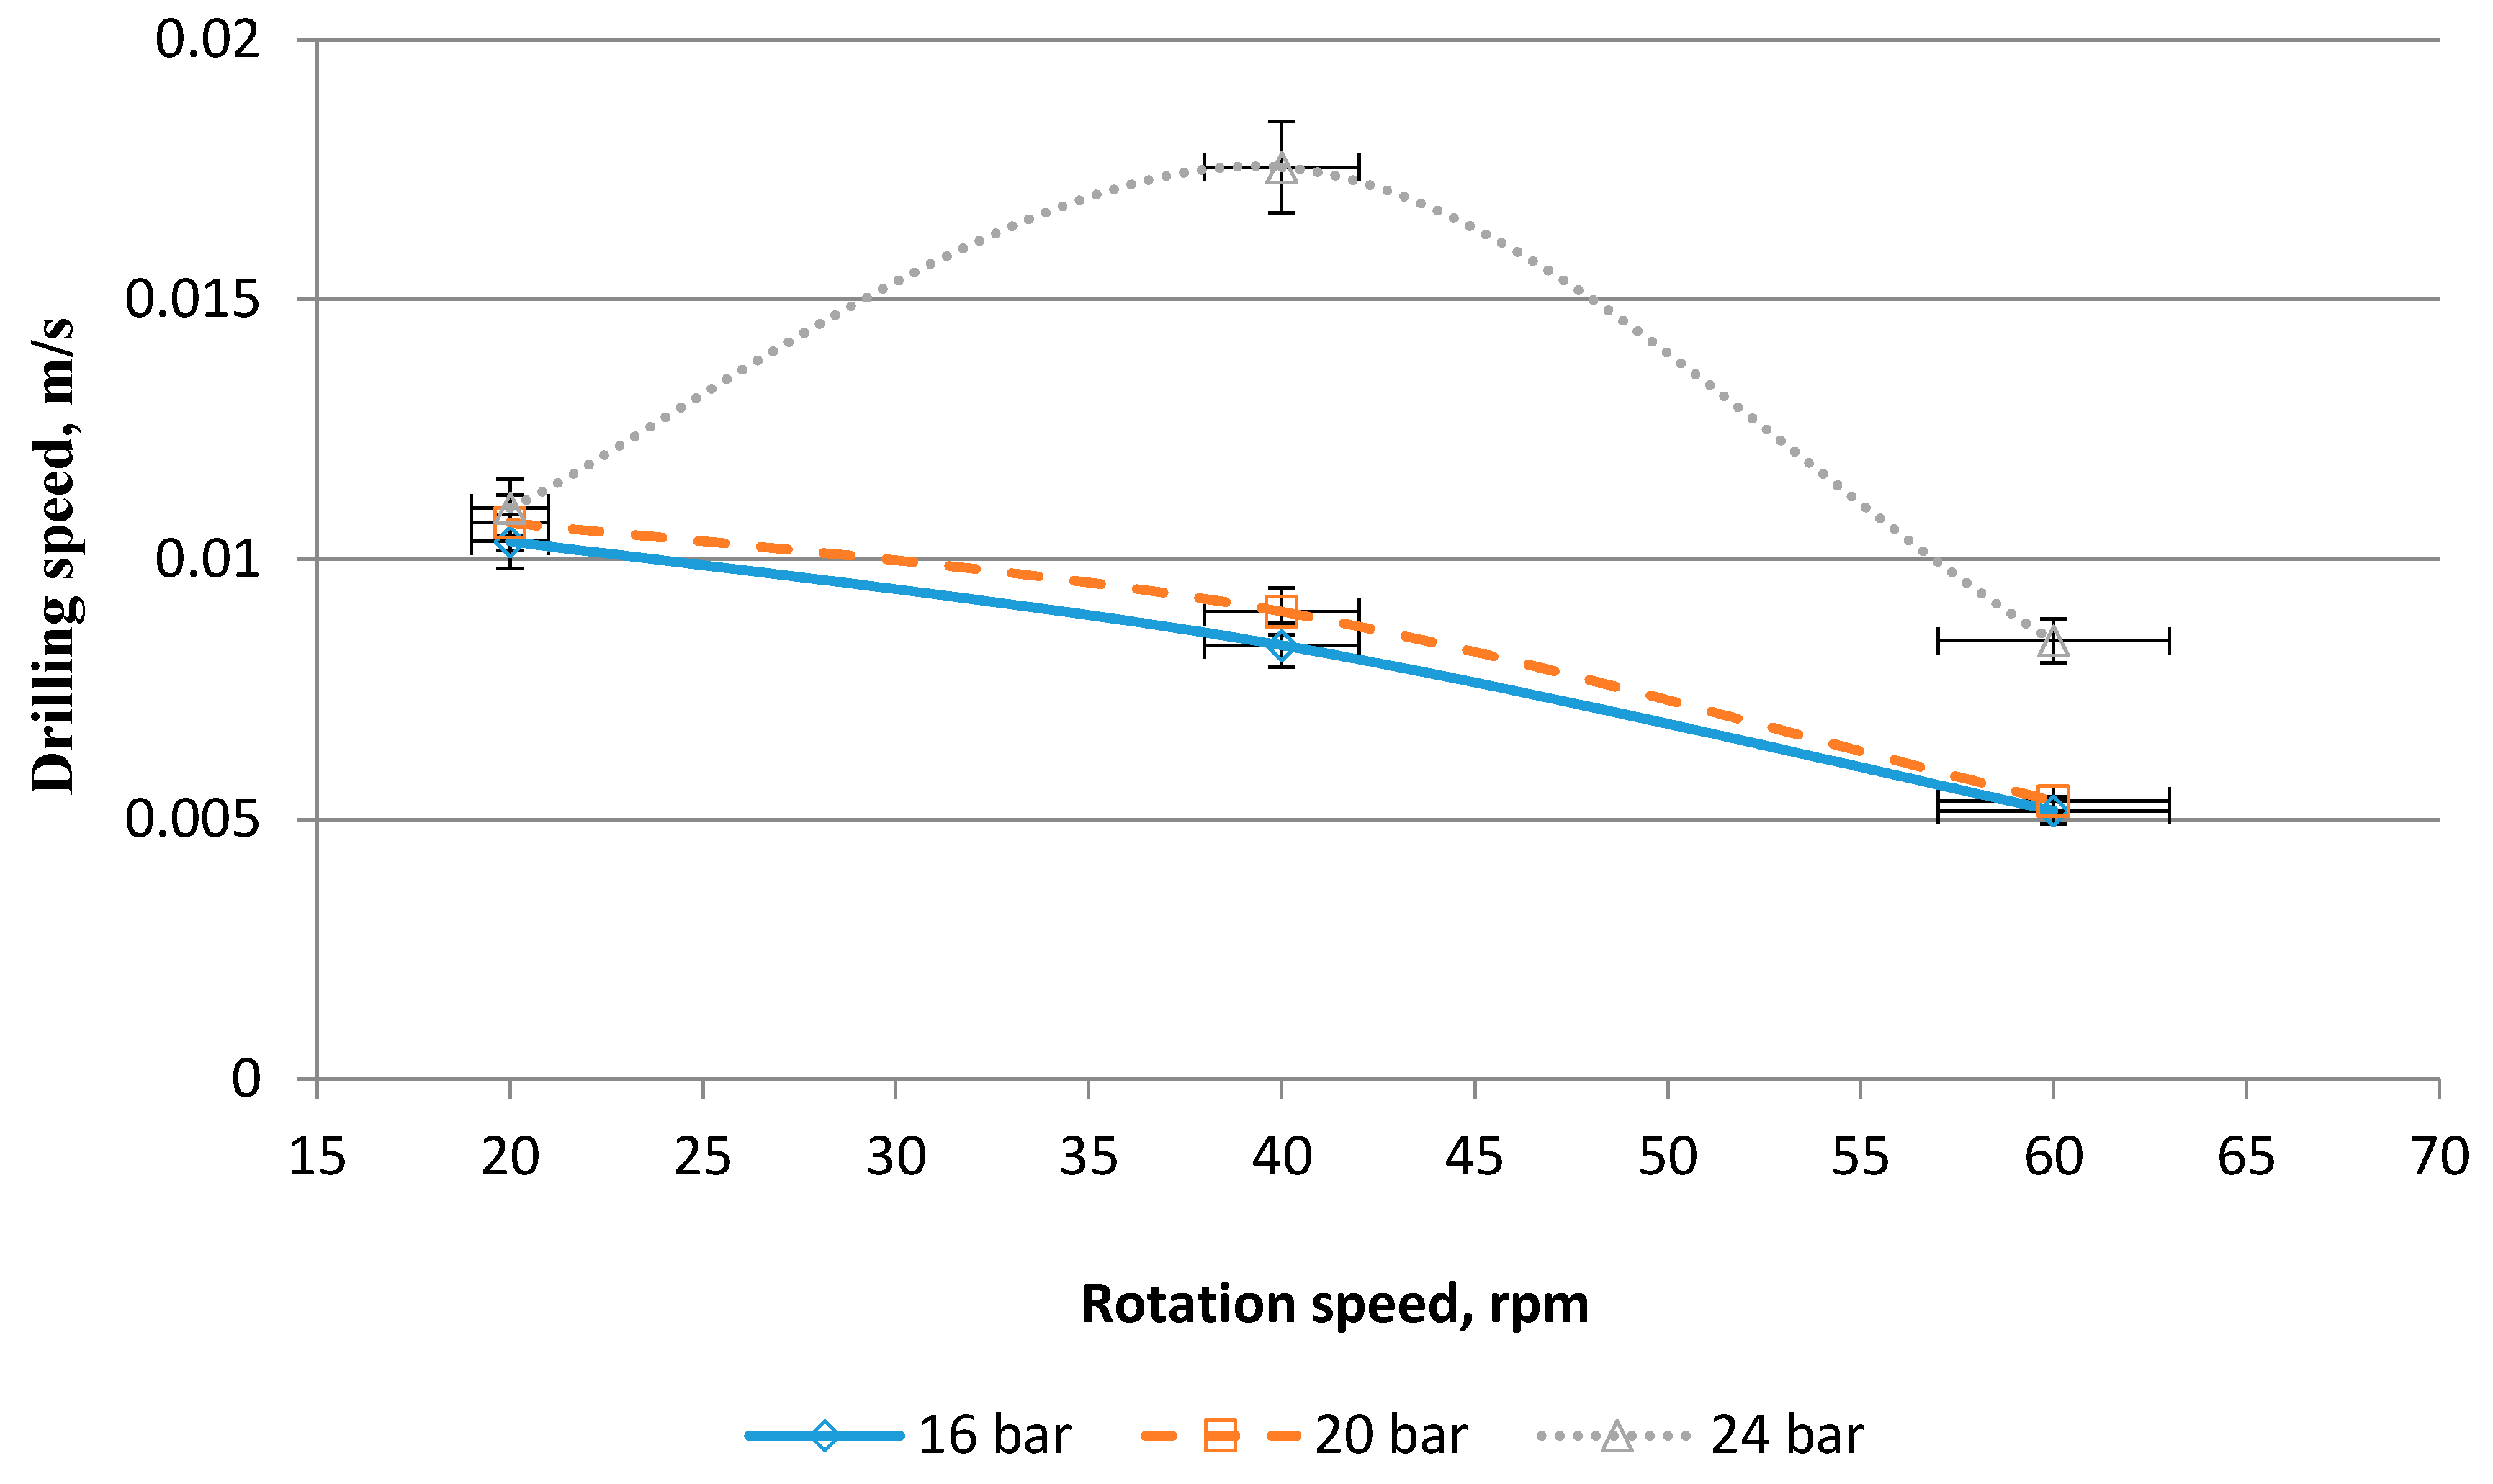
In the first interval, between 54 and 72 m (Figure 8), the drilling velocity for pressures of 16 and 20 bar decreases, almost linearly, with increasing rotation speed. The value of the drilling velocity for the pressure of 24 bar increases for the range of 20–40 rotations per minute, and then decreases for rotation speed greater than 40 1/min. The difference between the drilling velocities achieved at pressure of 24 bar, and those achieved at 16 and 20 bar, is significant for rotation speed of 40 1/min. For 20 and 60 1/min, differences between drilling velocity for various pressures reach similar values.
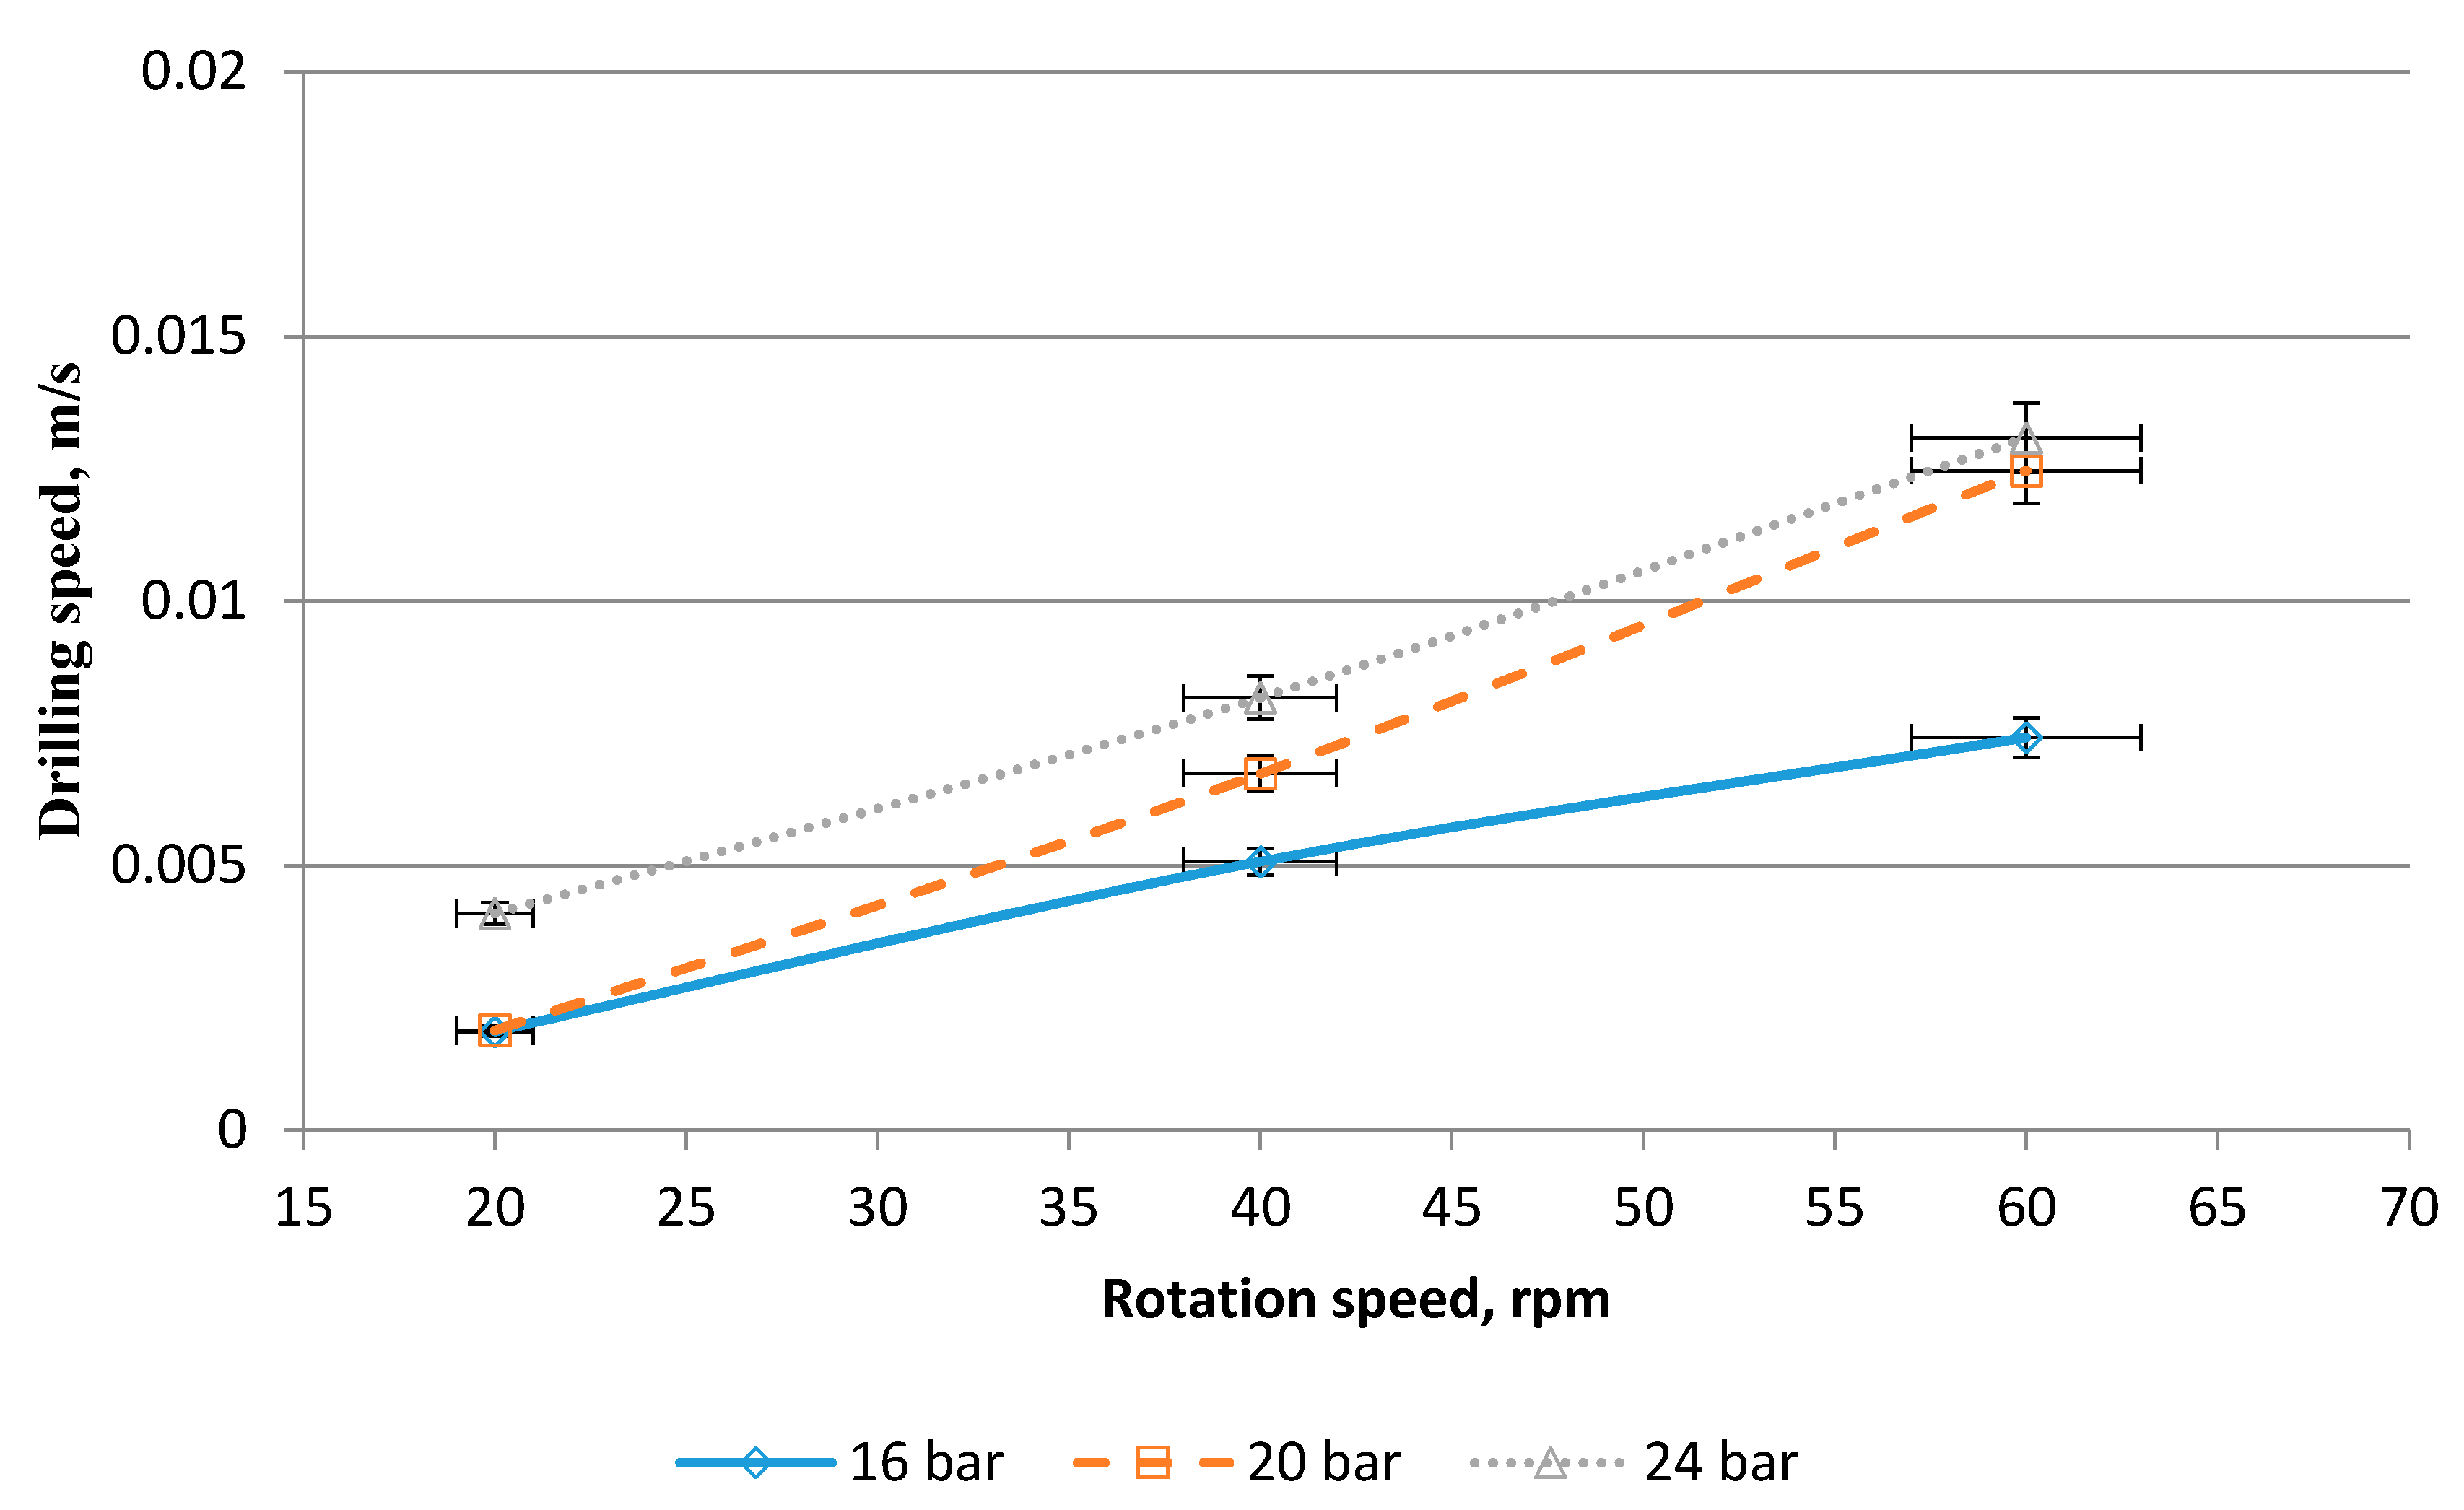
The second interval, between 72 and 90 m (Figure 9), exhibits many similarities to the second interval for the 110 mm diameter drill bit. Once more, the most rapid increase of drilling velocity occurs for the highest air pressure, and the slowest increase occurs for the lowest pressure. The similarity of the results for different drill bit diameters suggests that, for the same geological profile, the main factors affecting the drilling velocity are the pressure and rotation speed, while the diameter of the drill bit plays a secondary role.
In the last interval of 90–108 m (Figure 10), only a slight increase in drilling velocity with increasing rotation speed is observed. There is a small difference between the values of the drilling velocity for drilling pressures of 16 and 20 bar, while the values attained at 24 bar are much higher.
Finally, it is noted that for the 127 mm diameter drill bit, drilling velocity increases nonuniformly with the increase of drilling pressure.

5.3. Interpretation of Results for 140 mm Diameter Drill Bit

Boreholes 7, 8 and 9 were drilled with the 140 mm diameter drill bit (Figure 4). Table 7, Table 8 and Table 9 show the changes in drilling velocity in various air pressures and rotation speeds of the 140 mm diameter drill bit, at following intervals: 54–72 m, 72–90 m and 90–108 m.
For the first interval, between 54 and 72 m (Figure 11), the observed trend for all pressure values, while less rapid, is similar to the one achieved at 24 bar in the first interval of the drilling with the 127 mm drill bit (Figure 8).
For the second interval, between 72 and 90 m (Figure 11), as for the second intervals with the 110 and 127 mm diameter drill bits (Figure 6 and Figure 9), drilling velocity increases together with air pressure and rotation speed.
In the last interval, between 90 and 108 m (Figure 13), for pressures of 16 and 24 bar there is a systematic increase in the drilling velocity with increasing rotation speed. However, for the pressure of 20 bar, the value of the drilling velocity decreases for rotation speed between 20 and 40 1/min and then rises rapidly between 40 and 60 1/min.
Much useful information can be deduced from the analysis of the results of the change in drilling speed. The greatest increases in drilling speed occur at the smallest drill bit diameter. The section of the 18 m borehole can be drilled faster, by almost 70 m per hour, with the maximum air pressure increase. For a depth of 100 m, much time is saved via the reduced drilling time. The drilling time is reduced by 389 h for a 100 m section. This time saving is important, since one hour of operation of a drilling rig costs a specific amount of money. However, with increased air pressure, the unit cost of drilling per hour is higher, because more energy (fuel) is consumed per unit of time. For the next step of research, an optimization involving fuel consumption is necessary. Such a task would permit comprehensive optimal costs to be determined for different air pressures and rotary speeds of drill bits.
An 18 m section of borehole can be drilled almost 20 m/h faster with the maximum air pressure increase, for the drill bit diameter of 140 mm. The drilling time is reduced by 111 h for 100 m of drilling. Thus, for a borehole field with 150 BHEs, each 100 m deep, more than 450 days of drilling can be saved (with use of only one drilling rig).
Through experience, drilling companies have developed proprietary techniques, and never drill with the poorest technological parameters (like low air pressure and rotary speed of drill bit). The smallest pressure and rotary speed in the present research are intended only for investigation, and to demonstrate the importance of drilling enhancements. Nonetheless, the results can have widespread implications, as the air pressure and rotary speed clearly are a function of BHE depth. For different geologies, the possibility exists of optimizing the relevant parameters in the first few BHEs.

6. Conclusions

1. For every analyzed situation, the highest drilling velocity is achieved when the greatest drilling pressure is applied. To achieve the criterion of optimizing drilling speed (by minimizing the time required for drilling), such technological knowledge can be utilized. The criterion for maximizing drilling speed, however, is mainly used for rescue drilling. The optimization criterion most often used in drilling is the total cost of drilling. The results also indicate that the costs resulting from the use of different values of technological parameters merit further research, and that such research, such as better quantifying the dependence of drilling speed on pressure, is the subject of ongoing work by the authors.
2. Generally, the lowest drilling velocity is associated with the lowest drilling pressure (one exception was observed, but it was ruled out as erroneous and neglected). Very similar drilling velocities for drilling pressures of 16 and 20 bars were observed only in two cases of drilling with a 127 mm drill bit diameter. However, the increase in air pressure in the drill pipe causes an increase in the consumption of feed energy (diesel oil), so drilling a borehole faster is more expensive.
3. The relation between the rotation speed to drilling velocity is in reality much more complex than what is found in this article. Here, the choice of optimal drilling velocity is found to be strictly related to the depth of the drilling and, as expected, the structure of the rock formation. The increase in drill bit rotary speed also increases energy consumption. It is known from traditional rotary drilling that there is an optimum (maximum) rotational speed value. Above it, the drilling velocity drops. The tests in the present research demonstrate well that the DTH drilling velocity also depends on the rotational speed of the drill bit. In the range of 20 to 60 rpm, rotational speed can both increase and decrease drilling velocity. The decisive factor is the lithological structure of geology (abrasive and mechanical parameters of rocks). On the basis of tests carried out here for several drill bit rotary velocities, it is clear that the optimum rotary speed varies with the depth of drilling. Furthermore, such tests should be performed on the first holes drilled, treating them as research boreholes, before the implementation of large BHE fields.
4. For each of the three drill bits’ diameters, drilling velocity in the interval between 72 and 90 m below ground level increased with greater rotation speed. In terms of lithology, that interval is more unitary than others. It mainly corresponds to the occurrence of marly rocks.

Author Contributions

Conceptualization, T.S. and K.J.; methodology, T.S. and M.A.R.; software, A.S.; validation, A.G.; formal analysis, A.S.-Ś.; investigation, K.J. and K.F.; resources, T.K.; data curation, T.K.; writing—original draft preparation, K.J.; writing—review and editing, M.A.R.; visualization, M.C.; supervision, T.S.; project administration, A.S.-Ś.; funding acquisition, T.S. All authors have read and agreed to the published version of the manuscript.

Funding

This research was funded by Polish Ministry of Science and Higher Education, grant number 16.16.190.779.

Conflicts of Interest

The authors declare no conflict of interest.

References

  1. Haldane, T. The heat pump—An economical method of producing low-grade heat. J. Inst. Electr. Eng. 1938, 68, 666–675. [Google Scholar] [CrossRef]
  2. Brodowicz, K.; Dyakowski, T. Pompy Ciepła, 1st ed.; Państwowe Wydawnictwo Naukowe: Warsaw, Poland, 1990; pp. 10–11. [Google Scholar]
  3. Sliwa, T.; Sapińska-Śliwa, A.; Knez, D.; Bieda, A.; Kowalski, T.; Złotkowski, A. Borehole Heat Exchangers, Production and Storage of Heat in the Rock Mass, 1st ed.; Laboratory of Geoenergetics Book Series; Drilling, Oil and Gas Foundation: Krakow, Poland, 2016; Volume 2, p. 177. [Google Scholar]
  4. Sapińska-Śliwa, A. Efektywność Pozyskiwania Ciepła Z Górotworu W Aspekcie Sposobu Udostępniania Otworami Wiertniczymi; Rozprawy Monografie Akademia Górniczo-Hutnicza im. Stanisława Staszica w Krakowie nr 364; Wydawnictwa AGH: Krakow, Poland, 2019; 320p. [Google Scholar]
  5. Lund, J.W. Geothermal Heat Pumps—An Overview. Geo-Heat Cent. Q. Bull. 2001, 22, 1–2. [Google Scholar]
  6. Rafferty, K. An Information Survival Kit for the Prospective Residential Geothermal Heat Pump Owner. Geo-Heat Cent. Q. Bull. 1997, 18, 1–11. [Google Scholar]
  7. Soni, S.K.; Pandey, M.; Bartaria, V.N. Hybrid ground coupled heat exchanger systems for space heating/cooling applications: A review. Renew. Sustain. Energy Rev. 2016, 60, 724–738. [Google Scholar] [CrossRef]
  8. Chiasson, A.D. Geothermal Heat Pump and Heat Engine Systems, Theory and Practice, 1st ed.; John Wiley & Sons, Ltd.: Chichester, UK, 2016; p. 473. [Google Scholar]
  9. Sliwa, T.; Sapinska-Sliwa, A.; Wiśniowski, R.; Piechówka, Z.; Krzemień, M.; Pycha, D.; Jaszczur, M. Influence of flow rate and heating power in effective thermal conductivity applied in borehole heat exchangers. J. Phys. Confr. Ser. 2016, 745, 1–8. [Google Scholar]
  10. Zurmuhl, D.P.; Lukawski, M.Z.; Aguirre, G.A.; Law, W.R.; Schnaars, G.P.; Beckers, K.F.; Anderson, C.L.; Tester, J.W. Hybrid geothermal heat pumps for cooling telecommunications data centers. Energy Build. 2019, 188–189, 120–128. [Google Scholar] [CrossRef]
  11. Park, S.; Lee, S.-R.; Yoon, S.; Go, G.-H.; Chung, J. An Analytical Model for a Spiral Coil Type Ground Heat Exchanger. In Proceedings of the International Offshore and Polar Engineering Conference, Rhodes, Greece, 17–22 June 2012. [Google Scholar]
  12. Sanner, B. Shallow Geothermal Energy, International Summer School on Direct Application of Geothermal Energy. 2003. Available online: https://www.geothermal-energy.org/pdf/IGAstandard/ISS/2003Germany/II/4_1.san.pdf (accessed on 2 April 2020).
  13. Sliwa, T.; Stryczek, S.; Wysogląd, T.; Skakuj, A.; Wiśniowski, R.; Sapińska-Śliwa, A.; Bieda, A.; Kowalski, T. Wpływ grafitu i diatomitu na parametry wytrzymałościowe stwardniałych zaczynów cementowych. Przem. Chem. 2017, 96, 960–963. [Google Scholar]
  14. Sliwa, T.; Kruszewski, M.; Zare, A.; Assadi, M.; Sapińska-Śliwa, A. Potential application of vacuum insulated tubing for deep borehole heat exchangers. Geothermics 2018, 75, 58–67. [Google Scholar] [CrossRef]
  15. Sliwa, T.; Nowosiad, T.; Vytyaz, O.; Sapińska-Śliwa, A. Study on the efficiency of deep borehole heat exchangers. SOCAR Proc. 2016, 2, 29–42. [Google Scholar] [CrossRef]
  16. Fouché, O.; Soussi, C.; Bracq, G.; Minec, S. Seasonal Storage of Sensible Heat in Tunnel-Surrounding Rocks. In Proceedings of the ISRM 1st International Conference on Advances in Rock Mechanics, Hammamet, Tunisia, 29–31 March 2018. [Google Scholar]
  17. Lee, S.-R.; Yoon, S.; Go, G.-H.; Kang, H.-B.; Park, D.-W. Evaluation of Heat Exchange Rate for Different Types of Ground Heat Exchangers. In Proceedings of the International Offshore and Polar Engineering Conference, Anchorage, AK, USA, 30 June–5 July 2013. [Google Scholar]
  18. Kneafsey, T.J.; Dobson, P.; Blankenship, D.; Morris, J.; Knox, H.; Schwering, P.; White, M.; Doe, T.; Roggenthen, W.; Mattson, E.; et al. An Overview of the EGS Collab Project: Field Validation of Coupled Process Modeling of Fracturing and Fluid Flow at the Sanford Underground Research Facility, Lead, SD. In Proceedings of the 43rd Workshop on Geothermal Reservoir Engineering, Stanford, CA, USA, 12–14 February 2018. [Google Scholar]
  19. Knez, D.; Calicki, A. Looking for a new source of natural proppants in Poland. Bull. Pol. Acad. Sci. Tech. Sci. 2018, 66, 3–8. [Google Scholar]
  20. Ahmadi, M.; Dahi Taleghani, A. Feasibility Study of Heat Extraction from a Closed-Loop Fractured Geothermal Reservoir; A Multiphysics Problem. In Proceedings of the 50th U.S. Rock Mechanics/Geomechanics Symposium, Houston, TX, USA, 26–29 June 2016. [Google Scholar]
  21. Aresti, L.; Christodoulides, P.; Florides, G. A review of the design aspect of ground heat exchangers. Renew. Sustain. Energy Rev. 2018, 92, 757–773. [Google Scholar] [CrossRef]
  22. Bayer, P.; Attard, G.; Blum, P.; Menberg, K. The geothermal potential of cities. Renew. Sustain. Energy Rev. 2019, 106, 17–30. [Google Scholar] [CrossRef]
  23. Sliwa, T.; Kucper, M. Accessing Earth’s heat using Geothermal Radial Drilling for borehole heat exchangers. AGH Drill. Oil Gas 2017, 34, 495–512. [Google Scholar] [CrossRef] [Green Version]
  24. Ahmadi-Joughi, A.; Ziabasharhagh, M.; Mahbaz, S.; Soltani, M.; Yaghoubi, A.A.; Dusseault, M.B. Feasibility Study and Simulation of Deep Solar Energy Geo-Storage. In Proceedings of the 2nd International Discrete Fracture Network Engineering Conference, Seattle, WA, USA, 20–22 June 2018. [Google Scholar]
  25. Cui, Y.; Zhu, J.; Twaha, S.; Riffat, S. A comprehensive review on 2D and 3D models of vertical ground heat exchangers. Renew. Sustain. Energy Rev. 2018, 94, 84–114. [Google Scholar] [CrossRef]
  26. Quaggiotto, D.; Zarrella, A.; Emmi, G.; De Carli, M.; Pockele, L.; Vercruysse, J.; Psyk, M.; Righini, D.; Galgaro, A.; Mendrinos, D.; et al. Simulation-Based Comparison Between the Thermal Behavior of Coaxial and Double U-Tube Borehole Heat Exchangers. Energies 2019, 12, 2321. [Google Scholar] [CrossRef] [Green Version]
  27. Luo, J.; Rohn, J.; Bayer, M.; Priess, A. Thermal Efficiency Comparison of Borehole Heat Exchangers with Different Drillhole Diameters. Energies 2013, 6, 4187–4206. [Google Scholar] [CrossRef] [Green Version]
  28. Záruba, J.; Franek, J.; Sosna, K.; Novák, P.; Vondrovic, L. Research on Thermally Loaded Rock—Perspectives of Underground Thermal Energy Storage. In Proceedings of the ISRM International Symposium—8th Asian Rock Mechanics Symposium, Sapporo, Japan, 14–16 October 2014. [Google Scholar]
  29. Sáez Blázquez, C.; Farfán Martín, A.; Martín Nieto, I.; Carrasco García, P.; Sánchez Pérez, L.S.; González-Aguilera, D. Efficiency Analysis of the Main Components of a Vertical Closed-Loop System in a Borehole Heat Exchanger. Energies 2017, 10, 201. [Google Scholar] [CrossRef] [Green Version]
  30. Florides, G.; Christodoulides, P.; Theofanous, E.; Lazari, L.; Messaritis, V. Modeling of Geothermal Heat Exchangers. In Proceedings of the Twenty-third International Offshore and Polar Engineering Conference, Anchorage, AK, USA, 30 June–5 July 2013. [Google Scholar]
  31. Bae, S.M.; Nam, Y.; Choi, J.M.; Lee, K.H.; Choi, J.S. Analysis on Thermal Performance of Ground Heat Exchanger According to Design Type Based on Thermal Response Test. Energies 2019, 12, 651. [Google Scholar] [CrossRef] [Green Version]
  32. Sapińska-Śliwa, A.; Rosen, M.A.; Gonet, A.; Kowalczyk, J.; Sliwa, T. A New Method Based on Thermal Response Tests for Determining Effective Thermal Conductivity and Borehole Resistivity for Borehole Heat Exchangers. Energies 2019, 12, 1072. [Google Scholar] [CrossRef] [Green Version]
  33. Sliwa, T.; Rosen, M.A. Efficiency analysis of borehole heat exchangers as grout varies via thermal response test simulations. Geothermics 2017, 69, 132–138. [Google Scholar] [CrossRef]
  34. Claesson, J.; Javed, S. Explicit Multipole Formulas for Calculating Thermal Resistance of Single U-Tube Ground Heat Exchangers. Energies 2018, 11, 214. [Google Scholar] [CrossRef] [Green Version]
  35. Badenes, B.; Pla, M.A.M.; Lemus-Zuniga, L.G.; Mauleon, B.S.; Uruchueguia, J.F. On the Influence of Operational and Control Parameters in Thermal Response Testing of Borehole Heat Exchangers. Energies 2017, 10, 1328. [Google Scholar] [CrossRef] [Green Version]
  36. Spitler, J.D.; Gehlin, S.E.A. Thermal response testing for ground source heat pump systems—An historical review. Renew. Sustain. Energy Rev. 2015, 50, 1125–1137. [Google Scholar] [CrossRef]
  37. Zarrella, A.; Emmi, G.; Graci, S.; De Carli, M.; Cultrea, M.; Dalla Santa, G.; Galgaro, A.; Bertermann, D.; Muller, J.; Pockele, L.; et al. Thermal Response Testing Results of Different Types of Borehole Heat Exchangers: An Analysis and Comparison of Interpretation Methods. Energies 2017, 10, 801. [Google Scholar] [CrossRef] [Green Version]
  38. Jensen-Page, L.; Loveridge, F.; Narsilio, G.A. Thermal Response Testing of Large Diameter Energy Piles. Energies 2019, 12, 2700. [Google Scholar] [CrossRef] [Green Version]
  39. Lee, C.K.; Lam, H.N. Thermal Response Test Analysis for an Energy Pile in Ground-Source Heat Pump Systems. In Progress in Sustainable Energy Technologies: Generating Renewable Energy; Dincer, I., Midilli, A., Kucuk, H., Eds.; Springer International Publishing: Cham, Switzerland, 2014; Chapter 37; pp. 605–616. [Google Scholar]
  40. Growth in U.S. Hydrocarbon Production from Shale Resources Driven by Drilling Efficiency. Available online: https://www.eia.gov/todayinenergy/detail.php?id=15351# (accessed on 21 May 2018).
  41. Drilling Efficiency Is A Key Driver of Oil and Natural Gas Production. Available online: https://www.eia.gov/todayinenergy/detail.php?id=13651# (accessed on 21 May 2018).
  42. Zou, D. Theory and Technology of Rock Excavation for Civil Engineering; Metallurgical Industry Press and Springer Science + Business Media: Singapore, 2017; p. 698. [Google Scholar]
  43. Zhang, Y.; Zhang, J. Technical Improvements and Application of Air-lift Reverse Circulation Drilling Technology to Ultra-deep Geothermal Well. Procedia Eng. 2014, 73, 243–251. [Google Scholar]
  44. Ruda, T.C.; Bosscher, P.J. National Drilling Association Driller’s Manual; National Drilling Association: Washington, DC, USA, 1990; p. 360, (revised 2005). [Google Scholar]
  45. Bates, R.E., Jr. Field Results of Percussion Air Drilling. J. Pet. Technol. 1965, 17, 257–262. [Google Scholar] [CrossRef]
  46. Wysocki, S.; Gaczoł, M.; Wysocka, M. New Mud for Underbalanced Drilling. AGH Drill. Oil Gas 2016, 33, 801–809. [Google Scholar] [CrossRef] [Green Version]
  47. Ningping, Y.; Xinsheng, Y.; Yi, W.; Li, W.; Qianhui, J. Practice and Drilling Technology of Gas Extraction Borehole in Soft Coal Groundm. Procedia Earth Planet. Sci. 2011, 3, 53–61. [Google Scholar]
  48. Sliwa, T.; Mazur, M.; Gonet, A.; Sapińska-Śliwa, A. Wiercenia udarowo- obrotowe w geoenergetyce. Wiert. Nafta Gaz 2011, 28, 759–770. [Google Scholar]
  49. Shale, L. Underbalanced drilling with air offers many pluses. Oil Gas J. 1995, 93, 33–39. [Google Scholar]
  50. Bieda, A.; Kowalski, T.; Sliwa, T.; Skowroński, D.; Kowalska-Kubsik, I.; Rado, R. Udarowo-obrotowa metoda wiercenia otworowych wymienników ciepła jako alternatywa wiertnicza przyjazna środowisku. Przem. Chem. 2018, 97, 864–866. [Google Scholar] [CrossRef]
  51. Cooper, L.W.; Hook, R.A.; Payne, B.R. Air drilling techniques. In Proceedings of the SPE Deep Drilling and Production Symposium, Amarillo, TX, USA, 17–19 April 1977. [Google Scholar]
  52. Patin, M.; d’Ablaing, G.; Orr, A.; Meyers, J. Optimizing Operational Parameters can “Save You Money” as well as Improve Bit Life and ROP. In Proceedings of the American Association of Drilling Engineers, Houston, TX, USA, 10–12 April 2007. [Google Scholar]
  53. Wittig, V.; Bracke, R.; Hyun-Ick, Y. Hydraulic DTH Fluid/Mud Hammers with Recirculation Capabilities to Improve ROP and Hole Cleaning for Deep, Hard Rock Geothermal Drilling. In Proceedings of the World Geothermal Congress, Melbourne, VIC, Australia, 19–25 April 2015. [Google Scholar]
  54. Quantifying Drilling Efficiency Office of Integrated Analysis and Forecasting. Available online: https://www.eia.gov/workingpapers/pdf/drilling_efficiency.pdf (accessed on 21 May 2018).
  55. Jaszczur, M.; Polepszyc, I.; Sapińska-Śliwa, A.; Gonet, A. An analysis of the numerical model influence on the ground temperature profile determination. J. Therm. Sci. 2017, 26, 82–88. [Google Scholar] [CrossRef]
  56. Wojnarowski, P. Potential for increasing oil recovery from Polish oil-fields by applying EOR methods. Miner. Resour. Manag. 2012, 28, 47–58. [Google Scholar]
  57. Sliwa, T.; Sojczyńska, A.; Rosen, M.A.; Kowalski, T. Evaluation of temperature profiling quality in determining energy efficiencies of borehole heat exchangers. Geothermics 2019, 78, 129–137. [Google Scholar] [CrossRef]
  58. Boyd, T.L.; Sifford, A.; Lund, J.W. The United States of America Country Update 2015. In Proceedings of the World Geothermal Congress 2015, Melbourne, VIC, Australia, 19–25 April 2015; Available online: https://www.geothermal-energy.org/pdf/IGAstandard/WGC/2015/01009.pdf (accessed on 2 April 2020).
  59. Rębiś, E. Sator Company Provided Geological Analysis; Geological Drilling Project; Ikea: Lublin, Poland, 2016. [Google Scholar]
Figure 1. BERETTA T57 geo self-propelled drilling rig (photo by authors).
Energies 13 02716 g001
Figure 2. 110 mm drill bit being measured after the borehole section from 54 to 72 m below ground surface was drilled (photo by authors), (a) measurement of single drill bit tooth, (b) control of drill bit diameter.
Energies 13 02716 g002
Figure 3. Geological profile and filtration schematics of the test borehole, which is common for every borehole under study [59].
Energies 13 02716 g003
Figure 4. Locations of boreholes in relation to one another.
Energies 13 02716 g004
Figure 5. Variation of drilling velocity with rotation speed for several pressures (shown in the legend below the figure), for the 110 mm diameter drill bit, an interval of 54 to 72 m below the ground level, and boreholes 1–3.
Energies 13 02716 g005
Figure 6. Variation of drilling velocity with rotation speed for several pressures (shown in the legend below the figure), for the 110 mm diameter drill bit, an interval of 72 to 90 m below the ground level, and boreholes 1–3.
Energies 13 02716 g006
Figure 7. Variation of drilling velocity with rotation speed for several pressures (shown in the legend below the figure), for the 110 mm diameter drill bit, an interval of 90 to 108 m below the ground level, and boreholes 1–3.
Energies 13 02716 g007
Figure 8. Variation of drilling velocity with rotation speed for several pressures (shown in the legend below the figure), for the 127 mm diameter drill bit, an interval of 54 to 72 m below the ground level, and boreholes 4–6.
Energies 13 02716 g008
Figure 9. Variation of drilling velocity with rotation speed for several pressures (shown in the legend below the figure), for the 127 mm diameter drill bit, an interval of 72 to 90 m below the ground level, and boreholes 4–6.
Energies 13 02716 g009
Figure 10. Variation of drilling velocity with rotation speed for several pressures (shown in the legend below the figure), for the 127 mm diameter drill bit, an interval of 90 to 108 m below the ground level, and boreholes 4–6.
Energies 13 02716 g010
Figure 11. Variation of drilling velocity with rotation speed for several pressures (shown in the legend below the figure), for the 140 mm diameter drill bit, an interval of 54 to 72 m below the ground level, and boreholes 7–9.
Energies 13 02716 g011
Figure 12. Variation of drilling velocity with rotation speed for several pressures (shown in the legend below the figure), for the 140 mm diameter drill bit, an interval of 72 to 90 m below the ground level, and boreholes 7–9.
Energies 13 02716 g012
Figure 13. Variation of drilling velocity with rotation speed for several pressures (shown in the legend below the figure), for the 140 mm diameter drill bit, an interval of 90–108 m below the ground level, and boreholes 7–9.
Energies 13 02716 g013
Table 1. Differences between drilling velocity measured for various air pressures and drill rotation speeds of the 110 mm diameter drill bit, in the interval 54–72 m below ground level.
Rotation Speed [1/min]Difference between Drilling Velocity [m/s, m/h] for Pressures:
20 and 16 bar24 and 20 bar24 and 16 bar
[m/s][m/h][m/s][m/h][m/s][m/h]
200.00486317.50680.00576920.76840.01063238.2752
400.0024428.79120.0026809.6480.00512218.4392
60−0.000087−0.31320.0009653.4740.0008783.1608
Table 2. Differences between drilling velocity measured for various air pressures and drill rotation speeds of the 110 mm diameter drill bit, in the interval 72–90 m below ground level.
Rotation Speed [1/min]Difference between Drilling Velocity [m/s, m/h] for Pressures:
20 and 16 bar24 and 20 bar24 and 16 bar
[m/s][m/h][m/s][m/h][m/s][m/h]
200.0005011.80360.0002901.0440.0007922.8512
400.00401714.46120.0014525.22720.00546919.6884
600.00548919.76040.00340612.26160.00889532.022
Table 3. Differences between drilling velocity measured for various air pressures and drill rotation speeds of the 110 mm diameter drill bit, in the interval 90–108 m below ground level.
Rotation Speed [1/min]Difference between Drilling Velocity [m/s, m/h] for Pressures:
20 and 16 bar24 and 20 bar24 and 16 bar
[m/s][m/h][m/s][m/h][m/s][m/h]
200.00732426.36640.01619058.2840.01891668.0976
400.00793828.57680.01449752.18920.01688760.7932
600.00820129.52360.01143141.15160.01349548.582
Table 4. Differences between drilling velocity measured for various air pressures and drill rotation speeds of the 127 mm diameter drill bit, in the interval 54–72 m below ground level.
Rotation Speed [1/min]Difference between Drilling Velocity [m/s, m/h] for Pressures:
20 and 16 bar24 and 20 bar24 and 16 bar
[m/s][m/h][m/s][m/h][m/s][m/h]
200.01034037.2240.01070838.54880.01099239.5712
400.00834730.04920.00899532.3820.01754663.1656
600.00516518.5940.00535219.26720.00843130.3516
Table 5. Differences between drilling velocity measured for various air pressures and drill rotation speeds of the 127 mm diameter drill bit, in the interval 72–90 m below ground level.
Rotation Speed [1/min]Difference between Drilling Velocity [m/s, m/h] for Pressures:
20 and 16 bar24 and 20 bar24 and 16 bar
[m/s][m/h][m/s][m/h][m/s][m/h]
200.00329411.85840.00320211.52720.004037814.53608
400.00796028.6560.00957034.4520.01362849.0608
600.01037937.36440.01047937.72440.01896568.274
Table 6. Differences between drilling velocity measured for various air pressures and drill rotation speeds of the 127 mm diameter drill bit, in the interval 90–108 m below ground level.
Rotation Speed [1/min]Difference between Drilling Velocity [m/s, m/h] for Pressures:
20 and 16 bar24 and 20 bar24 and 16 bar
[m/s][m/h][m/s][m/h][m/s][m/h]
200.00714725.72920.00897632.31360.01638458.9824
400.00857330.86280.00963934.70040.01721061.956
600.00741426.69040.00979835.27280.01590157.2436
Table 7. Differences between drilling velocity measured for various air pressures and drill rotation speeds of the 140 mm diameter drill bit, in the interval 54–72 m below ground level.
Rotation Speed [1/min]Difference between Drilling Velocity [m/s, m/h] for Pressures:
20 and 16 bar24 and 20 bar24 and 16 bar
[m/s][m/h][m/s][m/h][m/s][m/h]
200.0023388.41680.0005011.80360.00283910.2204
400.00424015.264−0.000073−0.26280.00416715.0012
600.0027349.84240.0016736.02280.00440815.8688
Table 8. Differences between drilling velocity measured for various air pressures and drill rotation speeds of the 140 mm diameter drill bit, in the interval 72–90 m below ground level.
Rotation Speed [1/min]Difference between Drilling Velocity [m/s, m/h] for Pressures:
20 and 16 bar24 and 20 bar24 and 16 bar
[m/s][m/h][m/s][m/h][m/s][m/h]
200.0000220.07920.0022107.9560.0022328.0352
400.0016645.99040.0014365.16960.00310111.1636
600.00504618.16560.0006242.24640.00567020.412
Table 9. Differences between drilling velocity measured for various air pressures and drill rotation speeds of the 140 mm diameter drill bit, in the interval 90–108 m below ground level.
Rotation Speed [1/min]Difference Between Drilling Velocity [m/s, m/h] for Pressures:
20 and 16 bar24 and 20 bar24 and 16 bar
[m/s][m/h][m/s][m/h][m/s][m/h]
200.0015455.5620.0006222.23920.0021677.8012
40−0.001170−4.2120.00387913.96440.0027069.7416
600.00295710.64520.0001950.7020.00315211.3472

