Article

Laser Cutting Characteristics on Uncompressed Anode for Lithium-Ion Batteries

1
Department of Mechanical and Automotive Engineering, Kongju National University, Cheonan 31080, Korea
2
Energy Materials Research Center, Advanced Materials Division, Korea Research Institute of Chemical Technology, 141 Gajeong-ro, Yuseong-gu, Daejeon 305-600, Korea
*
Authors to whom correspondence should be addressed.
Energies 2020, 13(10), 2630; https://doi.org/10.3390/en13102630
Submission received: 13 March 2020 / Revised: 12 May 2020 / Accepted: 18 May 2020 / Published: 21 May 2020
(This article belongs to the Special Issue High Energy Electrochemical Capacitors)

Abstract

:
Lithium-ion batteries are actively used for many applications due to many advantages. Although electrodes are important during laser cutting, most laser cutting studies use commercially available electrodes. Thus, effects of electrodes characteristics on laser cutting have not been effectively studied. Since the electrodes’ characteristics can be manipulated in the laboratory, this study uses an uncompressed anode on laser cutting for the first time. Using the lab-made anode, this study identifies laser cutting characteristics of the uncompressed anode. First, the absorption coefficients of graphite and copper in the ultraviolet, visible, and infrared range are measured. The measured absorptivity of the graphite and copper at the wavelength of 1070 nm is 88.25% and 1.92%, respectively. In addition, cutting phenomena can be categorized in five regions: excessive cutting, proper cutting, defective cutting, excessive ablation, and proper ablation. The five regions are composed of a combination of multi-physical phenomena, such as ablation of graphite, melting of copper, evaporation of copper, and explosive boiling of copper. In addition, the top width varies in the order of 10 μm and 1 μm when applying high and low volume energy, respectively. The logarithmic relationship between the melting width and the volume laser energy was found.

1. Introduction

Lithium-ion batteries (LIBs) are used for many applications, such as portable electronic devices, electric or hybrid electric vehicles, and energy storage systems (ESS), since they have many advantages compared to lead-acid batteries and nickel-cadmium batteries [1]. While material research on LIBs has been actively done to improve battery performances [2,3,4,5,6,7,8,9,10], few studies on the manufacturing process of LIBs have been done. Among the manufacturing processes, cutting of electrodes is important, because defects formed during cutting process may lead to malfunction of battery systems or battery explosion. Application of laser cutting to substitute conventional mechanical cutting has been applied in various areas due to their advantages [11,12,13,14,15,16,17,18,19,20,21,22,23,24,25,26,27,28,29].
Lee et al. [22,23,25,28,29] proposed a mathematical model to understand multi-physical phenomena during the laser cutting of electrodes. The proposed mathematical model is used to investigate the physical phenomena during the laser cutting of current collectors [22,23,28], anode [29], and cathode [25]. Furthermore, they investigated the physical phenomena during laser cutting of electrodes for lithium-ion batteries through laser parameter optimization [26], cutting width definition [24], and cutting efficiency [21].
Laser cutting of LiCoO2 cathode was performed and studied by Lutey et al. [30,31]. They characterized the process efficiency and quality for laser cutting of lithium iron phosphate battery electrodes [30]. Moreover, they used a 1064 nm wavelength nanosecond pulsed fiber laser with a maximum average power of 500 W and a repetition rate of up to 2 MHz. They obtained the cutting velocities of 3 m/s and 5 m/s for the cathode and anode, respectively, with the maximum average laser power. They found the microstructural and chemical changes near the cut edge of the cathode using a Raman line map spectra [31].
The electrodes’ characteristics, such as material compositions, dimensions, and arrangement, are important parameters during laser cutting. However, most laser electrode cutting studies [13,22,23,24,26,27,28,29,30,31,32,33,34] still use commercially available electrodes due to the lack of knowledge in the area of material science and engineering. Since it is hard to control material properties and geometries of electrodes by manufacturing engineers, there is a limitation in the study of the effect of electrodes’ characteristics on laser cutting of electrodes. Most electrodes are available in compressed form, and uncompressed electrodes are commercially unavailable. Since the electrodes’ characteristics can be manipulated in the laboratory, this study uses an uncompressed anode in laser cutting research for the first time. Using this lab-made anode, this study identifies the laser cutting characteristics of the uncompressed anode. In addition, the absorption coefficients in the ultraviolet (UV), visible, and infrared range are measured since the anode is made in the laboratory. This research is written as follows. First, materials, experiments, and measurements are described. Second, absorption coefficients of the graphite and copper are explained. Third, the laser cutting characteristics using uncompressed anodes are analyzed. Finally, the conclusions are presented.

2. Materials, Experiments and Measurements

2.1. Materials

1-methyl-2-pyrrolidinone (NMP, anhydrous 99.5%) and poly vinylidene fluoride (PVDF, Kynar flex 2851) were obtained from Aldrich and ARKEMA. A slurry was prepared by mixing the active material and binder dissolved in NMP. Graphite was mixed with PVDF as the binder in a weight ratio of 9:1. The slurry was one side-coated on the 100% pure copper foil, followed by drying under vacuum at 120 °C for 12 h. The copper foil works as the current collector having a thickness of 20 μm. We fixed the thickness of the coating to 20 μm. After coating, the coated foil is typically pressed to satisfy a required thickness of the anode and increase loading density. The size of electrodes were 150 mm (Width) × 200 mm (Length).

2.2. Experiments

Single-mode Quasi-CW Ytterbium Fiber Laser (IPG YLM-200/2000-QCW) was used in this experiment. This laser can provide both pulsed and continuous (CW) modes. This study used a CW mode. The laser beam’s wavelength was 1070 nm, and M2 value was 1.05. The maximum output power in CW mode was 250 W. Experiment settings can be referred to in a previously published paper. The test sample was placed and fixed at both ends, where the fixtures were placed at the top and bottom of each end. The vertical distance from the F-theta lens to the sample’s surface was 100 mm. The laser spot size on the surface was 23 μm. Laser cutting experiments were conducted on the anode by changing power and velocity. The laser power was changed from 50 W to 250 W at intervals of 50 W, and the cutting speed was changed from 500 mm/s to 5000 mm/s at intervals of 50 mm/s.

2.3. Measurements

The definition of kerf width, top width, and melting width can be shown in Figure 1 and found in previously published papers [17,18,24]. The defined kerf, top, and melting width were measured by a scanning electron microscope (SEM, TESCAN MIRA LMH). The resolution of this SEM was 1.0 nm at 30 kV, and available magnification was 4 to 1,000,000.
One of the important properties for understanding the physical phenomena of laser cutting process is an absorption coefficient. Since no optical absorption coefficient of the anode was available from the literature, this study obtained the optical absorption coefficient depending on the wavelength using spectrophotometry (SHIMADZU Solidspec-3700). This spectrophotometry using an integrating sphere [35] can measure reflectivity and transmissivity. Three detectors were used. A photomultiplier tube (PMT) detector for the ultraviolet and visible region (165–1000 nm), as well as InGaAs and PbS detectors for the near-infrared region (700–3300 nm), were used. The resolution was 0.1 nm. The wavelength accuracy was ± 0.2 nm in the ultraviolet and visible region and ± 0.8 nm in the near-infrared region. Using the measured reflectivity and transmissivity in the range of 240 nm to 2600 nm, absorptivity can be calculated from the following equation [36,37,38,39]:
ρ λ + α λ + τ λ = 1 ,
where ρ λ , α λ , and τ λ are a spectral reflectivity, absorptivity, and transmissivity, respectively.

3. Result and Discussion

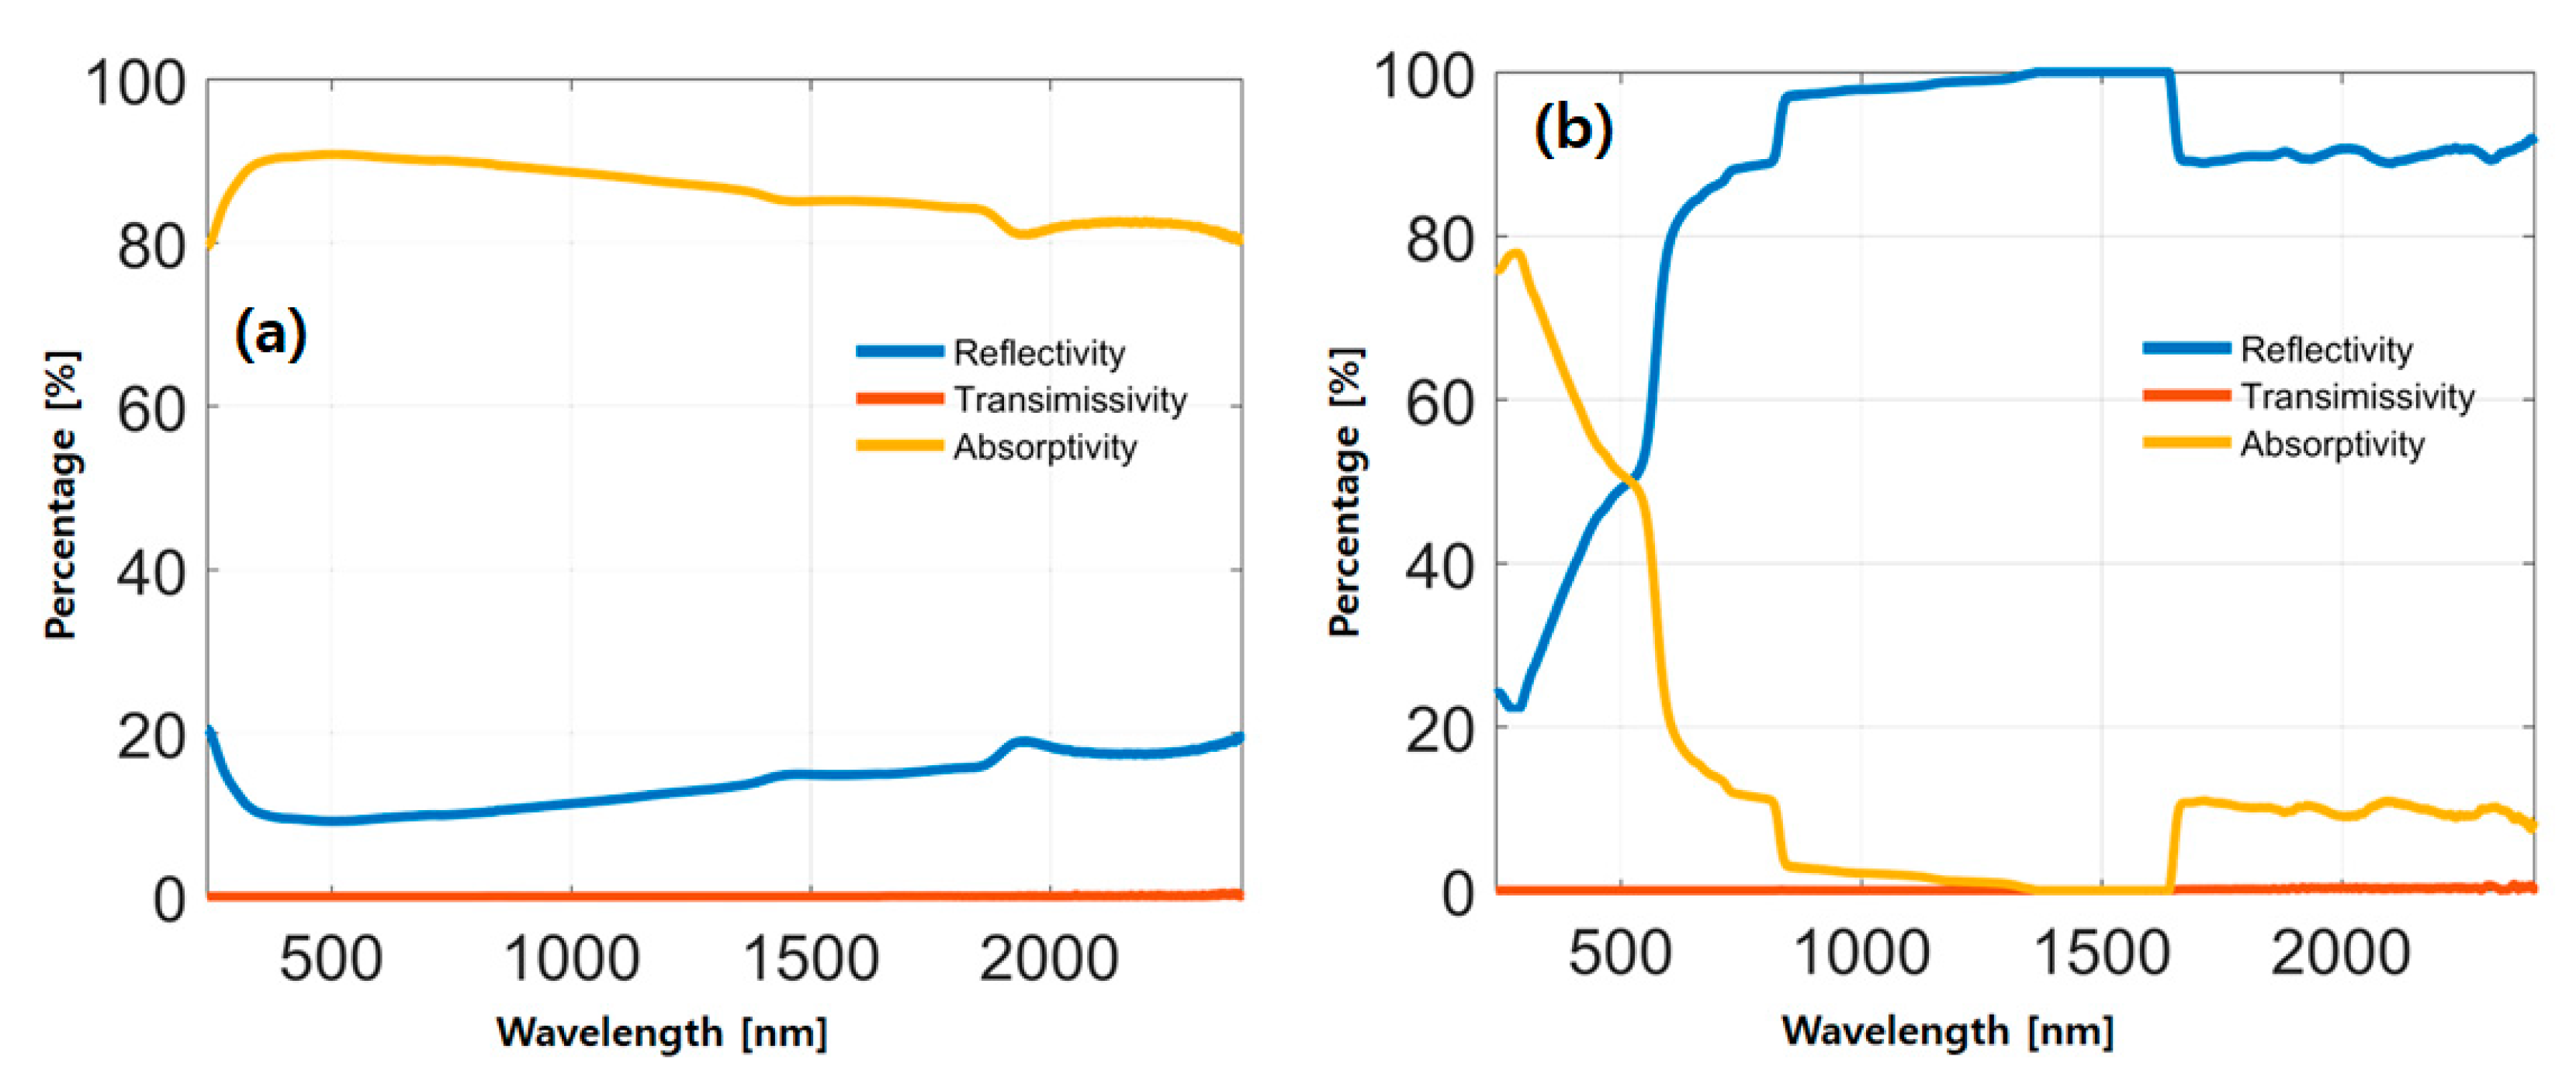
3.1. Absorption Coefficients of the Anode

The sample used in this study is an anode, which is a graphite-coated copper. Since the graphite was coated only on the top of copper, the reflectivity and transmissivity of the graphite were measured from the top surface of the anode, while those of the copper were measured from the bottom surface of the anode. After the transmissivity and reflectivity were measured by spectrophotometry, the absorptivity was obtained by Equation (1). These are shown in Figure 2. Since the anode sample was 40 μm thick, the transmissivity of both graphite and copper is zero. Therefore, Equation (1) is re-written as:
α λ = 1 ρ λ .
The absorptivity of the graphite was relatively high and its values were mostly above 80% in all ranges of the wavelength. In particular, the reflectivity of the graphite at the wavelength of 1070 nm is 11.75% and the absorptivity of the graphite is 88.25%. In the same way, the reflectivity and absorptivity of the copper at the wavelength of 1070 nm were obtained to be 98.08% and 1.92%, respectively. From this measurement, it was obvious that the laser cutting applied on the graphite was more efficient than that on the copper. Furthermore, the measured absorptivity of the graphite provides an opportunity to understand the material removal mechanism more precisely.

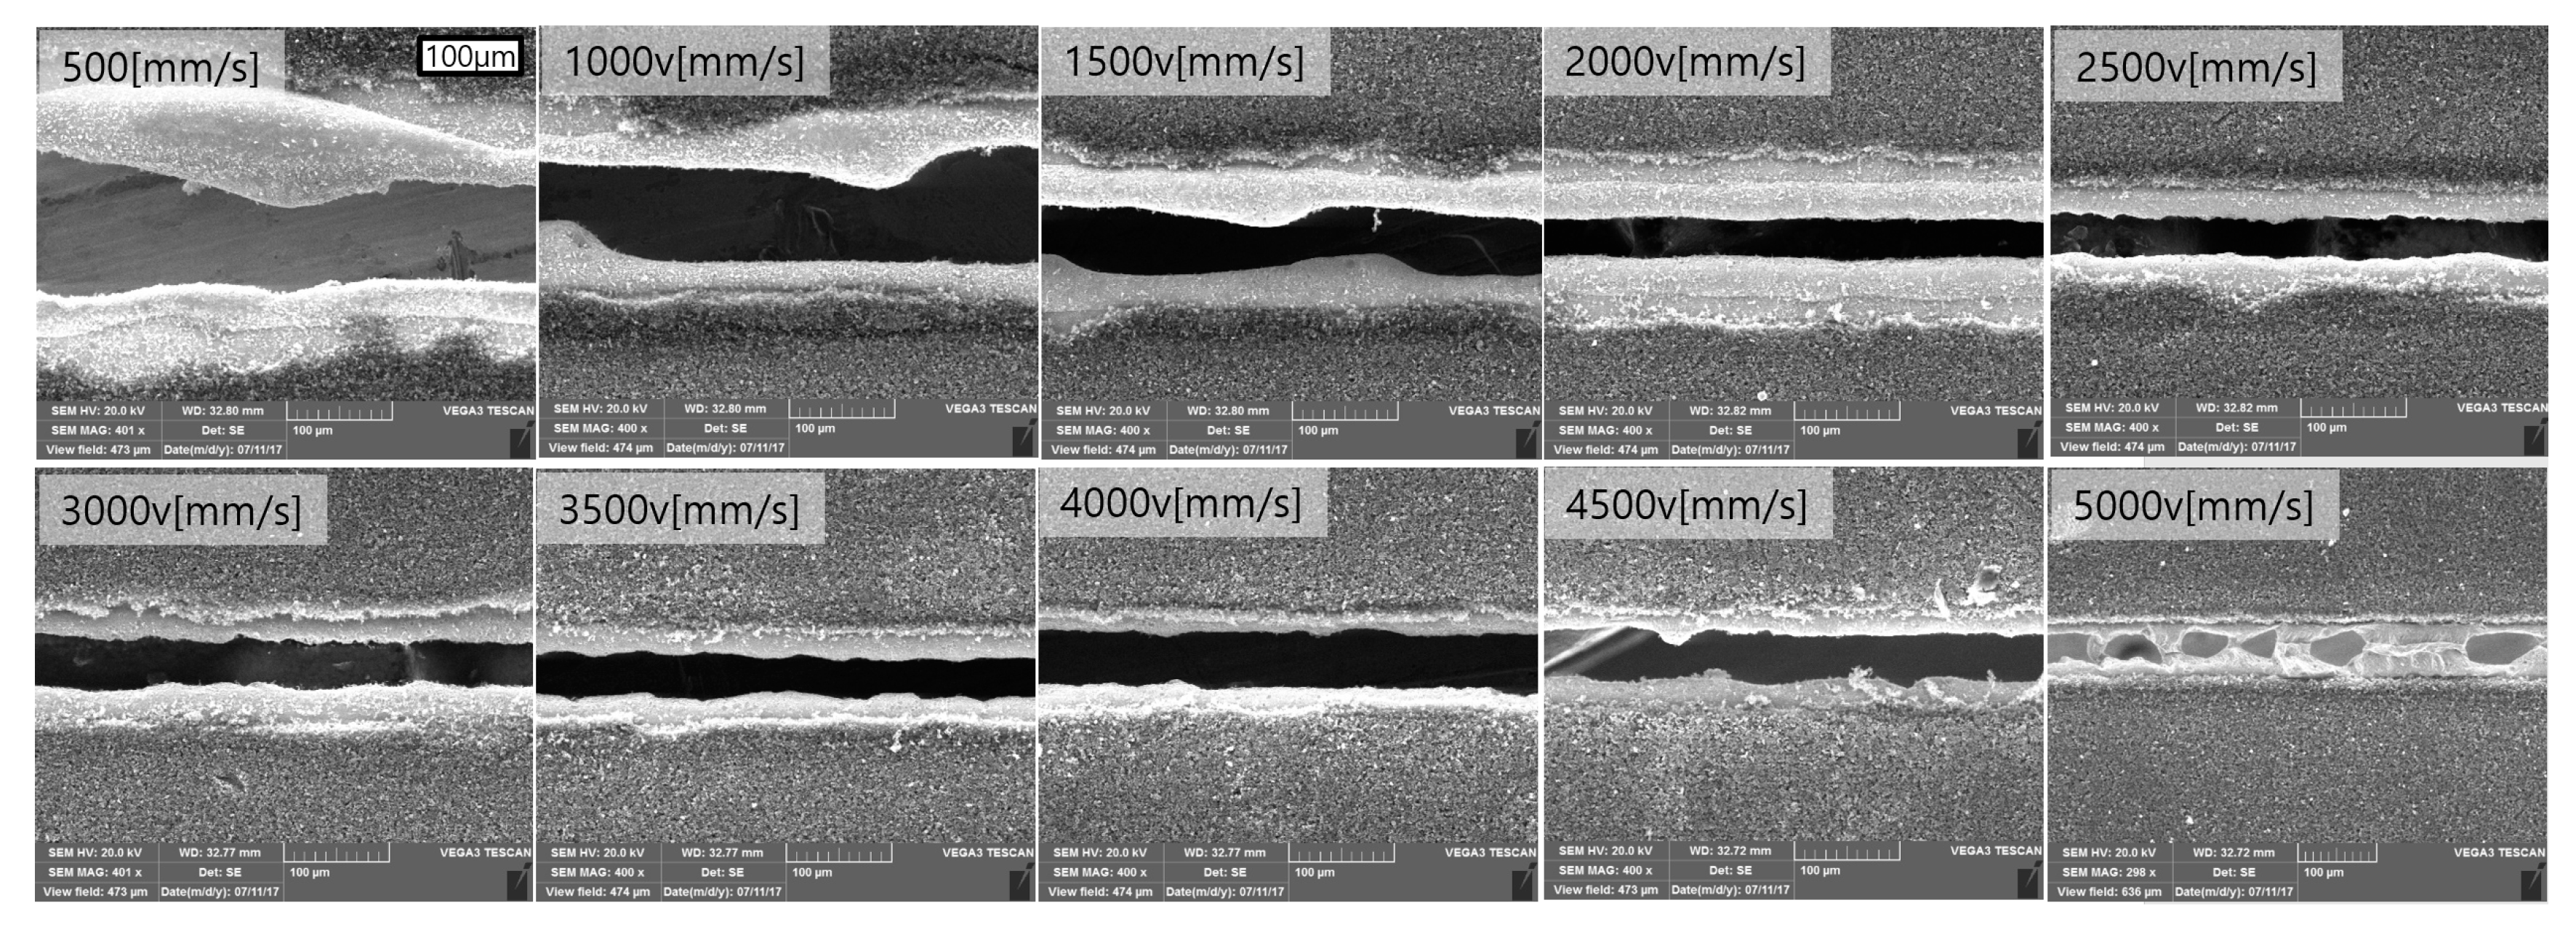
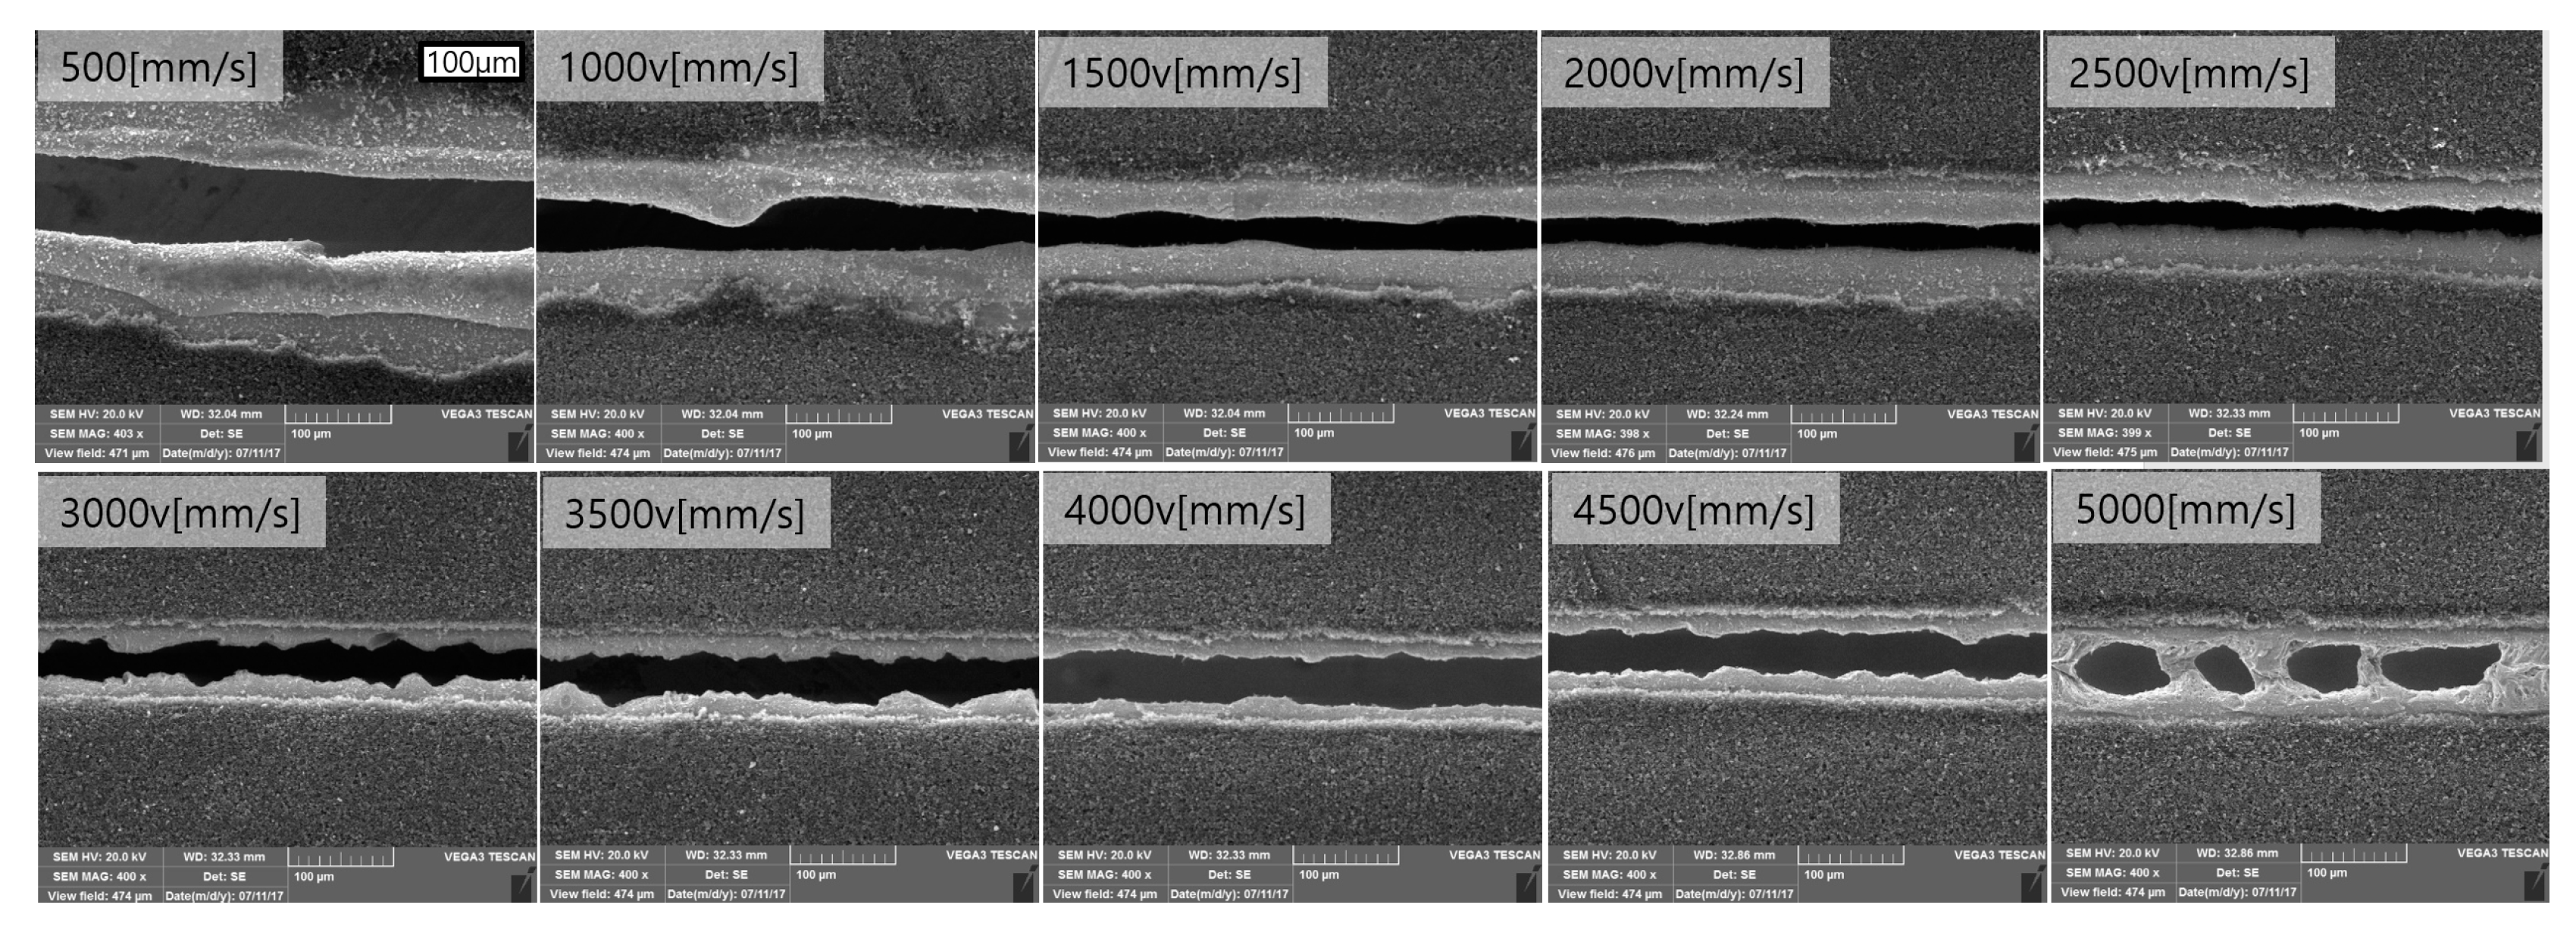
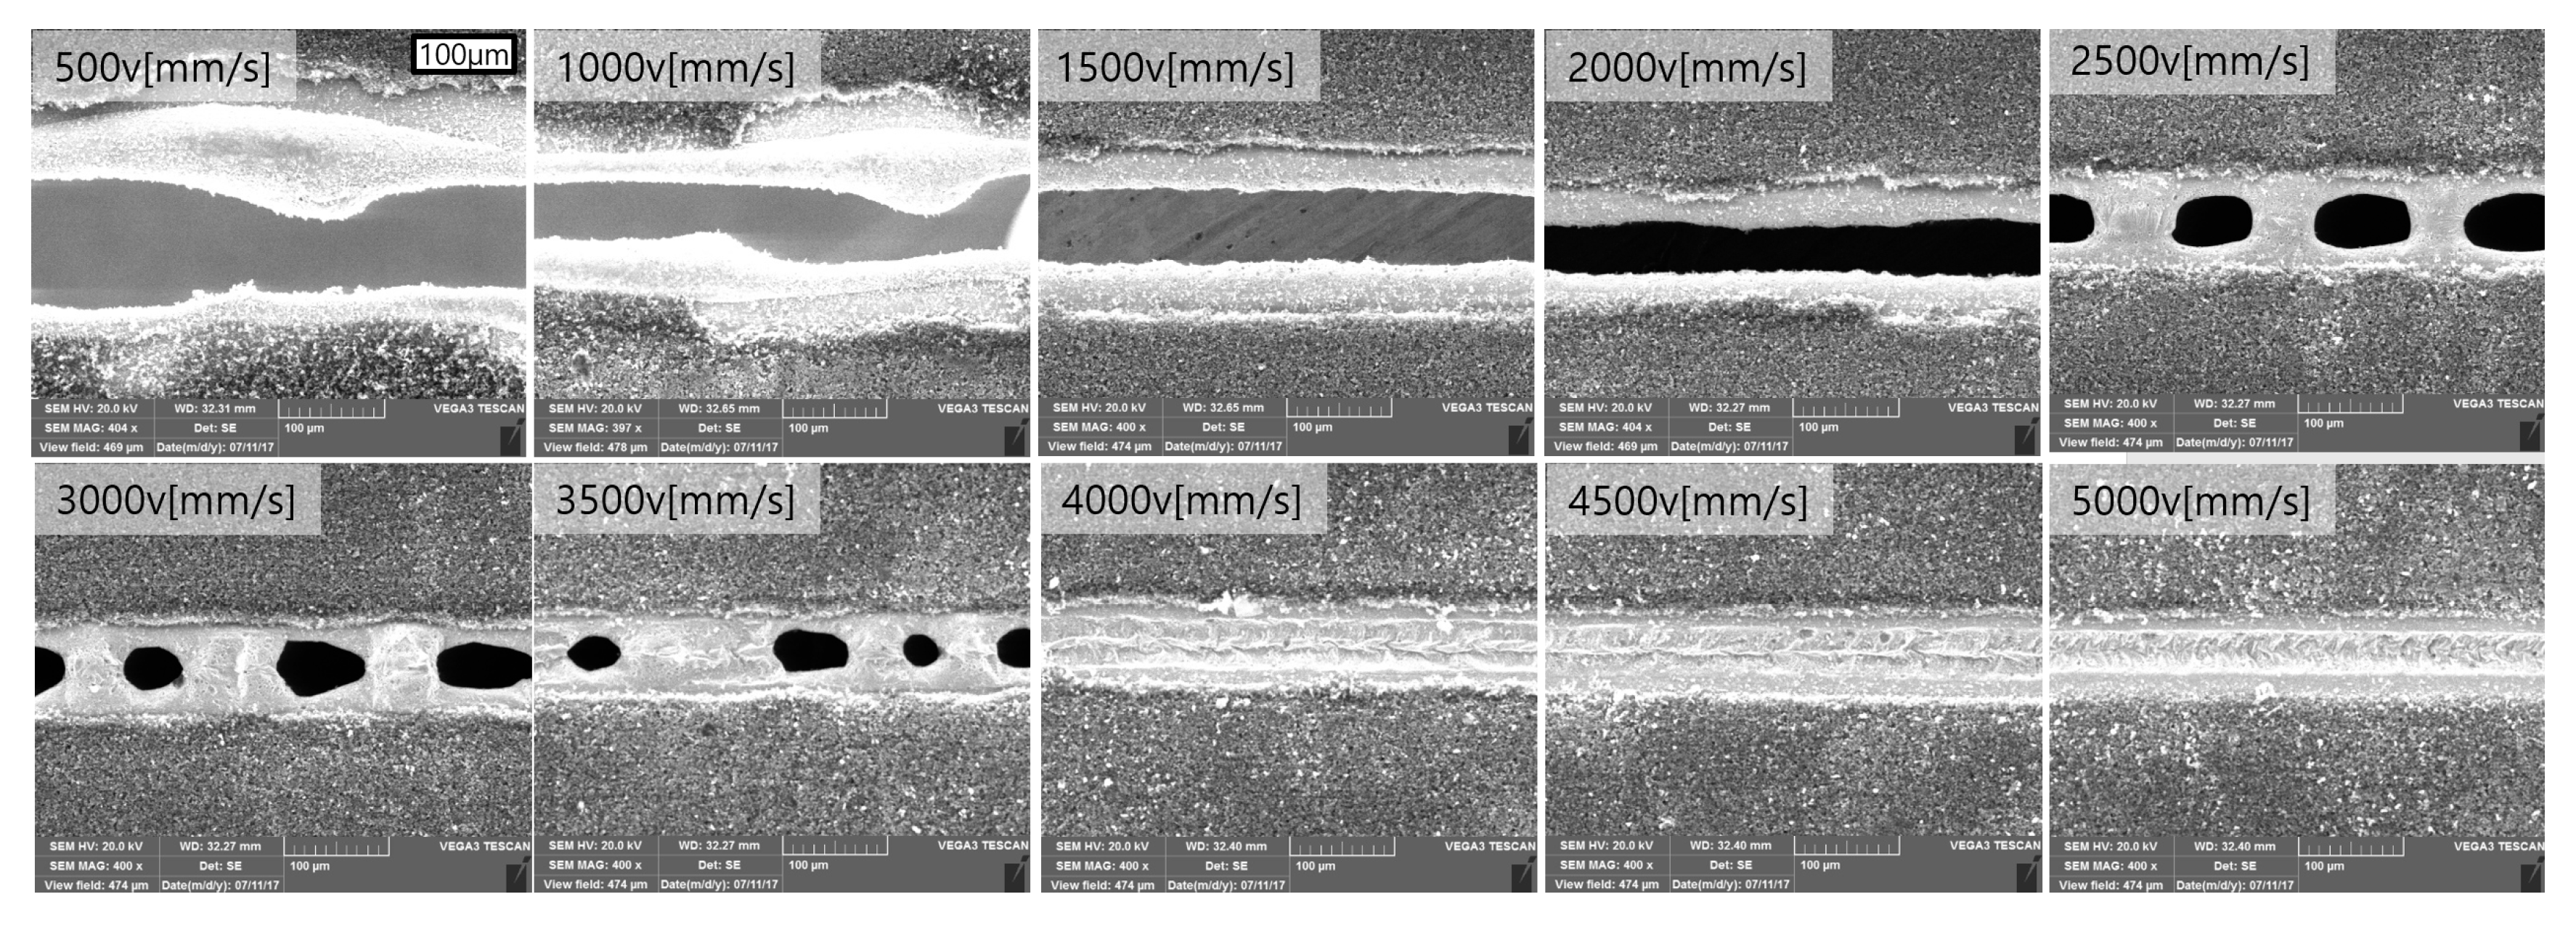
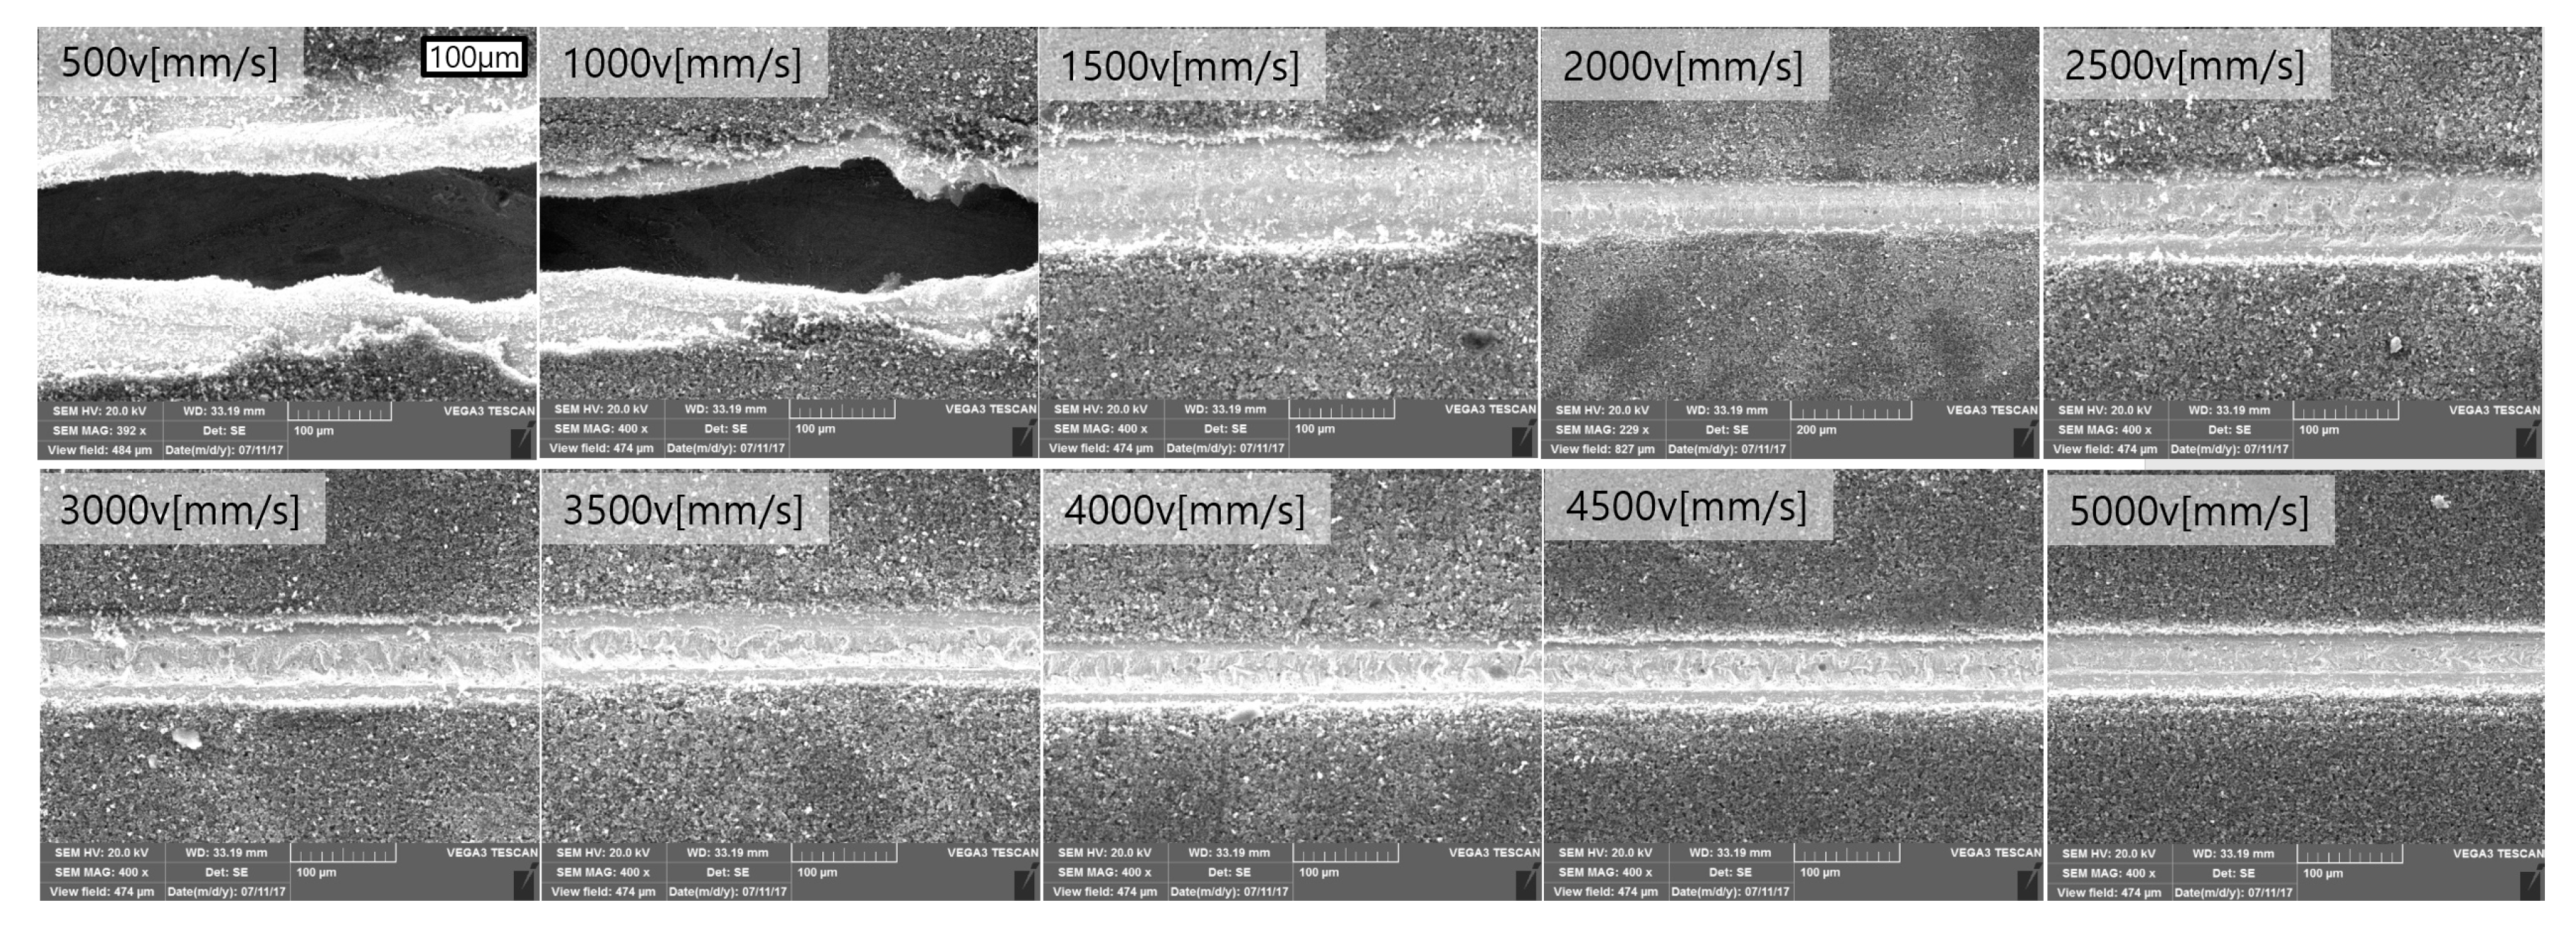
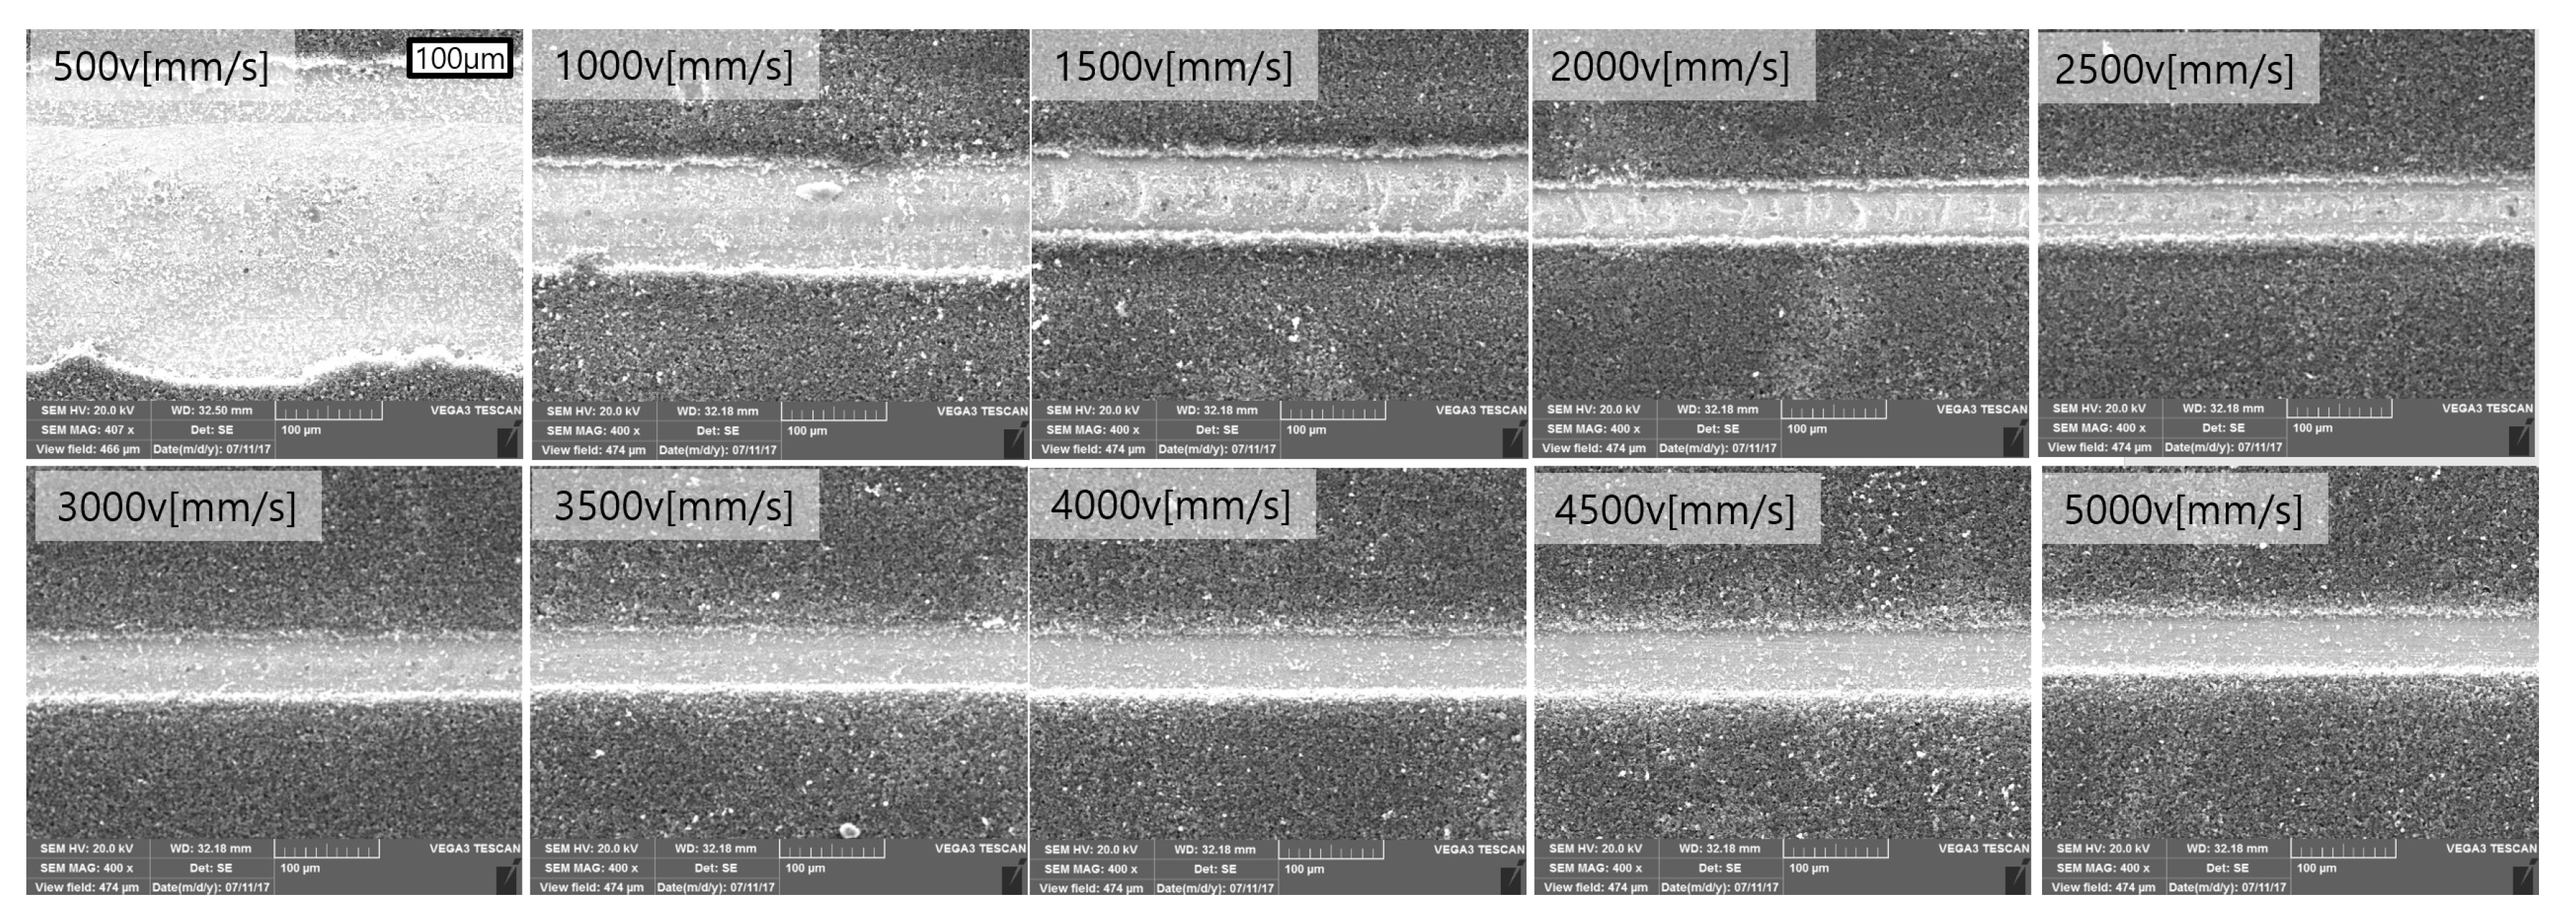
3.2. Laser Cutting Characteristics

The top surface of the laser cut specimen was analyzed using SEM. SEM images are shown in Figure 3, Figure 4, Figure 5, Figure 6 and Figure 7. Their top, melting, and kerf widths were measured from the SEM images. To define the degree of change ( W ^ n ), we defined the following:
W ^ n = [ ( W n ) M a x W ¯ n , W ¯ n ( W n ) M i n ]   n = t o p ,   m e l t ,   a n d   k e r f ,
where W ¯ n is the average width, ( W n ) M a x is the maximum width, ( W n ) M i n is the minimum width, and n is the specific width, such as top, melt, and kerf widths. The first and second terms in the bracket indicate the difference between the maximum and average values, as well as the difference between the minimum and average values, respectively. Through this value, we can understand the degree of variation of cutting widths so that the stability of the laser processing can be evaluated both qualitatively and quantitatively.
Figure 3 shows SEM images when the laser power is 250 W. First, when the velocity is less than 1500 mm/s, the top, melting, and kerf widths vary significantly. It showed a large variation along the cutting direction. When the speed was 500 mm/s, the largest variation was observed. The average top width ( W ¯ t o p ) was 202.02 μm and W ^ t o p = [ 1.85 ,   5.72 ] μm. The melting and kerf widths were relatively wide. The average values of melting and kerf widths were 163.71 μm and 90.00 μm, respectively. The degree of change are W ^ m e l t = [ 6.40 ,   8.75 ]   μ m and W ^ k e r f = [ 15.39 ,   13.70 ]   μ m . It was observed that the variation of the width increases as the laser energy increases. Relatively constant kerf, melting, and top widths can be observed between the laser speed of 2000 mm/s to 4500 mm/s. Relatively wide top width was observed at 2000 mm/s, but the almost similar top width was observed at 2500–4500 mm/s. When the laser speed was 5000 mm/s, no cutting was achieved, and the re-fusion phenomenon was observed after the copper melted. Three regions were divided according to the laser energy ( E l i n e ) range used: (1) excessive cutting region, (2) proper cutting region, and (3) defective cutting region. The excessive cutting region was E l i n e 4.0115 × 10 11   J / m 3 . The proper cutting region was 1.3372 × 10 11 E l i n e < 3.0086 × 10 11   J / m 3 , and the defective cutting region was 1.2034 × 10 11 E l i n e . In the excessive cutting region, the variation of the top, melt, and kerf widths were relatively considerable. The proper cutting region showed relatively small variation in top, melt, and kerf width. In addition, no complete cut was observed in the defective cutting region and re-fusion was observed. Due to the re-fusion, the connecting bridge was formed.
Figure 4 shows the SEM images with a laser power of 200 W. Similar to 250 W, the excessive cutting region ( E l i n e 4.8138 × 10 11   J / m 3 ), proper cutting region ( 1.0697 × 10 11 E l i n e 3.2092 × 10 11   J / m 3 ), and defective cutting region ( 0.9627 × 10 11 E l i n e ) can be divided. The excessive cutting region showed large variation at all widths as observed with the laser power of 250 W. The largest variation was observed at 500 mm/s. The average top, melt, and kerf widths were 195.12, 137.54, and 72.79 μm, respectively. The degree of change of the top, melt, and kerf widths were W ^ t o p = [ 25.25 ,   12.63 ]   μ m , W ^ m e l t = [ 27.78 ,   19.19 ]   μ m , and W ^ k e r f = [ 39.23 ,   13.80 ]   μ m , respectively. The proper cutting region had almost constant top, melt, and kerf widths. Even though the degree of change was relatively small in the proper cutting region, an additional two regions can be distinguished according to the shape of the kerf width. On the one hand, a kerf width in the form of a smooth connection curve was observed in 1.9255 × 10 11 E l i n e 3.2092 × 10 11   J / m 3 (laser cutting speed of 1500 mm/s to 2500 mm/s). On the other hand, we observed a relatively zigzag shaped kerf width in 1.0697 × 10 11 E l i n e 1.6046 × 10 11   J / m 3 (laser cutting speed of 3000 mm/s to 4500 mm/s). The E l i n e range, in which the zigzag shaped kerf width was observed, may be a transient region from the defective cutting to the proper cutting. It can be inferred that the less frequent evaporation points may be generated in comparison to the volume energy range in 1.9255 × 10 11 E l i n e 3.2092 × 10 11   J / m 3 . Moreover, more frequent evaporation points may exist in comparison to the defective cutting region. In the defective cutting region, the re-fusion phenomenon and connecting bridge were also observed, as observed with the laser power of 250 W.
Figure 5 shows SEM images with a laser power of 150 W. At the given laser power, it can be divided into four regions by the cutting speed. The three previously observed regions and an extra ablation region were observed. The energy range of each region is as follows: the excessive cutting region ( 3.6103 × 10 11   J / m 3 E l i n e ), the proper cutting region ( 1.8052 × 10 11 E l i n e 2.4069 × 10 11   J / m 3 ), the defective cutting region ( 1.0315 × 10 11 E l i n e 1.4441 × 10 11   J / m 3 ), and the excessive ablation region ( E l i n e 0.9026 × 10 11   J / m 3 ). In the excessive cutting region, the width was varied in the order of 1 μ m . As an example, when the velocity was 500 mm/s, W ¯ k e r f and W ^ k e r f were 93.67 μm and [ 22.39 ,   20.03 ]   μ m , respectively. However, a relatively low degree of variability was observed in the proper cutting region. At the cutting speed of 1500 mm/s, W ¯ k e r f of 57.74   μ m and W ^ k e r f = [ 1.35 ,   1.68 ]   μ m were observed. The degree of variation is in the order of 0.1 μ m . The defective cutting region was observed over a cutting speed of 2500–3500 mm/s. The re-fusion phenomenon was observed, and this resulted in the connecting bridge formation. In this region, it was observed that the more laser volume energy was provided, the narrower the connecting bridge width was. The formation of the connecting bridge can be explained by the direction of fluid flow of melting copper. However, the defective cutting region has an almost constant top and melting width. In the excessive ablation region, no complete cut was observed so no kerf width can be observed. Relatively constant top and melting widths were observed, and the variation is in the order of 1 μ m .
Figure 6 shows the SEM images when a laser power of 100 W is applied. With the given laser power, the excessive cutting region ( 2.4069 × 10 11   J / m 3 E l i n e ) and the excessive ablation region ( 1.6046 × 10 11   J / m 3 E l i n e ) were observed. In the excessive cutting region, a high degree of variation was observed. At the cutting speed of 1000 mm/s, W ¯ k e r f = 80.98   μ m and W ^ k e r f = [ 28.11 ,   20.37 ]   μ m were observed. In the excessive ablation region, relatively constant top and melting widths were observed. As the cutting speed increased, it was observed that the top and melting widths constantly decreased. W ¯ t o p decreased gradually from 105.59 μm to 72.81 μm, and W ¯ m e l t gradually decreased from 58.92 μm to 22.05 μm. The ratio ( W ¯ m e l t / W ¯ t o p ) of these values varied from 0.55 to 0.3.
Figure 7 shows SEM images with a laser power of 50 W. Mostly, excessive ablation phenomena was observed. With the given laser power, the excessive ablation region ( 0.4814 × 10 11   J / m 3 E l i n e ) and the proper ablation region ( 0.4012 × 10 11   J / m 3 E l i n e ) were observed. An excessively wide top width was observed at the laser cutting speed of 500 mm/s. Thereafter, as the cutting speed increased, the top width decreased gradually. W ¯ t o p gradually decreased from 219.36 μm to 73.93 μm, and W ¯ m e l t gradually decreased from 100.17 μm to 22.73 μm. The ratio ( W ¯ m e l t / W ¯ t o p ) of these values were between 0.46 and 0.31. No signs of the melting of copper were observed in the proper ablation area. However, small particles were observed on the surface.
According to the observations of physical phenomena during laser cutting, cutting phenomena can be categorized in five regions: (1) excessive cutting, (2) proper cutting, (3) defective cutting, (4) excessive ablation, and (5) proper ablation. This is depicted with volume energy in Figure 8. Combinations of multi-physical phenomena, such as the ablation of graphite, melting of copper, evaporation of copper, and explosive boiling of copper, led to the abovementioned five regions. The volume energy range of the proper ablation, excessive ablation, and excessive cutting regions can be clearly distinguishable in Figure 8. However, the volume energy range of the excessive ablation, defective cutting, and proper cutting regions were overlapped.
Proper cutting may contain three dominant physical phenomena, such as the ablation of graphite, melting of copper, and evaporation of copper. Therefore, this region showed a very consistent laser cut surface with the small variation of kerf width. In addition, the small variation of top width was also observed, since continuous and stable heat transfer in the transverse direction was conducted.
In the excessive cutting region, explosive boiling may be included in addition to the three physical phenomena observed in the proper cutting region. Explosive boiling tends to increase the homogeneous nucleation rate and bubble growth, so that the mixture of vapor and liquid droplets are ejected. Due to large variations in density and entropy under explosive boiling, the kerf width showed a large variation and wavy cut surface.
In the defective cutting region, the evaporation point of copper was generated less frequently compared to the proper cutting, while the three physical phenomena observed in the proper cutting still exist. The excessive ablation region contains two dominant physical phenomena, such as the ablation of graphite and melting of copper. In the proper ablation region, only the graphite is ablated.

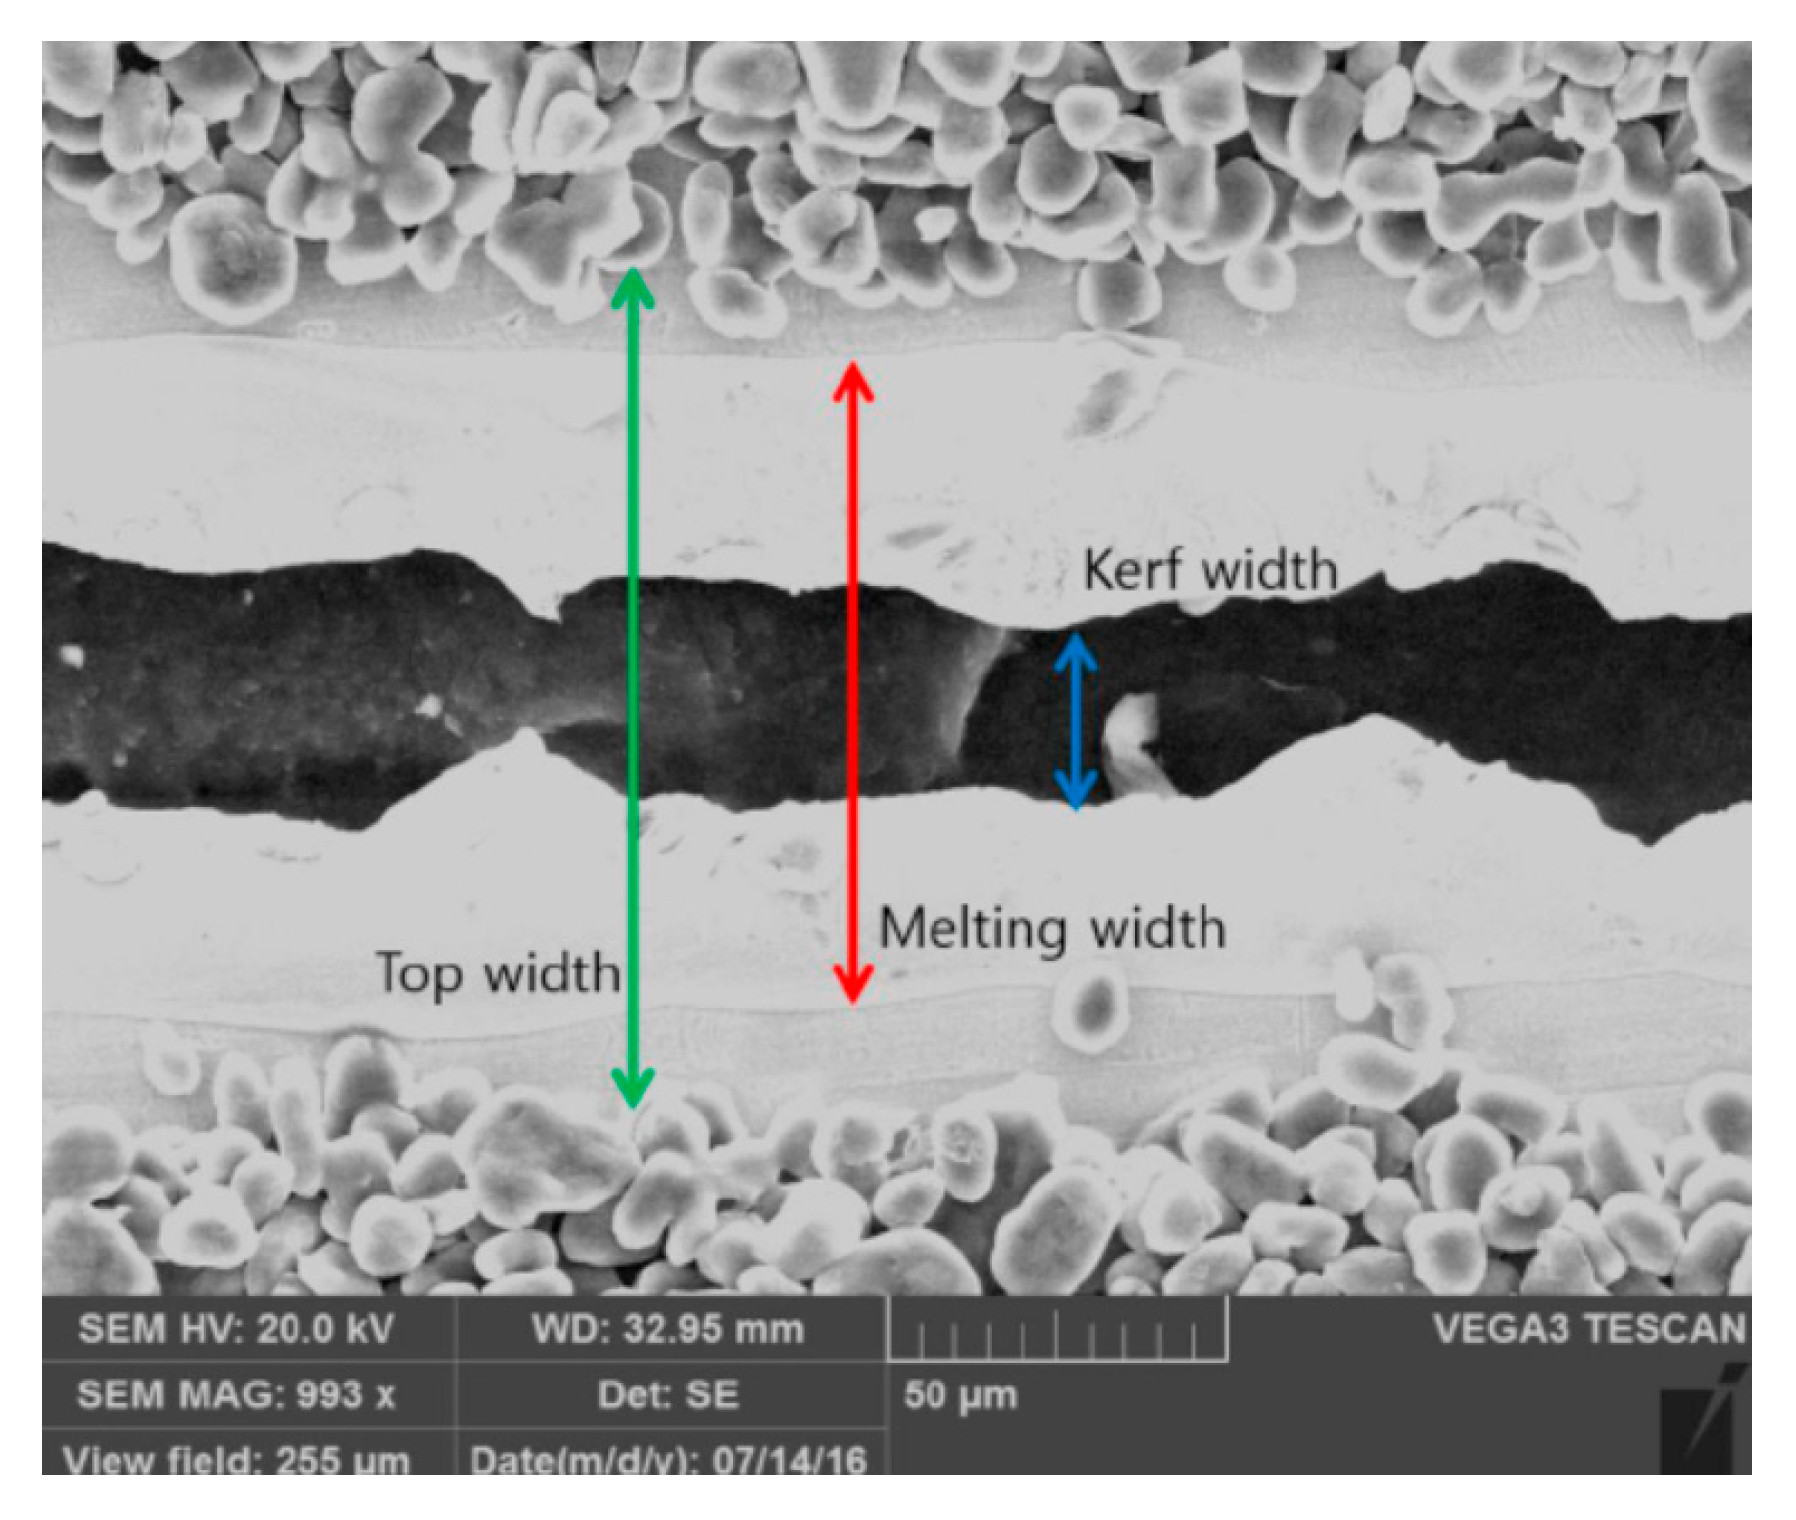
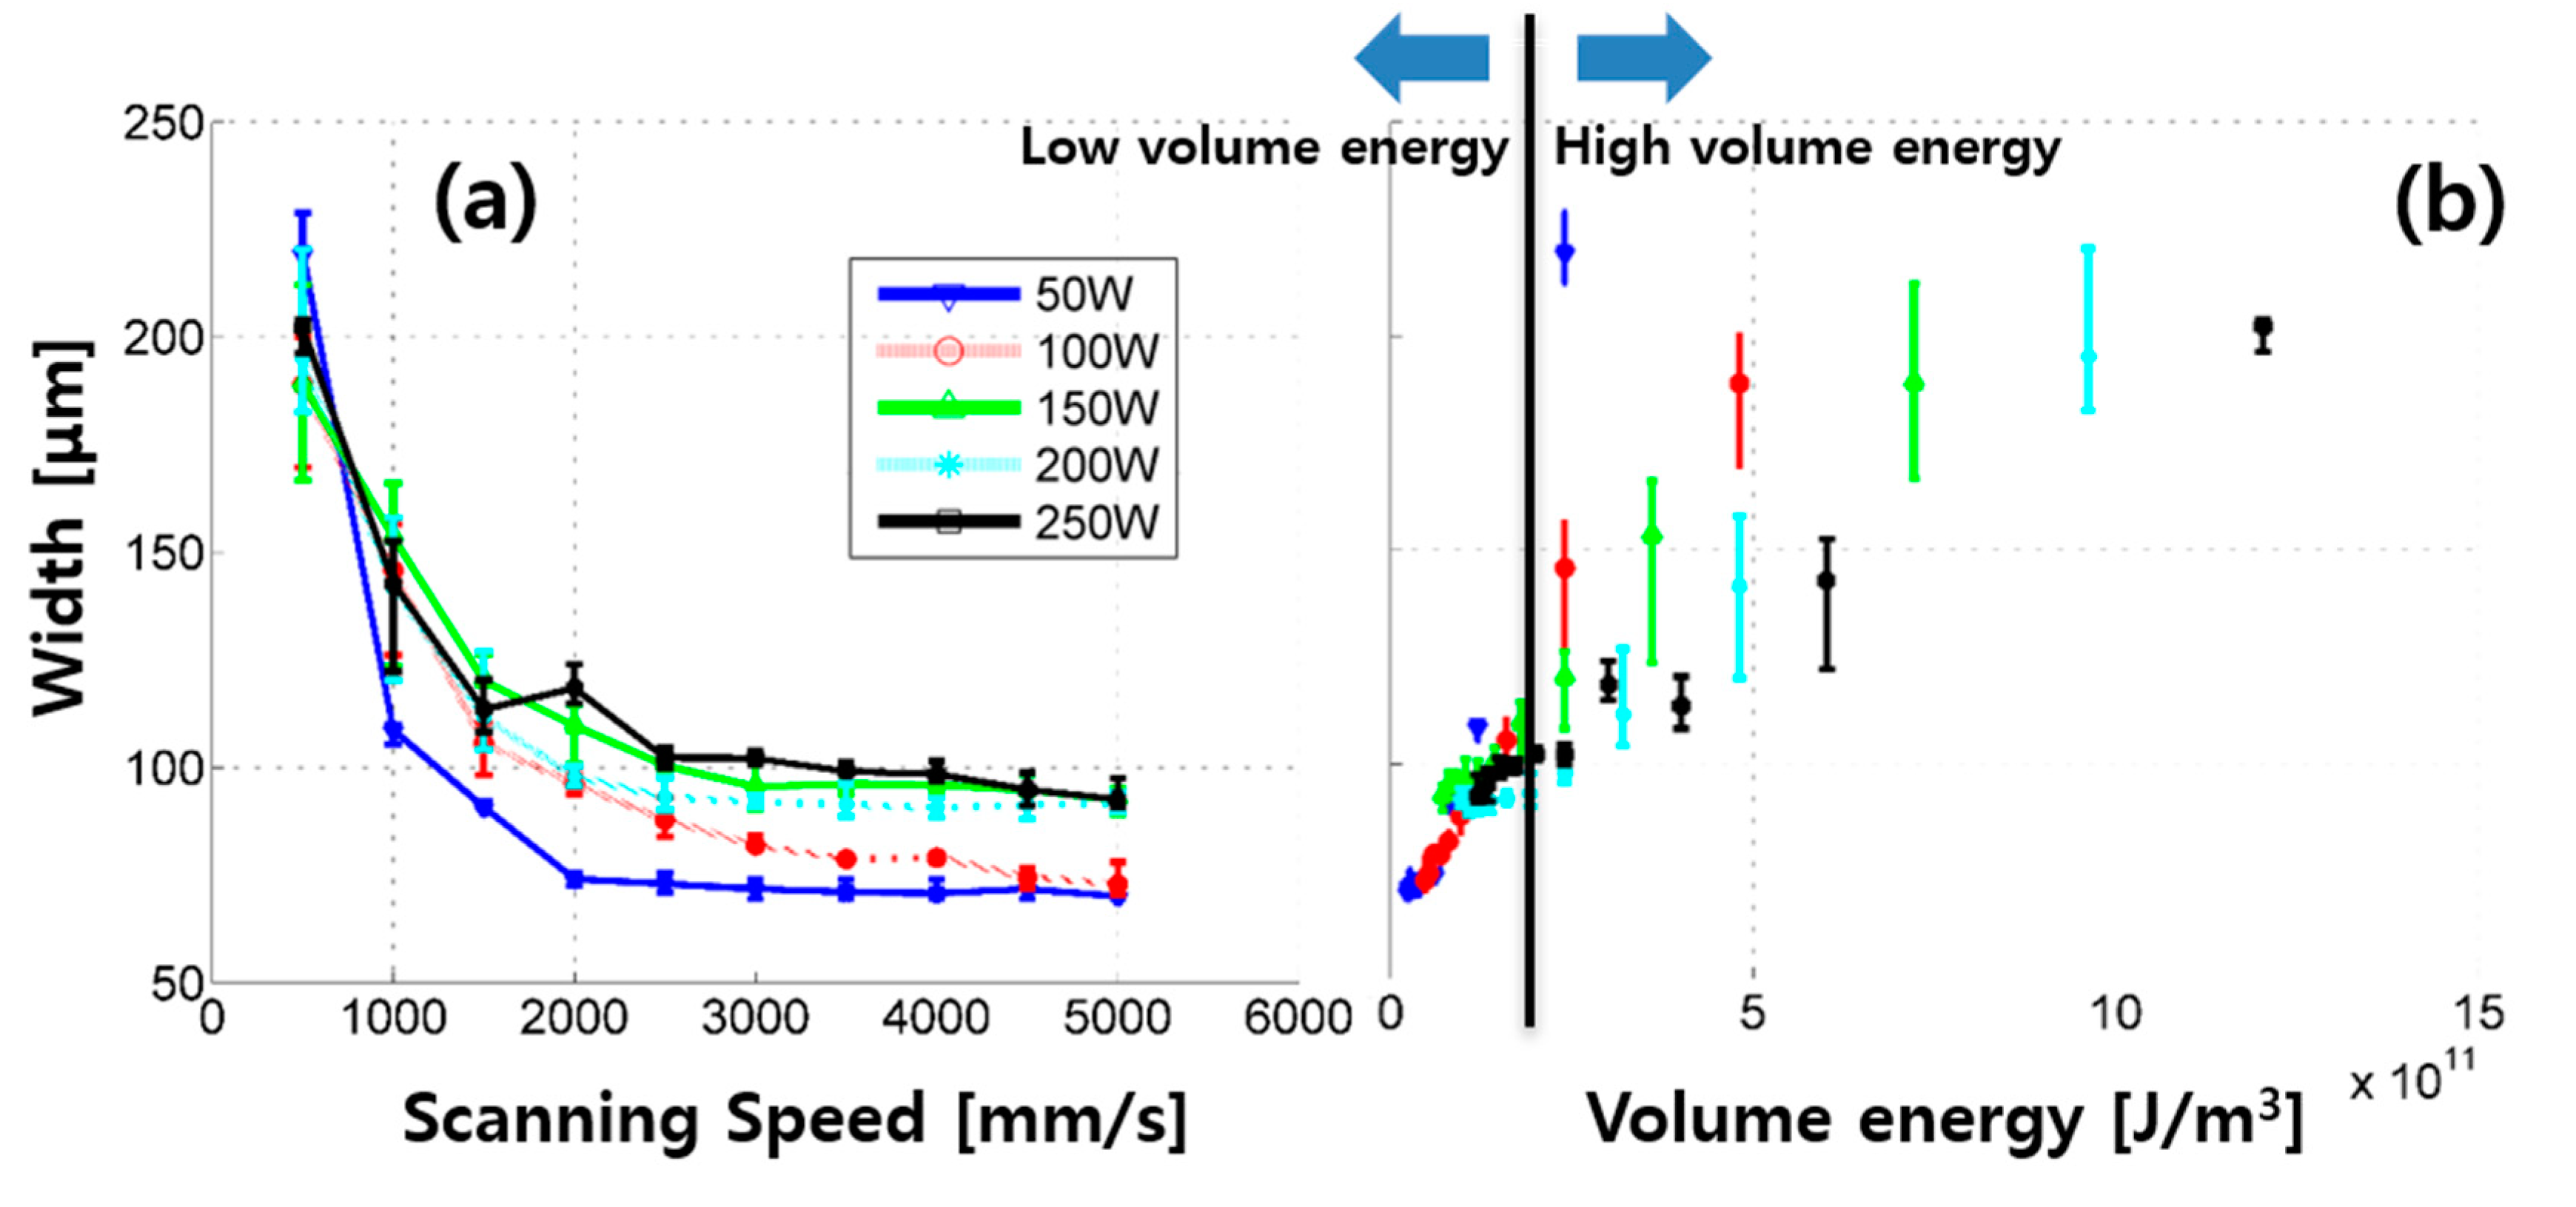
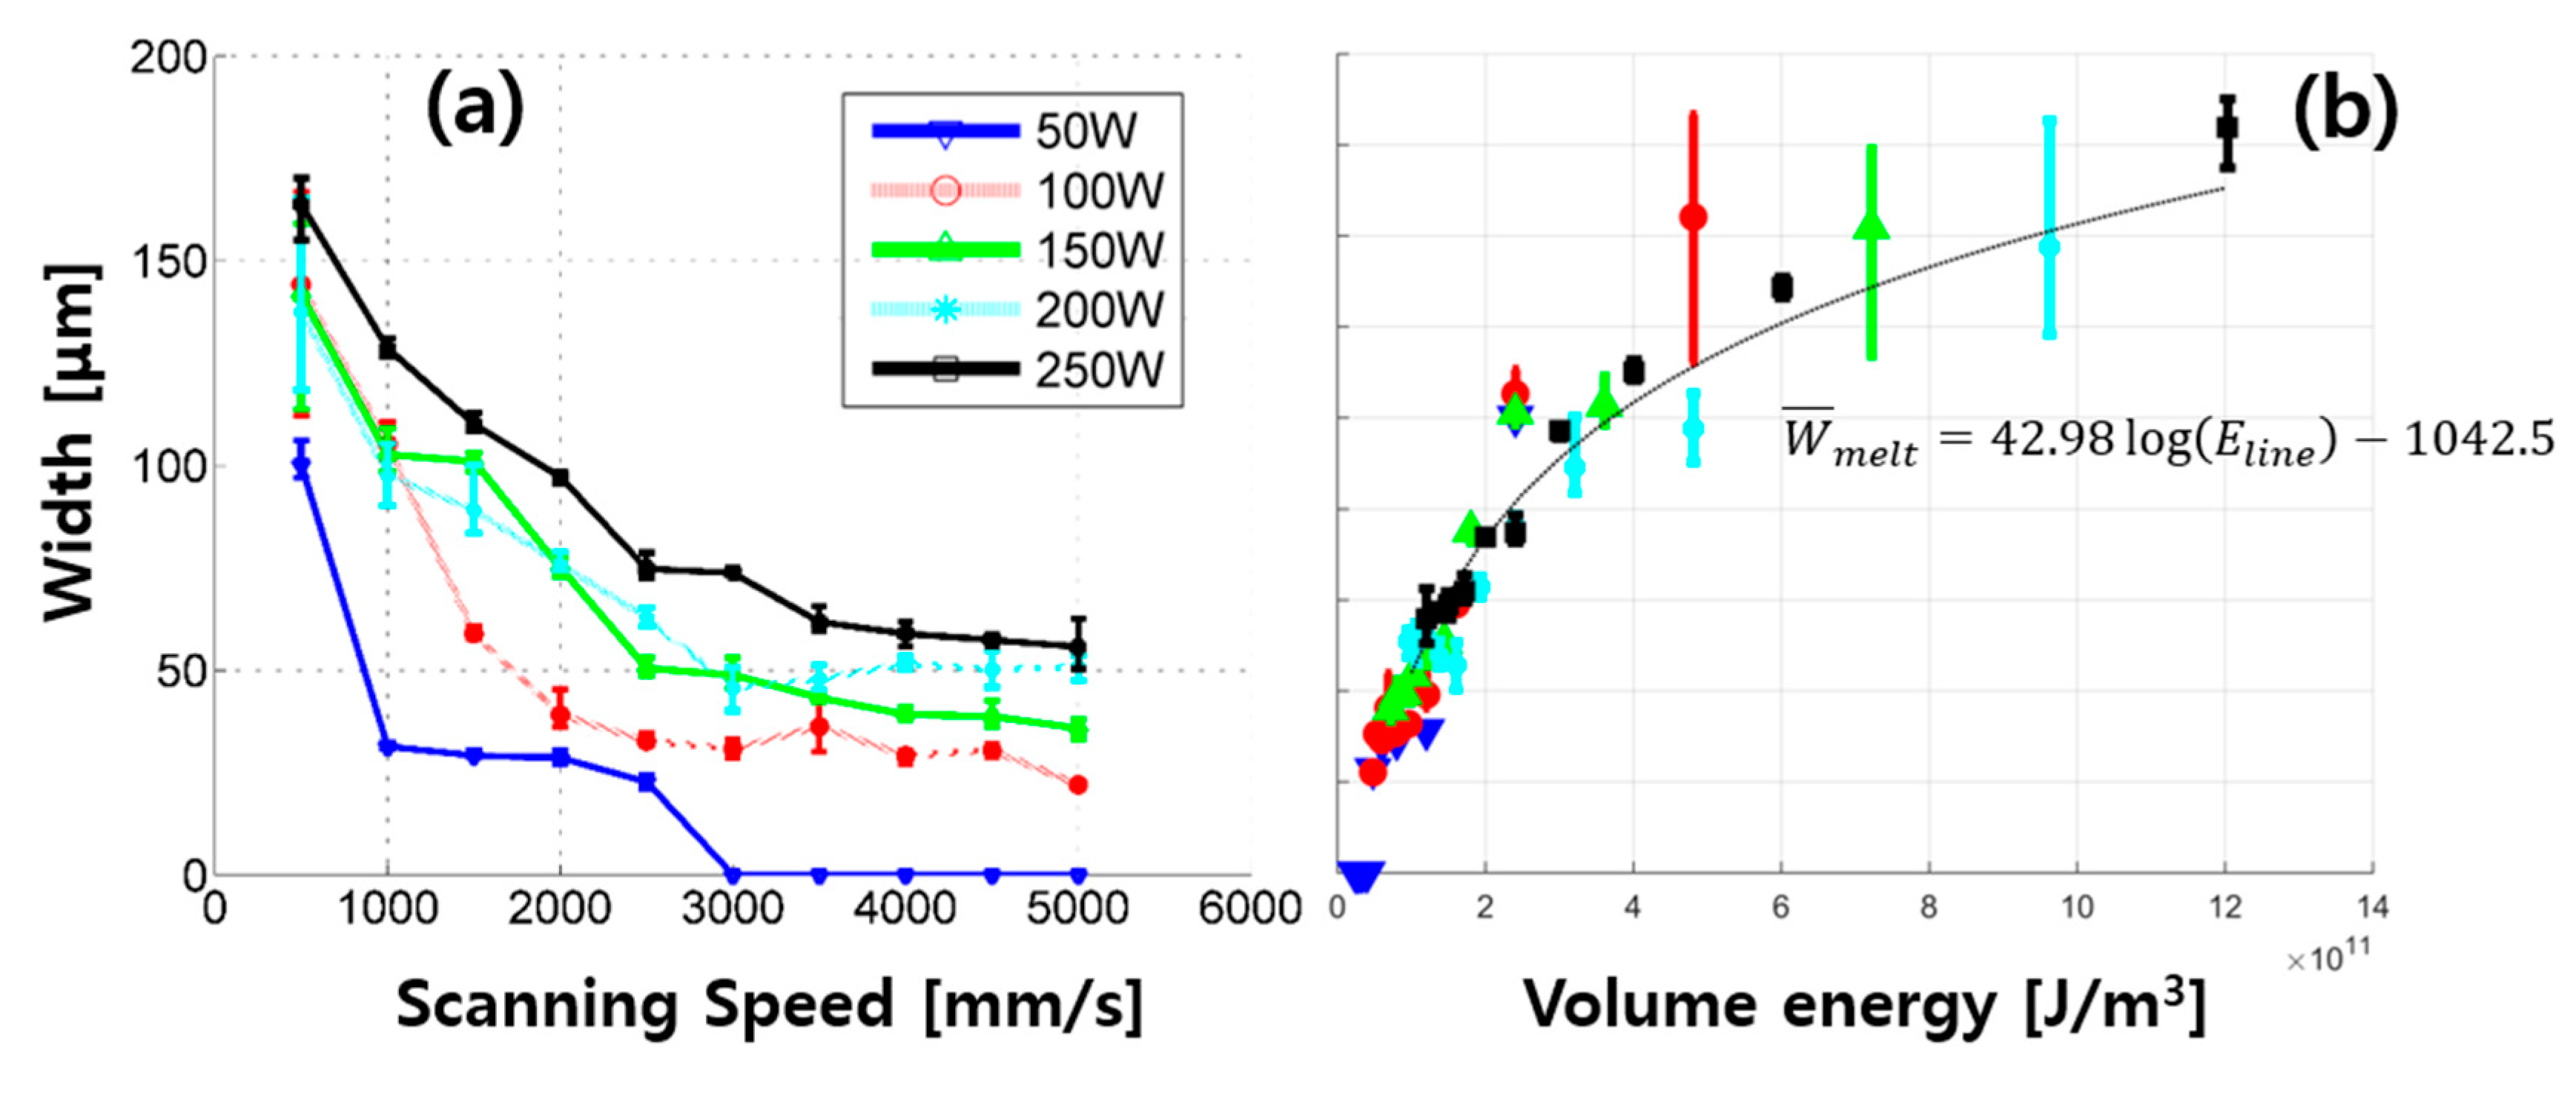
3.3. Laser Cutting Widths Trend

The top, melting, and kerf widths observed through SEM images were plotted in Figure 9, Figure 10 and Figure 11. The top width is shown in Figure 9, and it shows an exponentially decreasing trend. It was observed that all plots were saturated as the laser cutting speed increases. In addition, it was seen that the degree of change sharply decreased as the laser cutting speed increased. The degree of change was more clearly observable in the volume energy graph (Figure 9b). It can be divided into high volume energy and low volume energy, based on the volume energy of 2.4069 × 10 11   J / m 3 . High volume energy provides a high degree of variation in the top width, and its variation is in the order of 10 μ m . On the other hand, low volume energy provides less top width variation, and its variation is in the order of 1   μ m .
Figure 10 shows the melting width. As the cutting speed increases, the melting width gradually decreases. If the laser power is 50 W and the cutting speed is more than or equal to 3000 mm/s, no melting width is observed. The volume energy plot provides a fairly clear log trend (Figure 10b). The curve fitting yields the following:
W ¯ m e l t = 42.98 log ( E l i n e ) 1042.5
Figure 11 shows the kerf width. No kerf width was observed in the defective cutting, excessive ablation, and proper ablation regions. In this case, the kerf width was assigned as 0. Categorized regions can be more clearly seen in Figure 11b. The kerf width can be divided into three major regions: excessive cutting region, proper cutting region, and no cutting region. The no cutting region includes the defective cutting, excessive ablation, and proper ablation regions. A kerf width of about 80 μm or more was observed in the excessive cutting region (highlighted in red color in Figure 11b), which was relatively wide and had large variation. The proper cutting region, which is highlighted in green, had a relatively small variation and the kerf width was between 35 and 45 μm. Finally, the no cutting region is highlighted in blue.

4. Conclusions

This study investigates the application of laser cutting on the lab-made uncompressed anode.
This study identifies the laser cutting characteristics of the uncompressed anode by varying the laser power and speed. Furthermore, the absorption coefficients in the ultraviolet, visible, and infrared ranges are measured. The key observations and findings are summarized as follows:
  • This study uses an uncompressed and lab-made anode in laser cutting research for the first time.
  • The absorption coefficients of graphite and copper in the ultraviolet, visible, and infrared ranges are measured. In the wavelength (1070 nm) used in this experiment, the absorptivity of the graphite and copper were 88.25% and 1.92%, respectively.
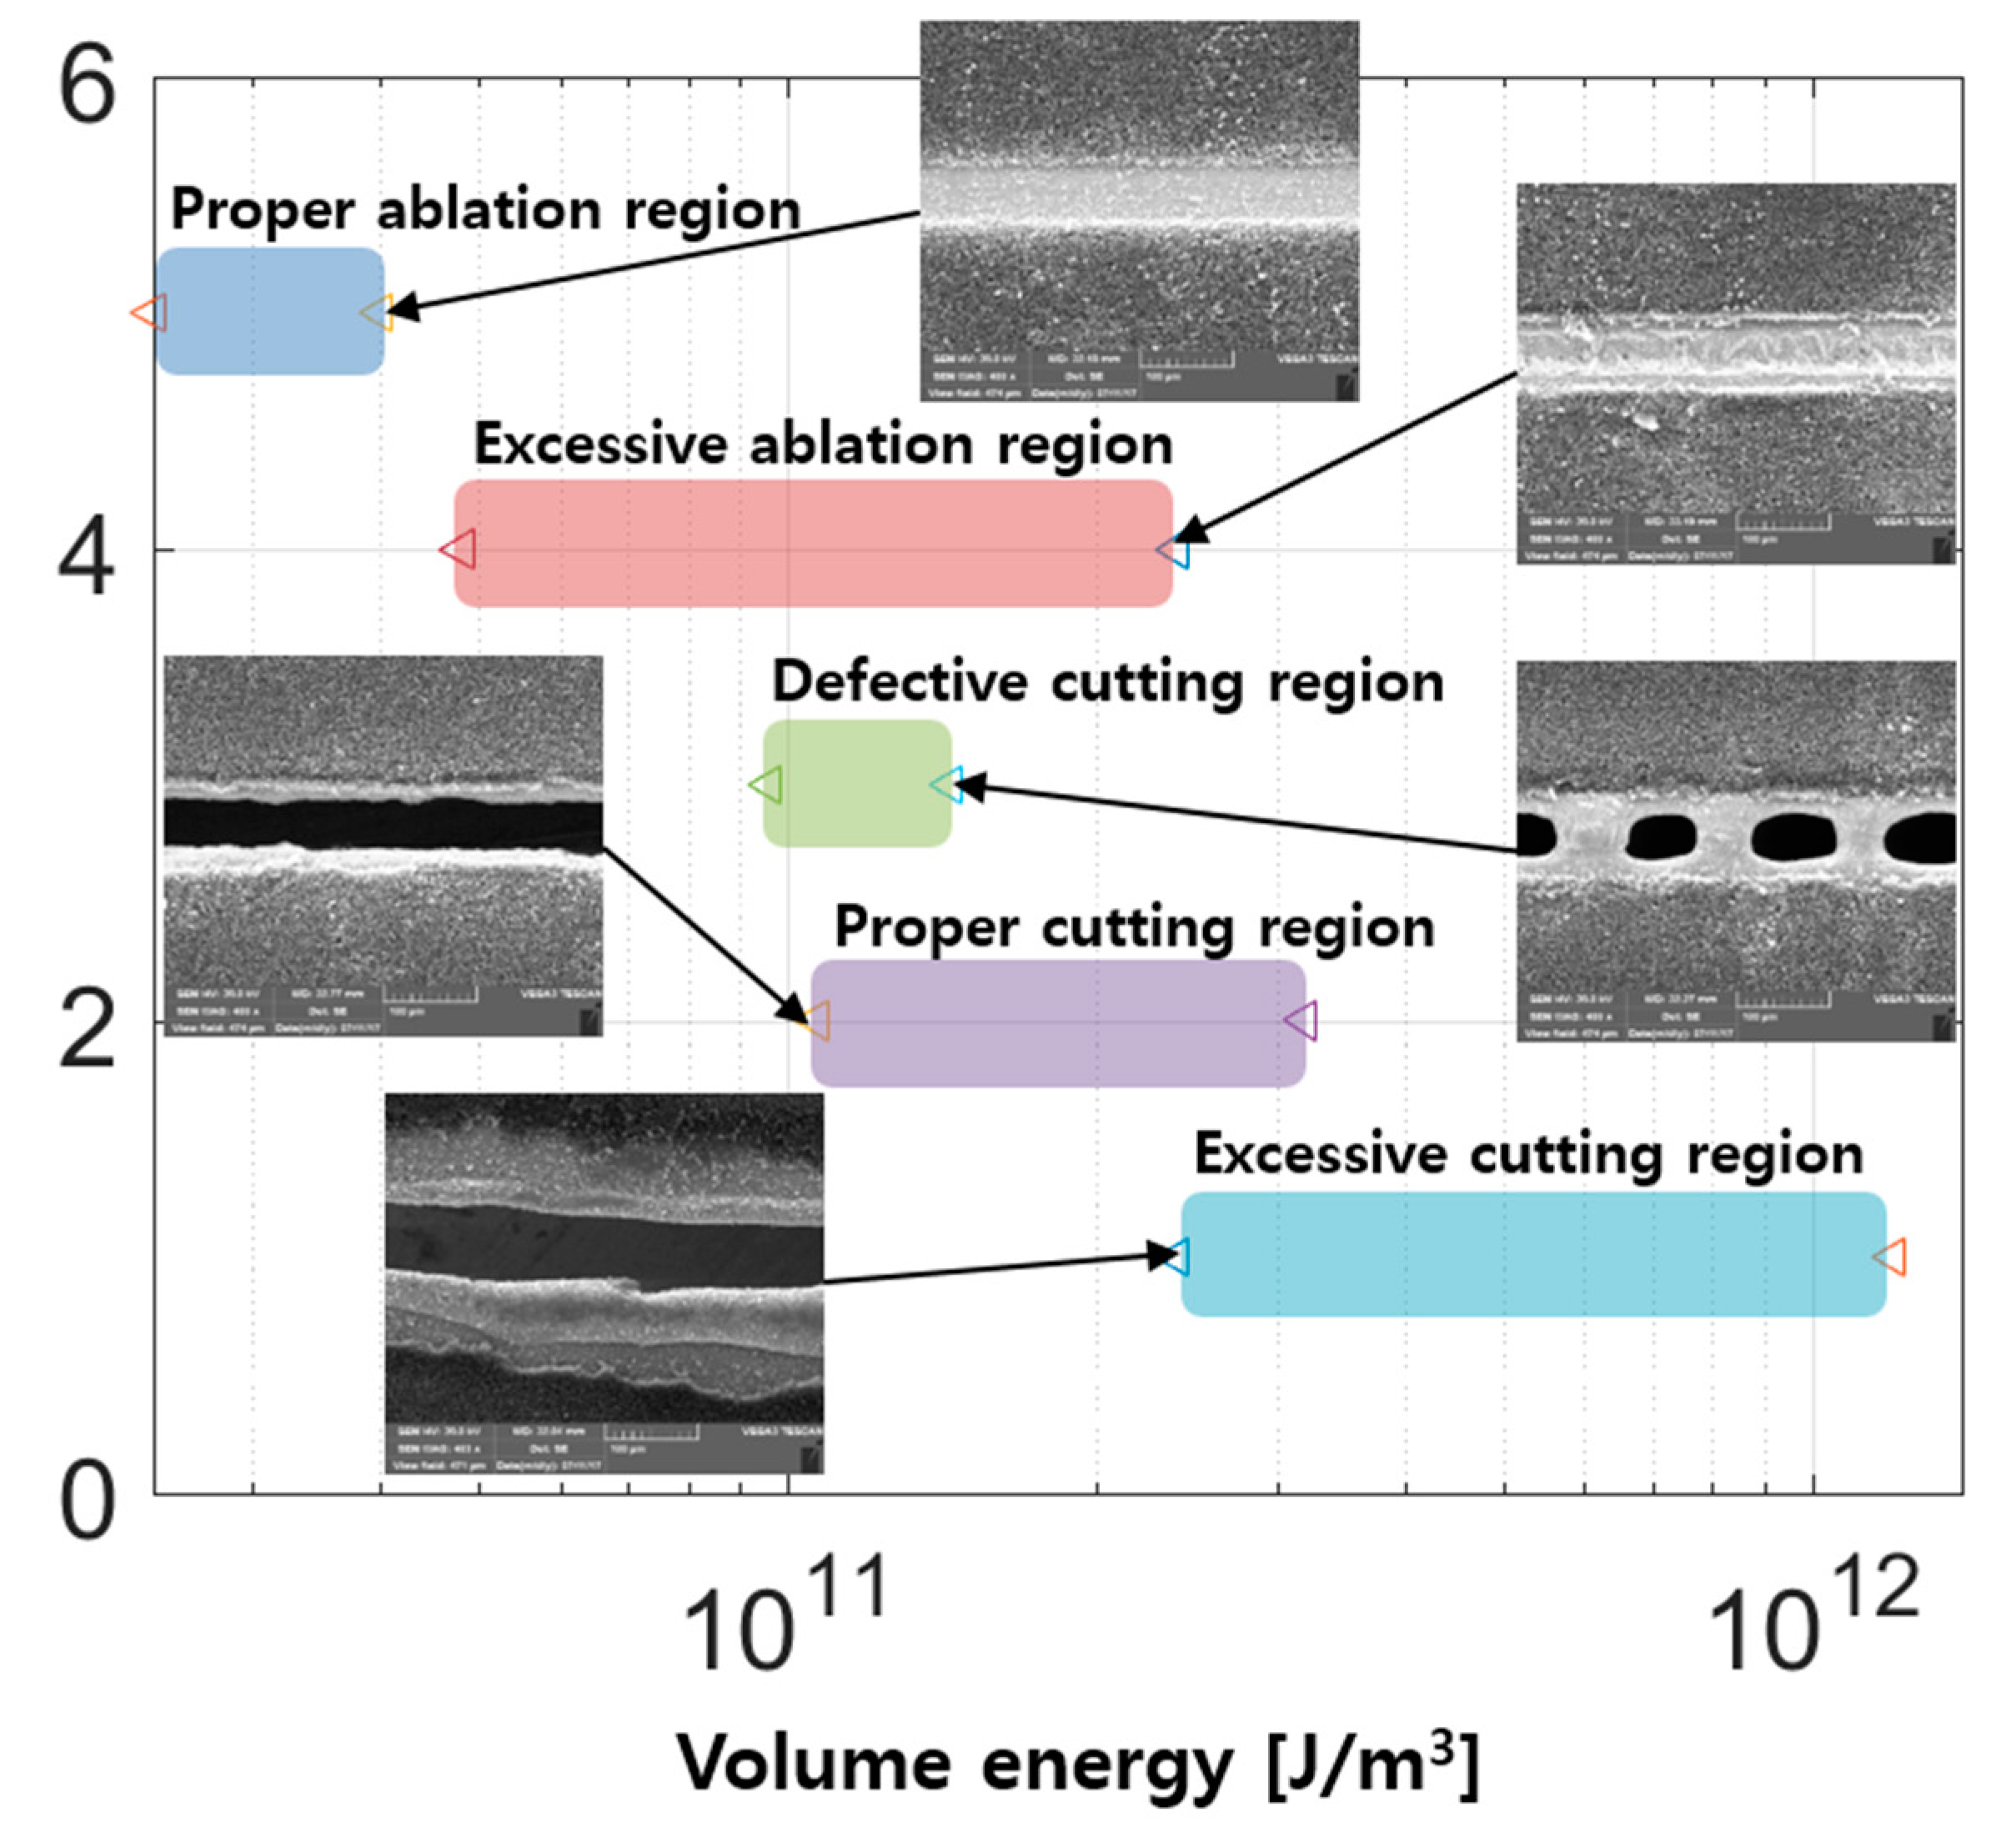
  • Laser cutting phenomena can be categorized in five regions: (1) excessive cutting, (2) proper cutting, (3) defective cutting, (4) excessive ablation, and (5) proper ablation.
  • These five regions are composed of a combination of multi-physical phenomena, such as the ablation of graphite, melting of copper, evaporation of copper, and explosive boiling of copper.
  • The top width varies in the order of 10 μ m and 1 μ m when applying high and low volume energy, respectively.
  • The melting width shows a logarithmic relationship with the volume laser energy, or W ¯ m e l t = 42.98 log ( E l i n e ) 1042.5 .

Author Contributions

D.L. conceived and designed the experiments; D.L. performed the experiments; D.L. analyzed the data; D.L. and J.S. contributed reagents/materials/analysis tools; D.L., and J.S. wrote the paper. All authors have read and agreed to the published version of the manuscript.

Funding

This research was funded by the National Research Foundation of Korea (NRF), Korean government (MSIP; Ministry of Science, ICT & Future Planning), grant number is No. 2019R1A2C1089644. And the APC was funded by the same fund.

Acknowledgments

The research described herein was sponsored by the National Research Foundation of Korea (NRF), a grant funded by the Korean government (MSIP; Ministry of Science, ICT & Future Planning; No. 2019R1A2C1089644), and the R&D Convergence Program of the National Research Council of Science and Technology (CAP-15-02-KBSI). The opinions expressed in this paper are those of the authors and do not necessarily reflect the views of the sponsors.

Conflicts of Interest

The authors declare no conflict of interest.

References

  1. Alamgir, M.; Sastry, A.M. Efficient Batteries for Transportation Applications. Available online: https://www.sae.org/publications/technical-papers/content/2008-21-0017/ (accessed on 20 October 2008).
  2. Nitta, N.; Wu, F.; Lee, J.T.; Yushin, G. Li-ion battery materials: Present and future. Mater. Today 2015, 18, 252–264. [Google Scholar] [CrossRef]
  3. Chen, J. Recent Progress in Advanced Materials for Lithium Ion Batteries. Materials 2013, 6, 156–183. [Google Scholar] [CrossRef] [PubMed]
  4. Ogihara, T.; Kodera, T. Synthesis of Li2Ti3O7 Anode Materials by Ultrasonic Spray Pyrolysis and Their Electrochemical Properties. Materials 2013, 6, 2285–2294. [Google Scholar] [CrossRef] [PubMed] [Green Version]
  5. Suk, J.; Kim, D.Y.; Kim, D.W.; Kang, Y. Electrodeposited 3D porous silicon/copper films with excellent stability and high rate performance for lithium-ion batteries. J. Mater. Chem. A 2014, 2, 2478. [Google Scholar] [CrossRef]
  6. Giuli, G.; Eisenmann, T.; Bresser, D.; Trapananti, A.; Asenbauer, J.; Mueller, F.; Passerini, S. Structural and Electrochemical Characterization of Zn1−xFexO—Effect of Aliovalent Doping on the Li+ Storage Mechanism. Materials 2017, 11, 49. [Google Scholar] [CrossRef] [PubMed] [Green Version]
  7. Yuan, G.; Xiang, J.; Jin, H.; Wu, L.; Jin, Y.; Zhao, Y. Anchoring ZnO Nanoparticles in Nitrogen-Doped Graphene Sheets as a High-Performance Anode Material for Lithium-Ion Batteries. Materials 2018, 11, 96. [Google Scholar] [CrossRef] [Green Version]
  8. Qiu, S.; Huang, J.; Chu, H.; Zou, Y.; Xiang, C.; Yan, E.; Xu, F.; Sun, L. The Co-B Amorphous Alloy: A High Capacity Anode Material for an Alkaline Rechargeable Battery. Metals 2016, 6, 269. [Google Scholar] [CrossRef] [Green Version]
  9. Wang, Z.; Zhang, X.; Zhang, Y.; Li, M.; Qin, C.; Bakenov, Z. Chemical Dealloying Synthesis of CuS Nanowire-on-Nanoplate Network as Anode Materials for Li-Ion Batteries. Metals 2018, 8, 252. [Google Scholar] [CrossRef] [Green Version]
  10. Suk, J.; Lee, Y.H.; Suk, J.; Kim, D.W.; Cho, S.Y.; Kim, J.M.; Kang, Y. Semi-interpenetrating solid polymer electrolyte based on thiol-ene cross-linker for all-solid-state lithium batteries. J. Power Sources 2016, 334, 154–161. [Google Scholar] [CrossRef]
  11. Lee, D.; Pyo, S. Experimental Investigation of Multi-mode Fiber Laser Cutting of Cement Mortar. Materials 2018, 11, 278. [Google Scholar] [CrossRef] [Green Version]
  12. Lee, D. Investigation of Laser Ablation on Acrylonitrile Butadiene Styrene Plastic Used for 3D Printing. J. Weld. Join. 2018, 36, 50–56. [Google Scholar] [CrossRef]
  13. Lee, D. Experimental Investigation of Laser Ablation Characteristics on Nickel-Coated Beryllium Copper. Metals 2018, 8, 211. [Google Scholar] [CrossRef] [Green Version]
  14. Lee, D. Experimental Investigation of Laser Spot Welding of Ni and Au-Sn-Ni Alloy. J. Weld. Join. 2017, 35, 1–5. [Google Scholar] [CrossRef]
  15. Lee, D.; Cho, J.; Kim, C.H.; Lee, S.H. Application of laser spot cutting on spring contact probe for semiconductor package inspection. Opt. Laser Technol. 2017, 97, 90–96. [Google Scholar] [CrossRef]
  16. Spena, P.R. CO2 Laser Cutting of Hot Stamping Boron Steel Sheets. Metals 2017, 7, 456. [Google Scholar] [CrossRef] [Green Version]
  17. Lee, D. Understanding of BeCu Interaction Characteristics with a Variation of ns Laser-Pulse Duration. Materials 2018, 11, 1423. [Google Scholar] [CrossRef] [Green Version]
  18. Lee, D.; Oh, B.; Suk, J. The Effect of Compactness on Laser Cutting of Cathode for Lithium-Ion Batteries Using Continuous Fiber Laser. Appl. Sci. 2019, 9, 205. [Google Scholar] [CrossRef] [Green Version]
  19. Lee, D. Picosecond IR Pulsed Laser Drilling of Copper-Coated Glass/Epoxy Composite. IEEE Trans. Compon. Packag. Manuf. Technol. 2017, 7, 2066–2072. [Google Scholar] [CrossRef]
  20. Lee, D.; Seo, Y.; Pyo, S. Effect of Laser Speed on Cutting Characteristics of Cement-Based Materials. Materials 2018, 11, 1055. [Google Scholar] [CrossRef] [Green Version]
  21. Lee, D. Investigation of Physical Phenomena and Cutting Efficiency for Laser Cutting on Anode for Li-Ion Batteries. Appl. Sci. 2018, 8, 266. [Google Scholar] [CrossRef] [Green Version]
  22. Lee, D.; Mazumder, J. Dataset demonstrating effects of momentum transfer on sizing of current collector for lithium-ion batteries during laser cutting. Data Brief 2017, 17, 6–14. [Google Scholar] [CrossRef] [PubMed]
  23. Lee, D.; Mazumder, J. Effects of momentum transfer on sizing of current collectors for lithium-ion batteries during laser cutting. Opt. Laser Technol. 2018, 99, 315–325. [Google Scholar] [CrossRef]
  24. Lee, D.; Ahn, S. Investigation of Laser Cutting Width of LiCoO2 Coated Aluminum for Lithium-Ion Batteries. Appl. Sci. 2017, 7, 914. [Google Scholar] [CrossRef] [Green Version]
  25. Lee, D.; Patwa, R.; Herfurth, H.; Mazumder, J. Three dimensional simulation of high speed remote laser cutting of cathode for lithium-ion batteries. J. Laser Appl. 2016, 28, 32010. [Google Scholar] [CrossRef]
  26. Lee, D.; Patwa, R.; Herfurth, H.; Mazumder, J. Parameter optimization for high speed remote laser cutting of electrodes for lithium-ion batteries. J. Laser Appl. 2016, 28, 22006. [Google Scholar] [CrossRef]
  27. Lee, D.; Mazumder, J. Effects of laser beam spatial distribution on laser-material interaction. J. Laser Appl. 2016, 28, 32003. [Google Scholar] [CrossRef]
  28. Lee, D.; Patwa, R.; Herfurth, H.; Mazumder, J. Computational and experimental studies of laser cutting of the current collectors for lithium-ion batteries. J. Power Sources 2012, 210, 327–338. [Google Scholar] [CrossRef]
  29. Lee, D.; Patwa, R.; Herfurth, H.; Mazumder, J. High speed remote laser cutting of electrodes for lithium-ion batteries: Anode. J. Power Sources 2013, 240, 368–380. [Google Scholar] [CrossRef]
  30. Lutey, A.H.A.; Fortunato, A.; Ascari, A.; Carmignato, S.; Leone, C. Laser cutting of lithium iron phosphate battery electrodes: Characterization of process efficiency and quality. Opt. Laser Technol. 2015, 65, 164–174. [Google Scholar] [CrossRef]
  31. Lutey, A.H.; Fortunato, A.; Carmignato, S.; Fiorini, M. High speed pulsed laser cutting ofLiCoO2Li-ion battery electrodes. Opt. Laser Technol. 2017, 94, 90–96. [Google Scholar] [CrossRef]
  32. Lee, D.; Mazumder, J. Modeling of High Speed Remote Laser Cutting of Electrodes for Lithium-Ion Batteries; University of Michigan: Ann Arbor, MI, USA, 2012. [Google Scholar]
  33. Mazumder, J.; Lee, D.; Tübke, J.; Pinkwart, K.; Herfurth, H.; Patwa, R. High Speed Laser Cutting of Electrodes for Lithium Ion Batteries. In Collaboration of the University of Michigan and Fraunhofer-Progress Report; University of Michigan: Ann Arbor, MI, USA, 2011. [Google Scholar]
  34. Lee, D. Modeling of High Speed Remote Laser Cutting for Lithium-Ion Batteries; Scholar’s Press: Kolkata, India, 2016. [Google Scholar]
  35. Zerlaut, G.A.; Anderson, T.E. Multiple-integrating sphere spectrophotometer for measuring absolute spectral reflectance and transmittance. Appl. Opt. 1981, 20, 3797. [Google Scholar] [CrossRef] [PubMed]
  36. Lavine, A.S.; Incropera, F.P.; DeWitt, D.P. Fundamentals of Heat and Mass Transfer, 7th ed.; Wiley: Hoboken, NJ, USA, 2011. [Google Scholar]
  37. Echániz, T.; Pérez-Sáez, R.B.; Tello, M.J. Optical properties of metals: Infrared emissivity in the anomalous skin effect spectral region. J. Appl. Phys. 2014, 116, 093508. [Google Scholar] [CrossRef]
  38. Echániz, T.; Setién-Fernández, I.; Pérez-Sáez, R.B.; Tello, M.J. Experimental verification of the anomalous skin effect in copper using emissivity measurements. Appl. Phys. Lett. 2013, 102, 244106. [Google Scholar] [CrossRef]
  39. Setién-Fernández, I.; Echániz, T.; González-Fernandez, L.; Pérez-Saez, R.; Tello, M. Spectral emissivity of copper and nickel in the mid-infrared range between 250 and 900 °C. Int. J. Heat Mass Transf. 2014, 71, 549–554. [Google Scholar] [CrossRef]
Figure 1. The definition of kerf width, top width, and melting width [17,18,24].
Energies 13 02630 g001
Figure 2. Reflectivity, transmissivity, and absorptivity measurement of (a) graphite and (b) copper.
Energies 13 02630 g002
Figure 3. SEM images for the reference anode, laser power: 250 W.
Energies 13 02630 g003
Figure 4. SEM images of the anode, laser power: 200 W.
Energies 13 02630 g004
Figure 5. SEM images of the anode, laser power: 150 W.
Energies 13 02630 g005
Figure 6. SEM images of the anode, laser power: 100 W.
Energies 13 02630 g006
Figure 7. SEM images of the anode, laser power: 50 W.
Energies 13 02630 g007
Figure 8. Characteristic regions vs. laser volume energy in the log scale.
Energies 13 02630 g008
Figure 9. (a) Top width vs. scanning speed, and (b) top width vs. volume energy.
Energies 13 02630 g009
Figure 10. (a) Melting width vs. scanning speed and (b) melting width vs. volume energy.
Energies 13 02630 g010
Figure 11. (a) Kerf width vs. scanning speed, and (b) kerf width vs. volume energy.
Energies 13 02630 g011

