Article

Cost–Benefit Analysis of a Virtual Power Plant Including Solar PV, Flow Battery, Heat Pump, and Demand Management: A Western Australian Case Study

1
Discipline of Engineering and Energy, Murdoch University, Murdoch 6150, Australia
2
Yaran Property Group, South Perth 6151, Australia
*
Author to whom correspondence should be addressed.
Energies 2020, 13(10), 2614; https://doi.org/10.3390/en13102614
Submission received: 26 April 2020 / Revised: 18 May 2020 / Accepted: 20 May 2020 / Published: 21 May 2020
(This article belongs to the Section A2: Solar Energy and Photovoltaic Systems)

Abstract

:
Achieving the renewable energy integration target will require the extensive engagement of consumers and the private sector in investment and operation of renewable-based energy systems. Virtual power plants are an efficient way to implement this engagement. In this paper, the detailed costs and benefits of implementing a realistic virtual power plant (VPP) in Western Australia, comprising 67 dwellings, are calculated. The VPP is designed to integrate and coordinate rooftop solar photovoltaic panels (PV), vanadium redox flow batteries (VRFB), heat pump hot water systems (HWSs), and demand management mechanisms. An 810-kW rooftop solar PV system is designed and located using the HelioScope software. The charging and the discharging of a 700-kWh VRFB are scheduled for everyday use over a year using an optimization algorithm, to maximize the benefit of it for the VPP owners and for the residents. The use of heat pump HWSs provides a unique opportunity for the residents to save energy and reduce the total cost of electricity along with demand management on some appliances. The cost-and-benefit analysis shows that the cost of energy will be reduced by 24% per dwelling in the context of the VPP. Moreover, the internal rate of return for the VPP owner is at least 11% with a payback period of about 8.5 years, which is a promising financial outcome.

1. Introduction

The integration of renewable energy resources into energy systems is one of the aims of nations to reduce their carbon footprint and improve the sustainability of energy delivery. Therefore, some renewable energy targets are defined to enhance the speed of this integration. For example, in Australia, the contribution of renewables to electricity generation by 2020 is set as 23.5%, which is already achieved [1]. To this aim, the governments try to encourage investors and end-users to invest and use renewable resources such as solar and wind as their source of energy. In Australia, there are two schemes, which are the Large-Scale Renewable Energy Target (LRET) for high-energy users and the Small-Scale Renewable Energy Scheme (SRES) for incentivizing individuals to install more renewable-based systems such as photovoltaics (PV) and heat pumps [2]. Considering the variability of renewable resources, the integration of a high level of green resources into the grids is very challenging in order to satisfy the technical and security requirement of the grids.
Energy aggregators such as virtual power plants (VPPs) can play a fundamental role in encouraging consumers to participate in investment and operation of renewable energy systems.
VPPs are normally defined as a coordinated combination of different kinds of energy sources and flexible load demands. These resources include PV, wind, solar thermal/storage, electric vehicles, and different types of electricity storage such as batteries, fuel cells, and capacitors, along with some demand response capabilities, which are all monitored and controlled by an advanced information and communications technology (ICT) platform [3]. VPPs can create a platform that incentivizes the use of renewable energies by reducing the cost of energy delivery to them and by facilitating the use of controllable appliances to facilitate demand response. In addition, VPPs are able to fill the information and technology gap in the electricity market and utilities for better incorporating the end-user participants into the wholesale market and addressing technical issues in the network. VPPs can contribute to demand shaping and reducing the peak load, security, and frequency control, in addition to local power quality improvement [4]. Therefore, a VPP demonstration was established in Australia from 2019 via the collaboration of the Australian Energy Market Operator (AEMO), the Australian Renewable Energy Agency (ARENA), the Australian Energy Market Commission (AEMC), and the Australian Energy Regulator (AER) to investigate the capabilities and effectiveness of VPPs in different ways with a forecast of total installed VPP capacity of 700 MW by 2022 [5].
VPPs can help to reduce energy consumption by encouraging the use of highly efficient appliances as discussed in Reference [6], which showed a saving of 273 GWh per year for a VPP with the capacity of 63 MW. Although a proper modeling of energy efficiency for VPPs is provided in this reference, demand shifting, battery, and heat pumps are not considered. The Next Kraftwerke is another platform for VPP for facilitating the aggregation of customers and coordinating the available flexibilities in demand [7]. Every consumer can join this VPP regardless of its location on the network; however, there are some limitations on the benefits generated by the whole VPP. However, a detailed modeling of how this system can benefit both the owner and the consumers is not presented for this platform. The community-based VPP is also discussed and explored in Reference [8] with practical cases in Ireland, Belgium, and the Netherlands. This research identified four key components of VPP which are the community, the community operation rules, the portfolio of aggregated energy resources, and the coordinated roles of community members. This research focuses on the concept of a VPP, and no detailed formulation on expenses and benefits for consumers and the VPP is provided. Moreover, a commercial VPP was studied in Scotland, and the resource management in relation to the market price was scheduled, demonstrating an increase of 12% in VPP profit compared to the operation of a renewable plant without the establishment of a VPP [9]. This research only addresses a commercial VPP not a residential one, without modeling the use of heat pumps, battery, and demand management. In Reference [10], a study was conducted to provide a quantification for the economic, environmental, and social benefits of a microgrid using the economic metrics of a society, such as gross domestic product (GDP) per capita, unemployment rate, etc. However, a framework to evaluate the affordability of a microgrid or VPP business is presented. A model of a VPP based on the electro-economical concept was proposed to integrate the dynamics of different players in a VPP in the short term [11], but it has a limitation for the long-term cost-and-benefit analysis of the VPP. Furthermore, there is some literature focusing on the economics of VPPs using Homer software [12]; however, these studies did not consider any connection to the wholesale electricity market as, generally, the corresponding VPPs were islanded microgrids.
Deferrable loads, including air conditioners and heat pumps, can provide some flexibilities in VPPs; for example, a commercial building with about 46% of such flexible loads was investigated to use this capability in a demand response (DR) event while keeping the comfort level of people within the standard levels [13]. This demand response from a VPP can greatly contribute to peak load shaving and, therefore, reduce the capital investment in pole and wire distribution networks [14]. Furthermore, a techno-economic analysis of a VPP for a university campus was investigated in Reference [15], and different avenues of revenue and flexibility were discussed, showing a positive business case for VPPs in urban areas. Although a suitable formulation of revenues for a VPP which interacts with the electricity market is presented in that research, no detailed analysis and formulation is provided for the residential consumers and how the VPP can benefit them. Moreover, the economic evaluation of VPPs in the German energy market shows that the VPP’s revenue can increase by 11% to 30% by 2030 when they are engaged in the electricity market [16]. However, the role of technologies, such as flow batteries and heat pumps, are not discussed in that paper. It was also shown that a high number of renewable-based VPPs can contribute actively to the prices in the electricity market; thus, VPPs can play a critical role in future energy delivery systems [17]. Moreover, the impact of VPPs was analyzed in Spain with the aim of maximization of self-supply and revenue from the market, showing that VPPs can greatly contribute to electricity grid and VPP operation [18]. However, in this work also, no detailed cost-and-benefit analysis is provided for the consumers. The aggregation of 25 micro combined heat and power devices (mCHP) within a VPP was investigated in Reference [19] for Germany, which shows the effectiveness of this technology for cold-weather regions, but no assessment of the market-related costs and revenues is provided.
Although there is some literature on the economics of VPPs, there is a lack of detailed analysis of costs and benefits of VPP, which is specific to the situation of a country. This paper provides a detailed quantification of a realistic VPP, comprising 67 residential dwellings, under construction in Western Australia (WA). To the best of the authors’ knowledge, there is no other work that provides such a study, which is very critical for growing VPP businesses. Specifically, the contributions of this paper are as follows:
  • Developing an affordable concept design for residential VPPs, which include a rooftop solar farm, flow battery, heat pump hot water systems, and demand management.
  • Providing a detailed model for the expenses associated with the deployment of a VPP in WA, including the expenses pertaining to the wholesale electricity market and to the capital expenditure.
  • Developing a detailed model for the revenues of a VPP in WA, including the revenues obtained by selling electricity to the wholesale electricity market and to the residents of the VPP.
  • Developing an effective system for controlling battery, heat pumps, and residential demands in order to optimize the benefits for both the VPP owner and the residents.
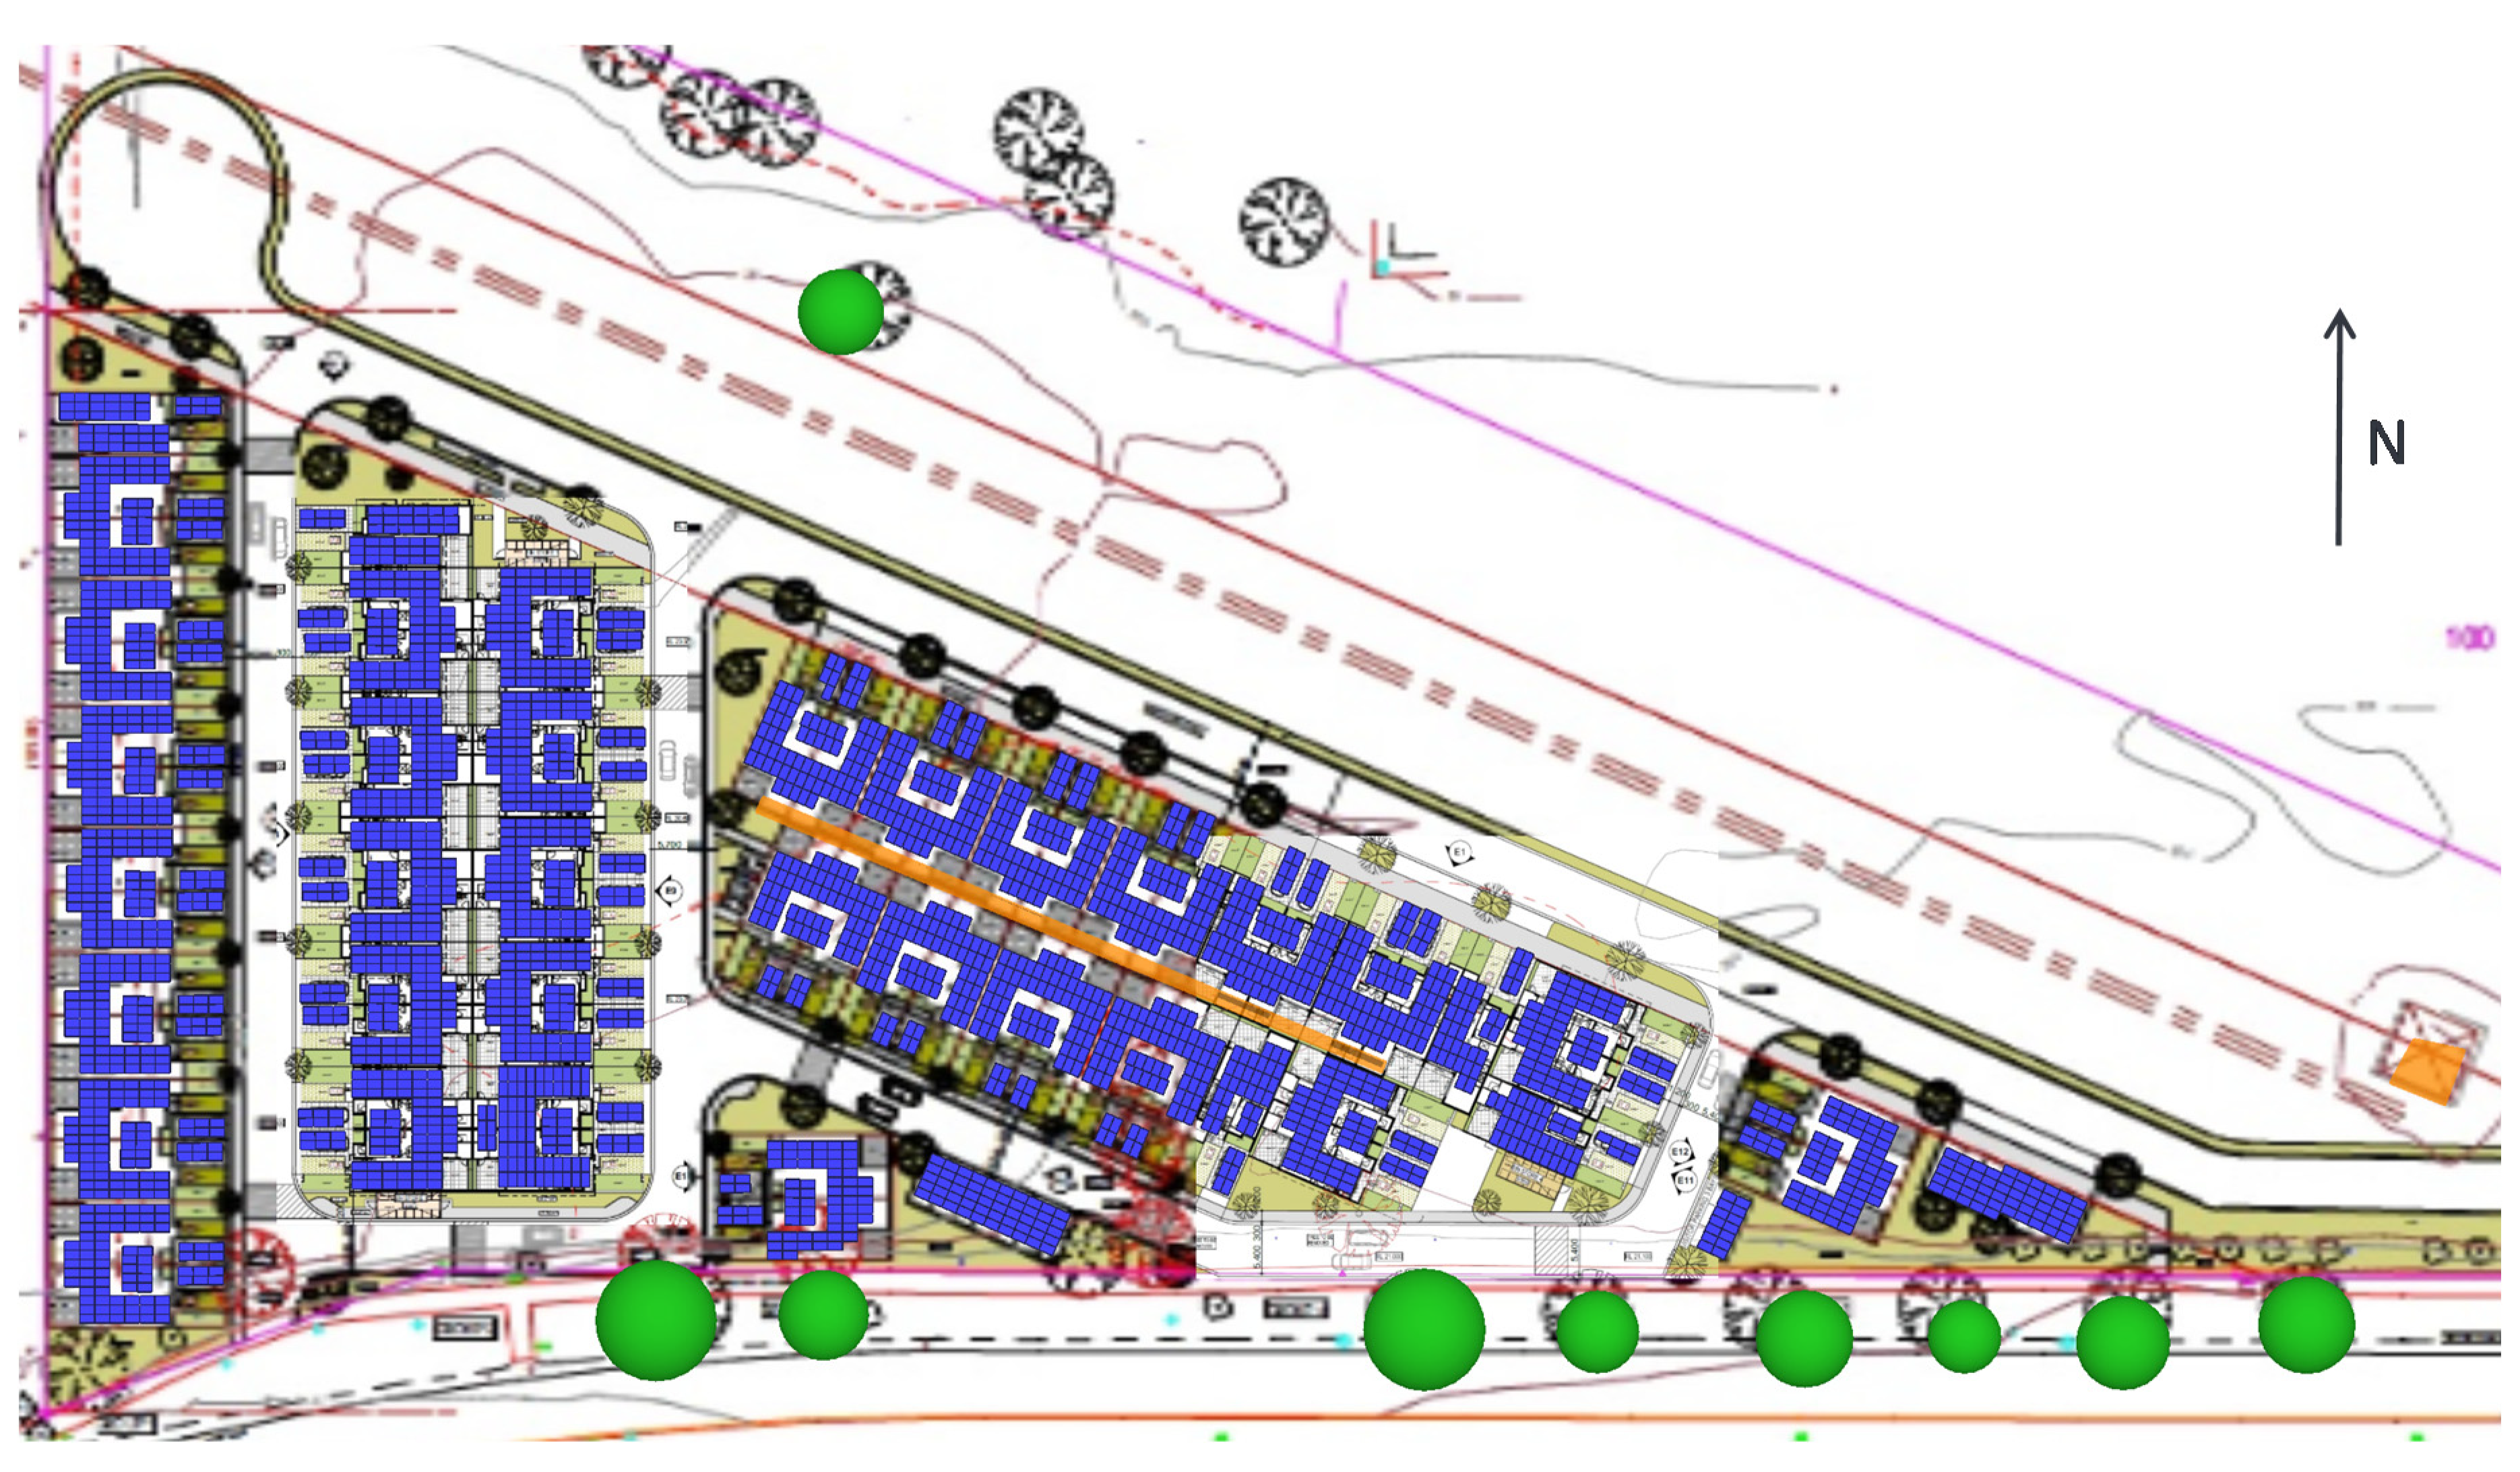
  • Investigating and modeling the economics of a real-world VPP comprising 67 residential dwellings in WA including all of the above-mentioned aspects for a VPP.
  • Providing recommendations for VPP businesses and policy-makers under similar market and economic situations.
The paper is organized as follows: Section 2 provides the architecture of the proposed VPP in WA. Section 3 presents the load modeling within the VPP. Section 4 discusses the methodology for the detailed formulation of expenses and revenues for the VPP. The battery and demand management algorithms are discussed in Section 5. Section 6 presents the required input parameters and assumptions for the simulation. The simulation results are provided in Section 7. All of the conclusions are summarized in Section 8.

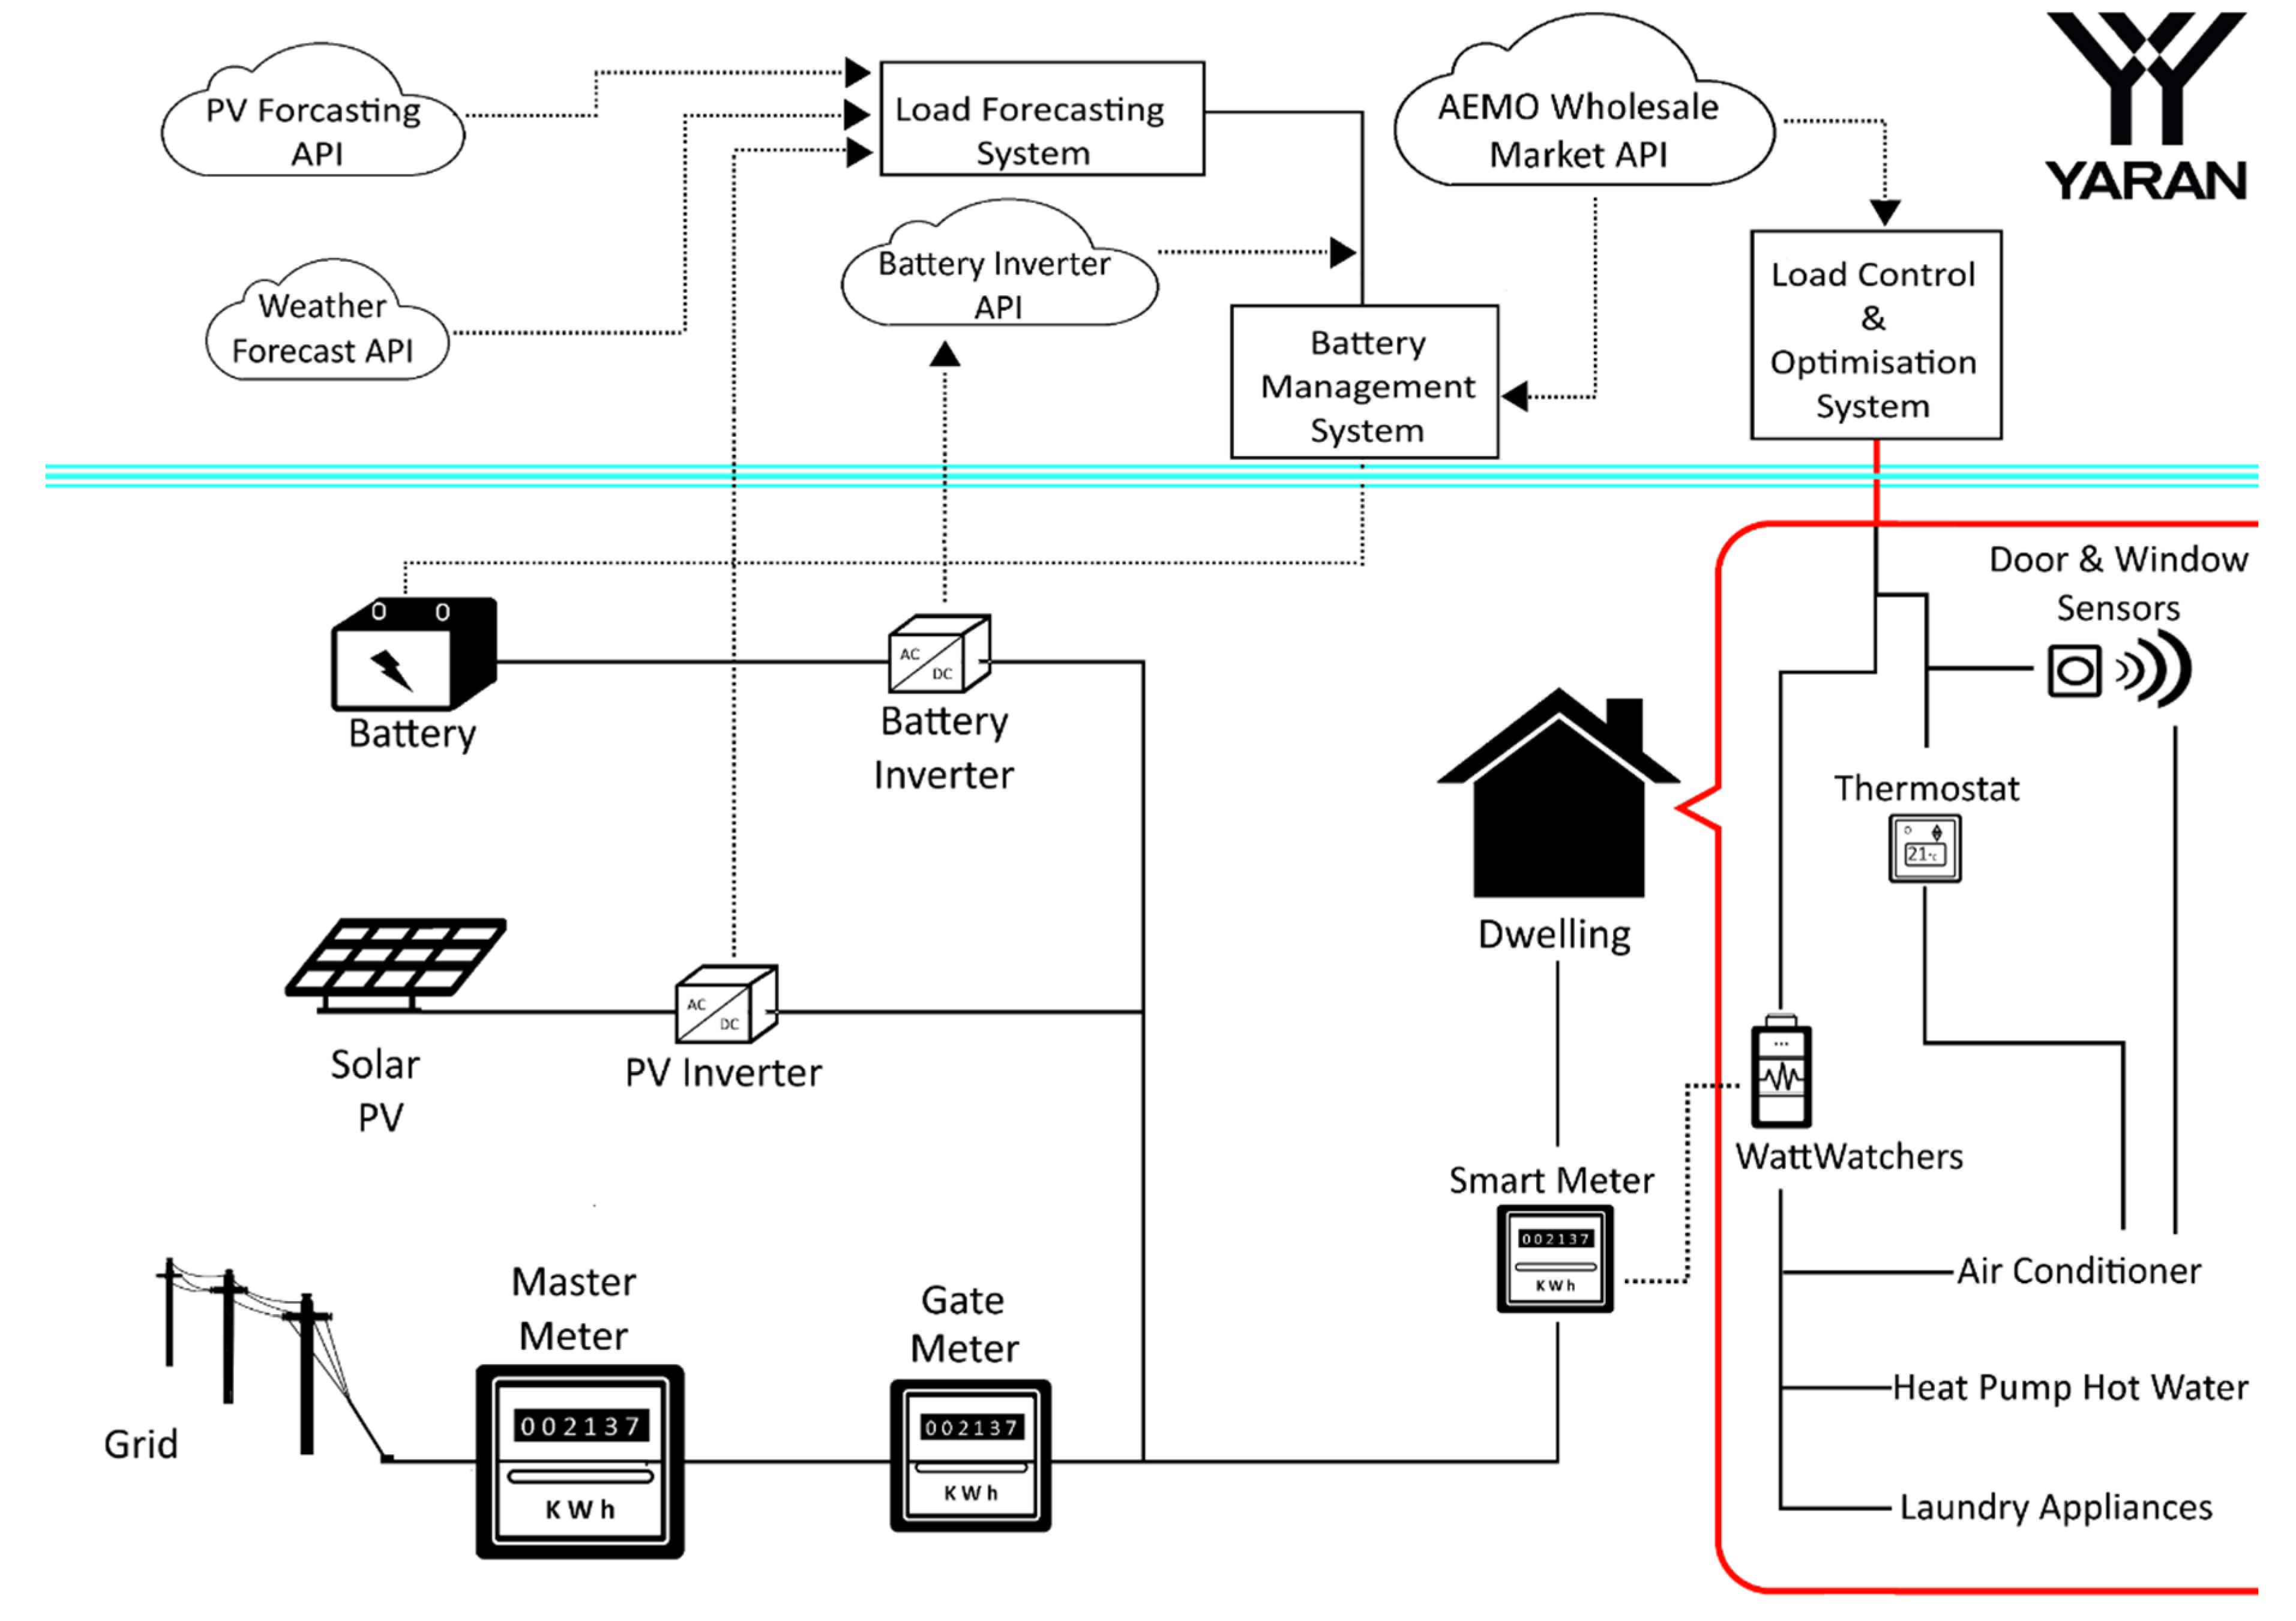
2. The Proposed Architecture of the VPP

The proposed VPP comprises 67 residential dwellings in WA, with a rooftop PV farm, smart appliances, and heat pump hot water. A centralized vanadium redox flow battery (VRFB) is also installed in the VPP in order to store energy during high PV generation and low electricity market prices. Smart appliances for each home include a dishwasher, dryer, washing machine, and heat pump, which can be controlled and shifted to a planned time. There is no gas in the complex, and all appliances are electric. For each home, there is also a monitoring system that measures electrical parameters of different circuits within that home. These monitoring systems collect and store data on consumptions in the cloud. These data are available to the operator of the VPP, as well as to the external regulators through an application programming interface (API), which is a scalable and flexible ICT configuration for VPPs [20]. The VPP control system that decides on the load, PV, and battery control is also located on the cloud, which has access to PV forecasting, the AEMO wholesale market, and the weather forecast application programming interfaces (APIs). The control system manages this complex as a VPP through the proposed cloud-based data system, aggregating different energy resources to minimize the cost of electricity for residences.
Figure 1 shows the architecture of the proposed VPP in WA. As part of the Future Market Design within the work stream of the Energy Transformation Strategy, the aggregators can be registered as a VPP in WA. The framework and requirement of registration and participation in the wholesale electricity market (WEM) are also established [21].

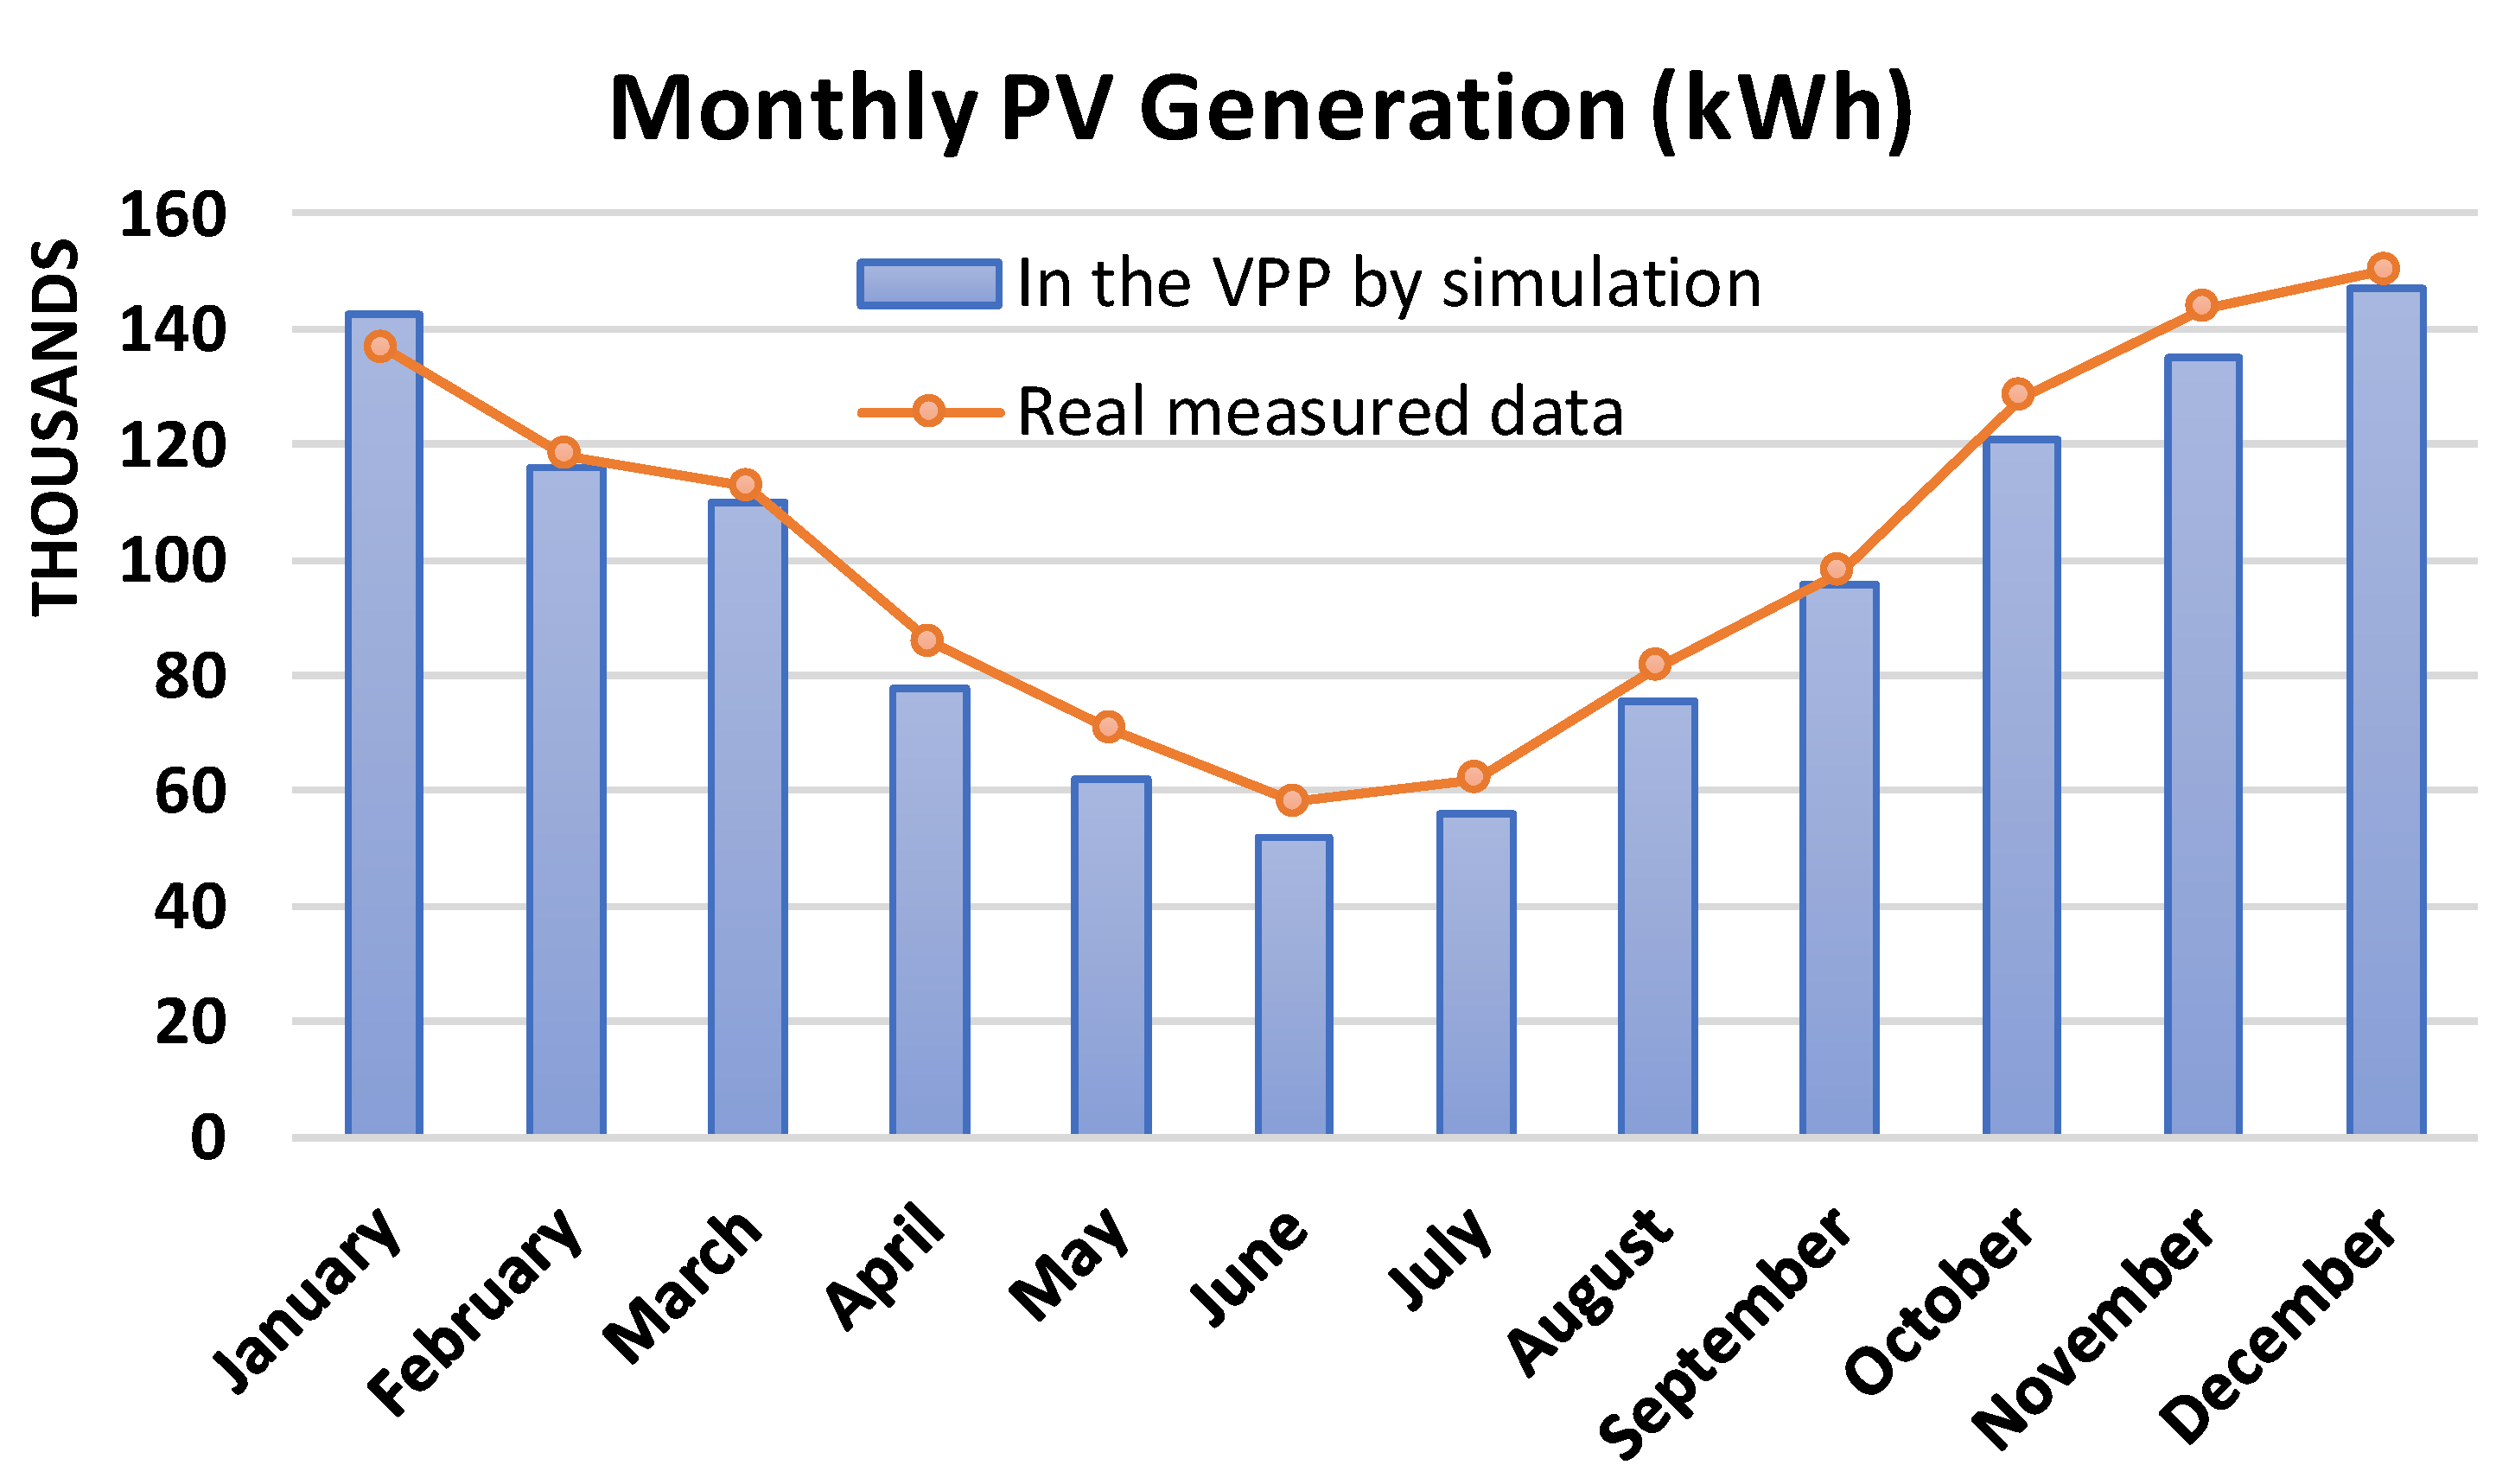
2.1. Rooftop Solar Farm

In order to be a carbon-negative development, the maximum rooftop solar PV is considered to be installed, which is in alignment with the benefit maximization of the VPP. The maximum rooftop installation is calculated using the HelioScope software. The simulation shows that approximately 810-kW capacity of PV can be installed on the rooftop of the dwellings and carports, which is about one 12-kW PV system per each premise. In this design, the roof pitching is also considered to maximize PV production and minimize the shading loss. The location of PV systems for the whole complex from the simulation results by HelioScope is provided in Figure 2. The total PV generation during a year within the VPP is 1,190,689 kWh, with the most monthly generation during summer and spring months, for example, in November, December, and January, as shown in Figure 3. In order to validate the PV generation simulation by HelioScope, the real PV output data measured from the two nearest available sites [22] to the VPP in WA were averaged as shown in Figure 3. As can be seen, the simulation of PV generation is very close to the real data but a bit less than real data in most months. The difference is mainly due to the orientation of dwellings in the VPP, whereby not all of PV panels are oriented in the optimal direction to maximize the PV output.
The PV system of the complex is designed as a fully embedded network, whereby energy generated by any of the houses’ PV systems can be used by all dwellings within the development. Furthermore, the VPP operator can decide on charging the battery using excess PV generation or exporting energy to the WEM depending on the situation and the electricity price.

2.2. Vanadium Redox Flow Battery (VRFB)

The use of energy storage will improve the integration of renewable energy as it provides an opportunity for storing the energy and exporting when needed [23]. VRFB is an electrochemical energy storage which is based on a reversible chemical reaction within a sealed electrolyte, in which energy is stored in a liquid vanadium electrolyte, a mixture of distilled water, vanadium salts, and sulfuric acid [24]. The liquid that carries energy will be pumped between two tanks through electrochemical cells. The larger tanks are able to store more energy, and they are organized in cells and cell stacks within the VRFB. The energy is charged or discharged in the electrolyte based on the level of applied voltage.
The VRFB has favorable specifications such as long lifetime, e.g., 20,000 cycles, at a reasonable price and fast charging and discharging capabilities that help contribute to grid security and reliability [25,26]. At the end of a VRFB’s nominal lifetime, it is just required to replace the liquid instead of replacing the whole battery system, which is another advantage of this battery compared to lithium-ion or lead–acid batteries. Moreover, the energy and power of the installed VRFB is scalable independently, which is usually not the case for the other types of batteries. Furthermore, the electrolyte is not explosive or flammable, and it can be recycled easily at the end of its lifetime. VRFB can achieve 100% charge level with negligible self-discharge inside the battery, which is a limitation for most Li-ion or lead–acid batteries. Moreover, the life cycle of VRFBs is more environmentally friendly than that of Li-ion or lead–acid batteries, as 100% recycling of vanadium electrolyte can be achieved while there are severe environmental impacts for the lead and lithium technologies [27]. Another advantage of VRFB over other types of battery is very low degradation; thus, it is possible to maintain the same capacity as the original capacity. In addition, the VRFB is also more affordable for a longer duration of storage than Li-ion or lead–acid batteries [27]. Considering all the benefits and specifically the longer lifetime of VRFB, (e.g., 20 years or equivalent cycles, compared to other types of lithium- or nickel-based batteries or lead–acid batteries, with normally 10 to 15 years), the manufacturers can provide a longer-term warranty for VRFBs, which is very important for the economic feasibility of the VPP.
Therefore, VRFB was chosen for electricity storage in this project. The size of VRFB in the VPP, considering the available budget, was chosen to be 700 kWh, 350 kW.

2.3. Heat Pump Hot Water System
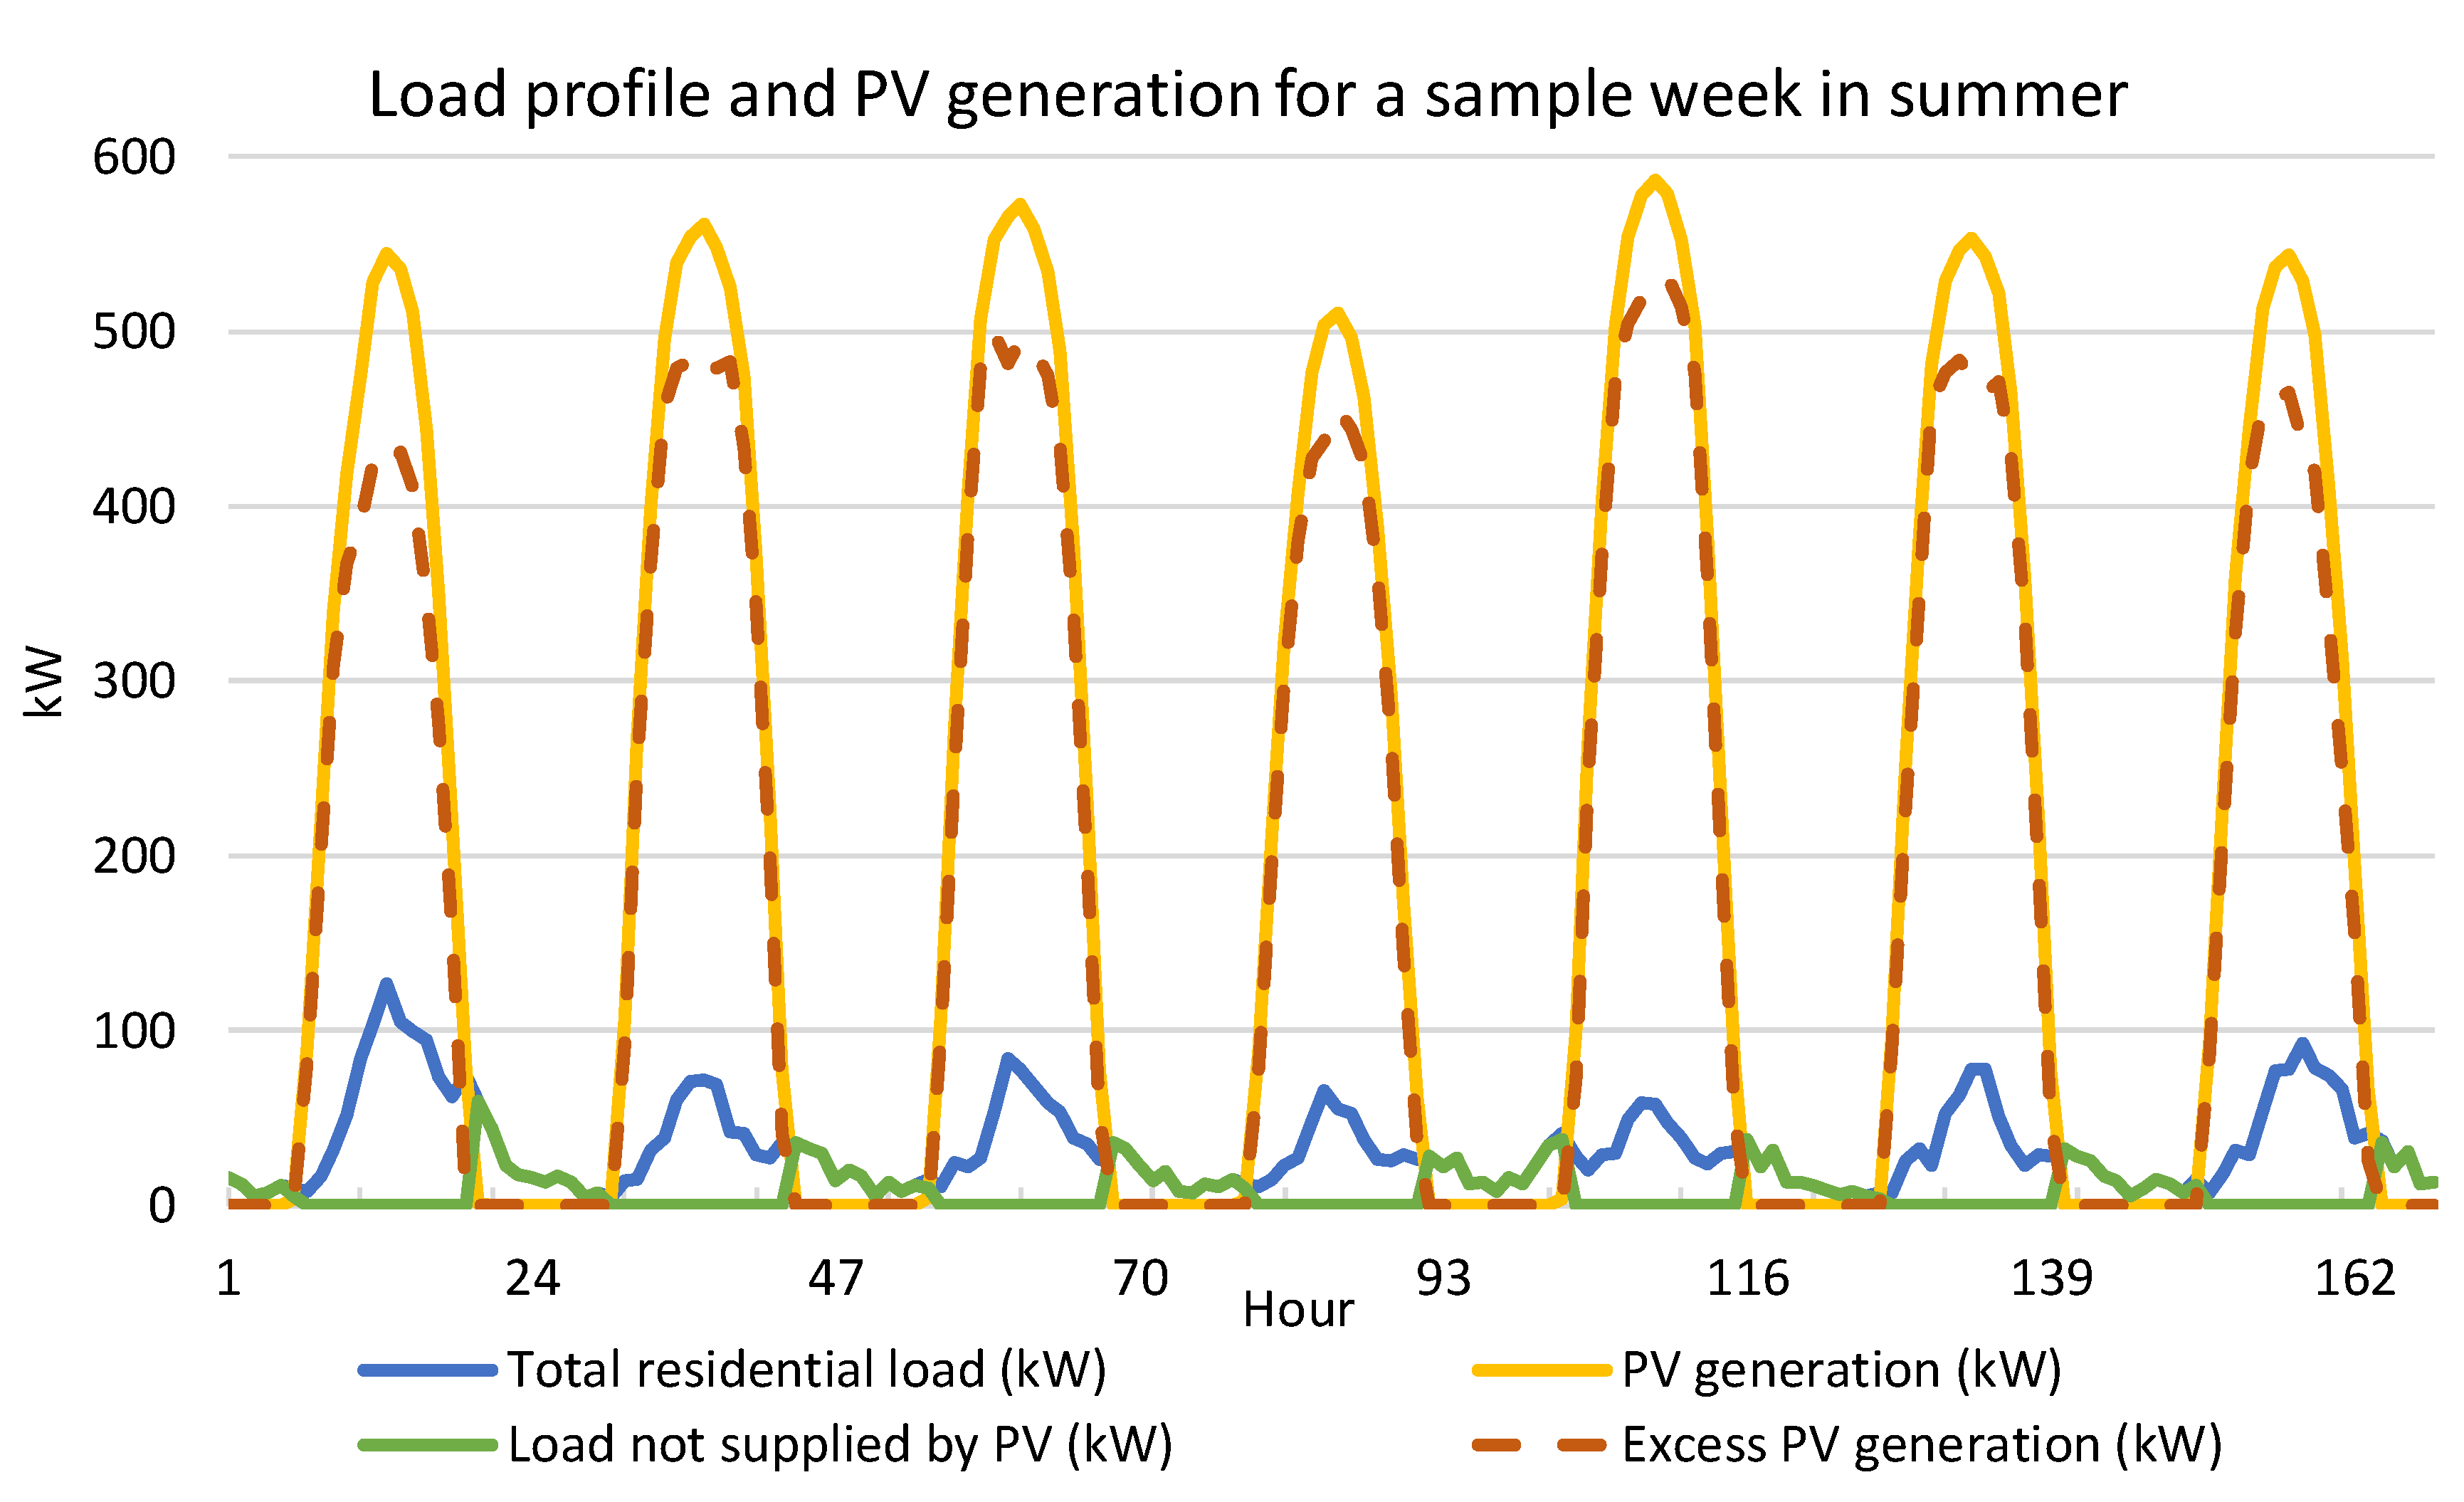
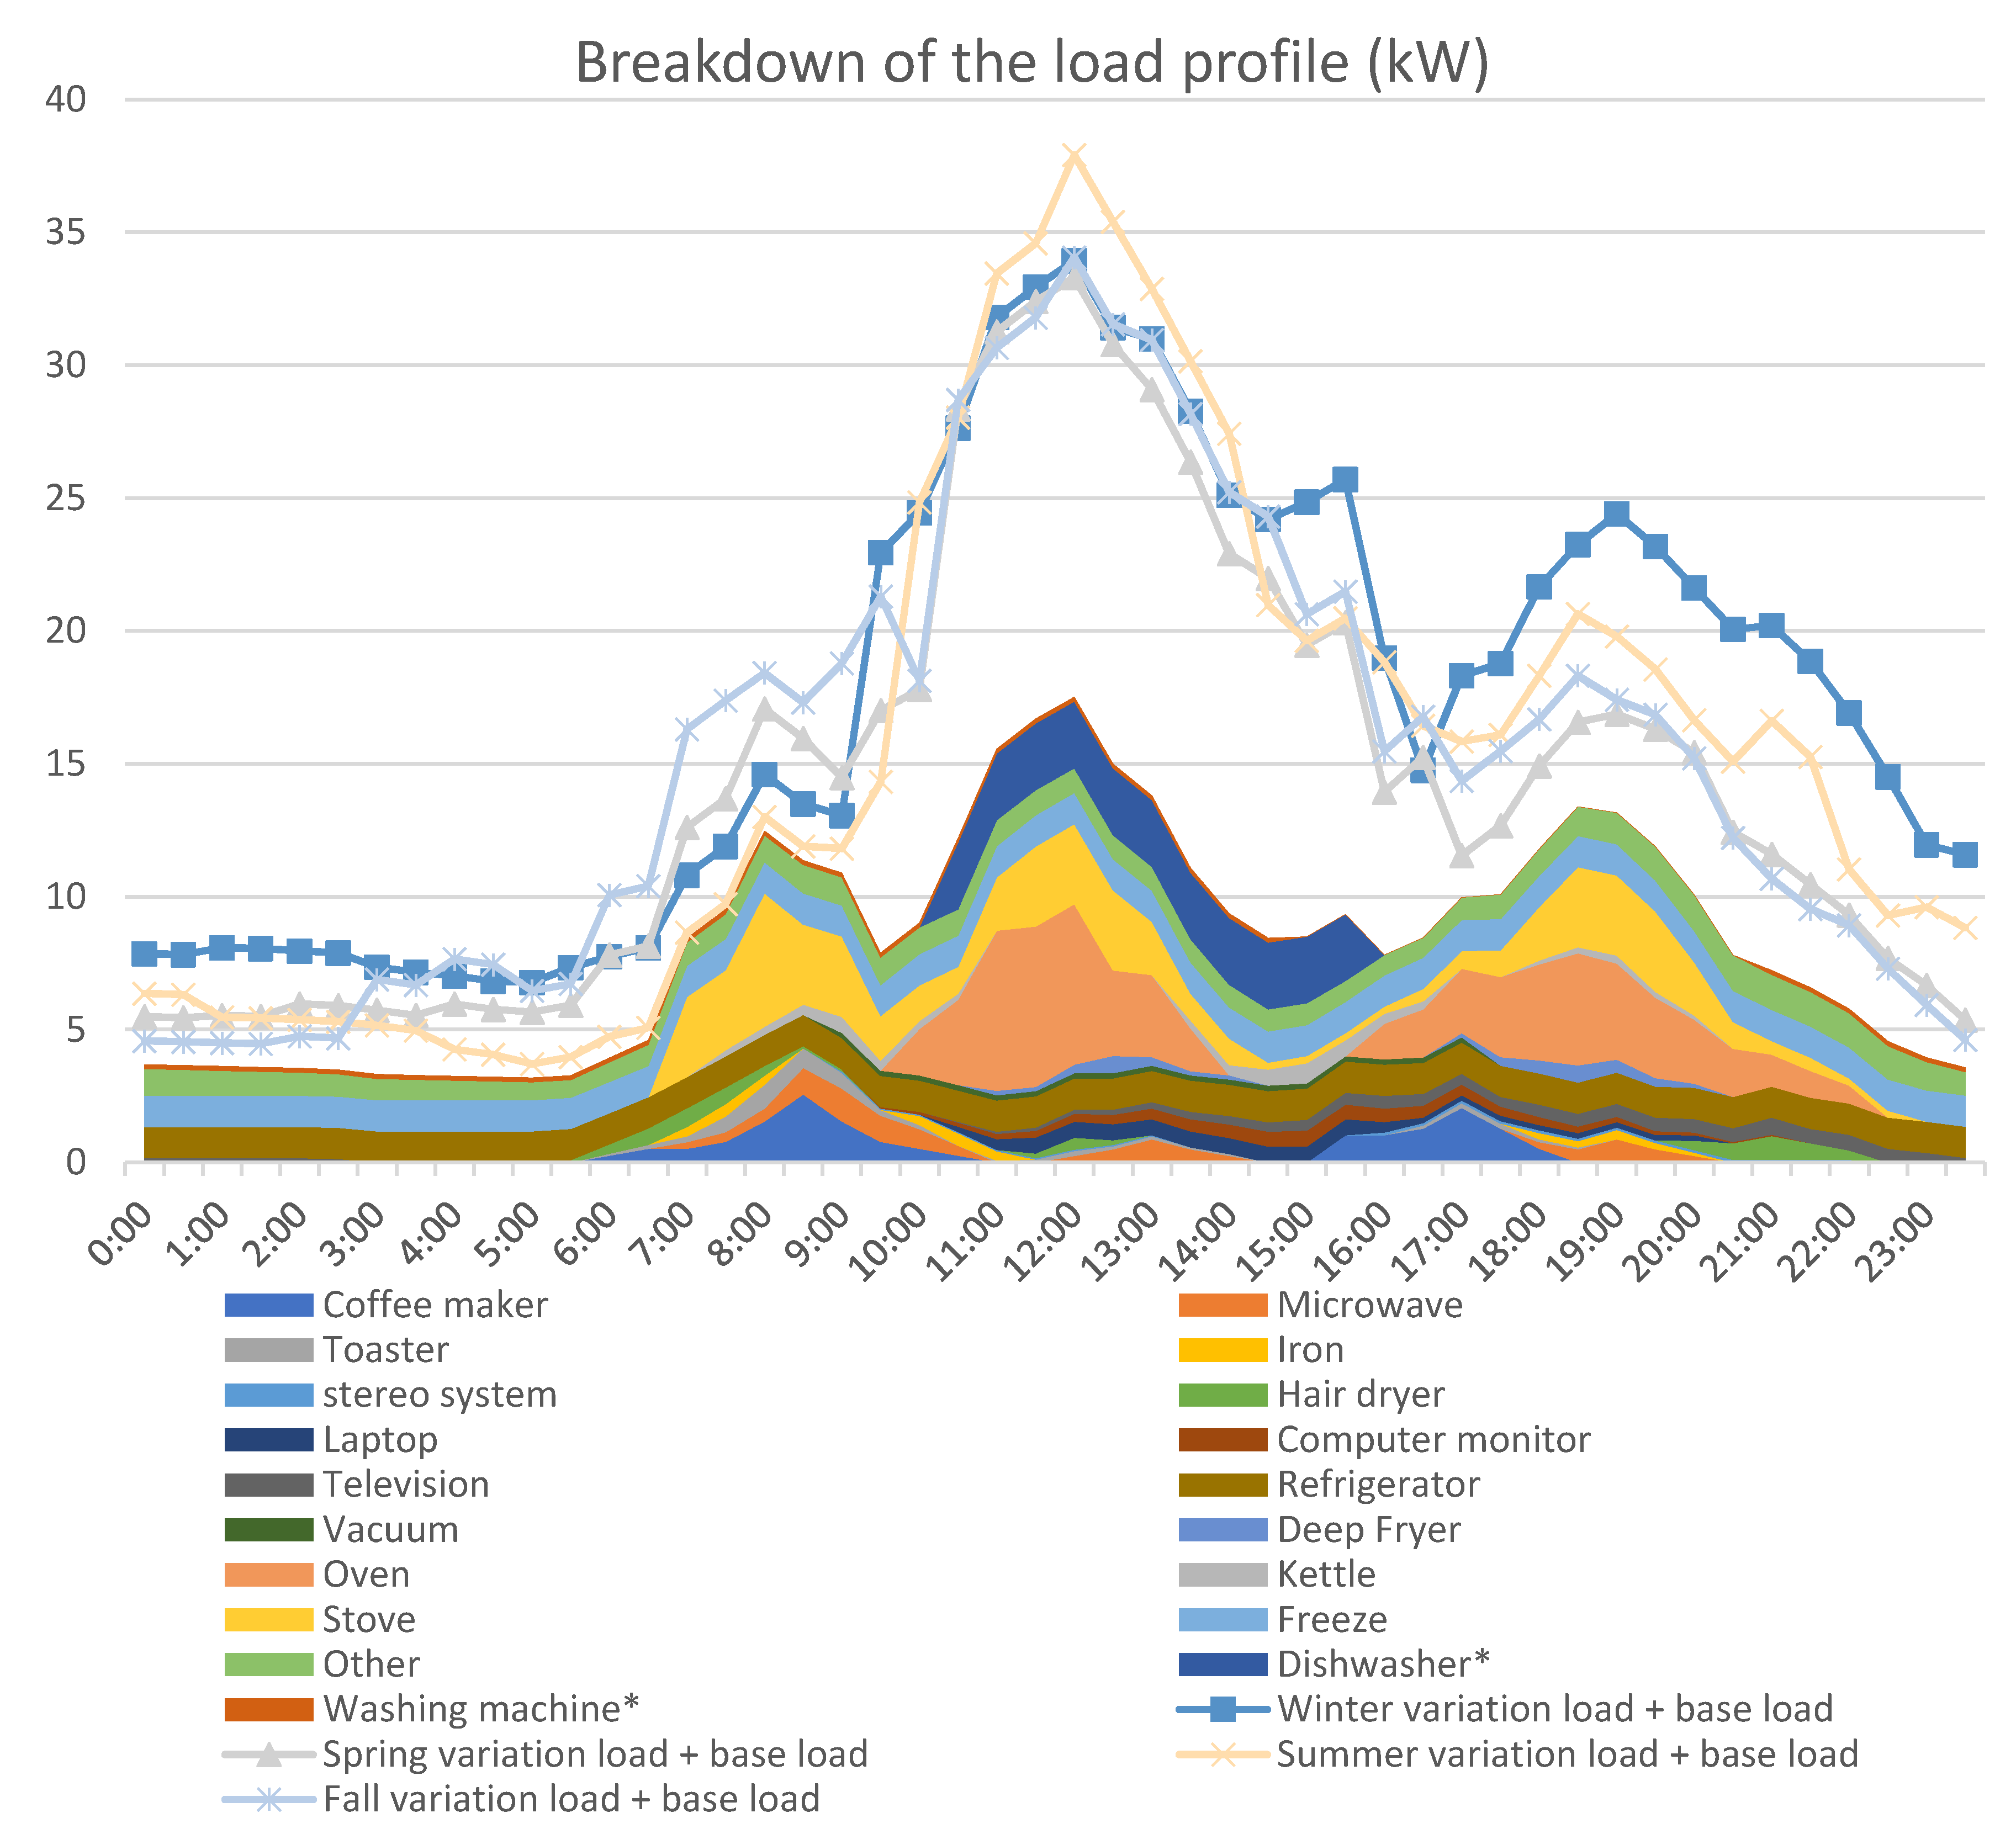
A heat pump hot water system (HWS) can transfer heat from air, water, or underground to the water stored in its tank. The heat available in the outdoor air is extracted by a heat exchanger/evaporator and transferred to a refrigerant [28]. Then, using a compressor, the temperature of the refrigerant is increased for heating up the water in the tank. The compressor does not consume a lot of energy; thus, using one unit of consumed electrical energy, it is possible to transfer up to five units of environmental energy for heating purposes. Therefore, compared to other technologies of hot water such as electric or gas HWS with storage or instant option, a heat pump provides better energy efficiency [29]. Additionally, investment on both electricity and thermal storage can reduce the total life cycle cost of energy delivery significantly, for example, by 40% [30].
The suitable control of the heat pump in conjunction with the PV generation will bring benefits to the VPP in terms of energy efficiency, energy cost reduction for consumers, and interaction with electricity grids [31,32]. The use of heat pumps for storing energy at the lower electricity price in the electricity market also shows another benefit of this technology for the VPP [33]. Considering the benefits of heat pump HWS for the VPP operator and for the residence, in this project, a heat pump is provided for each dwelling. A size of 220 L was selected for each HWS after considering the average usage of hot water in the area [34]. This system can generate an average heating output of 1.6 kW at the ambient temperature between −5 and 42 °C, while the electricity consumption of the unit is only 0.55 kW.

3. Load Modeling

This section provides the load modeling of 67 residential homes in the VPP. A detailed modeling of different loads including the power consumption and hours of working, considering the situation in Australia, is prepared for this VPP [34,35,36,37]. Table 1, Table 2, Table 3 and Table 4 show the electricity loading of different appliances, as well as major loads in different seasons.
In order to generate the annual load profile for the households in the VPP, load uncertainties of non-controllable appliances are considered and modeled using Monte Carlo Simulation (MCS). MCS can provide daily load profiles based on the information in Table 1, Table 2, Table 3 and Table 4 and the level of uncertainties set in the simulation. Figure 4 shows the load profile and PV production for a sample week in summer, generated by MCS. Furthermore, Figure 5 illustrates the contributions of different appliances and their variation in different seasons.

Air Conditioning Load

The heating and cooling load for a building is determined based on the ambient temperature, solar radiation, building thermal mass, internal heat gain, thermal load disturbance, and the comfort level of residences. Indoor temperature is regulated by using thermostats. The state of the on/off relay can be determined by the hysteresis control rule in cooling mode as follows [38]:
U ( t ) = { 0 ,     | i f   U ( t Δ t ) = 1 ,   |   T i n < T i n , m i n 1 ,     | i f   U ( t Δ t ) = 0 ,   |   T i n > T i n , m a x U ( t Δ t ) ,     o t h e r w i s e ,
where Tin is the indoor temperature which is a function of outdoor temperature, solar radiation, internal heat gain, and building thermal mass. Tin,max and Tin,min are the upper and lower boundaries of the temperature set-point. U is the discrete state of the relay which switches the heat distributor on and off, according to the hysteresis control rule. Buildings are modeled by the heat dynamic state space model as follows [30,32]:
[ T l ˙ T i n ˙ ] = [ 1 R i n C l 1 R i n C l 1 R i n C i n ( 1 R i o C i n + 1 R i l C i n ) ] [ T l T i n ] + [ 0 1 C l ] U Q a + [ 0 0 0 1 R i n C l 1 R i n C l 1 R i n C l ] [ T o S r I g ] ,
where R i n , C l , C i n , and R i l are thermal parameters of the building, and Q a is the heat transfer rate of the air conditioner. The daily thermal demand is calculated based on the building model, as presented in Equation (2). In each time step, the updated indoor temperature ( T i n ˙ ) and building lumped thermal mass temperature ( T l ˙ ) are calculated based on the present temperatures, solar radiation ( S r ) , outdoor temperature ( T o ) , and the heat gain ( I g ) .
In this VPP complex, the comfort temperatures for occupants are considered as 24–26 °C for summer and 20–22 °C for winter. For each of the 67 homes in this VPP, a split air conditioner of 2.7 kW with a coefficient of performance (COP) of 3 is considered. Then, the annual load profile is generated for the air conditioning load, as shown in Figure 6. Note that the number of active air conditioners is determined based on Table 2, Table 3 and Table 4.

4. The Formulation of Expenses and Revenues

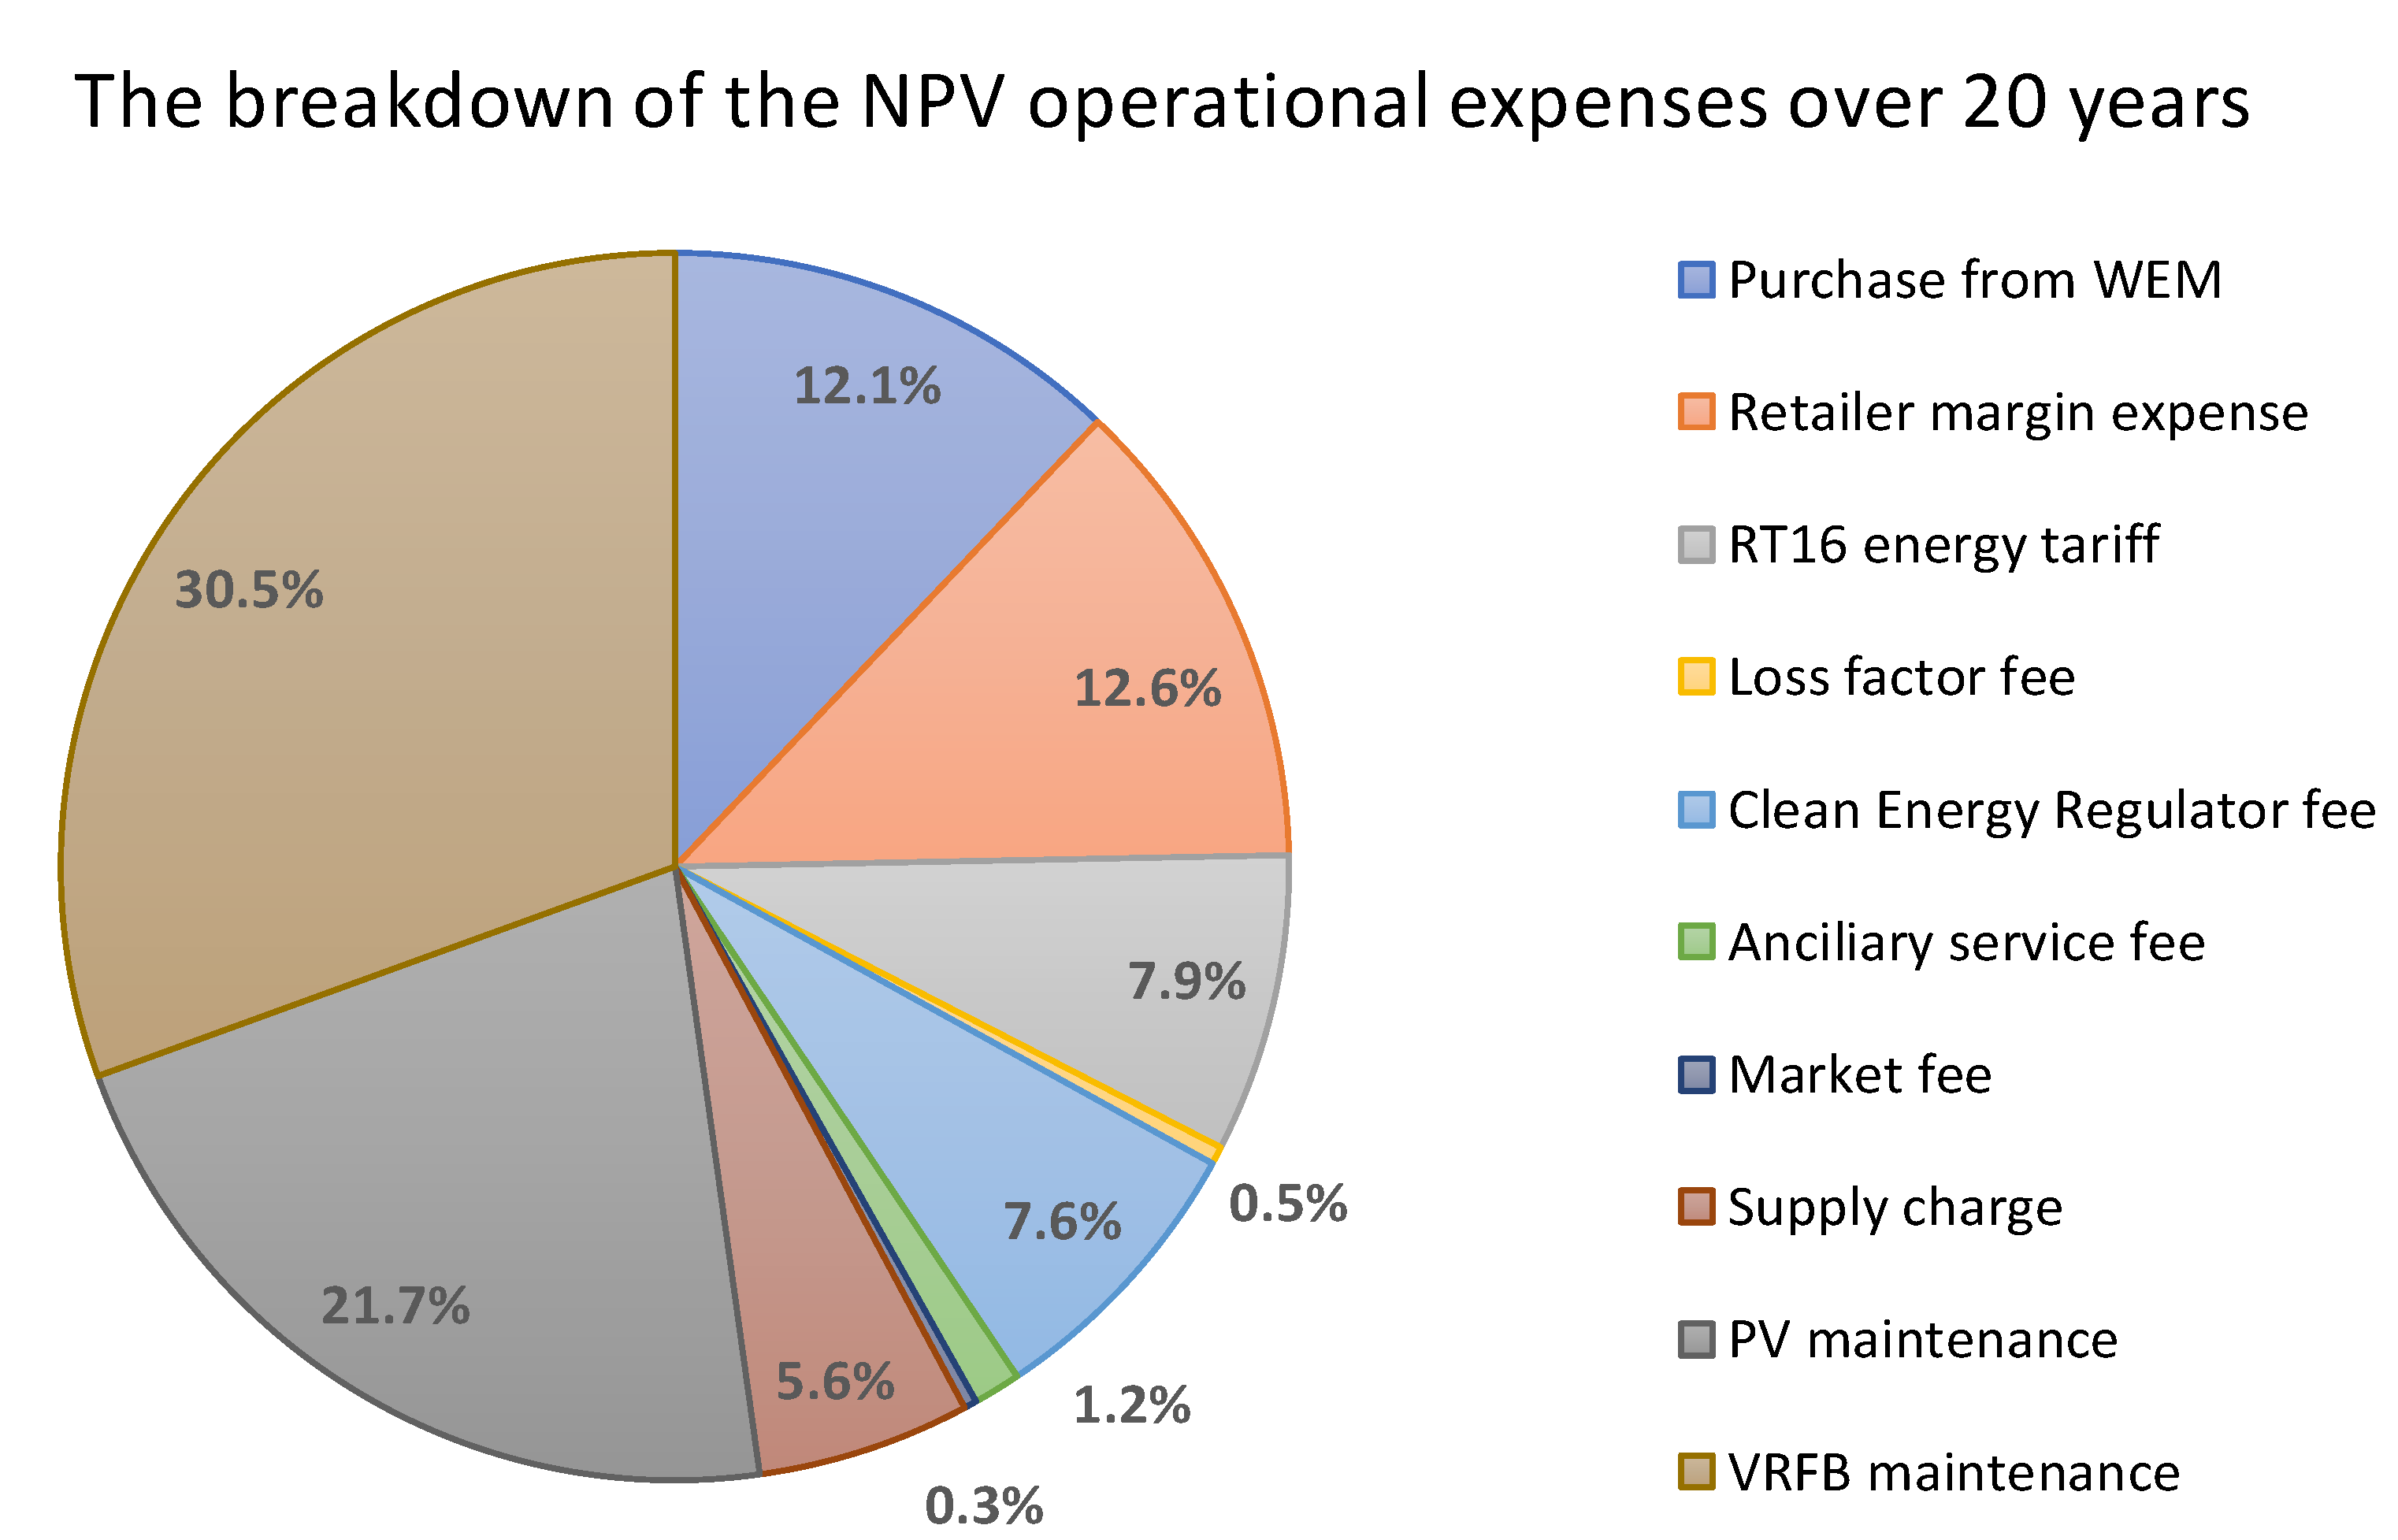
4.1. The Expenses of the VPP

This section provides a detailed list and formulation of expenses for the VPP. The total net present value (NPV) of expenses over the period of planning (horizon year) is formulated as follows:
C t o t = C W E M + C C A P E X ,
where C W E M is the total NPV of WEM-related expenses, and C C A P E X is the total NPV of capital expenditure (CAPEX) expenses.
The total NPVs of WEM-related and CAPEX-related expenses are formulated as follows:
C W E M = y = 1 H Y C W E M y , N P V = y = 1 H Y C E , i n y , N P V + C R e t , i n y , N P V + C R e t , o u t y , N P V + C T C y , N P V + C L F y , N P V + C C E R y , N P V + C A S y , N P V + C M F y , N P V + C S C y , N P V .
C C A P E X = C P V N P V + C V R F B N P V + C H P N P V + C T r a n s N P V + C M e t e r s N P V + C D e s i g n N P V .
The definitions of the WEM-related expenses and costs are provided below [39].
  • C W E M y , N P V is the NPV of the WEM-related expenses at y-th year;
  • H Y is the horizon year and y is the index for the year;
  • C E , i n y , N P V is the NPV cost of purchasing energy from the WEM balancing market at the y-th year, which is formulated as follows:
    C E , i n y , N P V = 1 ( 1 + i ) y h = 1 8760 E i n y , h π y , h ,
    where E i n y , h is the purchased energy from WEM and π y , h is the WEM electricity price at the h-th hour of the y-th year, and i is the interest year. The coefficient 1 ( 1 + i ) y is applied here to convert the cost at year y to the net present value.
  • C R e t , i n y , N P V is the NPV cost of the retailer margin expense associated with the purchase from the WEM. This cost is calculated as a percentage, namely, α y in this paper, of the cost of purchasing energy from the WEM, which is formulated as follows:
    C R e t , i n y , N P V = α y C E , i n y , N P V .
  • C R e t , o u t y , N P V is the NPV cost of the retailer margin expense associated with the export from the VPP to the WEM. This cost is also calculated as a percentage ( α y ) of the NPV of the revenue from selling energy to the WEM, namely, R W E M y , N P V here, which is formulated as follows:
    C R e t , o u t y , N P V = α y R E , W E M y , N P V .
  • C T C y , N P V is the NPV of the energy tariff charge, which is calculated based on the tariff that is applied to the VPP. In this case, the applied tariff is RT16 [40], which is for the business customers with the time of use (TOU) bi-directional service, and it is formulated as shown below. ω y , h is the energy tariff price at the hour h of year y.
    C T C y , N P V = 1 ( 1 + i ) y h = 1 8760 E i n y , h ω y , h .
  • C L F y , N P V is the NPV cost of the loss factor, which is calculated as a constant coefficient ( β y equal to 0.0603 for 2019–2020) times the NPV of the network charge in each year, which is
    C L F y , N P V = β y C T C y , N P V .
  • C C E R y , N P V is the Clean Energy Regulator fee, which is applied to the big customers, proportional to the energy imported from the grid. The fee is γ y AUD (Australian dollars) per kWh purchased from the grid in each year, namely, E i n y , which is formulated as shown below. γ y is 0.02256 AUD per kWh for 2019–2020.
    C C E R y , N P V = 1 ( 1 + i ) y γ y E i n y .
  • C A S y , N P V is the ancillary service fee, which is a constant percentage of the energy imported from the grid. The fee is δ y AUD per kWh purchased from the grid in each year, which is formulated as shown below. δ y is 0.00372 AUD per kWh for 2019–2020.
    C A S y , N P V = 1 ( 1 + i ) y δ y E i n y .
  • C M F y , N P V is the market fee, which is a constant percentage of the energy imported from the grid. The fee is θ y = 0.001029 AUD per kWh for 2019–2020.
    C M F y , N P V = 1 ( 1 + i ) y θ y E i n y .
  • C S C y , N P V is the daily supply charge, which is a constant daily charge as per the tariff of RT16. This charge is ϑ y = 2.9958 AUD per day for 2019–2020, which is applied for all 365 days of a year.
    C S C y , N P V = 1 ( 1 + i ) y ϑ y × 365
    The formulation of CAPEX-related costs is also presented here.
  • C P V N P V is the cost associated with the PV system during the project, including the cost of PV panels ( C P V , p a n e l N P V ), inverter ( C P V , i n v e r t e r N P V ), installation and commissioning ( C P V , i n s t N P V ), and PV panel maintenance ( C P V , O M N P V ), such as annual washing and cleaning. R P V , S T C N P V is the small-scale technology certificate (STC) rebate calculated based on Reference [41], which is granted as an incentive to those who install solar systems. Although this is revenue for the VPP, it is located here with other costs of PV for the sake of clarification. If the horizon year is no longer than the lifetime of the PV panels, the NPV cost of PV panels and the associated installation cost are equal to the investment cost at the beginning of the project. As the lifetime of inverters, e.g., 12 years, is shorter than the lifetime of PV panels, e.g., 20 years, it is required to replace the inverters during the life of the project. In this case, we need to consider the cost of the inverter in year 12, for example, and calculate the corresponding NPV cost. μ P V , O M y is the maintenance cost of PV panels per dwelling in year y.
    C P V N P V = C P V , p a n e l N P V + C P V , i n v e r t e r N P V + C P V , i n s t N P V + C P V , O M N P V R P V , S T C N P V , C P V , O M N P V = y = 1 H Y 1 ( 1 + i ) y × 67 × μ P V , O M y .
  • C V R F B N P V is the cost associated with the VRFB system, including the cost of the battery ( C V R F B , b a t t N P V ), the cost of maintenance ( C V R F B , O M N P V ), and the cost of installation ( C V R F B , i n s t N P V ), such as designing and constructing a slab and foundations for the battery. The 20-year warranty is included in the price of the VRBF. φ V R F B , O M y is the maintenance cost of the VRFB in year y.
    C V R F B N P V = C V R F B , b a t t N P V + C V R F B , i n s t N P V + C V R F B , O M N P V , C V R F B , O M N P V = y = 1 H Y 1 ( 1 + i ) y × φ V R F B , O M y .
  • C H P N P V is the cost of heat pump HWS for 67 dwellings. The government provides a rebate for the use of heat pumps as well [42]; thus, the cost is adjusted based on this incentive. Moreover, the difference between the cost of heat pump and instantaneous electric HWS is considered in the NPV calculations;
  • C T r a n s N P V is the cost of the power transformer and associated cabling and protection system that connects the VPP to the grid;
  • C M e t e r s N P V is the cost of the smart meters for 67 dwellings including the cloud storage for monitoring, auditing, and control purposes;
  • C D e s i g n N P V is the cost of design of the embedded network, communication, and electrical design.

4.2. The Revenues of the VPP

The revenue of the VPP come from selling energy to the WEM, R W E M , as well as to the residents, R R E S , which is formulated as follows:
R t o t = R W E M + R R E S .
R W E M = y = 1 H Y R W E M y , N P V = y = 1 H Y R W E M , R C y , N P V + R E , W E M y , N P V , R E , W E M y , N P V = 1 ( 1 + i ) y h = 1 8760 E o u t y , h π y , h , R W E M , R C y , N P V = 1 ( 1 + i ) y ρ R C C y P R C C y ,
where R W E M y , N P V is the NPV of the revenue from selling energy to the WEM, and E o u t y , h is the the energy exported to the WEM at hour h of year y . R W E M , R C y is the reserve capacity revenue calculated based on the reserve capacity credit (RCC), namely, ρ R C C y , assigned to the VPP and the price ( ρ R C C y ) AUD/MW/year associated with it. For 2019–2020, the price of RCC is 146,994.24 AUD/MW/year [43].
R R E S is the NPV of the revenues from selling energy to the 67 dwellings, which comprises two revenues: resident supply charge and energy consumption charge. This revenue is formulated as follows:
R R E S = y = 1 H Y R R E S y , N P V = y = 1 H Y 1 ( 1 + i ) y × 365 × ( 67 × σ R E S , S C y + h = 1 24 E R E S y , h τ R E S , E y , h ) ,
where σ R E S , S C y is the resident supply charge in AUD/day at the y-th year, E R E S y , h is the total energy consumption by 67 dwellings, and τ R E S , E y , h is the price of electricity sold to the residents at the h-th hour of the y-th year. The price of electricity to the residents is considered at the lower price compared to the other electricity providers in the region.
Using the revenue of R R E S , the average electricity cost per dwelling can also be calculated as follows:
C R E S a v e = R R E S 67 .

4.3. The Profit of the VPP

After calculating the total NPV of expenses and revenues of the VPP, the net NPV profit of the VPP operator is expressed as
B t o t = R t o t C t o t .

5. Battery and Demand Management

5.1. Demand Management

As the major appliances of the dwellings in this VPP are smart and can be controlled, some of those presented in Table 5 are considered for demand management (DM). These appliances can be programmed in order to manage at which hours they are available for normal working. The residents have the right to override the rules that the appliances are already programmed for.

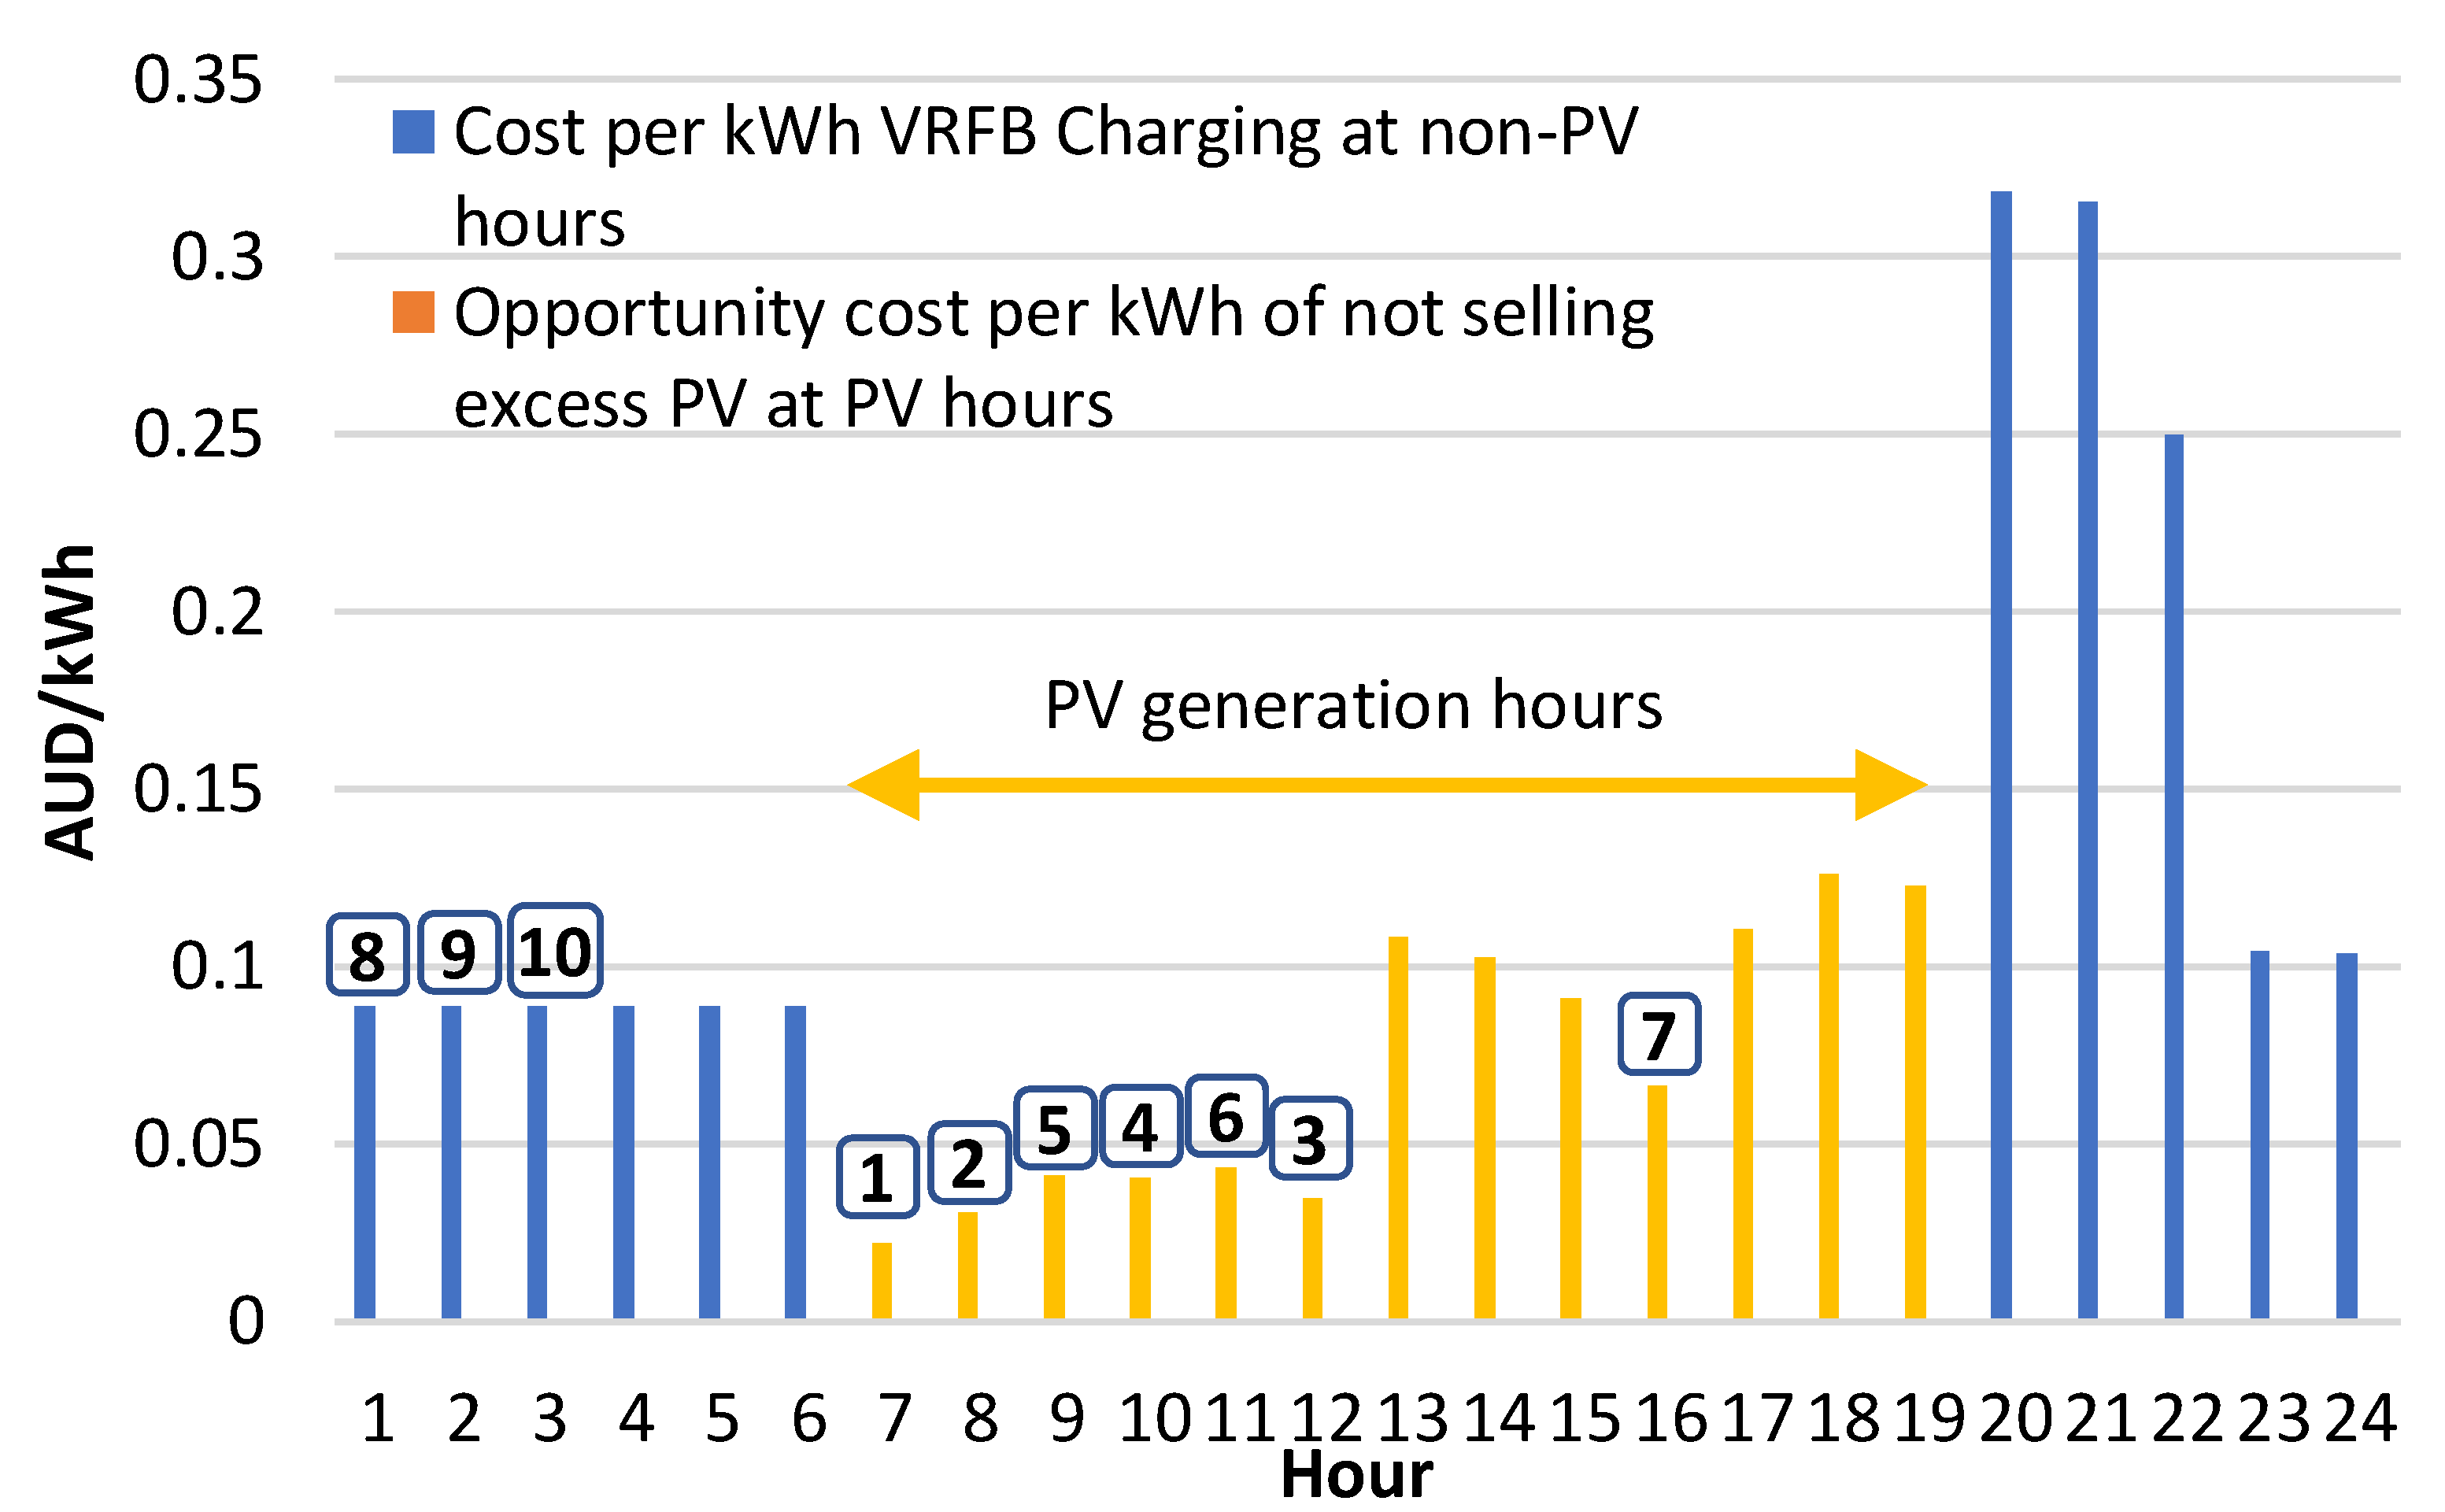
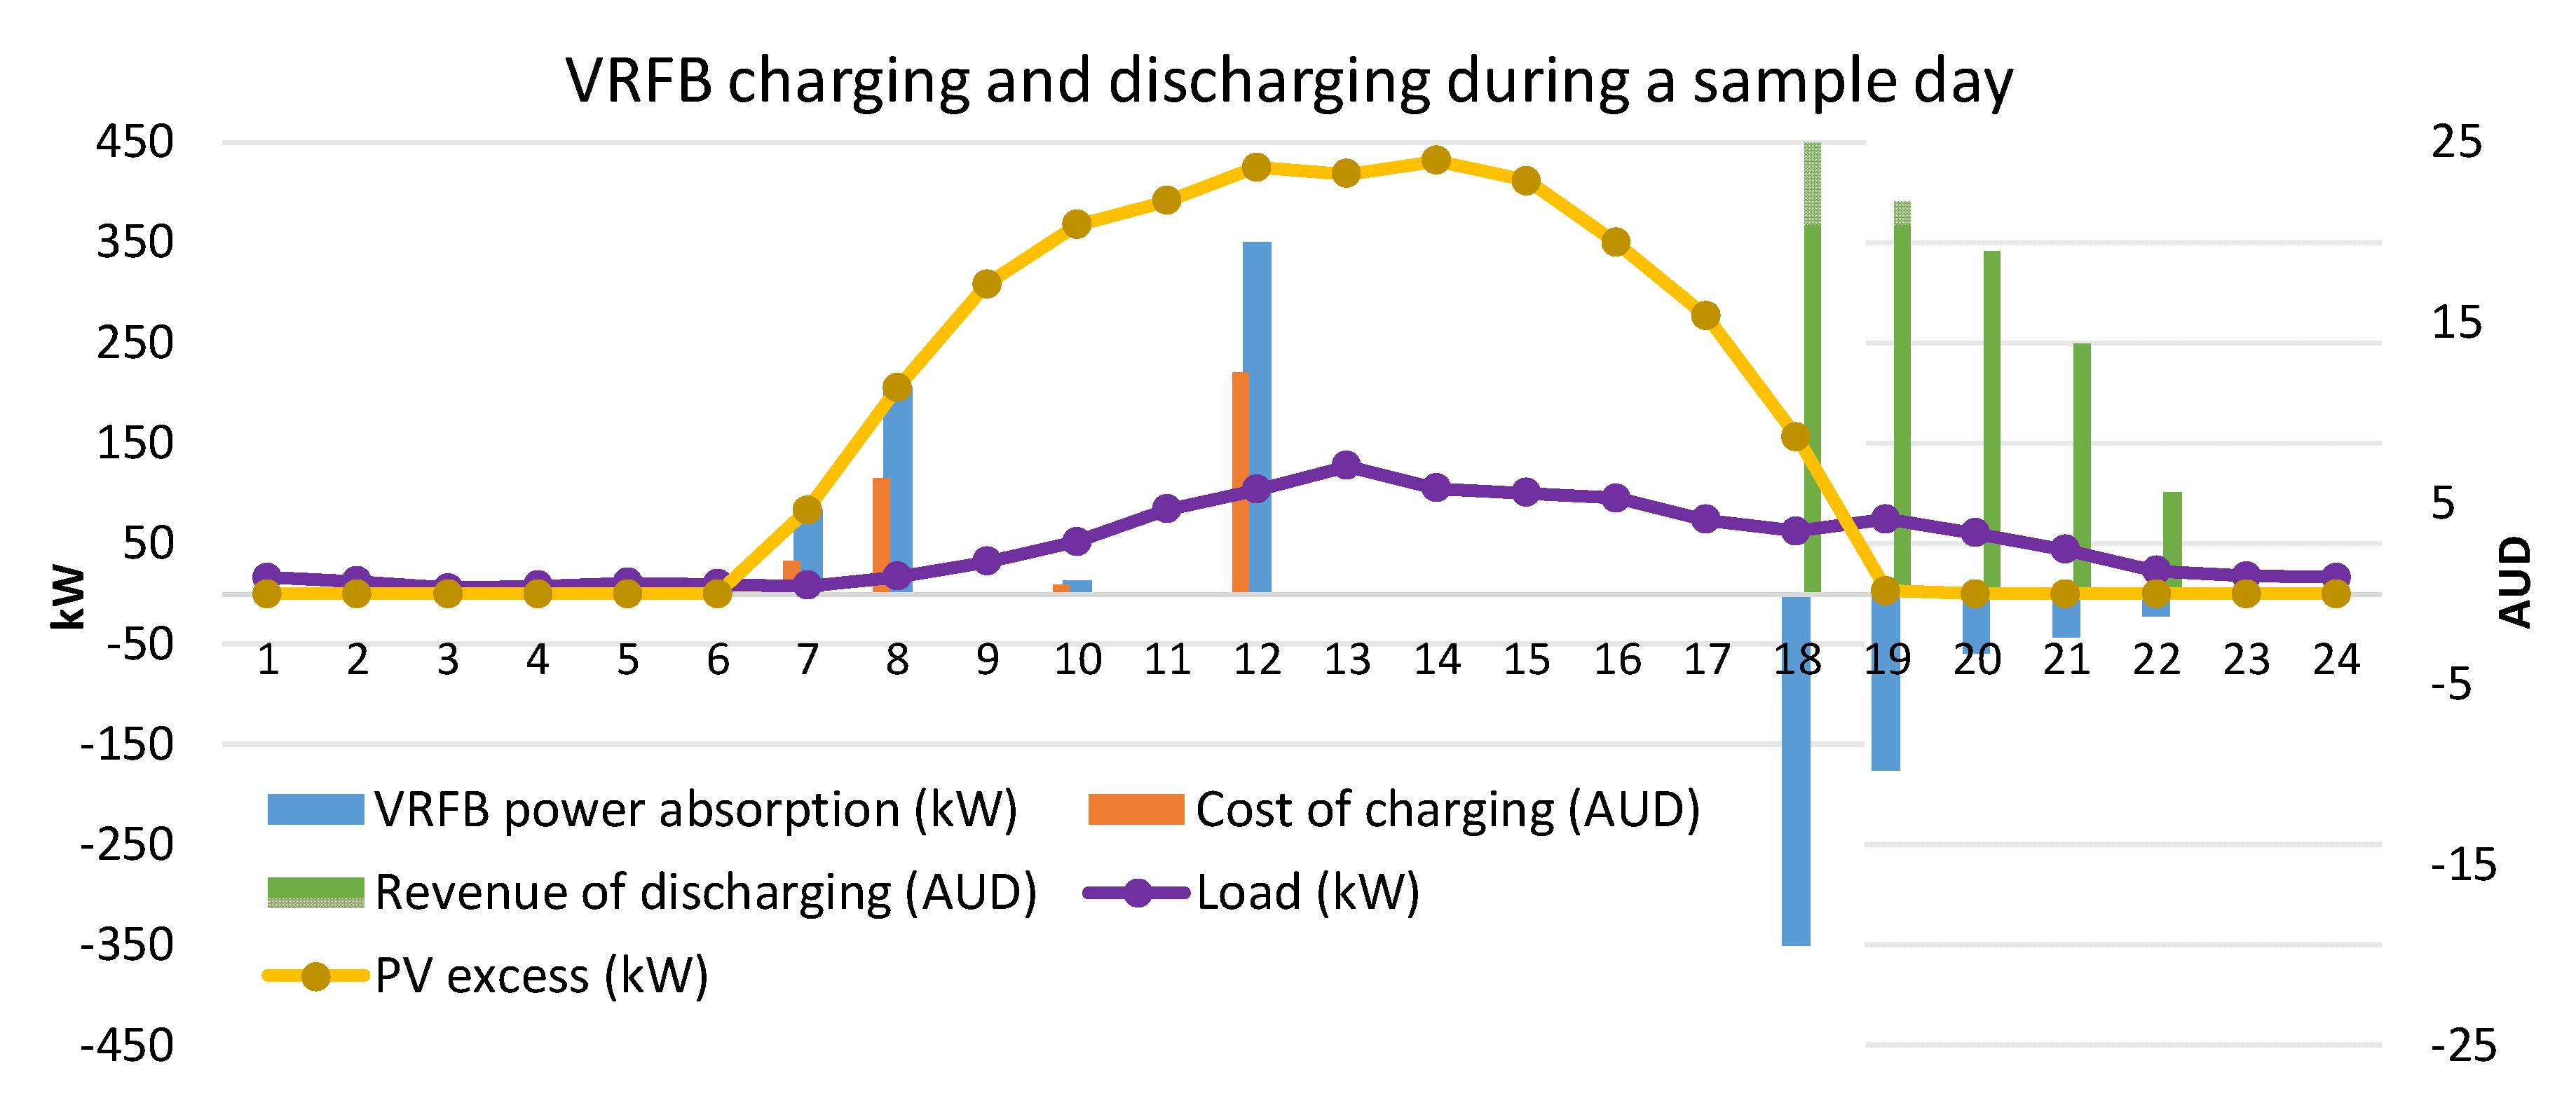
5.2. Battery Management

In order to maximize the benefit achievable from the battery for the VPP and the residents, an efficient charging and discharging of the VRFB is important. To achieve this aim, it is critical to identify whether charging from excess PV is beneficial or not and whether discharging at which hour is more effective.
Firstly, two parameters are defined here.
(a)
The revenue per kWh of selling excess PV to WEM at the h-th hour of the y-th year, which is equal to the opportunity cost of not selling excess PV to WEM, which is defined as follows:
r e v / k W h y , h = E o u t y , h π y , h C R e t , o u t y , h E o u t y , h = E o u t y , h π y , h E o u t y , h π y , h α y E o u t y , h = π y , h ( 1 α y ) .
(b)
The cost of purchasing 1 kWh energy at the h-th hour of the y-th year for charging the battery at non-PV hours, which is equal to the avoided cost of not purchasing energy from the grid at RT16, which is calculated as follows:
c o s t / k W h y , h = C E , i n y , h + C R e t , i n y , h + C T C y , h + C L F y , h + C C E R y , h + C A S y , h + C M F y , h E i n y , h = E i n y , h π y , h + α y E i n y , h π y , h + E i n y , h ω y , h + β y E i n y , h ω y , h + γ y E i n y , h + δ y E i n y , h + θ y E i n y , h E i n y , h = π y , h ( 1 + α y ) + ω y , h ( 1 + β y ) + γ y + δ y + θ y .
It is assumed that the daily forecast of electricity price is available through the corresponding API from the AEMO [44]. Furthermore, it is considered that state of charge (SOC) of the battery is zero at the beginning and the end of each day. This means that one full charge and one full discharge are scheduled every day. For example, if the opportunity cost of not selling excess PV to the WEM ( r e v / k W h y , h ) is less than the cost of purchasing energy for charging the battery at hours without PV generation, namely, non-PV hours, ( c o s t / k W h y , h ), then the VRFB is charged from excess PV. In the case of multiple hours with excess PV, which satisfies this condition, this is sorted based on their r e v / k W h y , h , and the VRFB is scheduled for charging at the lowest r e v / k W h y , h . Figure 7 shows the opportunity costs during PV generation and the cost of charging during non-PV hours. Moreover, it shows the priority of hours for charging from 1–10. As seen, the cheapest hours for charging are 7:00 a.m., 8:00 a.m., and 12:00 p.m., in which the battery is charged using excess PV. If there is not enough PV excess in the priority hours, then the battery can be charged in non-PV hours. It is important to note that not all PV hours are suitable for charging as, for example, the cost of hours 1:00 p.m. to 3:00 p.m. during PV generation is higher than the cost of charging at 1:00 a.m. to 3:00 a.m. The VRFB is also discharged when the total revenue is maximized, which is formulated as the revenue gained from the avoided cost of not purchasing k 1 units of energy from grid at RT16 to supply the load in addition to selling k 2 units to the WEM, which is equal to k 1 c o s t / k W h y , h + k 2 r e v / k W h y , h .
In order to maximize the benefit of VRFB charging and discharging, the charging/discharging scheduling needs to be optimized for each day. The optimization problem is formulated as shown below, in which the total cost of daily charging/discharging is minimized. In this formulation, x y , h is the VRFB power at the h-th hour and the y-th year for which the positive and negative signs represent charging and discharging, respectively.
m i n i m i z e   ( h = 1 24 H o u r P r i c e y , h )   ,     y H o u r P r i c e y , h = { x y , h r e v / k W h y , h x y , h > 0   d u r i n g   P V   h o u r s x y , h c o s t / k W h y , h x y , h > 0   d u r i n g   n o n P V   h o u r s k 1 c o s t / k W h y , h + k 2 r e v / k W h y , h x y , h < 0 k 1 = min ( E n P V R E S y , h , | x y , h | ) ,     k 2 = | x y , h | k 1 . Constraints:                         h = 1 24 x y , h = 0     ,       y , h = 1 h o u r x y , h 0     ,       h o u r = 1 24   ,   y , h = 1 24 | x y , h | 2 E V R F B m a x     ,   y , P V R F B m a x x y , h P V R F B m a x     ,   y ,
where E V R F B m a x and P V R F B m a x are the maximum allowable stored energy and charging/discharging power for the VRFB. and E n P V R E S y , h is the dwelling load that is not supplied by PV. The charging/discharging problem is optimized by the fmincon function in Matlab, whose parameters are provided in Table 6.

6. Input Parameters and Assumptions

The WEM electricity price for one year is obtained from the AEMO website. In the simulation, the noise of price forecast is considered to be 10%. The costs of major equipment are provided in Table 7. Furthermore, the costs of the RT16 tariff are presented in Table 8 [40]. The tariff of the VPP for the residents is based on the TOU tariff of the local electricity retailer. However, there is an incentive within the VPP, which is that the cost of electricity between 10:00 a.m. and 2:00 p.m. is zero, as indicated in Table 9. The major loads, including washing machines, dryers, dishwashers, and heat pumps, can run during this time.
The STC rebates for the PV and heat pump are calculated to be about 414,000 AUD and 70,000 AUD, respectively. The horizon year is 20 years.

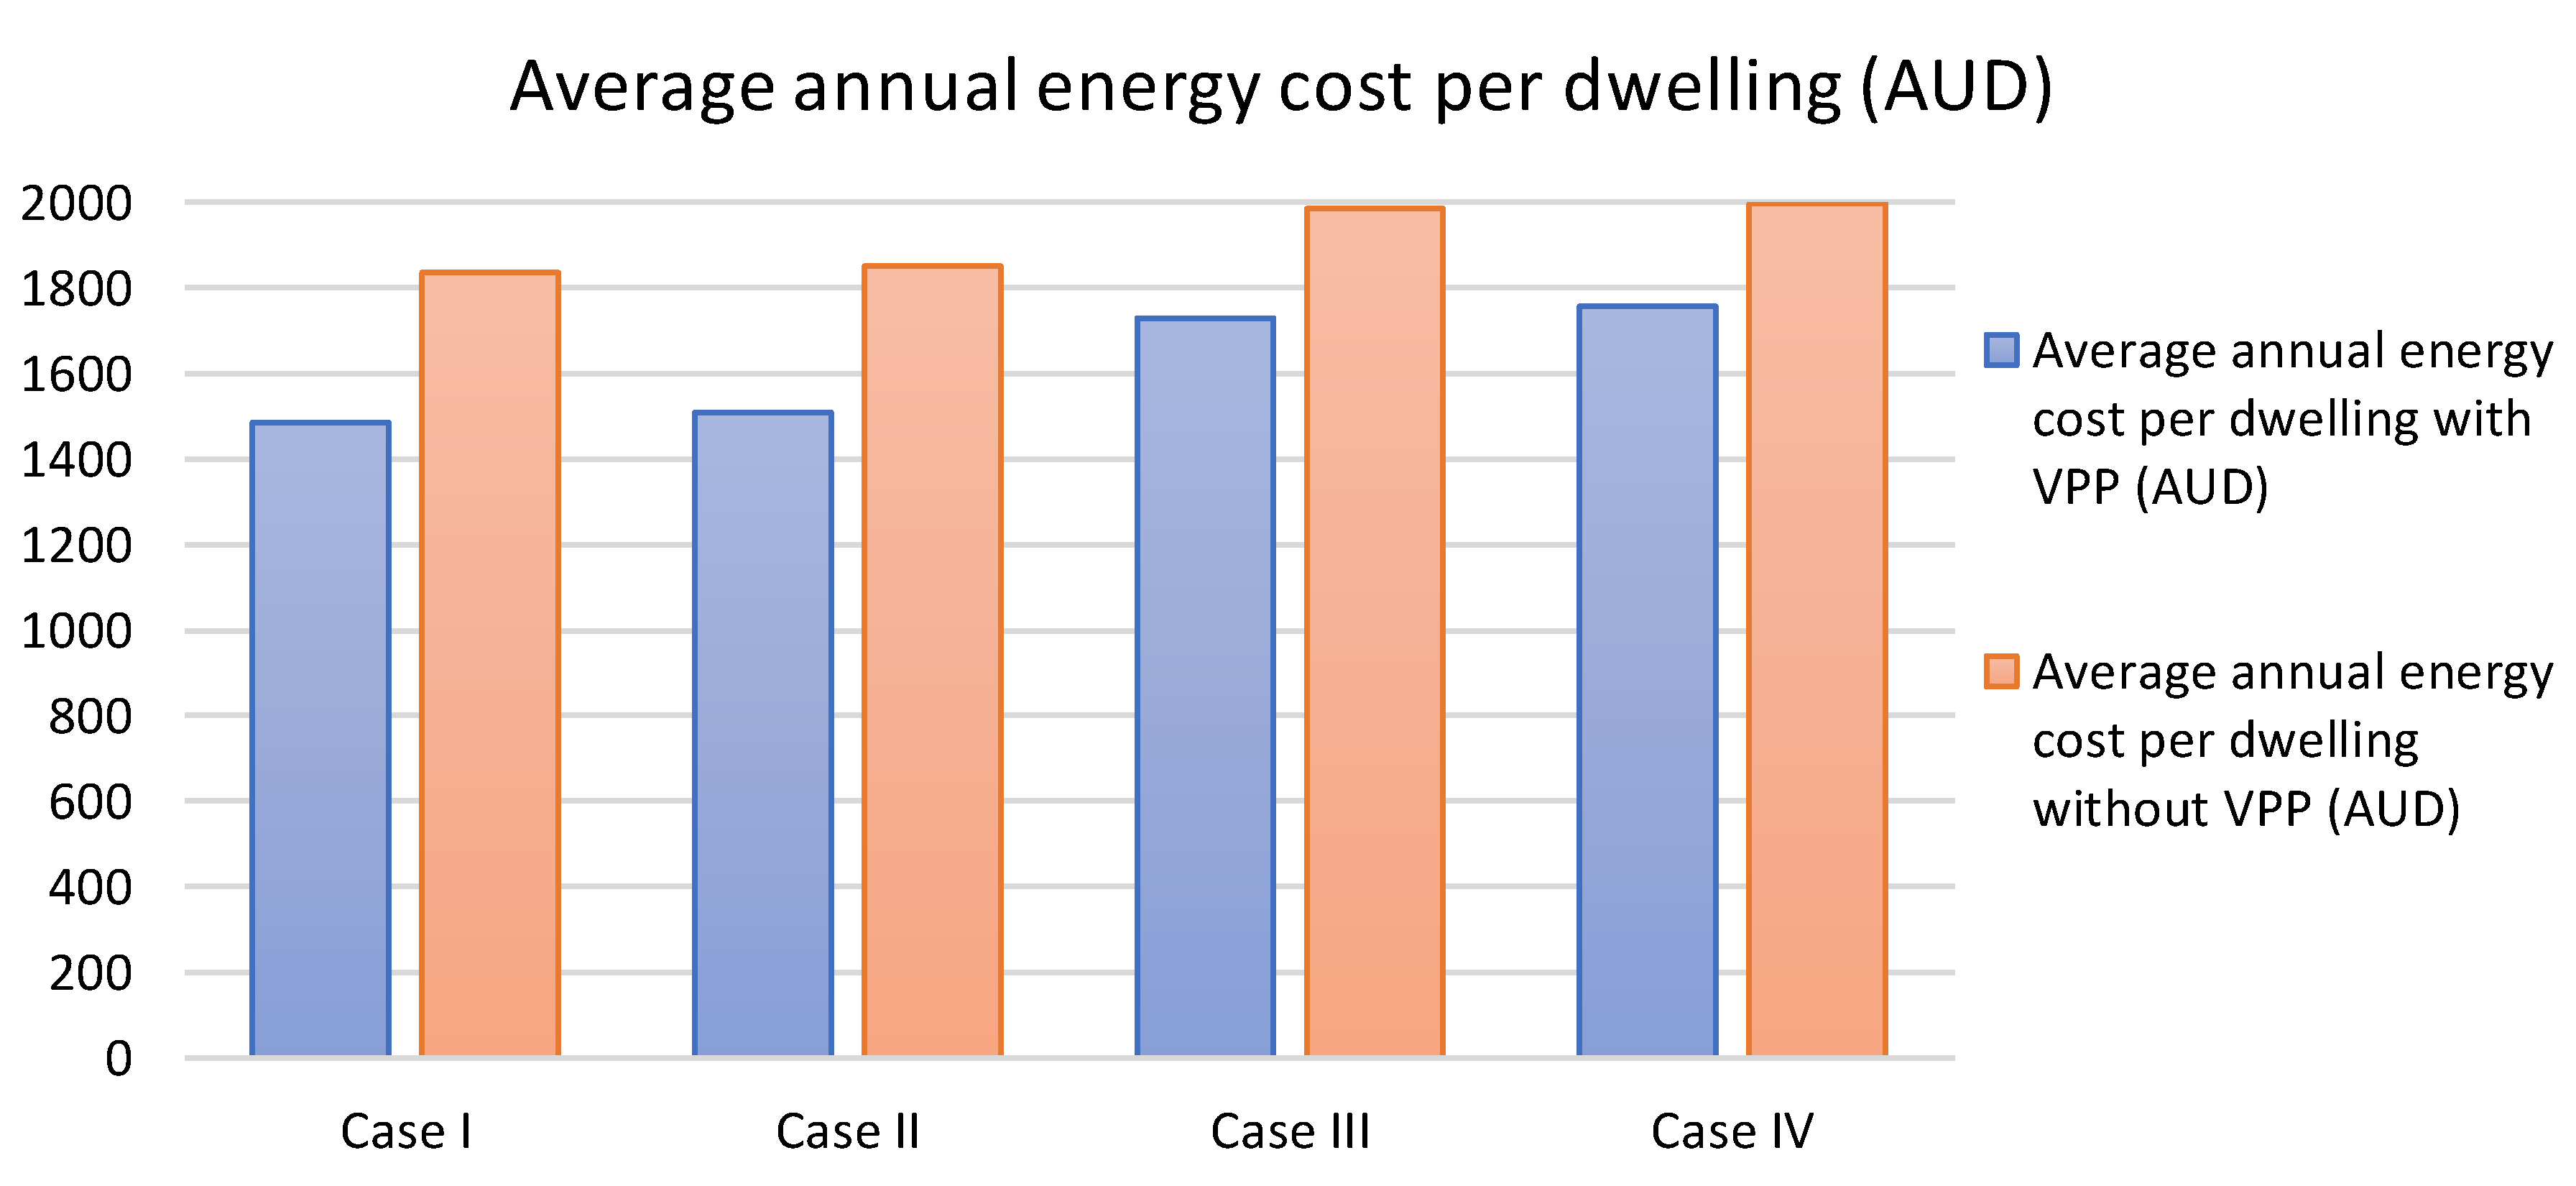
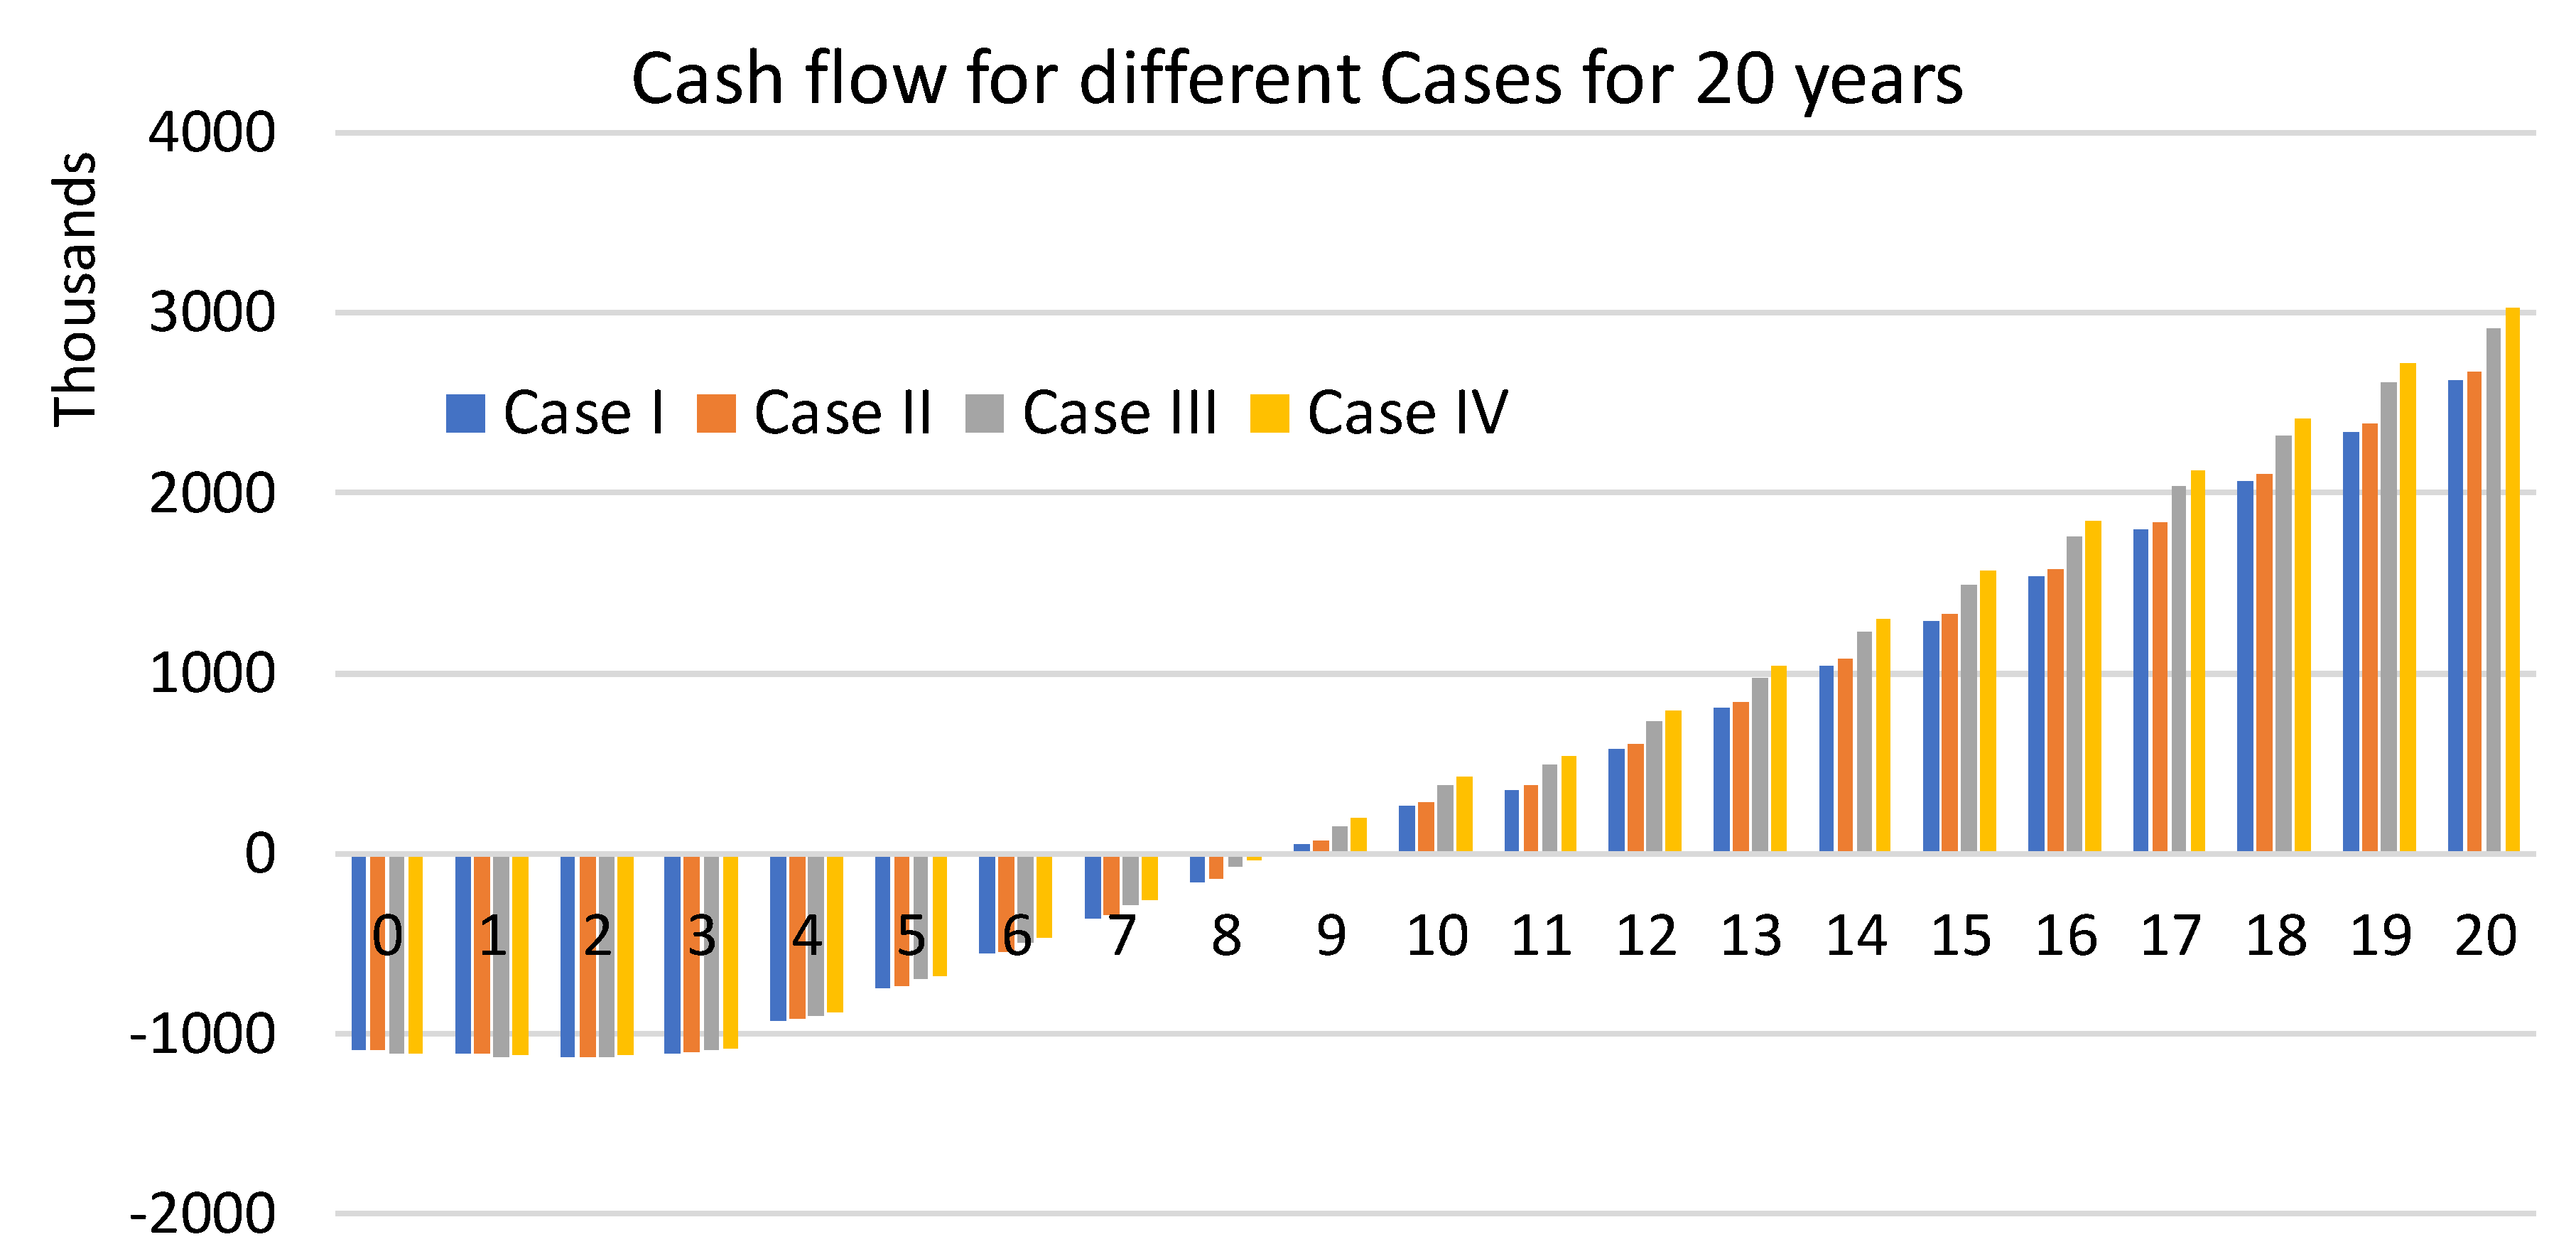
7. Simulation Results

In this section, the simulation of the proposed VPP in WA is described, and the expenses and the revenues of the VPP in four different cases are discussed. The case studies are defined as follows:
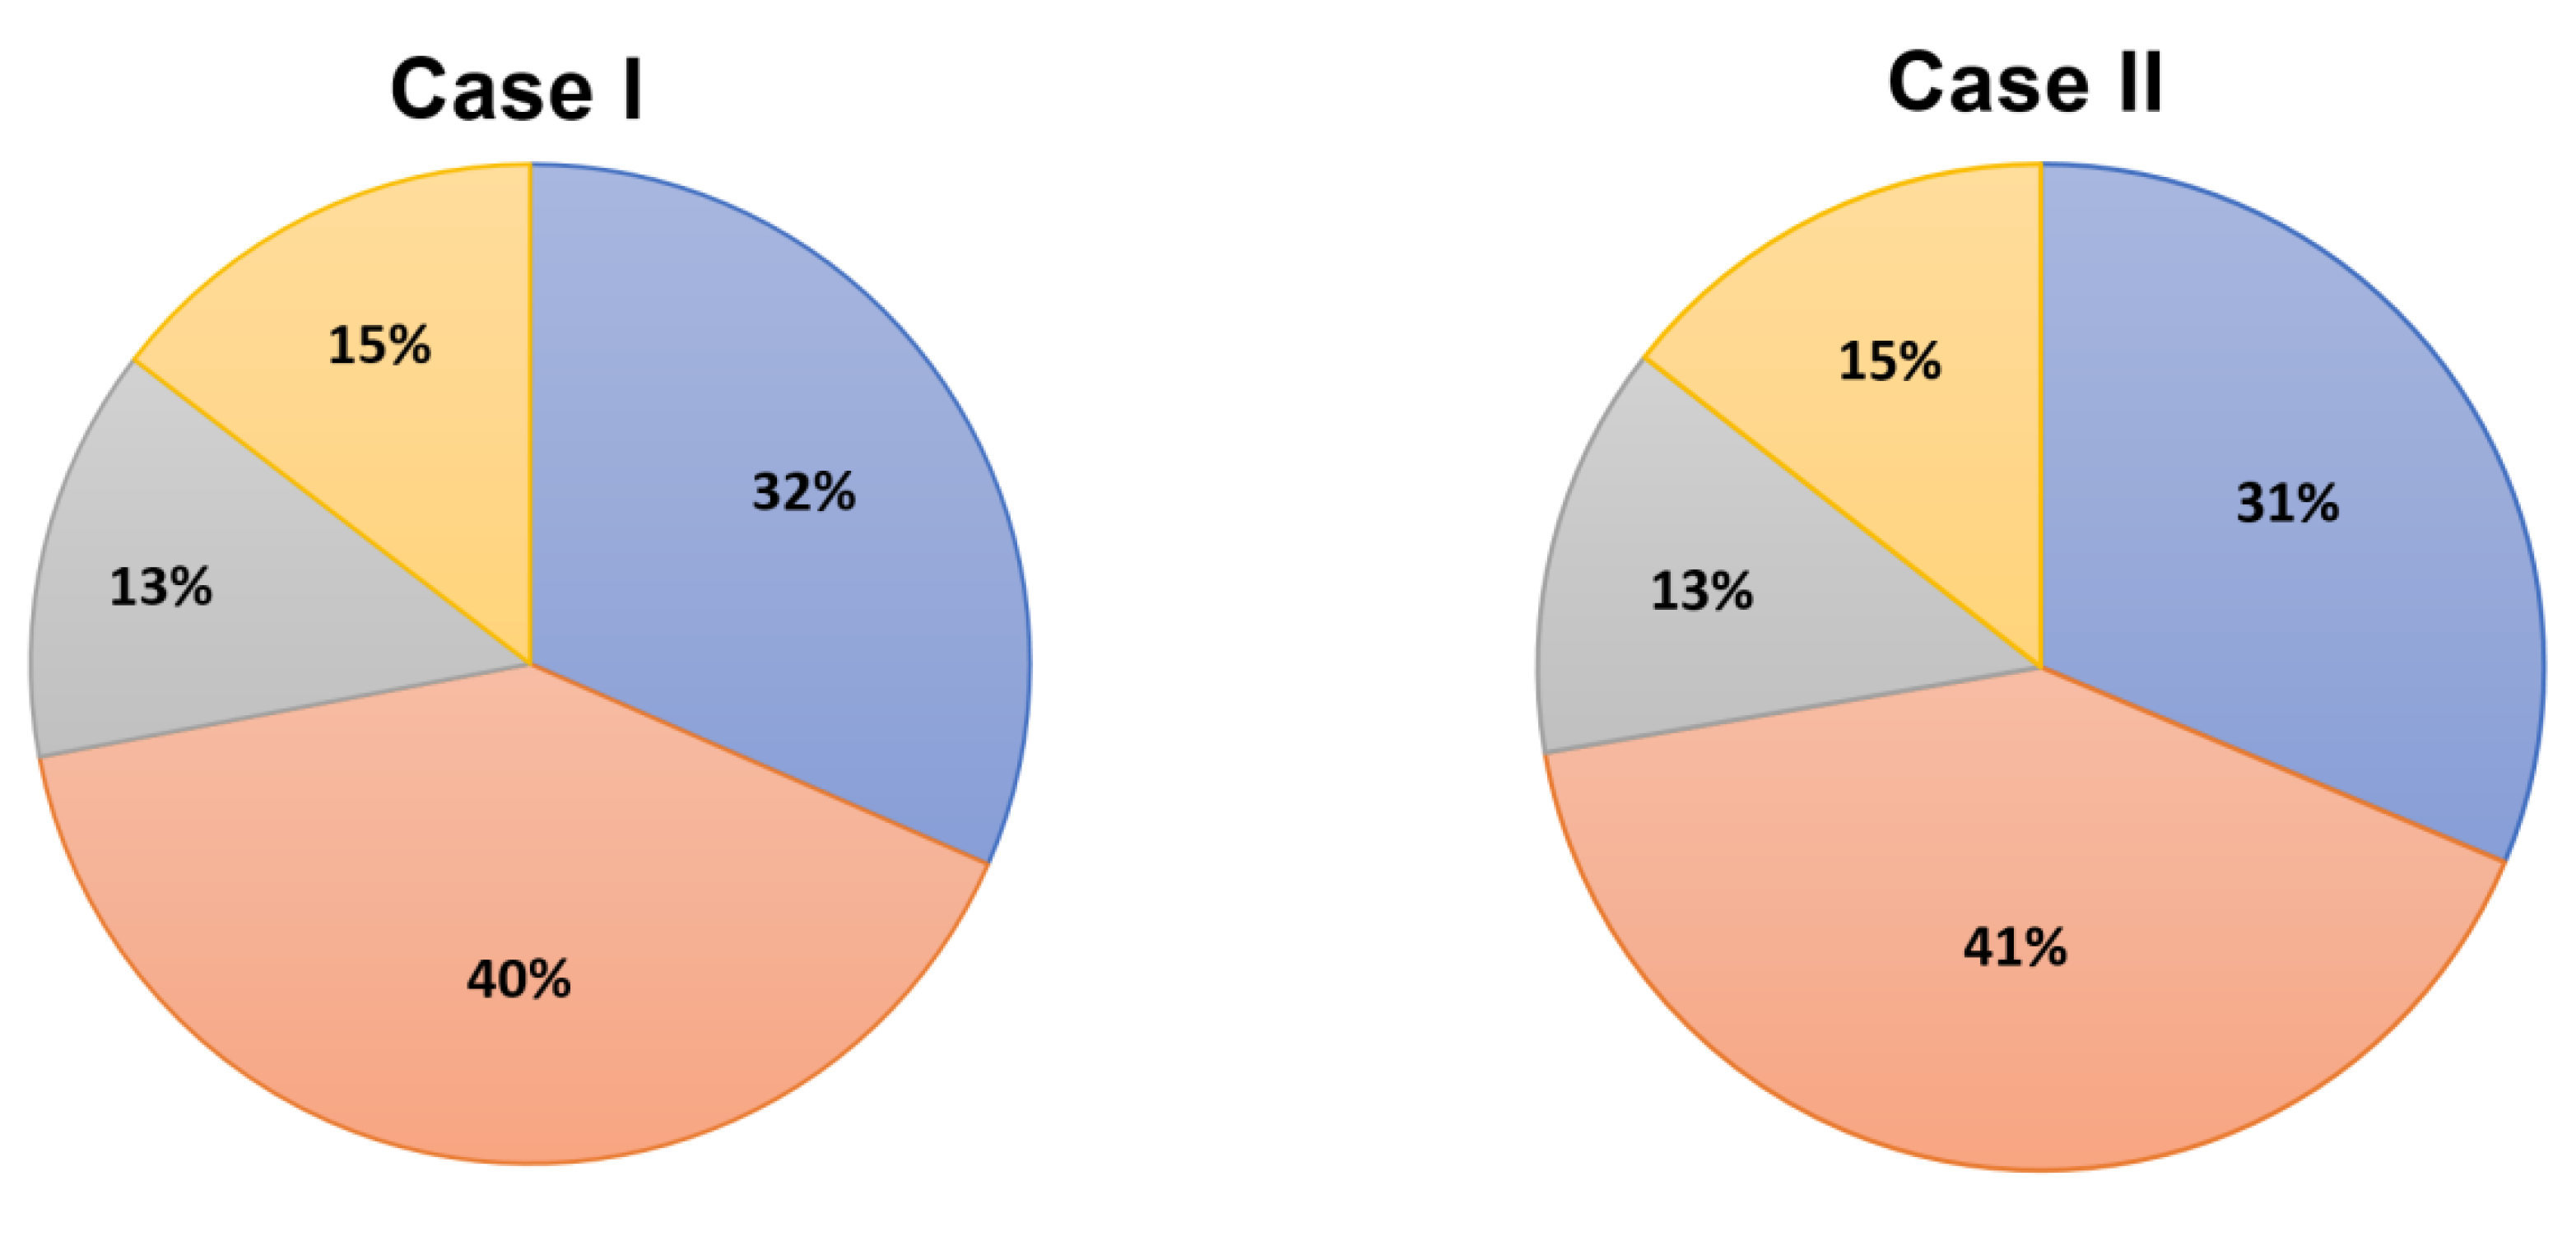
  • Case I: the VPP with heat pump and DM;
  • Case II: the VPP with heat pump without DM;
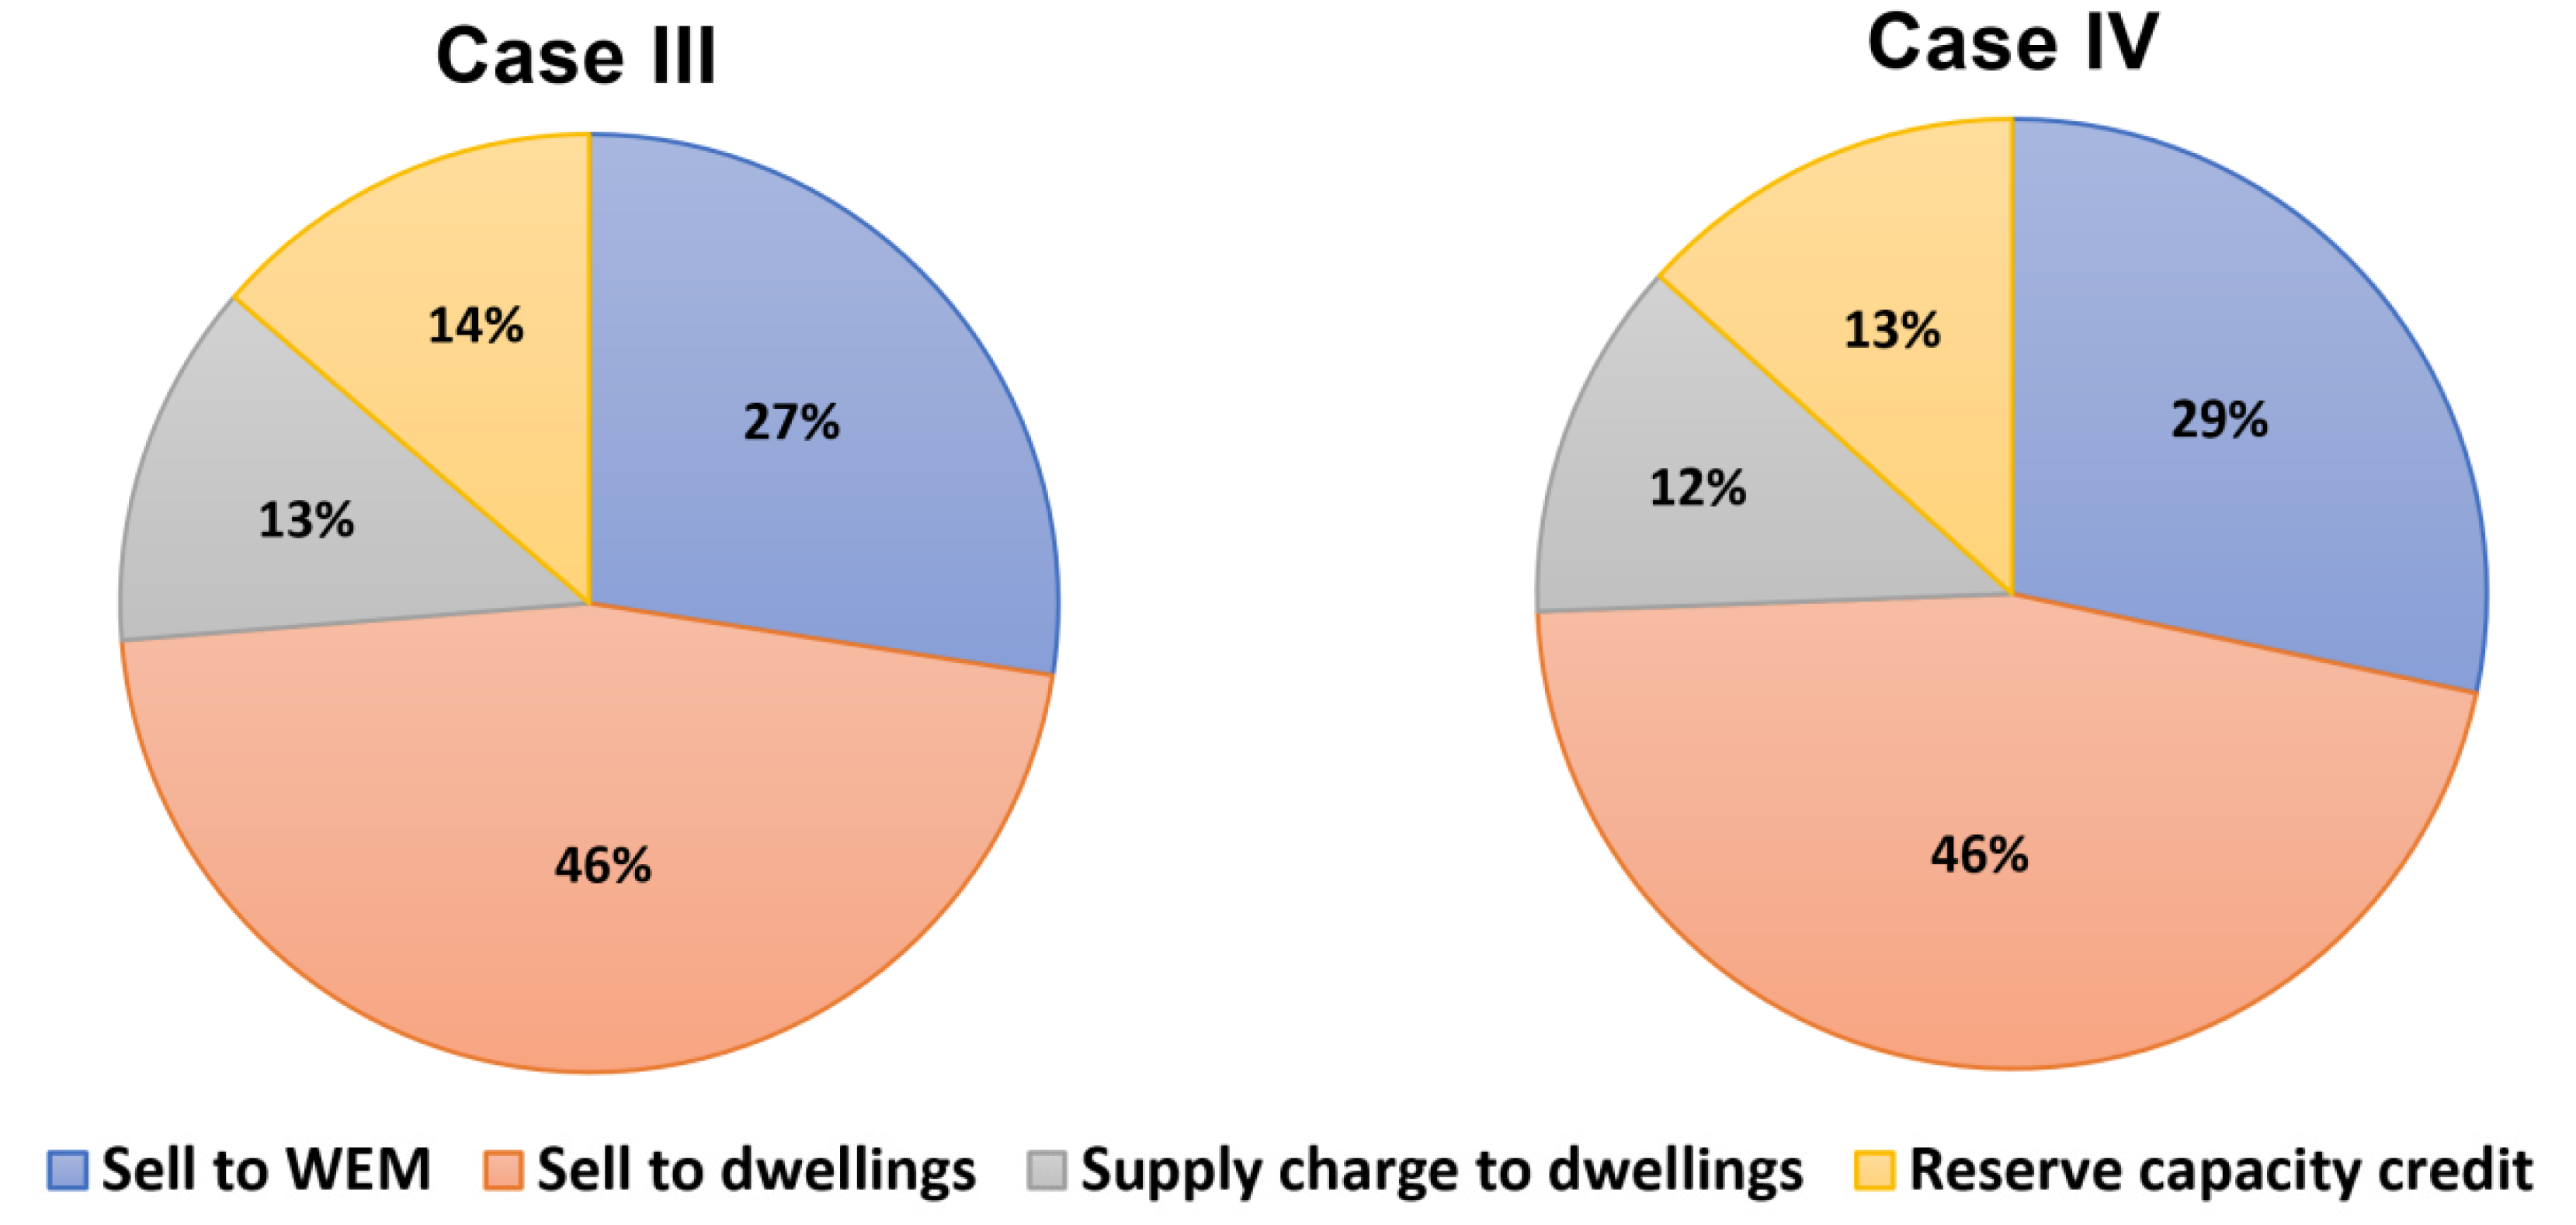
  • Case III: the VPP without heat pump (instead, instant electric HWS is used) with DM for dishwasher, dryer, and washing machine;
  • Case IV: the VPP without heat pump and without DM.

7.1. Comparison of Different Cases

Figure 8 shows the average annual energy cost per dwelling with and without VPP in AUD. As seen, the cost of electricity with VPP in Case I is lower than all other cases as energy-efficient heat pumps and demand management are implemented in this case. For example, the annual cost to residents in Case I is less than that in Cases II, III, and IV by 2%, 16%, and 18%, respectively, with VPP. Moreover, in Case I, the cost of electricity without VPP is about 24% higher than the cost within the context of a VPP, which shows a competitive energy advantage for customers in VPPs. Within VPP, the customers can have guaranteed free electricity between determined hours, and there is no need to pay for the maintenance of PV, battery, and the control system.
The cash flow for 20 years is illustrated in Figure 9. As seen, the payback period on investment for all different cases is about 8.5 years. The internal rate of return (IRR) is also 11.2%, 11.4%, 12.1%, and 12.5% for Cases I to IV, respectively. Case IV has a higher IRR compared to other cases as there are more high-consumption appliances such as an instant HWS installed. Although the IRR for Case IV is higher than that for Case I (by 1.3%), which makes Case IV more attractive for the VPP owner, the cost of electricity per dwelling in Case IV is 18% higher than that in Case I. Therefore, to move toward affordable and sustainable housing and to make the energy option attractive for the residents, Case I is prioritized for the VPP.
Figure 10 also shows the breakdown of the NPV revenue in AUD streams over 20 years for the VPP in four cases. As seen, about one-third of the revenue comes from selling energy from the PV and battery to the WEM. Moreover, between 40% and 45% of the revenue is obtained by selling energy to the residents. Furthermore, no more than 14% of the revenue is received from the supply charge for the dwelling. Additionally, the revenue associated with the reserve capacity credit forms only 13 to 15% of the total revenue over 20 years. As shown in the Case I, the revenue from selling to residents is less than that in other cases but the revenue from the interaction with the WEM is higher than that in other cases.
The breakdown of the NPV operational cost of the VPP over 20 years is illustrated in Figure 11. In this figure, the investment costs are not shown in order to have a better view of the operational costs. As seen, the costs of maintenance for PV and VRFB make up about 50% of the total expenses. Therefore, it is critical for a VPP owner to keep the maintenance costs as low as possible. One of the approaches is to purchase the components from a provider that can provide long-term warranty on the equipment. Moreover, purchasing from the WEM and the retailer involves marginal expenses of about 12% each. The optimization algorithm in this paper provides an algorithm for optimizing this purchasing amount. Other fees such as the Clean Energy Regulator, ancillary service, and market fees are about 9% of the total expenses. Additionally, the costs associated with the RT16 tariff, including the supply charge would be about 13%.
Figure 12 shows the scheduling of charging and discharging of the VRFB obtained from the optimization algorithm for a sample day for Case I. Additionally, in this figure, the charging cost and the discharging revenues in AUD for the corresponding hours are presented. As the cost of charging is low during PV generation, in this case, the battery is charged based on the priority given during optimization. In this case, the charging hour priority is 7:00 a.m., 8:00 a.m., 12:00 p.m., and 10:00 a.m. The charging power at 7:00 a.m. and 8:00 a.m. is limited to the excess PV, and that at 12:00 p.m. is limited to the maximum power of the VRFB, which is 350 kW. The discharging is also scheduled based on the output of the optimization. In this case, the discharging occurs to supply the load during the evening, when the RT16 tariff value is high. The algorithm through the optimization looks for the higher WEM prices to discharge the battery during these hours. As shown, the discharge power will supply the load during the hours of 20 to 22, when there is no PV generation. Furthermore, the VRFB is scheduled to discharge at hours of 18 and 19 as the WEM price is high, although there is an excess PV during this time.

7.2. Recommendations

Based on the study conducted in this paper, the following recommendations are made to provide some insights for VPP businesses and policy-makers:
  • Long-term planning of VPPs:
    The successful and sustainable rollout of VPPs requires reliable long-term planning including investment and operational analysis for 20 years, for example. This assessment gives both the VPP owners and policy-makers a better understanding of affordability of such a structure in the long-term and the required logistic and regulatory supports. Through this planning exercise, the costs and benefits of the VPP are determined and possible future revenues are investigated.
  • Wholesale electricity market interaction:
    The involvement of VPPs in WEM requires extensive development of the regulations and procedures related to this interaction. The preparation of such guidelines is initiated in some countries such as Australia. It is critical that the costs and benefits for VPP owners are considered in these rules and guidelines in order to minimize the costs of VPP implementation for the business. Moreover, the regulations should facilitate multiple revenue streams for VPPs to make the business sustainable in the long term. For example, in addition to the energy market, VPPs can participate in a demand response market or a frequency control market, which needs an appropriate set-up and regulation. Participating in multi-markets will reduce the payback period of investment for VPP owners and encourage more investors to enter this business.
  • Incentivizing VPP projects:
    The governments and policy-makers need to incentivize different configurations of VPPs and different locations to evaluate the cost/benefits and barriers to VPP implementation in the real-world. Using this approach, they can collect required technical and financial data from a realistic VPP to use in regulation and procedure development. Moreover, these incentives will encourage more investors to invest in VPPs; thus, the government can achieve the goal of renewable integration and customer engagement in a shorter period of time.
  • Batteries and PVs:
    The cost of batteries is still high for investors. Additionally, the cost of VRFBs and PV maintenance is high. Therefore, the regulators should plan for and incentivize the research and development of low-cost VRFBs and PVs, including investment and maintenance costs. In addition, the VPP owners can evaluate other options, such as leasing batteries for a period of time, which may be more profitable for them.
  • Data availability:
    Although there are very good resource data on the WEM, environment, and generation, the evaluation and implementation of a VPP requires a wider range of data including the costs associated with environmental factors, customer behavior, the load profile of different categories of consumers, and economic factors. Therefore, policy-makers should facilitate the creation and development of the required data for VPP implementations. Incentivizing VPP development is one way to speed up the preparation of such data.
  • Forecasting tools:
    The performance of a VPP in controlling PV, battery, and demand is mainly dependent on the reliable forecasting of WEM, weather, PV output, and electricity load. VPP owners should pay significant attention to the selection of the most accurate forecasting tools, which in many cases result in higher investment costs for the VPP owner. Therefore, the policy-maker can facilitate the use and development of such forecasting tools by encouraging and incentivizing the research in that domain and developing the right specifications for those tools.
  • ICT, data storage, and security
    One of the important prerequisites of long-term profitability of a VPP is a stable, scalable, and cost-effective ICT connectivity amongst different components within the VPP including PV, battery, demand, control system, and forecast tools. For controlling and forecasting purposes, an efficient and secured, cloud-based storage platform for data should be established. Furthermore, the ICT system should be secure enough for communication and control signals and for different types of data including consumers’ data. All these aspects require the right knowledge for the VPP owners to choose the correct and cost-effective ICT, storage, and security systems. Obviously, such arrangements will increase the cost of investment for VPP owners, and the policy-makers need to facilitate the consultation service to VPPs about this matter. Incentivizing a VPP project will again help reduce the associated costs of ICT, storage, and security.
  • Enhancing the community knowledge and involvement:
    A VPP needs to have a very good market for its services. In other words, a VPP owner should have enough customers to use the energy delivered by the VPP. Therefore, it is very critical that the community’s knowledge is increased about the advantages of a VPP, to encourage them to be involved in a VPP. The enhancement of community awareness is a collaborative task between the governments and the VPP investors. The government and policy-makers should promote the use of services provided by VPPs. On the other hand, VPP owners should provide attractive packages for the customers to encourage them to become involved in the VPP. If the VPP owner is successful in engaging customers in the investment and operation of the VPP, this collaboration will unlock many more benefits to the customers and the VPP owner.
  • Local utility interaction:
    An establishment of a VPP requires some local utility approvals for the connection of the facility to the local grid. These approvals are usually time- and money-consuming, which adversely affects the affordability of a VPP by deferring its operation. Policy-makers can develop some guidelines and procedures to facilitate such approvals for VPPs. Additionally, the VPPs can contribute to the local voltage control in the grid, for which VPP owners can receive a signal from the local utility about how to react in order to satisfy the voltage grid standard. To achieve this aim, a contractual framework is necessary, and the policy-makers should play a very active role in developing it.
  • Energy trading amongst VPPs:
    Another revenue stream for the VPPs would be energy trading amongst neighborhood VPPs in the future. A VPP can decide to purchase energy from the wholesale market or from another VPP nearby that provides more cost-effective energy. This arrangement enables purchasing local energy from another VPP without going through the electricity market arrangement and paying extra fees associated with the operation of the market. However, a network charge will be applied by the local utility for the use of the network. Policy-makers need to provide the required regulations and procedures for such local trading.

8. Conclusions

This paper investigates the detailed financial analysis of implementing a virtual power plant in Western Australia, which includes 67 residential dwellings. This VPP uses a cloud-based platform for analyzing the data and controlling the VPP, which includes rooftop solar photovoltaic (PV), vanadium redox flow battery (VRFB), heat pump hot water systems (HWSs), and management of some appliances such as washing machines, dishwashers, and dryers. The size of the rooftop solar farm is calculated and designed at 810 kW using the HelioScope software. Furthermore, the optimum charging and discharging of the 700-kWh, 350-kW VRFB is demonstrated using the proposed optimization algorithm. The study shows that the cost of energy is reduced for consumers by up to 24%, where they are engaged within the VPP. Moreover, the implementation of the VPP provides at least an 11% rate of return for the owner with less than nine years for the payback period.

Author Contributions

Conceptualization, B.B., A.B., A.G., A.A., and P.J.; methodology, B.B., A.B., and A.A.; software, B.B. and A.B.; validation, B.B. and A.G.; formal analysis, B.B. and A.B.; investigation, B.B., A.A., A.G., and P.J.; resources, B.B., A.B., A.G., and A.A.; data curation, B.B. and A.B.; writing—original draft preparation, B.B.; writing—review and editing, A.A., A.B., A.G., P.J., and A.P.; visualization, B.B., A.B., and A.G.; supervision, P.J. and A.A.; project administration, P.J. and A.G.; funding acquisition, B.B., A.G., and P.J. All authors have read and agreed to the published version of the manuscript.

Funding

This research is supported by Yaran Property Group and the Australian Department of Jobs, Tourism, Science, and Innovation, through the Science Industry PhD Fellowship Program.

Acknowledgments

The authors acknowledge the support from Yaran Property Group in providing the required data.

Conflicts of Interest

The authors declare no conflicts of interest.

References

  1. 2020 Large-Scale Renewable Energy Target Capacity Achieved; Clean Energy Regulator: Canberra, Australia, 2019.
  2. About the Renewable Energy Target. 2018. Available online: http://www.cleanenergyregulator.gov.au/RET/About-the-Renewable-Energy-Target (accessed on 31 May 2018).
  3. Ghavidel, S.; Li, L.; Aghaei, J.; Yu, T.; Zhu, J. A review on the virtual power plant: Components and operation systems. In Proceedings of the 2016 IEEE International Conference on Power System Technology (POWERCON), Wollongong, NSW, Australia, 28 September–1 October 2016; IEEE: Piscataway, NJ, USA, 2016; pp. 1–6. [Google Scholar]
  4. Ponds, K.T.; Arefi, A.; Sayigh, A.; Ledwich, G. Aggregator of demand response for renewable integration and customer engagement: Strengths, weaknesses, opportunities, and threats. Energies 2018, 11, 2391. [Google Scholar] [CrossRef] [Green Version]
  5. AEMO. Virtual Power Plant (VPP) Demonstrations. 2019. Available online: https://aemo.com.au/initiatives/major-programs/nem-distributed-energy-resources-der-program/pilots-and-trials/virtual-power-plant-vpp-demonstrations (accessed on 1 December 2018).
  6. Li, Y.; Gao, W.; Ruan, Y. Feasibility of virtual power plants (VPPs) and its efficiency assessment through benefiting both the supply and demand sides in Chongming country, China. Sustain. Cities Soc. 2017, 35, 544–551. [Google Scholar] [CrossRef]
  7. Lehmbruck, L.; Kretz, J.; Aengenvoort, J.; Sioshansi, F. Aggregation of front-and behind-the-meter: The evolving VPP business model. In Behind and Beyond the Meter; Academic Press: Cambridge, MA, USA, 2020; pp. 211–232. [Google Scholar]
  8. van Summeren, L.F.; Wieczorek, A.J.; Bombaerts, G.J.; Verbong, G.P. Community energy meets smart grids: Reviewing goals, structure, and roles in Virtual Power Plants in Ireland, Belgium and the Netherlands. Energy Res. Soc. Sci. 2020, 63, 101415. [Google Scholar] [CrossRef]
  9. Elgamal, A.H.; Kocher-Oberlehner, G.; Robu, V.; Andoni, M. Optimization of a multiple-scale renewable energy-based virtual power plant in the UK. Appl. Energy 2019, 256, 113973. [Google Scholar] [CrossRef]
  10. Parag, Y.; Ainspan, M. Sustainable microgrids: Economic, environmental and social costs and benefits of microgrid deployment. Energy Sustain. Dev. 2019, 52, 72–81. [Google Scholar] [CrossRef]
  11. Magdy, F.E.Z.; Ibrahim, D.K.; Sabry, W. Virtual Power Plants Modeling and Simulation using Innovative Electro-Economical Concept. In Proceedings of the 2019 16th Conference on Electrical Machines, Drives and Power Systems (ELMA), Varna, Bulgaria, 6–8 June 2019; IEEE: Piscataway, NJ, USA, 2019; pp. 1–5. [Google Scholar]
  12. Veilleux, G.; Potisat, T.; Pezim, D.; Ribback, C.; Ling, J.; Krysztofiński, A.; Ahmed, A.; Papenheim, J.; Pineda, A.M.; Sembian, S.; et al. Techno-economic analysis of microgrid projects for rural electrification: A systematic approach to the redesign of Koh Jik off-grid case study. Energy Sustain. Dev. 2020, 54, 1–13. [Google Scholar] [CrossRef]
  13. Royapoor, M.; Pazhoohesh, M.; Davison, P.J.; Patsios, C.; Walker, S. Building as a virtual power plant, magnitude and persistence of deferrable loads and human comfort implications. Energy Build. 2020, 213, 109794. [Google Scholar] [CrossRef]
  14. Arefi, A.; Abeygunawardana, A.; Ledwich, G. A new risk-managed planning of electric distribution network incorporating customer engagement and temporary solutions. IEEE Trans. Sustain.Energy 2016, 7, 1646–1661. [Google Scholar] [CrossRef]
  15. Wang, H.; Riaz, S.; Mancarella, P. Integrated techno-economic modeling, flexibility analysis, and business case assessment of an urban virtual power plant with multi-market co-optimization. Appl. Energy 2020, 259, 114142. [Google Scholar] [CrossRef]
  16. Loßner, M.; Böttger, D.; Bruckner, T. Economic assessment of virtual power plants in the German energy market—A scenario-based and model-supported analysis. Energy Econ. 2017, 62, 125–138. [Google Scholar] [CrossRef]
  17. Moreno, B.; Díaz, G. The impact of virtual power plant technology composition on wholesale electricity prices: A comparative study of some European Union electricity markets. Renew. Sustain. Energy Rev. 2019, 99, 100–108. [Google Scholar] [CrossRef]
  18. Dietrich, K.; Latorre, J.M.; Olmos, L.; Ramos, A. Modelling and assessing the impacts of self supply and market-revenue driven Virtual Power Plants. Electr. Power Syst. Res. 2015, 119, 462–470. [Google Scholar] [CrossRef]
  19. German virtual power plant project using 25 BlueGen mCHP units. Fuel Cells Bull. 2012, 2012, 4. [CrossRef]
  20. Zajc, M.; Kolenc, M.; Suljanović, N. Virtual power plant communication system architecture. In Smart Power Distribution Systems; Yang, Q., Yang, T., Li, W., Eds.; Academic Press: Cambridge, MA, USA, 2019; pp. 231–250. [Google Scholar]
  21. Taskforce, E.T. Registration and Participation Framework in the Wholesale Electricity Market. Australia, 2020. Available online: https://www.wa.gov.au/sites/default/files/2020-03/Registration%20and%20Participation%20Framework%20in%20the%20Wholesale%20Electricity%20Market.pdf (accessed on 28 February 2020).
  22. Australian PV Institute. PV Performance by Climate Region. Available online: https://pv-map.apvi.org.au/performance (accessed on 1 January 2007).
  23. Lombardi, P.; Sokolnikova, T.; Styczynski, Z.; Voropai, N. Virtual power plant management considering energy storage systems. IFAC Proc. Vol. 2012, 45, 132–137. [Google Scholar] [CrossRef]
  24. Sun, Z.W.; Duan, Z.N.; Bai, J.Q.; Wang, Y. Numerical study of the performance of all vanadium redox flow battery by changing the cell structure. J. Energy Storage 2020, 29, 101370. [Google Scholar] [CrossRef]
  25. Lourenssen, K.; Williams, J.; Ahmadpour, F.; Clemmer, R.; Tasnim, S. Vanadium redox flow batteries: A comprehensive review. J. Energy Storage 2019, 25, 100844. [Google Scholar] [CrossRef]
  26. Ontiveros, L.J.; Mercado, P.E. Modeling of a vanadium redox flow battery for power system dynamic studies. Int. J. Hydrog. Energy 2014, 39, 8720–8727. [Google Scholar] [CrossRef]
  27. Dassisti, M.; Mastrorilli, P.; Rizzuti, A.; Cozzolino, G.; Chimienti, M.; Olabi, A.G.; Matera, F.; Carbone, A. Vanadium: A transition metal for sustainable energy storing in redox flow batteries. In Reference Module in Materials Science and Materials Engineering; Elsevier BV: Amsterdam, The Netherlands, 2016. [Google Scholar]
  28. Balint, A.; Kazmi, H. Determinants of energy flexibility in residential hot water systems. Energy Build. 2019, 188–189, 286–296. [Google Scholar] [CrossRef]
  29. Willem, H.; Lin, Y.; Lekov, A. Review of energy efficiency and system performance of residential heat pump water heaters. Energy Build. 2017, 143, 191–201. [Google Scholar] [CrossRef] [Green Version]
  30. Baniasadi, A.; Habibi, D.; Al-Saedi, W.; Masoum, M.A.; Das, C.K.; Mousavi, N. Optimal sizing design and operation of electrical and thermal energy storage systems in smart buildings. J. Energy Storage 2020, 28, 101186. [Google Scholar] [CrossRef]
  31. Fischer, D.; Madani, H. On heat pumps in smart grids: A review. Renew. Sustain. Energy Rev. 2017, 70, 342–357. [Google Scholar] [CrossRef] [Green Version]
  32. Baniasadi, A.; Habibi, D.; Bass, O.; Masoum, M.A. Optimal real-time residential thermal energy management for peak-load shifting with experimental verification. IEEE Trans. Smart Grid 2018, 10, 5587–5599. [Google Scholar] [CrossRef]
  33. Terreros, O.; Spreitzhofer, J.; Basciotti, D.; Schmidt, R.R.; Esterl, T.; Pober, M.; Kerschbaumer, M.; Ziegler, M. Electricity market options for heat pumps in rural district heating networks in Austria. Energy 2020, 196, 116875. [Google Scholar] [CrossRef]
  34. Energy Use in the Australian Residential Sector 1986-2020 [Electronic Resource]/Department of the Environment, Water, Heritage and the Arts (PANDORA electronic collection)). Canberra, A.C.T: Department of the Environment, Water, Heritage and the Arts. 2008. Available online: https://nla.gov.au/nla.cat-vn4390814 (accessed on 1 January 2008).
  35. Marszal-Pomianowska, A.; Heiselberg, P.; Larsen, O.K. Household electricity demand profiles–A high-resolution load model to facilitate modelling of energy flexible buildings. Energy 2016, 103, 487–501. [Google Scholar] [CrossRef]
  36. Ren, Z.; Foliente, G.; Chan, W.Y.; Chen, D.; Ambrose, M.; Paevere, P. A model for predicting household end-use energy consumption and greenhouse gas emissions in Australia. Int. J. Sustain. Build. Technol. Urban Dev. 2013, 4, 210–228. [Google Scholar] [CrossRef] [Green Version]
  37. McGee, C. Energy. 2013. Available online: https://www.yourhome.gov.au/energy (accessed on 1 January 2013).
  38. Shi, Q.; Chen, C.F.; Mammoli, A.; Li, F. Estimating the profile of incentive-based demand response (IBDR) by integrating technical models and social-behavioral factors. IEEE Trans. Smart Grid 2019, 11, 171–183. [Google Scholar] [CrossRef]
  39. Authority, E.R. Wholesale Electricity Market Rules. 2020. Available online: https://www.erawa.com.au/rule-change-panel/wholesale-electricity-market-rules (accessed on 27 March 2020).
  40. Power, W. 2019/20 Price List. Available online: https://westernpower.com.au/media/3361/price-list-2019-2020.pdf (accessed on 28 February 2019).
  41. Registry, R. Small Generation Unit STC Calculator. 2020. Available online: https://www.rec-registry.gov.au/rec-registry/app/calculators/sgu-stc-calculator (accessed on 1 January 2020).
  42. Regulator, C.E. Small-Scale Systems Eligible for Certificates. 2019. Available online: http://www.cleanenergyregulator.gov.au/RET/Scheme-participants-and-industry/Agents-and-installers/Small-scale-systems-eligible-for-certificates (accessed on 20 February 2019).
  43. AEMO. Benchmark Reserve Capacity Price. 2020. Available online: https://aemo.com.au/energy-systems/electricity/wholesale-electricity-market-wem/wa-reserve-capacity-mechanism/benchmark-reserve-capacity-price (accessed on 1 January 2020).
  44. AEMO. WEM Price Data Dashboard. Available online: https://aemo.com.au/energy-systems/electricity/wholesale-electricity-market-wem/data-wem/data-dashboard (accessed on 1 January 2006).
Figure 1. The proposed architecture of the virtual power plant (VPP) in Western Australia (WA).
Energies 13 02614 g001
Figure 2. The proposed architecture of the VPP in WA.
Energies 13 02614 g002
Figure 3. The photovoltaic (PV) generation during a year within the VPP compared to the real data measured in WA.
Energies 13 02614 g003
Figure 4. The load profile and PV production for a sample week in summer; excess PV generation is equal to PV generation minus the total load.
Energies 13 02614 g004
Figure 5. The simulated load profiles and the variations in different seasons.
Energies 13 02614 g005
Figure 6. The simulated air conditioner load profile.
Energies 13 02614 g006
Figure 7. The charging hour priority for the vanadium redox flow batteries (VRFB) for a sample day.
Energies 13 02614 g007
Figure 8. The average annual energy cost per dwelling with and without VPP (AUD).
Energies 13 02614 g008
Figure 9. The average annual energy cost per dwelling with and without VPP (AUD).
Energies 13 02614 g009
Figure 10. The breakdown of net present value (NPV) revenue (AUD) over 20 years for the VPP in the cases I to IV, defined at the beginning of this section.
Energies 13 02614 g010aEnergies 13 02614 g010b
Figure 11. The breakdown of NPV revenue (AUD) over 20 years for the VPP in Case I.
Energies 13 02614 g011
Figure 12. The charging and discharging of VRFB during a sample day in Case I.
Energies 13 02614 g012
Table 1. Daily appliance consumption in weekdays and weekends. PC—personal computer.
ApplianceWeekdayWeekendUsage TimeWatts
Coffee maker40% from 6–10 a.m.;
30% from 4–7 p.m.
40% from 8–10 a.m.;
30% from 4–7 p.m.
10 min900
–1400
Microwave40% 7–10:30 a.m.;
20% 12–2 p.m.; 20% 6–8 p.m.
40% 7–10:30 a.m.;
20% 12–2 p.m.; 20% 6–8 p.m.
5 min750
–1100
Toaster50% 6–10:30 a.m.;
10% 11.30–1 p.m.; 10% 6–8 p.m.
50% 8–10:30 a.m.;
10% 11.30–1 p.m.; 10% 6–8 p.m.
3 min800
–1400
Iron5% 7–8 a.m.;
5% 10–11 a.m.; 5% 6–8 p.m.
5% 10–11 a.m.; 5% 6–8 p.m.15 min1000
–1800
Stereo system10% 9 a.m.–1 p.m.;
20% 4–10 p.m.
20% 9 a.m.–4 p.m.;
40% 4–10.30 p.m.
30–90 min65
–225
Hair dryer30% 5.30–9:30 a.m.;
10% 11.30–1 p.m.; 30% 8–10 p.m.
10% 11.30–1 p.m.;
40% 7.30–10.30 p.m.
5 min1200
–2000
Laptop50% 10.30 a.m.–2 a.m.50% 10.30 a.m.–2 a.m.90–180 min 50
PC/monitor30% 9.30 a.m.–9 p.m.40% 9.30 a.m.–9 p.m.90–180 min 150
Television30% 9.30 a.m.–2 a.m.;
20% 6–11 p.m.
30% 9.30 a.m.–2 a.m.;
50% 6–11 p.m.
90–180 min 65
–175
Refrigerator, freezer100% All time (thermostatically controlled)100% All time (thermostatically controlled)Cont.100–200
Vacuum10% 9 a.m.–5 p.m.15% 9 a.m.–5 p.m.30 min600
–1800
Deep fryer10% 11–2 p.m.; 15% 5–8 p.m.10% 11–2 p.m.; 15% 5–8 p.m.18 min600
–1000
Oven20% 10.30 a.m.–12.30 a.m.;
25% 5.30–8.30 p.m.
30% 10.30 a.m.–12.30 a.m.;
25% 5.30–8.30 p.m.
44 min1000
–1800
Kettle30% 7:30–10.30 a.m.;
40% 1.30–4.30 p.m.; 10% 6–8 p.m.
30% 7:30–10.30 a.m.;
40% 1.30–4.30 p.m.; 10% 6–8 p.m.
3 min2000
–2500
Stove20% 7–9 a.m.;
20% 10.30 a.m.–1.30 p.m.;
20% 5.30–8.30 p.m.
10% 7–9 a.m.;
20% 10.30 a.m.–1.30 p.m.;
20% 5.30–8.30 p.m.
30 min1000
–2000
Dishwasher *40% 10.30 a.m.–3.30 p.m.60% 10.30 a.m.–3.30 p.m.20–60 min 1200
–2400
Washing machine *10% All time except 15–2120% All time except 15–2120–60 min 500
–1300
* The timing is different depending on whether demand management is applied to the appliances or not. The time is randomly chosen between the minimum and maximum values in each day.
Table 2. Major load variations in spring/autumn. HWS—hot water system.
ApplianceWeekdayWeekendWatts
Lighting70% 6 p.m.–11 p.m.–10% 5–7.30 a.m.
10% 8 p.m.–3 a.m.
70% 6 p.m.–11 p.m.
25% 8 p.m.–1 a.m.
10–100
Heat pump HWS75% 9.30 a.m.–4 p.m.75% 9.30 a.m.–4 p.m.550
Air conditioner60% 6 a.m.–10 a.m.; 65% 5 p.m.–10 p.m.; 50% other60% 6 a.m.–10 a.m.;
65% 5 p.m.–10 p.m.; 55% other
1000–3000
Table 3. Major load variations in summer.
ApplianceWeekdayWeekendWatts
Lighting70% 7 p.m.–11 p.m.–10% 5–7.30 a.m.
10% 8 p.m.–3 a.m.
70% 7 p.m.–11 p.m.–
25% 8 p.m.–3 a.m.
10–100
Heat pump HWS70% 9.30 a.m.–4 p.m.70% 9.30 a.m.–4 p.m.550
Air conditioner60% 11 a.m.–4.30 p.m.
80% 4.30 p.m.–10 p.m.; 50% other
70% 11 a.m.–4.30 p.m. 85% 4.30 p.m.–10 p.m., 55% other1000–3000
Table 4. Major load variations in winter.
ApplianceWeekdayWeekendWatts
Lighting70% 5 p.m.–11 p.m.–10% 5–7.30 a.m.
10% 8 p.m.–1 a.m.
70% 5 p.m.–11 p.m.–
20% 8 p.m.–1 a.m.
10–100
Heat pump HWS80% 9.30 a.m.–4 p.m.80% 9.30 a.m.–4 p.m.550
Air conditioner60% 6 a.m.–5 p.m.; 70% 5–12 p.m.; 55% other70% 6–5 a.m.; 80% 5–12 p.m.;
60% other
1000–3000
Table 5. Manageable/shiftable loads.
ApplianceWorking Time
DishwasherBetween 10 and 16 h
Dryer and washing machineAny time except 15–21 h
Heat pump HWSBetween 9 and 17 h
Table 6. The parameters of the fmincon function in Matlab.
ParameterValue
AlgorithmSQP
Constraint tolerance1 × 10−20
Optimality tolerance1 × 10−20
Step tolerance1 × 10−20
Max iterations1000
Max function evaluations50,000
Table 7. The costs of the equipment. AUD—Australian dollars.
EquipmentAUD
PV, 810 kW530,000 (lifetime = 25 years)
Inverters for 810-kW PV124,000 (replacement at year 11)
PV installation500,000
VRFB, 350 kW, 700 kWh600,000, payable in 4 instalments over 4 years (lifetime = 25 years)
Battery installation30,000
67 × heat pump HWS, 220 L165,000
Table 8. The costs of the RT16 tariff.
Fixed Cost (Cents/Day)Peak (Cents/kWh): 8:00 a.m. to 10:00 p.m., Monday to FridayOff-Peak (cents/kWh): 10:00 p.m. to 8:00 a.m., Monday to Friday and All Times on Saturday and Sunday
299.58015.9543.646
Table 9. The tariff of the VPP for the residents.
Fixed Cost (Cents/Day)Peak (Cents/kWh): 4:00 p.m. to 10:00 p.m.Shoulder (Cents/kWh): 8:00 a.m. to 4:00 p.m.Off-Peak (Cents/kWh): 10:00 p.m. to 8:00 a.m.Free Electricity: 10:00 a.m. to 2:00 p.m.
103.326354.8128.7115.100.00

