Article

Carbon Dioxide Emissions and Their Driving Forces of Land Use Change Based on Economic Contributive Coefficient (ECC) and Ecological Support Coefficient (ESC) in the Lower Yellow River Region (1995–2018)

1
Key Laboratory of Geospatial Technology for Middle and Lower Yellow River Region, Research Center of Regional Development and Planning, Institute of Agriculture and Rural sustainable Development, Henan University, Kaifeng 475004, China
2
Collaborative Innovation Center on Yellow River Civilization of Henan Province, Henan University, Kaifeng 475001, China
3
Guangzhou Institute of Geography, Guangzhou 510070, China
4
Key Laboratory of Guangdong for Utilization of Remote Sensing and Geographical Information System, Guangzhou 510070, China
5
Guangdong Open Laboratory of Geospatial Information Technology and Application, Guangzhou 510070, China
*
Authors to whom correspondence should be addressed.
Energies 2020, 13(10), 2600; https://doi.org/10.3390/en13102600
Submission received: 14 April 2020 / Revised: 4 May 2020 / Accepted: 8 May 2020 / Published: 20 May 2020
(This article belongs to the Section B: Energy and Environment)

Abstract

:
Land use change is the second largest source of greenhouse gas emissions after fossil combustion, which can hurt ecological environment severely. Intensive study on land use carbon emissions is of great significance to alleviate environmental pressure, formulate carbon emission reduction policy, and protect ecological development. The lower Yellow River area is an important area of economic development, grain cultivation, and agricultural production in China. Land use change has significant economic, environmental, and ecological impacts in this region. Deep study of land used carbon emissions and its influencing factors in the lower Yellow River area is not only of great significance to the environmental improvement in the Yellow River basin, but also can provide references for the research of other basins. Based on this, this paper studies the land use carbon emissions of 20 cities in the lower Yellow River area from 1995 to 2018. The results showed that from 1995 to 2018, the land use change was characterized by the decrease of the ecological land and the increase of the built-up land significantly. The overall carbon emission of the lower Yellow River area is increasing, and the built-up land is the main factor that leads to the increase of carbon emission, which can be also proven by the analysis of the Stochastic Impacts by Regression on Population, Affluence, and Technology (STIRPAT) model. The economic contributive coefficient (ECC) and ecological support coefficient (ESC) of carbon emission in the lower Yellow River area show a trend of high in Zhengzhou, Jinan, and Zibo and low in Zhoukou, Shangqiu, and Heze, and there was no significant changes during the study period, which indicates that each city did not achieve the coordinated development of the ecological economy. Finally, analysis results of the STIRPAT model indicated that the area of built-up land had the greatest impact on land use carbon emissions, followed by tertiary industry, whereas per capita gross domestic product (GDP) had the smallest impact. For every 1% increase in the area of built-up land, carbon emissions increased by 1.024%. By contrast, for every 1% increase in the contribution of tertiary industry to the GDP and per capita GDP, carbon emissions decreased by 0.051% and 0.034%, respectively. According to the study, there are still many problems in the coordinated development of economy and ecology in the lower Yellow River area. The lower Yellow River area should control the expansion of built-up land, afforestation, development of technology, reduction of carbon emissions, and promotion of the high-quality development of the Yellow River Basin.

Graphical Abstract

1. Introduction

Global environmental problems represent the most serious challenges faced by humans [1,2], among which climate change caused by greenhouse gas (GHG) emissions is the major impediment to sustainable development [3]. Land use is an important means of assessing human socioeconomic activities [4]. With societal development, the pattern, breadth, and intensity of land use are continuously changing, exerting profound impacts on all aspects of the environment, thereby aggravating global environmental problems [5]. Human activities are the main driver of the increase in carbon dioxide emissions. The use of fossil fuels and overexploitation of natural resources have led to the rapid growth in GHG concentrations, which has become a problem of great concern in the international community that must be clearly understood and resolved [6,7,8]. Land use type mirrors socioeconomic activities, such as urban development, food production, and human life [9]. After fossil fuel combustion, land use change is the second largest source of GHG emissions, and unsustainable land use will lead to more GHG emissions into the atmosphere [10,11].
With carbon emissions from land use increasing, researchers have carried out a large body of research to thoroughly analyze the internal mechanisms by which land use releases carbon into the atmosphere via human activities. To mitigate such emissions through low-carbon emission reduction policies, it is important to further analyze the influencing factors of land use carbon emissions. Recent research has focused on the carbon emission mechanisms of urban land expansion and agricultural land internal transformation [12,13,14], mainly through the impact mechanism of land use carbon emissions [15,16,17], land use carbon emission effect [18], carbon dynamics of urbanization [19], calculation of land use carbon emission intensity [20,21], and relationship between land use, energy consumption, and carbon emission [22]. Such research provides a scientific basis for formulating scientific carbon dioxide emission reduction policies, among which the Logarithmic Mean Divisia Index (LMDI) method and Stochastic Impacts by Regression on Population, Affluence, and Technology (STIRPAT) model are the two most common methods. For instance, Zhu [23], Wang [24], and Tan [25] used the LMDI model to study China’s carbon dioxide emissions in terms of population, per capita gross domestic product (GDP), energy consumption, and energy consumption structure. More specifically, Guo [26] and Liu [27] analyzed the influencing factors of carbon emissions in Shanghai and Beijing, respectively. However, the LMDI model cannot analyze the influencing factors of carbon emissions in detail, whereas the STIRPAT model can analyze more influencing factors than the LMDI model. Thus, academic applications of the STIRPAT model are increasing. Shi [28] and Fan [29] used the STIRPAT model to analyze the influencing factors of carbon dioxide emissions in the world and countries at different income levels, respectively. Moreover, Wang [30] adopted the improved STIRPAT model, combined with partial least squares regression, to study the effects of urbanization level, economic level, industrial proportion, tertiary industry’s proportion of GDP, energy intensity, and research and development output on carbon dioxide emissions in Beijing. These studies have proven that the STIRPAT model is effective for carbon dioxide impact factor analysis.
With the continuous development of China’s economy and urbanization, growing areas of agricultural land are being converted into built-up land, and the area of cultivated land is decreasing. As a result, the carbon emissions of land use are increasing, exacerbating related environmental problems [18,31]. Thus, development in China is at a critical point in terms of balancing the relationship between the economy and the environment through reducing carbon dioxide emissions. Therefore, comprehensive accounting of land use carbon emissions and an in-depth analysis of the driving mechanisms in China are critical to mitigate GHG emissions, formulate rational carbon emission reduction policies, and ensure coordinated economic development and environmental protection [32,33].
Research on the carbon emissions of land use in China have mainly focused on trends in land use carbon emissions [34], land use carbon effect [35,36], and land use low-carbon optimization [37]. The research on land use carbon emissions has mostly focused on the national [38,39] or provincial level, and provincial-scale research has mostly been concentrated in the provinces of Hunan [40], Jiangsu [41], Hubei [42], Liaoning [43], and Henan [44]. By contrast, few studies have investigated land use carbon emissions within cities and river basins. The Yellow River is the sixth longest river in the world and the second largest river in China. It flows through nine provinces and regions, with a basin area of more than 750,000 km2. It is an area rich in natural, historical, and cultural resources in China [45]. The lower Yellow River area flows through Henan and Shandong Provinces, and is an important food production area in China. Thus, the economic and environmental developments are important in the lower Yellow River area. However, with the increase in population and advancing urbanization, carbon dioxide emissions are increasing, and environmental problems are becoming increasingly serious. Therefore, it is necessary to study the carbon emissions of land use in the lower Yellow River area to support high-quality sustainable development [46].
With this background, this study analyzed the spatiotemporal changes in land use carbon emissions in the lower Yellow River area from economic and ecological aspects, and analyzed the influencing factors of land use carbon emissions. To this end, this study used economic and land use data from 20 prefecture-level cities in Henan and Shandong Provinces from 1995 to 2018 and applied the STIRPAT model to them. This study provides a theoretical reference for the low-carbon development of the lower Yellow River area and similar regions, and provides a reference for the optimization of regional land use structure and reducing the environmental problems caused by increasing carbon emissions.

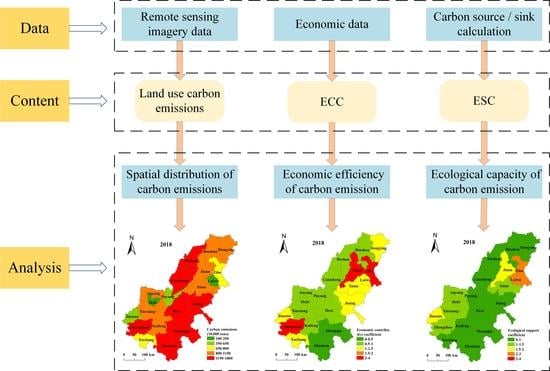
2. Material and Methods
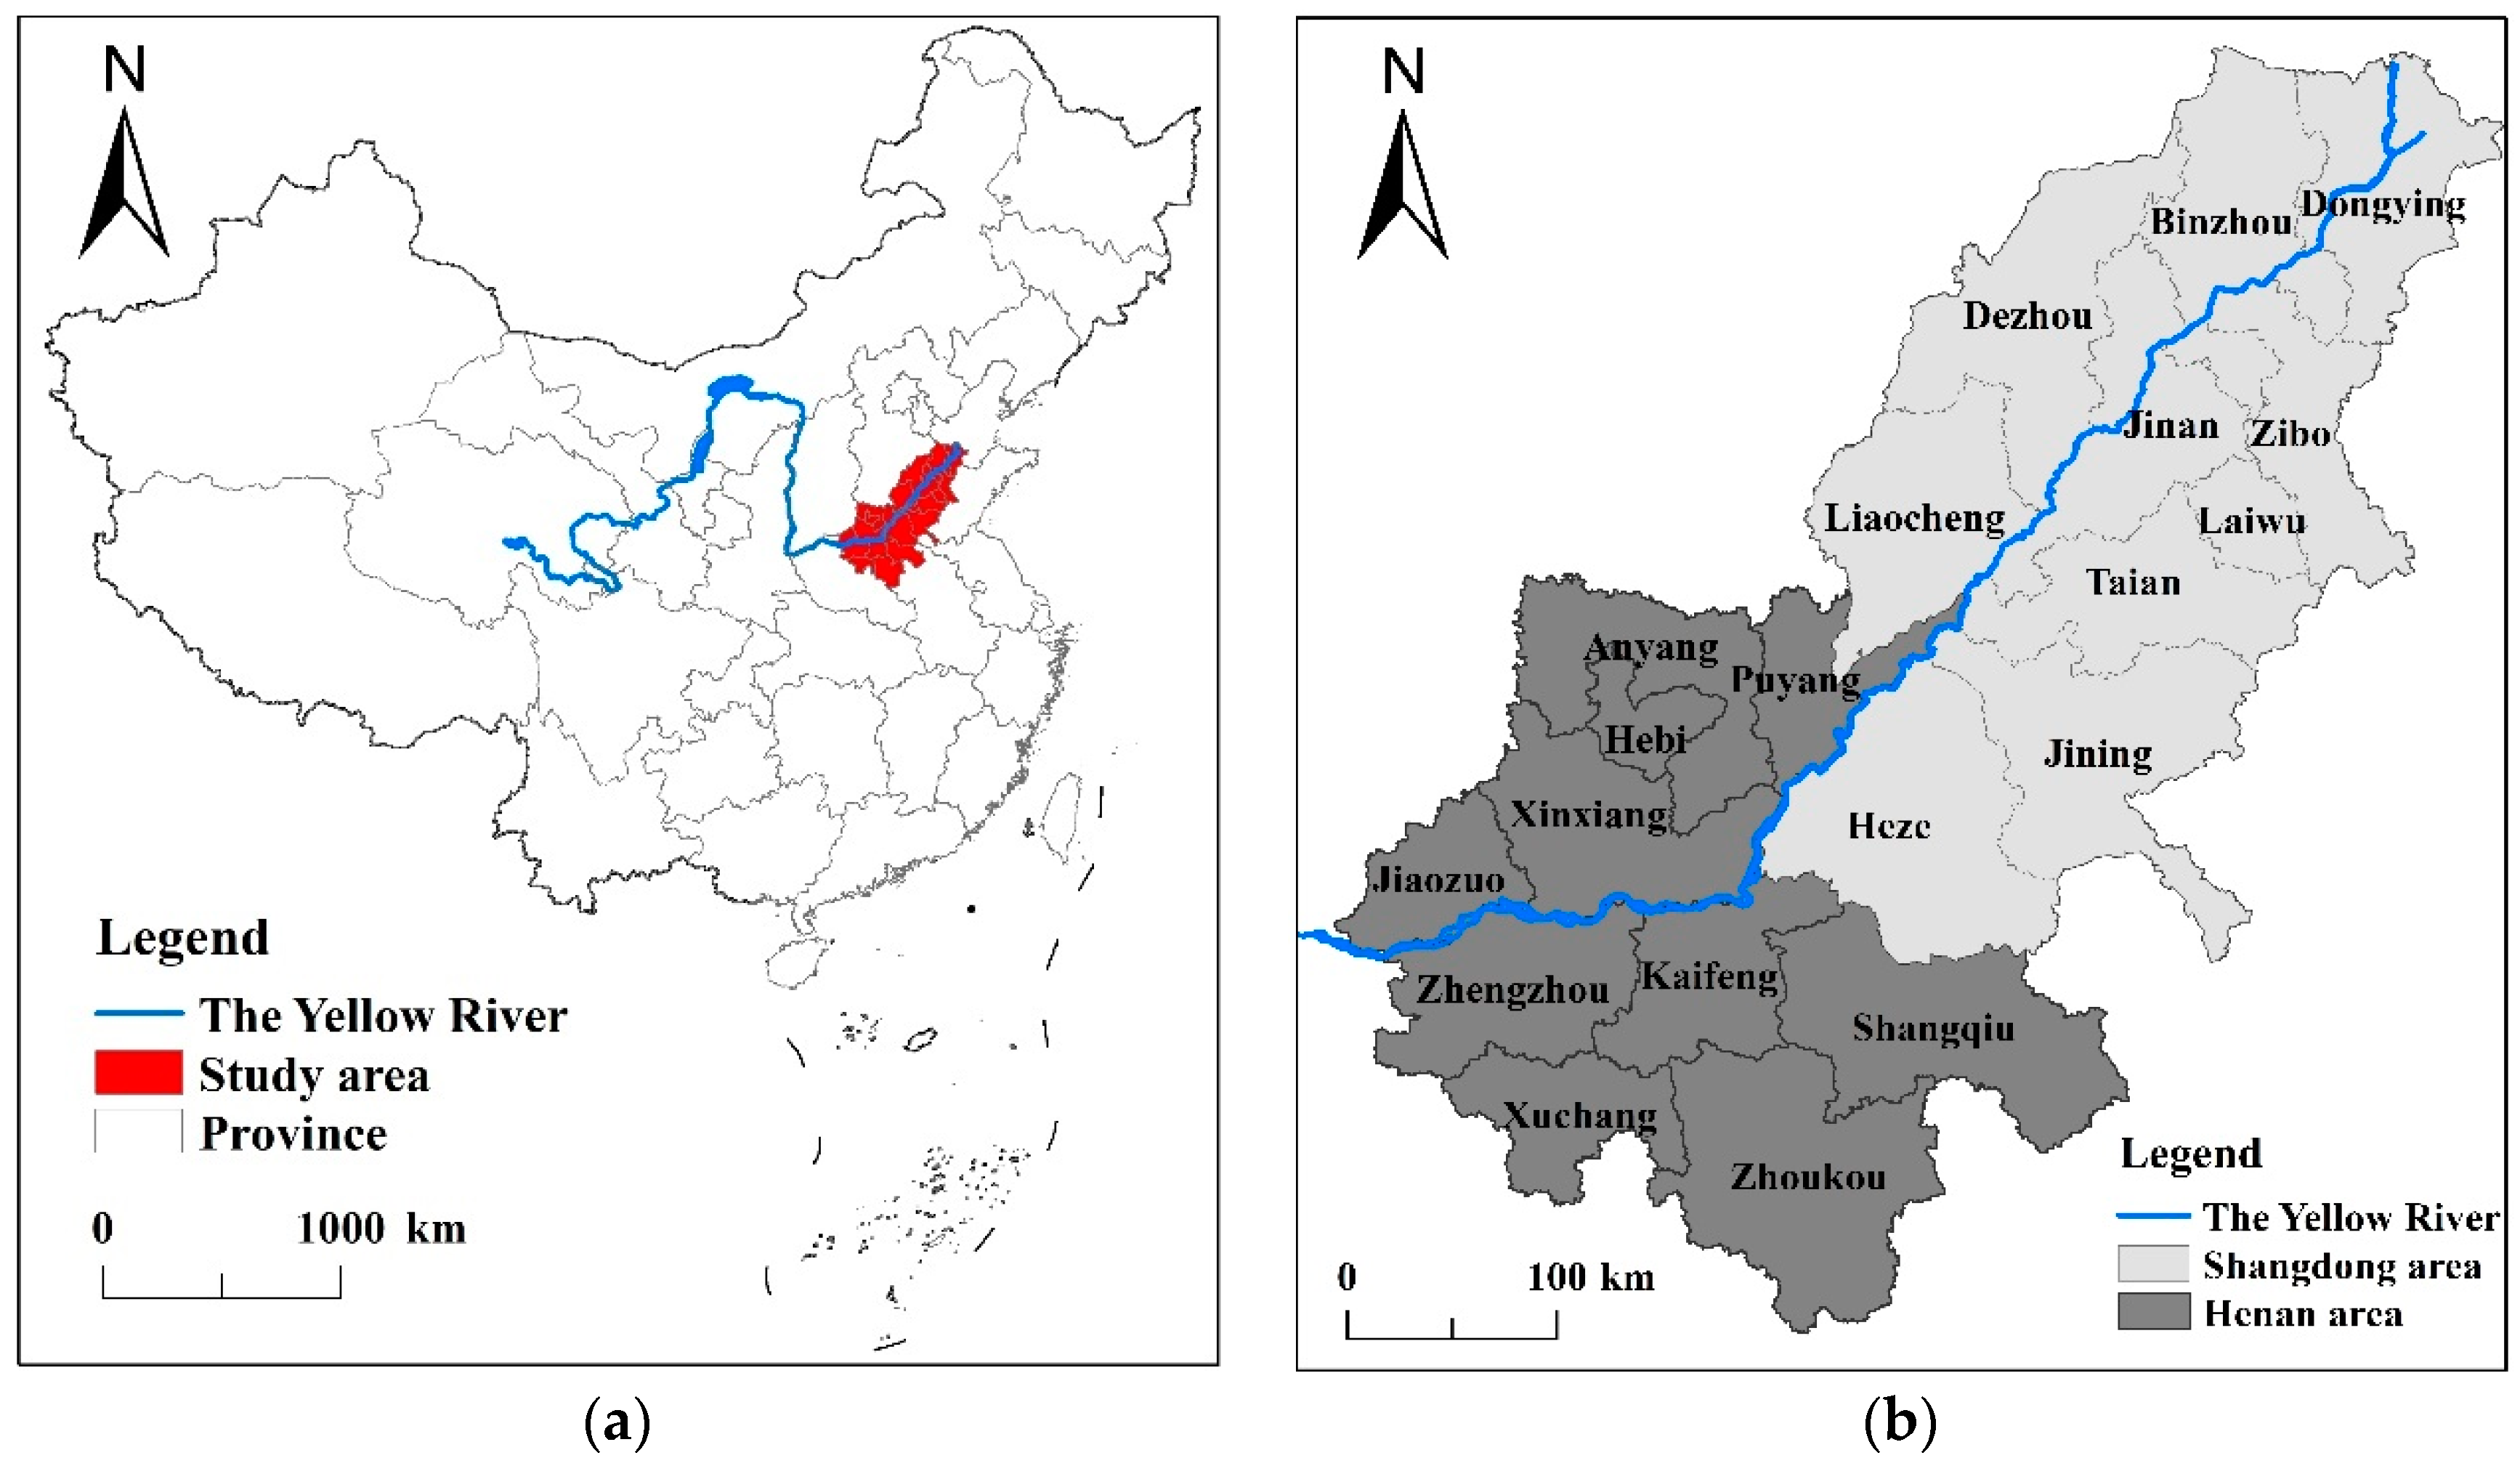
2.1. Study Area

The total length of the lower Yellow River area from Taohuayu to Lijin is 786 km, with a drainage area of 23,000 km2 that accounts for 3% of the area of the Yellow River Basin. This area experiences a temperate monsoon climate. The lower reaches of the Yellow River flow through two provinces, Henan and Shandong. It is an important grain producing area in China, with well-developed agriculture and fertile land. Henan and Shandong are the most populous and agricultural provinces in China, and they are in the stage of urbanization. Based on the close relationship between regional economic development and the lower reaches of the Yellow River and the integrity of prefecture level administrative divisions, we referred to relevant literature [47,48]. This study selected 20 prefecture-level cities in Shandong and Henan provinces, which are the affected areas of the lower reaches of the Yellow River, as the study areas (Figure 1). Considering the development of the lower Yellow River area in recent decades and the availability of data, this study selected 1995–2018 data to analyze.

2.2. Data Sources

The data sources of land use carbon emissions research in the lower Yellow River area mainly included statistical yearbook data, remote sensing imagery data, and data from previous research.
  • Statistical yearbook data: This study obtained GDP, population, per capita GDP, and tertiary industry contribution to GDP for the 20 prefecture-level cities in the lower Yellow River area for 1995, 2005, 2010, and 2018. The data for 1995, 2005, and 2010 were from the 1996, 2006, and 2011 Henan Statistical Yearbook and the Shandong Statistical Yearbook. Social data for 2018 were obtained from the statistical websites of the investigated cities (Table S1) (Note: This study standardized the data before analysis).
  • Remote sensing imagery data: Remote sensing imagery data were obtained from the Resource and Environmental Science Data Center of the Chinese Academy of Sciences (http://www.resdc.cn).
  • Research data: This study obtained carbon emission coefficients of land use (cultivated land, woodland, unused land, built-up land, and water area) [49,50].

2.3. Methods

2.3.1. Dynamic Degree of Land Use

The dynamic degree of a single land use type expresses the quantity change of a given land use type within a given time range in a defined research area [51,52] and is calculated as follows:
K = U b U a U a × 100 %
where K is the single dynamic degree of a given land use type and UaUb is the beginning and the end of the considered period of the areas of the land use type.

2.3.2. Carbon Emission/Absorption Model of Land Use

Based on land use data from 1995, 2005, 2010, and 2018 in the lower Yellow River area and combined with previous research [53], the carbon emissions of cultivated land, woodland, water area, built-up land, and unused land in 20 prefecture-level cities were calculated in the lower Yellow River area.
  • The land use carbon emissions of cultivated land, woodland, water area, and unused land, other than built-up land, were calculated as [49]:
    E U c e = S i × ε i
    where EUce is the land use carbon emissions, Si is the area of the i-th land type, and εi is the carbon emission coefficient per unit area corresponding to the i-th land use type. Positive values represent emissions and negative values represent absorption. Table 1 presents the carbon emission coefficients of each land use type, except built-up area, as previously calculated [53].
  • The carbon emissions of built-up land were calculated by multiplying the area of built-up land with carbon sources and sinks, as follows [50]:
    E U c b = S i × ξ i × δ i
    where EUcb is the carbon emission of built-up land, ξi is the carbon source coefficient of built-up land, 56.46 t/hm2·a (ton/square hectometer·annually), and δi is the carbon sink coefficient of built-up land, 2.38 t/hm2·a.
  • Based on Equations (2) and (3), the total land use carbon emission was obtained, as follows:
    E U = E U c e + E U c b
    where EU is the total carbon emission, EUce is the carbon emission of land use other than built-up land, and EUcb is the carbon emission of built-up land.

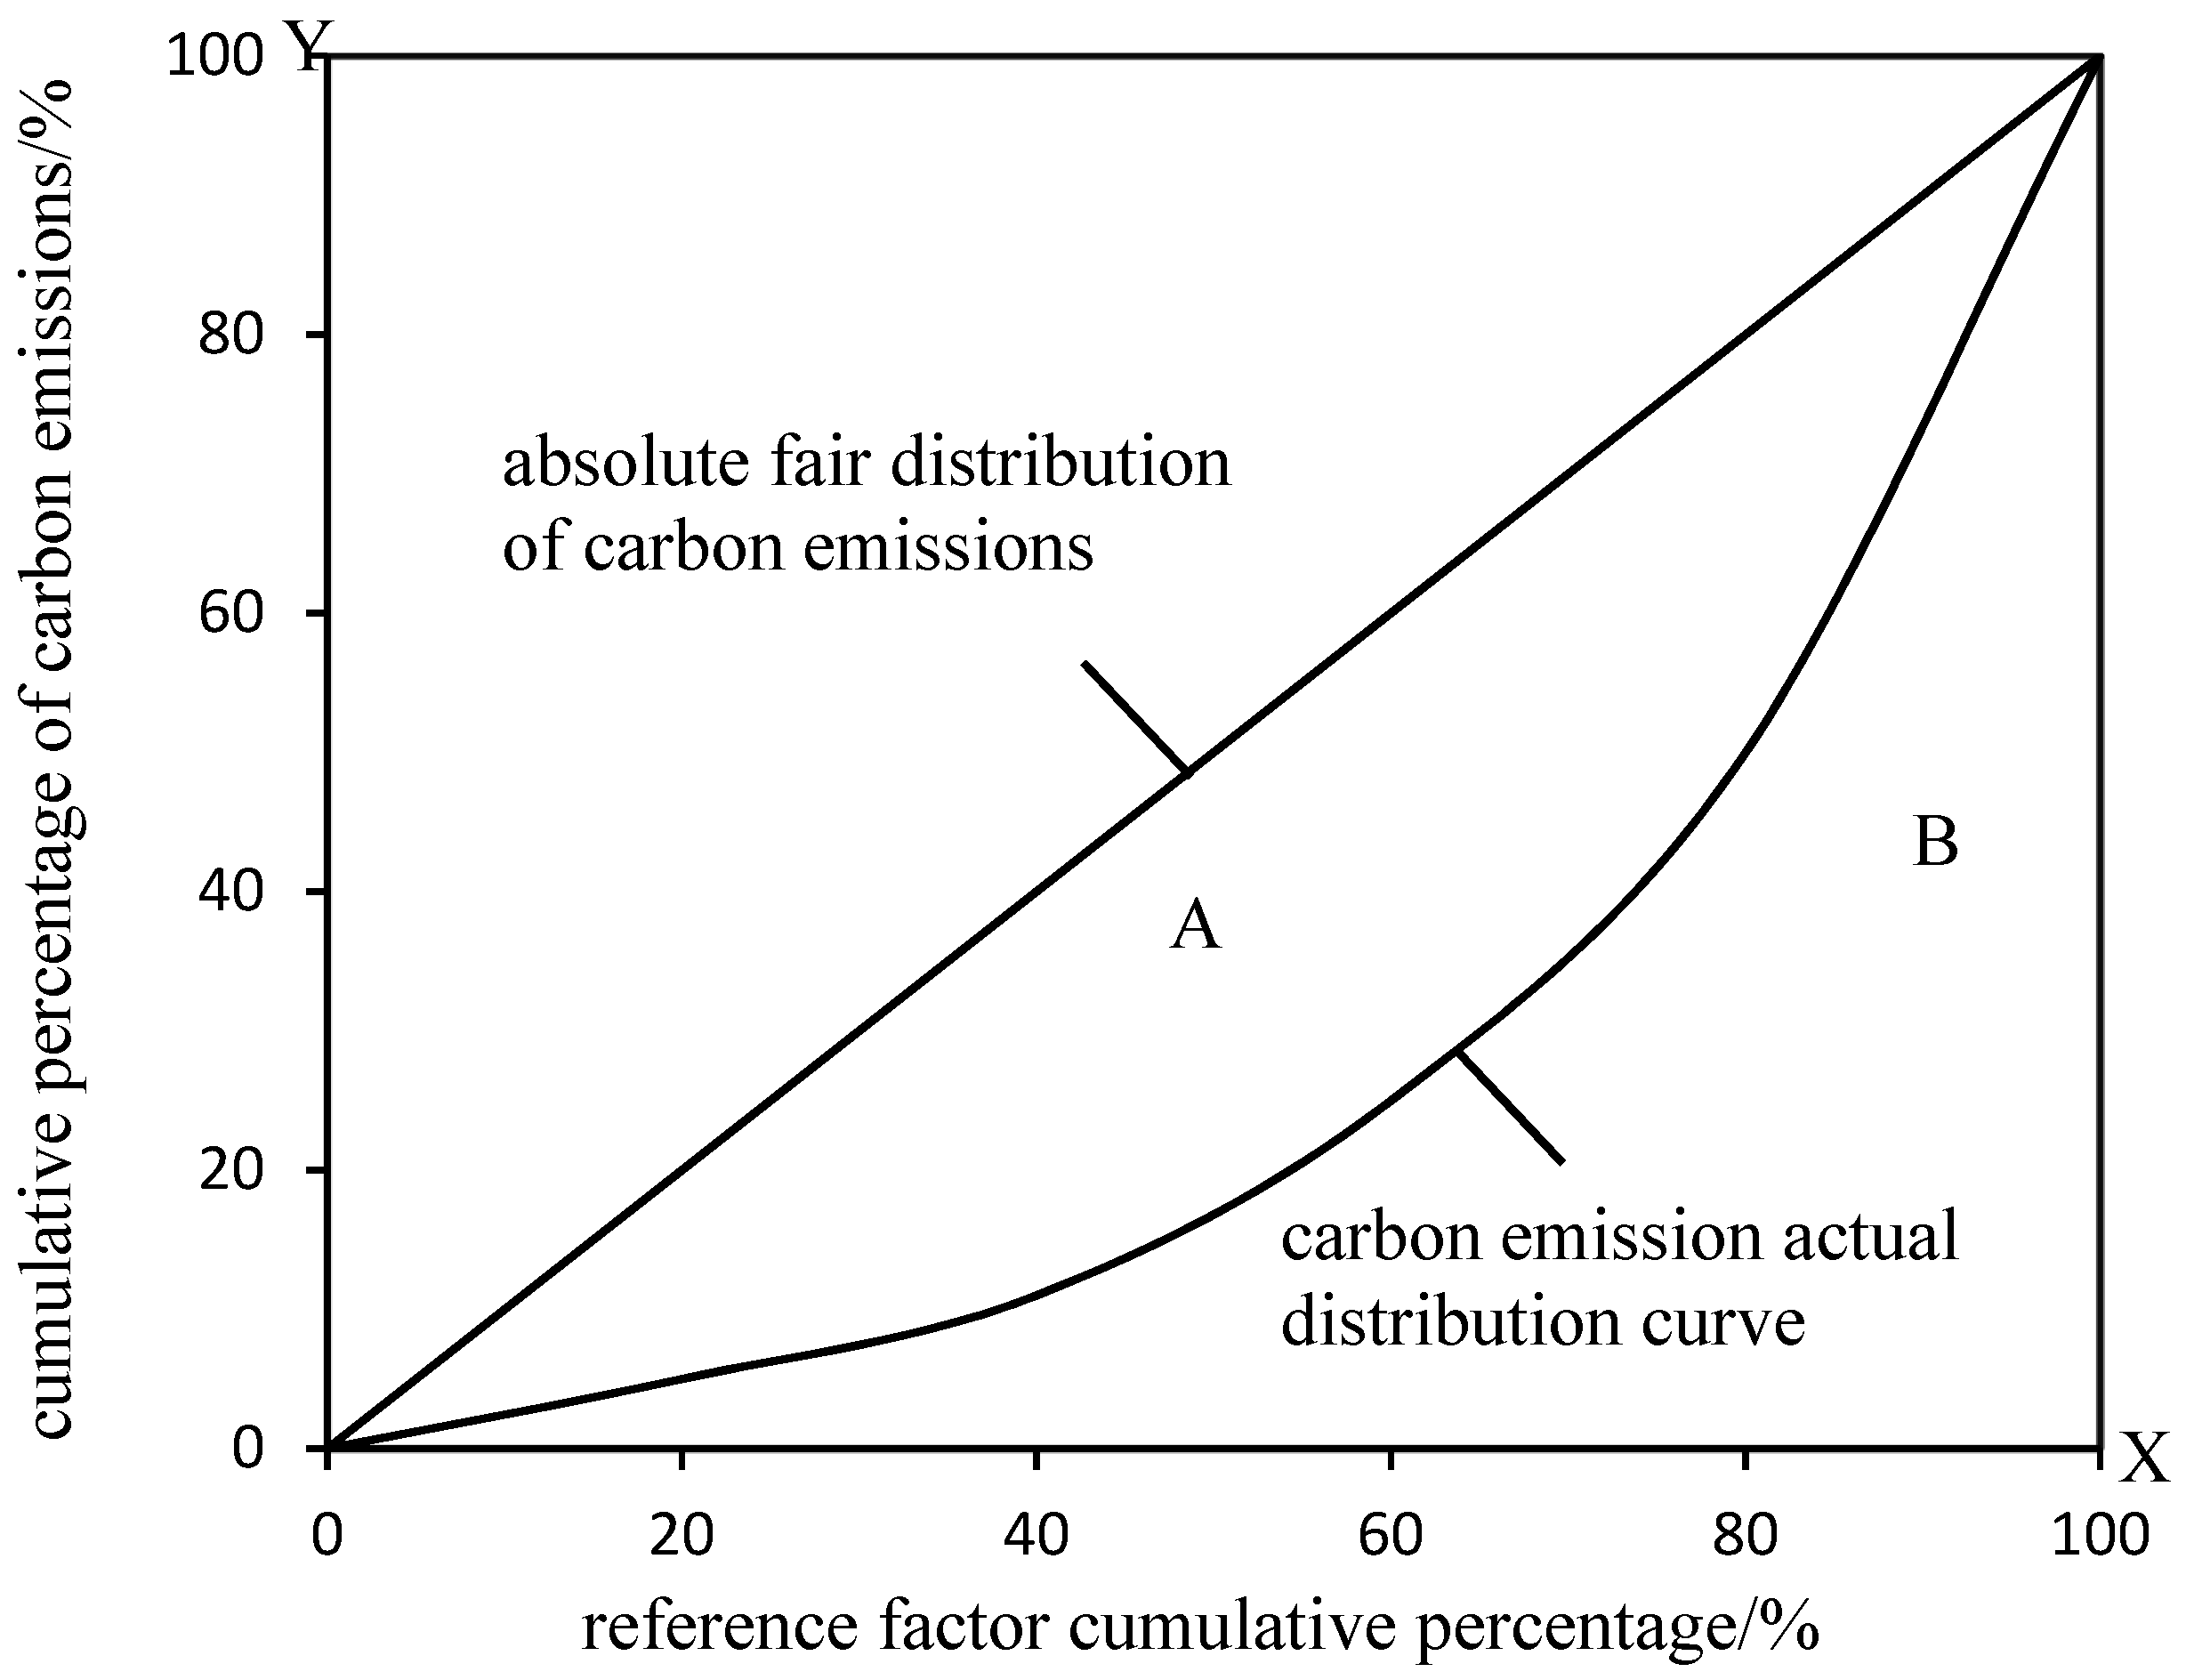
2.3.3. Carbon Emission Equity Evaluation Model

According to the Lorenz curve, the Gini coefficient is put forward by the Italian economist Gini, which is widely used as a comprehensive index to investigate the difference of income distribution among residents [54,55]. In this paper, the Gini coefficient and carbon emission characteristics are combined, and the carbon emission equity evaluation model is cited [56] (Figure 2).

Economic Efficiency Model of Carbon Emission

In the carbon emission economic efficiency model, the vertical axis OY represents the percentage of carbon emissions in the whole region, and the horizontal axis OX represents the percentage of GDP in each region. Its significance is to take the GDP of each region as a reference. To emit a certain proportion of carbon, it is necessary to contribute the corresponding proportion of GDP. From the economic point of view, on the basis of assuming the absolute average of carbon emissions, if the proportion of carbon emissions in a certain region is greater than the contribution rate of GDP, it is considered that the economic efficiency is relatively low, and it encroaches on the interests of other regions; otherwise, the economic efficiency is relatively high, and it contributes to other regions. Here, the economic contributive coefficient (ECC) is used to measure the fairness of economic contribution of carbon emission in each region [57]. The formula of ECC is as follows:
E C C = G j G / C j C
where Gj is the GDP of city j, G is the total GDP of the 20 investigated prefecture-level cities in the lower Yellow River area, Cj is the carbon emissions of city j, and C is the sum of the carbon emissions of the 20 prefecture-level cities in the lower Yellow River area. If ECC > 1, the economic contribution rate of city j exceeds the contribution rate of carbon emissions from land use, indicating a relatively high economic efficiency of carbon emissions; if ECC < 1, the economic efficiency of carbon emissions in city j is relatively low.

Ecological Pressure Model of Carbon Emission

In the carbon emission ecological pressure model, the vertical axis OY represents the percentage of carbon emissions in each region in the entire region, and the horizontal axis OX represents the percentage of carbon absorption by carbon sinks in each region. The significance lies in taking carbon absorption of carbon sinks of various regions as a reference. Emitting a certain proportion of carbon, it is necessary to contribute a corresponding proportion of carbon absorption. From the ecological point of view, assuming the absolute average of carbon emissions, if the proportion of carbon emissions in a certain region is greater than the contribution rate of carbon sink to carbon absorption, it infringes the interests of other regions; otherwise, it has relatively high ecological capacity, which has an important contribution to reducing the pressure of carbon emissions on the ecological environment. Here, the ecological support coefficient (ESC) is used to measure the fairness of carbon ecological capacity contribution of each region [57]. The formula of ESC is as follows:
E S C = C A j C A / C j C
where CAj is the amount of carbon absorbed by the carbon sink in city j, and CA is the total amount of carbon absorbed by the carbon sinks of the 20 prefecture-level cities in the lower Yellow River area. If ESC > 1, the contribution rate of carbon sinks in city j to carbon absorption is greater than the contribution rate of carbon emissions, which has a positive effect on the absorption of carbon emissions in the lower Yellow River area and contributes to other regions. If ESC < 1, the contribution rate of the carbon sinks in city j to carbon absorption is less than the contribution rate of carbon emissions and will have a negative impact on the carbon emissions in the lower Yellow River area.

2.3.4. STIRPAT Model

The predecessor of the STIRPAT model is the classic IPAT (Impact, Population, Affluence, Technology) model. The IPAT model was proposed by Ehrlich [58] in 1971, and reflects the relationship between population, economy, technology, and the environment. The formula as follows:
I = P × A × T
where I, P, A, and T represent Impact, Population, Affluence, and Technology, respectively.
To make the IPAT model more practical, Diezt [59] proposed the regression model of the IPAT equation, namely the STIRPAT model:
I = a P β A γ T δ e
where I represents environmental impact; P represents the population; A represents affluence; T represents technology; α is a model coefficient; β, γ, and δ are human-driven indices of P, A, and T; and e is the residual term. To better analyze and describe the relationship between various human factors and the impact of environmental pressure in practical applications, Equation (8) is usually transformed into its logarithmic form as follows:
ln I = α + β ln P + γ ln A + δ ln T + ln e
where α is a constant term; β, γ, and δ are the elastic coefficients of the human driving factors P, A, and T, respectively, which means that P, A, and T are the percentage of the change in environmental pressure impact caused by 1% of each change; and e is the residual term.
Based on previous studies [60,61,62], this study extended the STIRPAT model to characterize the impact of environmental pressure by land use carbon emissions, and constructed the following model:
ln C = α + β ln P + γ ln A + δ ln S + ρ ln I + ln e
where C is the carbon emission of land use (×10,000 t); α is the constant term of the model; P is the population (×10,000 people); A is wealth, characterized by per capita GDP (yuan/person); S is the area of built-up land (km2); I is the contribution of tertiary industry to GDP (%); β, γ, δ, and ρ are the elastic coefficients of P, A, S, and I, respectively; and e is the residual term of the model.

2.3.5. Ordinary Least Squares

Ordinary least squares is a common multivariate linear regression model for parameter estimation. Suppose there are a series of explanatory variables observations Xij and explained variables Yj of i = 1, 2,…, m, j = 1, 2,…, n [63,64]. The general formula is:
Y j = β 0 + j = 1 n β j x i j + ε i ( i = 1 , 2 m ; j = 1 , 2 n )
where ε is the error term and β0 is the regression constant. Here, when using the STIRPAT model based on the EViews software (IHS Markit, London, UK), the common least squares method was used to perform regression analysis of the influencing factors of land use carbon emissions.

3. Results

3.1. Land Use Changes

To analyze the changes in land use area in the lower Yellow River area from 1995 to 2018, the land use change area and dynamic degree of single land use types in the lower Yellow River area were calculated using Equation (1) (Table 2). The areas of cultivated land and unused land decreased continuously, while the areas of built-up land and water increased substantially (Table 2). Meanwhile, the area of woodland first decreased, then increased, and finally decreased over time. The area of built-up land increased the most from 2010 to 2018, by 4637 km2, representing a dynamic degree of 19.48. Similarly, the areas of cultivated land and unused land decreased the most from 2010 to 2018, by 3376 km2 and 682 km2, respectively, representing dynamic degrees of 3.17 and −43.41, respectively. The area of woodland increased slightly in 2005 and 2010 but decreased in 2020 and 2018. Thus, from 2010 to 2018, with continuous economic development, more cultivated land and forest land was occupied and the area of built-up land increased significantly.

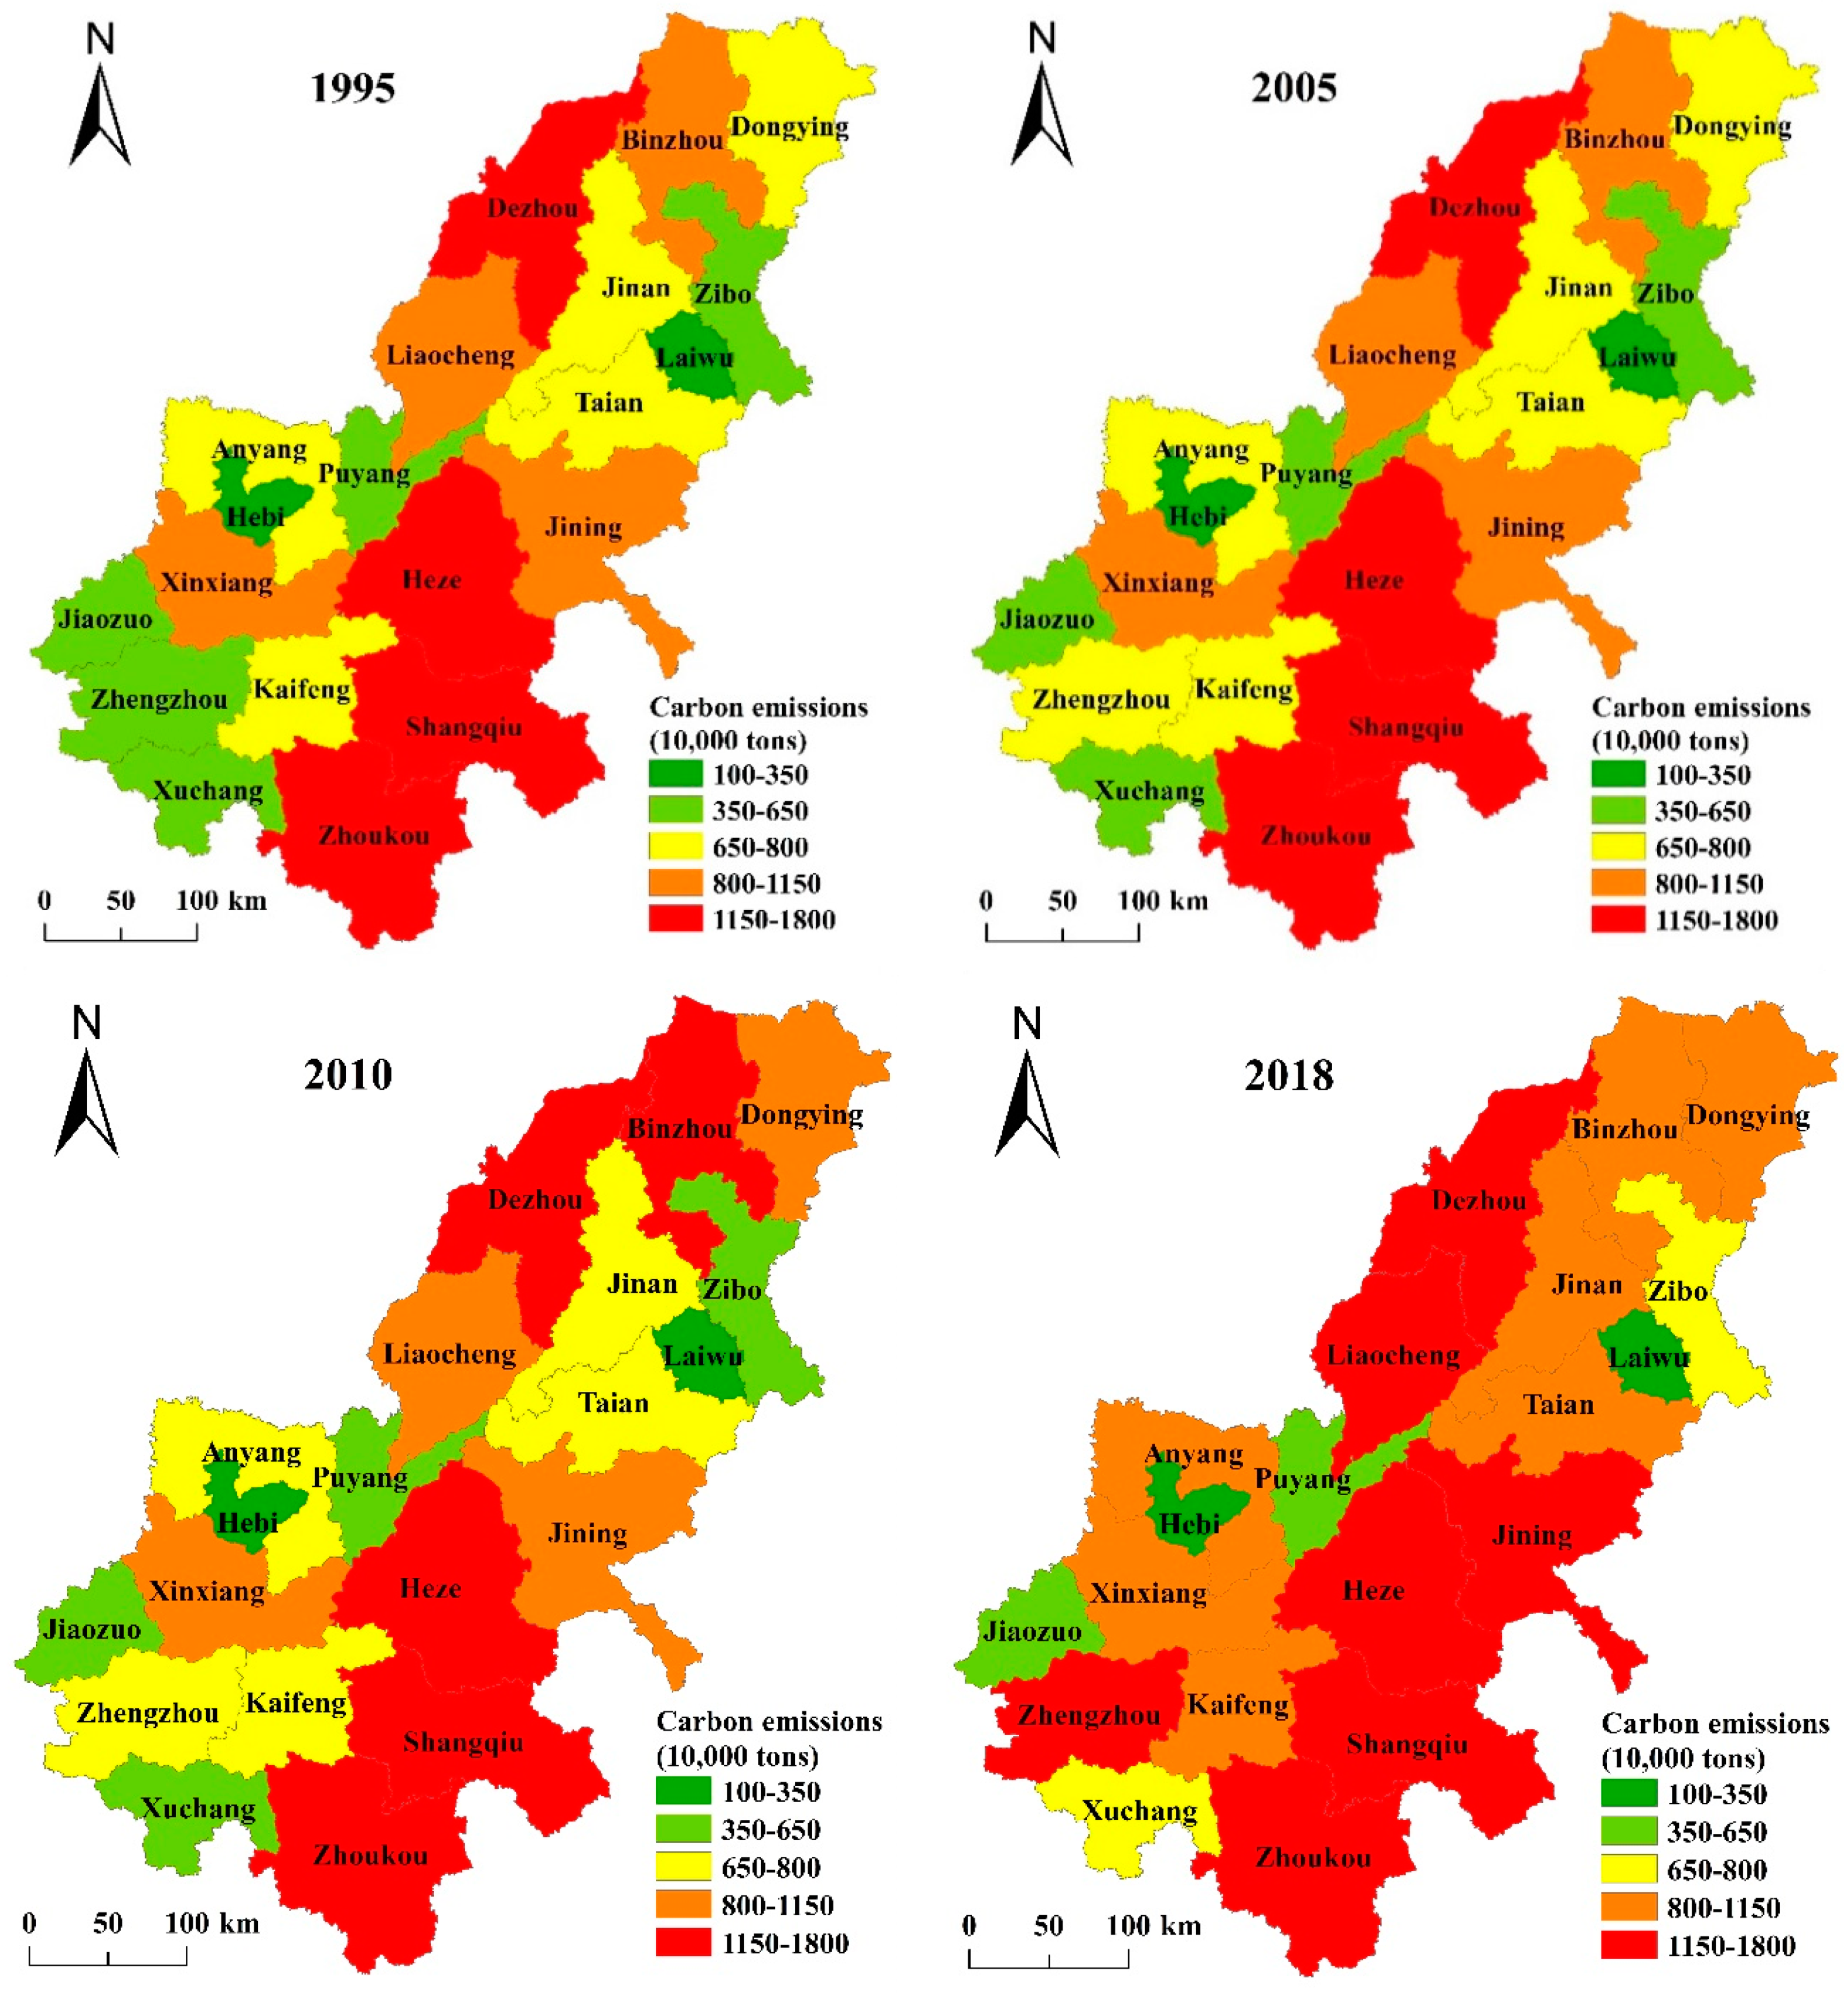
3.2. Spatiotemporal Trends in Land Use Carbon Emissions

Intense changes in land use were observed in the lower Yellow River area during 1995–2018. This study calculated the carbon emissions of all cities in the lower Yellow River area using Equations (2) and (3). Overall, carbon emissions in the lower Yellow River area increased from 1995 (1.6 × 10⁸ t) to 2018 (1.97 × 10⁸ t). This rise was attributed to increases in carbon sources, where the main land use type acting as a carbon source was built-up land followed by cultivated land. In 2010, the carbon emissions of built-up land accounted for more than 73% of the total carbon sources and this proportion increased over time.
To further analyze the contribution of built-up land to carbon sources, the proportions of carbon sources of built-up land was calculated for the 20 prefecture-level cities in 2010 and 2018 (Table 3). In 2010, the proportions of built-up land of all carbon sources of 15 cities exceeded 70%. By 2018, the proportion increased and exceeded 80% in Zhengzhou, Jinan, Zibo, and Laiwu. By contrast, woodland accounted for the largest proportion of total carbon sinks, while water areas and unused land accounted for a small proportion; the magnitudes of change in these proportions during the study period were not significant.
To facilitate the comparison of regional carbon emission differences, this study divided carbon emissions into five levels according to the land use carbon emissions in 1995–2018 using the natural interruption method: 1–3.5 × 10⁶ t, very low carbon emissions; 3.5–6.5 × 10⁶ t, low carbon emissions; 6.5–8 × 10⁶ t, moderate carbon emissions; 8–11.5 × 10⁶ t, high carbon emissions; and 11.5–18 × 106 t, very high carbon emissions indicative of serious pollution. Using Equation (4), the distribution of carbon emissions of prefecture-level cities was calculated in the lower Yellow River area from 1995 to 2018 (Figure 3).
With continuous economic development, carbon emissions increased. For instance, in 1995, four cities (Dezhou, Heze, Shangqiu, and Zhoukou) had very high carbon emissions (11.5 million tons), however, seven cities (Dezhou, Liaocheng, Jining, Heze, Shangqiu, Zhoukou, and Zhengzhou) had very high emissions in 2018. Moreover, the only cities with carbon emissions below 3.5 million tons were Laiwu and Hebi. With the continuous development of the economy, carbon emissions in all regions are increasing. The number of cities with carbon emissions between 800 and 11.5 million tons has increased from four in 1995 to seven in 2018. Among the cities, Zhengzhou’s carbon emissions increased the most from 1995 to 2018, along with an increase in GDP of 975.34 billion yuan, from 38.99 billion yuan to 1014.33 billion yuan. This showed that carbon emissions increased along with economic development, and that Zhengzhou had not achieved sustainable economic development and environmental protection. By contrast, in all study years, only Laiwu and Hebi had very low carbon emissions.
To analyze the relationship between the growth of carbon emissions and GDP of the 20 cities in the lower Yellow River area, the GDP growth and carbon emissions were calculated for the 20 cities at the prefecture level from 1995 to 2018 (Table 4). Zhengzhou, Jinan, Zibo, and Jining had higher GDP growth, as well as relatively high increments of carbon emissions (Table 4), indicating that carbon emissions increased along with continuous economic development. Moreover, Zhengzhou, Jinan, Zibo, and Jining did not adequately address environmental issues while developing their economies. By contrast, Dongying also had relatively high GDP growth, but its carbon emission increment was not high, indicating that Dongying better balanced environmental protection efforts and economic development.

3.3. ECC and ESC of Carbon Emissions

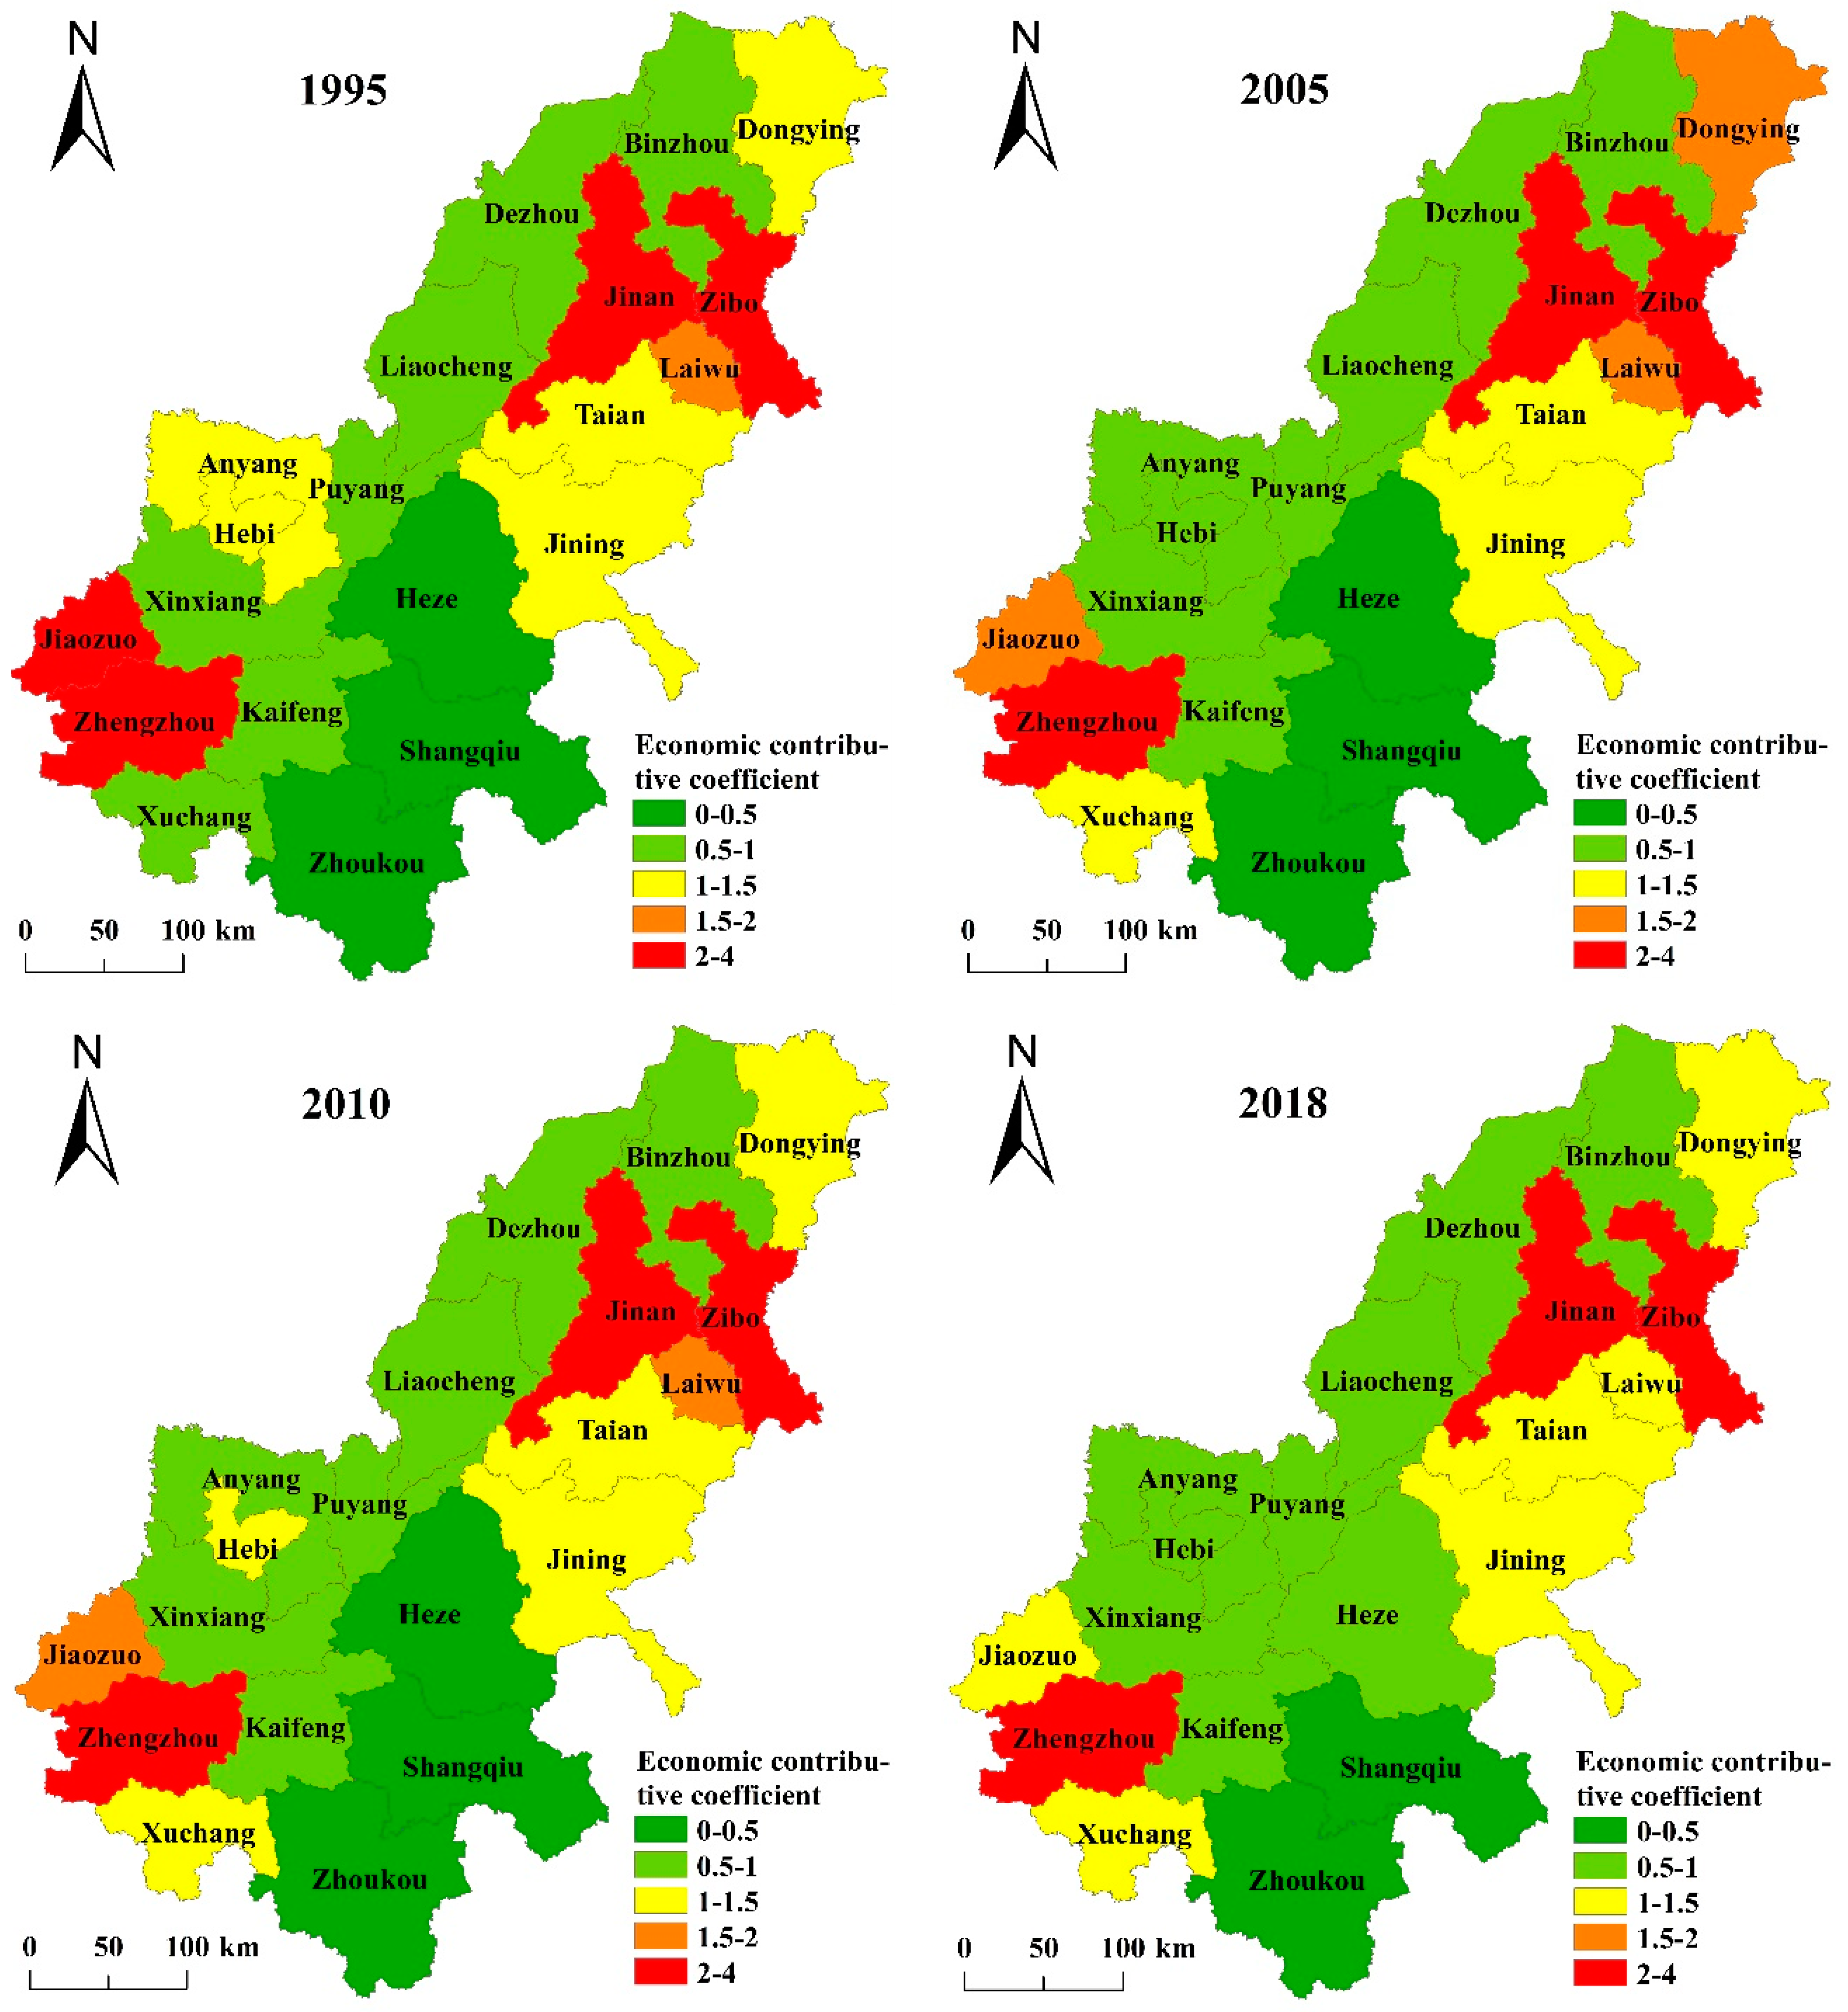
3.3.1. ECC of Carbon Emissions

In order to analyze the economic benefits of carbon emission of 20 cities in the lower Yellow River area, the ECC value of carbon emissions of each city was obtained by Equation (5) and divided into five grades (Figure 4): 0–0.5, very low; 0.5–1, low; 1–1.5, moderate; 1.5–2, high; and 2–4, very high. In 1995, 10 cities had carbon emission ECCs > 1: Dongying, Zibo, Jinan, Laiwu, Tai’an, Jining, Anyang, Hebi, Jiaozuo, and Zhengzhou. Anyang and Hebi had carbon emission ECCs of 1–1.5 in 1995, but <1 by 2005. During this time, the GDPs of Anyang (1995, 18.913 billion yuan; 2005, 55.746 billion yuan) and Hebi (1995, 5.479 billion yuan; 2005, 18.624 billion yuan) grew rapidly. Thus, these two cities did not effectively balance economic development and emission reductions during these 10 years of development.
According to Table 3 and Figure 4, the GDP of Zhengzhou, Jinan, and Zibo was relatively high, but their ECC was always at a high level. It shows that although these three cities produced large amounts of carbon dioxide emissions during the course of economic development, the economic efficiency of their carbon emissions were higher than those of other cities in the lower Yellow River area.

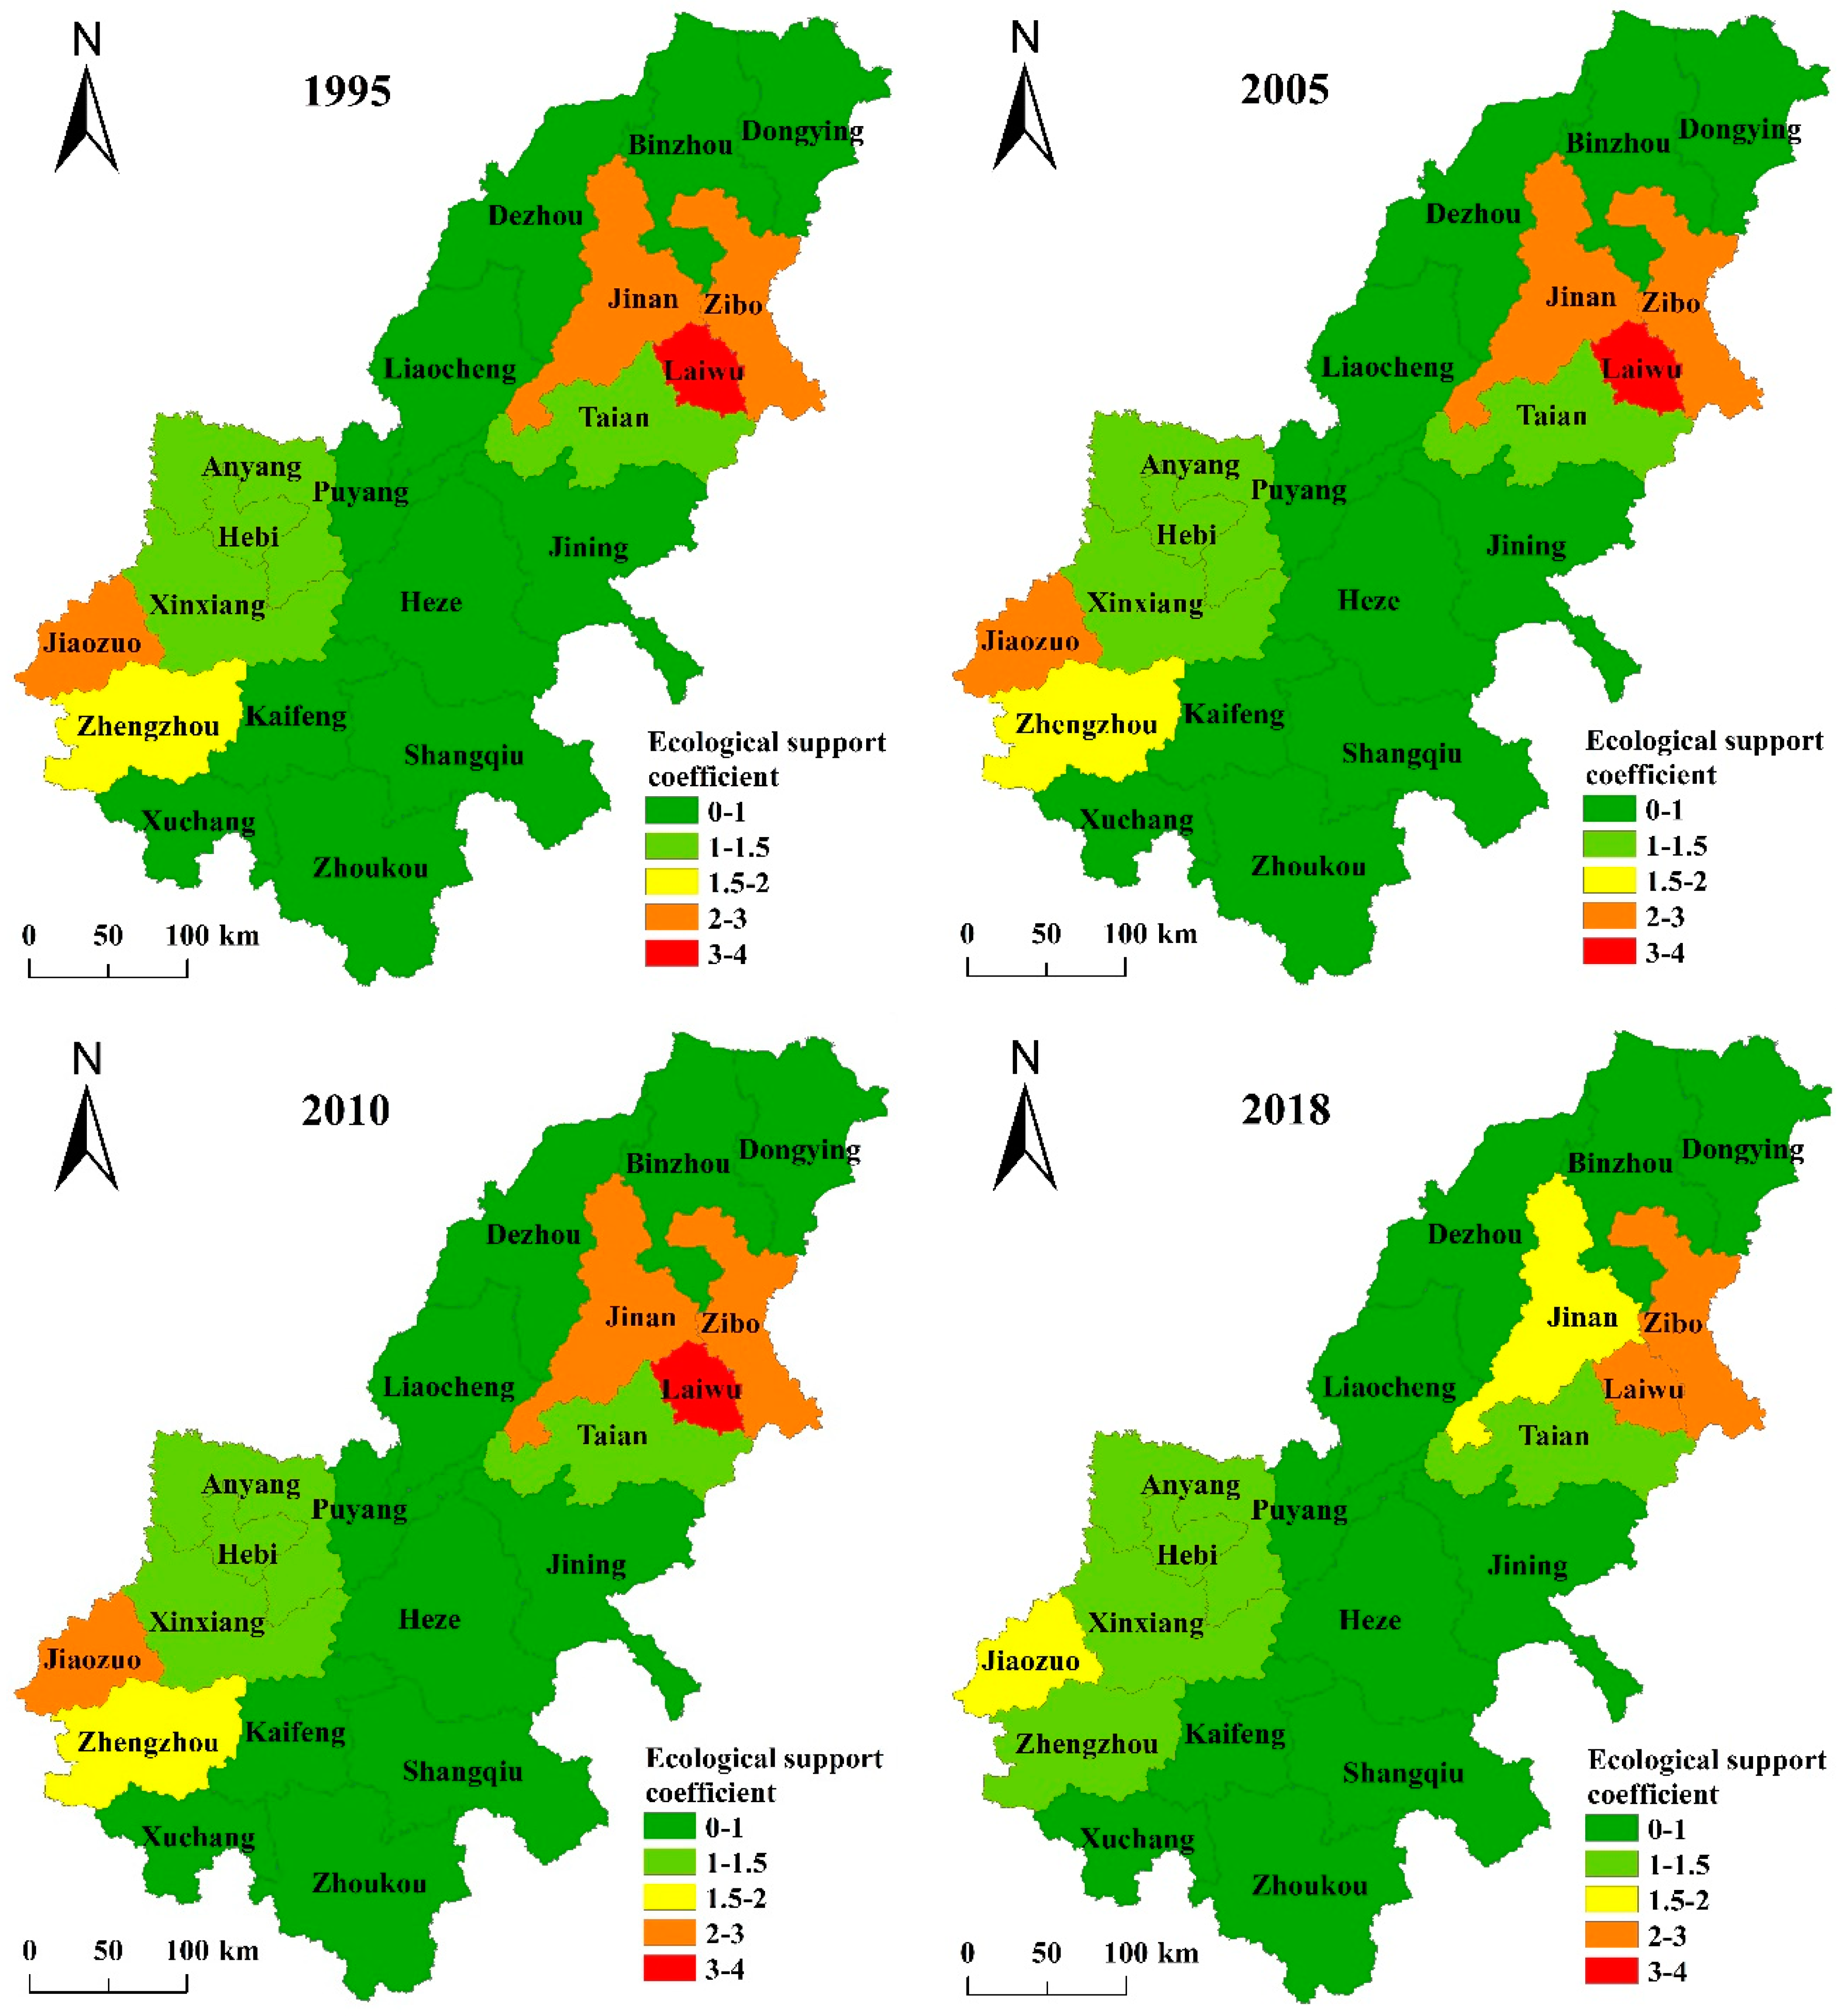
3.3.2. ESC of Carbon Emissions

To further analyze the ecological development of the 20 prefecture-level cities in the lower Yellow River area, this study calculated the ESCs of each city using Equation (6), and divided the values into five levels (Figure 5): 0–1, very low; 1–1.5, low; 1.5–2, moderate; 2–3, high; and 3–4, very high. During 1995–2018, the ESCs of Jinan, Zibo, Laiwu, and Jiaozuo all exceeded 1.5, indicating that these cities achieved a better balance of environmental production and economic development. Among them, the ESCs of Laiwu always exceeded 2 and even surpassed 3 in 1995 and 2010, indicating that the contribution rate of carbon sequestration to carbon absorption in Laiwu was greater than that of carbon sources to carbon emissions; overall, this had a beneficial effect on the elimination of carbon emissions in the lower Yellow River area.
During the study period, 11 cities (Dongying, Binzhou, Dezhou, Liaocheng, Puyang, Jining, Heze, Shangqiu, Kaifeng, Zhoukou, and Xuchang) always had very low ESCs, indicating that the contribution rate of carbon sinks to carbon emission absorption in these 11 cities was less than that of carbon sources. Thus, these 11 cities did not effectively promote regional environmental protection efforts during 1995–2018. Notably, Zhengzhou had moderate ESCs in 1995 and 2010, but a low ESC in 2018. As the provincial capital, the economic development of Zhengzhou is very important. From 2010 to 2018, its built-up land increased by 987 km2, which led to the continuous increase of carbon emissions of built-up land and decrease in the ecological carrying capacity coefficient.

3.4. STIRPAT Model Results

According to Equation (10), the data of land use carbon emissions, population, per capita GDP, built-up land area, and tertiary industry’s proportion of GDP of the 20 prefecture-level cities in the lower Yellow River area were standardized.
Ordinary least square regression analysis was carried out using the EViews software (IHS Markit, http://www.eviews.com/home.html), and the model regression results were obtained (Table 5).
The degree of fit of the model reached 99.43%, and the F-statistic passed the significance level of 1% [6], indicating that the model fit very well (Table 5). At the 1% level, land use carbon emissions were significantly negatively correlated with per capita GDP and tertiary industry’s proportion of GDP, but significantly positively correlated with built-up land area; there was no significant correlation between land use carbon emissions and population. The coefficients of per capita GDP, tertiary industry’s proportion of GDP, and built-up land area were −0.0338, −0.0511, and 1.024, indicating that for every 1% increase in per capita GDP or tertiary industry’s proportion of GDP, the carbon emissions from land use decreased by 0.0338% or 0.0511%, respectively, and for every 1% increase in built-up land area, the carbon emissions from land use increased by 1.024%.
The reason for the negative correlation between land use carbon emissions and per capita GDP may be that as people’s economic situation improves so does their understanding of environmental problems, fostering an interest in the development of a low-carbon cycle. Similarly, the negative correlation between the tertiary industry’s proportion of GDP and land use carbon emissions may be explained by technological advancements that occur with continuous socioeconomic development, resulting in strengthened control of carbon emissions due to technological improvements and cleaner production processes. Finally, the positive correlation between built-up land area and land use carbon emissions showed that built-up land was the main source of carbon emissions, and that the expansion of built-up land has a clear incremental effect on carbon emissions.

4. Discussion

This study combined multiple models to analyze the spatiotemporal characteristics and driving factors of land use carbon emissions from the lower Yellow River area from different perspectives. It provides a basis for improving land use in the later stage of economic development and achieving a balance between environmental protection efforts and high-quality socioeconomic development in the Yellow River Basin. Moreover, it enriches the relevant literature on land use carbon emissions and provides a reference for regional environmental and ecological protection.
This study combined analyses of ESC, ECC, and driving factors of carbon emissions. The results showed that land use carbon emissions in the lower Yellow River area are generally high in the north and south, and low in the east and west. Moreover, with rapid economic development in China, the carbon emissions of the prefecture-level cities increased to varying degrees. In areas with rapid economic development, the corresponding land use carbon emissions also grew rapidly, consistent with previous work [29]. The economy of Dongying grew rapidly in 1995 and 2018, but its carbon emissions did not increase much. Other cities should learn from the governance of Dongying City to ensure the coordinated development of economy and ecology. In the lower Yellow River area, ECC and ESC values of carbon emissions were higher in the east and west, and lower in the north and south. During the study period, despite economic development, the overall ECC of carbon emissions in the lower Yellow River area did not increase. This showed that some cities did not adequately support environmental protection efforts, resulting in an overall low ECC of carbon emissions. Furthermore, there were no obvious changes in the ESC over time. This showed that the environmental problems in the lower Yellow River area have not improved, and greater effort should be made to balance economic development and environmental protection.
From the influencing factors of land use carbon emissions in the lower Yellow River area, built-up land area had the greatest impact on carbon emissions, followed by tertiary industry, whereas per capita GDP had the lower impact. Moreover, land use carbon emission was negatively correlated with tertiary industry and positively correlated with built-up land area, consistent with a previous study [6]. Unexpectedly, land use carbon emission was also negatively correlated with per capita GDP. This might be because, as people’s economic situation improves, they may become more aware of environmental problems and strive to reduce carbon emissions from land use.

5. Conclusions

Land use change is the main driver of carbon emissions, which can damage the ecological environment. Intensive study on land use carbon emissions is of great significance to alleviate environmental pressure, formulate carbon emission reduction policies, and protect ecological development. The lower Yellow River has experienced rapid industrialization and urbanization with drastic land use changes during 1995–2018. This paper takes the lower Yellow River as the research area, through calculating the carbon emissions of land use in 20 cities in the lower Yellow River, combined with the economy and ecology of each city, and analyzes the driving factors of land use carbon emissions. Research found, from 1995 to 2018, land use change was characterized by the decrease of the ecological land and the increase of the built-up land. Overall, carbon emissions increased; built-up land was the main carbon source, while woodland was the main carbon sink. The economic contribution coefficient of carbon emission in the lower Yellow River has not changed much as a whole. The ECC value of Zhengzhou, Jinan, and Zibo has always been at a high level, which shows that these three cities pay attention to energy conservation and emission reduction while developing GDP. The ESC value of 20 cities in the lower Yellow River was generally on the low side. Considering the driving factors of carbon emission, the continuous increase of built-up land in the lower reaches of the Yellow River leads to the same increase of carbon sink and continuous decrease of carbon source. Land use carbon emission was significantly negatively correlated with per capita GDP and tertiary industry’s proportion of GDP, and significantly positively correlated with built-up land area.
In this paper, the ECC, ESC, and driving factors of land use carbon emission in the lower Yellow River were analyzed to enrich the research of carbon emission in the basin. Most scholars analyzed the driving factors of carbon emission from the economic aspect. This paper adds ecological factors, which provide more reference for other scholars. At the same time, it laid the theoretical foundation for the coordinated development of economy and ecology in the lower Yellow River. While developing the economy, each region should pay more attention to ecological development and control the rapid expansion of built-up land, while promoting the economical and intensive use of existing built-up land.
In addition to the above conclusions, this study had some limitations. The land use carbon emission was related to many factors, such as the first industry, the second industry, the environmental awareness of people, and so on. This study combined economic and ecological data. To analyze, in the future, more factors should be considered to study the land use carbon emission.

Supplementary Materials

The following are available online at https://www.mdpi.com/1996-1073/13/10/2600/s1, Table S1. Website of data source.

Author Contributions

Conceptualization, T.R., P.Z. and W.J.; Data curation, H.C. and L.G.; Formal analysis, T.R. and P.Z.; Funding acquisition, P.Z.; Investigation, Y.Z., Y.L. and D.Y.; Methodology, W.J. and Y.L.; Resources, Y.Z. and H.C.; Software, D.Y. and J.Y.; Validation, J.Y.; Writing—original draft, T.R.; Writing—review & editing, P.Z. All authors have read and agreed to the published version of the manuscript.

Funding

This study was funded by the National Natural Science Foundation of China (41601175, 41801362), the 2018 Young Backbone Teachers Foundation from Henan Province (2018GGJS019), the Program for Innovative Research Talent in the University of Henan Province (20HASTIT017), Key R&D and extension projects in Henan Province in 2019 (agriculture and social development field)(192102310002), the tackling of key scientific and technical project of Henan Province (202102310339), the Innovation Team Cultivation Project of The First-Class Discipline in Henan University (2018YLTD16), Henan university student innovation project (2019101475098). This study was also partly supported by the Natural Science Foundation of Guangdong Province, China (2018A030310470), the GDAS’s (Guangdong Academy of Sciences) Project of Science and Technology Development (2016GDASRC-0211; 2017GDASCX-0101, 0601, 0403, and 0801; 2018GDASCX-0101, 0403; 2019GDASYL-0502001, 0502001, 0301001, 0302001, 0501001, and 0401001; 2020GDASYL20200104003), the Guangdong Provincial Science and Technology Program (2018B030324001), Key Special Project for Introduced Talents’ Team of Southern Marine Science and Engineering Guangdong Laboratory (Guangzhou) (GML2019ZD0301), and the Guangdong Innovative and Entrepreneurial Research Team Program (2016ZT06D336).

Conflicts of Interest

The authors declare no conflict of interest

References

  1. Sohl, T.L.; Sleeter, B.M.; Zhu, Z.L.; Sayler, K.L.; Bennett, S.; Bouchard, M.; Reker, R.; Hawbaker, T.; Wein, A.; Liu, S.G.; et al. A Land use and land-cover modeling strategy to support a national assessment of carbon stocks and fluxes. Appl. Geogr. 2012, 34, 111–124. [Google Scholar] [CrossRef]
  2. Deng, X.Z. Net Energy, CO2 Emission and Land-Based Cost-Benefit Analyses of Jatropha Biodiesel: A case study of the Panzhihua region of Sichuan Province in China. Energies 2012, 5, 2150–2164. [Google Scholar] [CrossRef]
  3. Wang, S.J.; Fang, C.L.; Guan, X.L.; Pang, B.; Ma, H.T. Urbanisation, energy consumption, and carbon dioxide emissions in China: A panel data analysis of China’s provinces. Appl. Energy 2014, 136, 738–749. [Google Scholar] [CrossRef]
  4. Yang, J.; Guo, A.D.; Li, Y.H.; Zhang, Y.Q.; Li, X.M. Simulation of landscape spatial layout evolution in rural-urban fringe areas: A case study of Ganjingzi District. GISci. Remote Sens. 2019, 56, 388–405. [Google Scholar] [CrossRef]
  5. Yu, Z.; Lu, C.Q.; Tian, H.Q.; Canadell, J.G. Largely underestimated carbon emission from land use and land cover change in the conterminous United States. Glob. Change Biol. 2019, 25, 3741–3752. [Google Scholar] [CrossRef]
  6. Zhang, P.Y.; He, J.J.; Hong, X.; Zhang, W.; Qin, C.Z.; Pang, B.; Li, Y.Y.; Liu, Y. Regional-level carbon emissions modelling and scenario analysis: A STIRPAT case study in Henan Province, China. Sustainability 2017, 9, 2342. [Google Scholar] [CrossRef] [Green Version]
  7. Zhang, P.Y.; He, J.J.; Hong, X.; Zhang, W.; Qin, C.Z.; Pang, B.; Li, Y.Y.; Liu, Y. Carbon sources/sinks analysis of land use changes in China based on data envelopment analysis. J. Clean Prod. 2018, 204, 702–711. [Google Scholar] [CrossRef]
  8. Wang, H.M.; Wang, G.Q.; Qi, J.C.; Schandl, H.; Li, Y.M.; Feng, C.Y.; Yang, X.C.; Wang, Y.; Wang, X.Z.; Liang, S. Scarcity-weighted fossil fuel footprint of China at the provincial level. Appl. Energy 2020, 258, 114081. [Google Scholar] [CrossRef]
  9. Li, L.; Huang, X.J.; Yang, H.; Chuai, X.W.; Zhang, M.; Zhong, T.Y.; Chen, Z.G.; Chen, Y.; Wang, X.; Thompson, J.R. Carbon emissions from land use change and management in China between 1990 and 2010. Sci. Adv. 2016, 2, e1601063. [Google Scholar] [CrossRef] [Green Version]
  10. Yang, H.R.; Zheng, H.; Liu, H.G.; Wu, Q. NonLinear effects of environmental regulation on eco-efficiency under the constraint of land use carbon emissions: Evidence based on a bootstrapping approach and Panel Threshold Model. Int. J. Environ. Res. Public Health 2019, 16, 1679. [Google Scholar] [CrossRef] [Green Version]
  11. Li, Z.G.; Zhong, J.L.; Sun, Z.S.; Yang, W.N. Spatial pattern of carbon sequestration and urban sustainability: Analysis of land use and carbon emission in Guang’an, China. Sustainability 2017, 9, 1951. [Google Scholar] [CrossRef] [Green Version]
  12. Hutyra, L.R.; Yoon, B.; Alberti, M. Terrestrial carbon stocks across a gradient of urbanization: A study of the Seattle, WA region. Glob. Change Biol. 2011, 17, 783–797. [Google Scholar] [CrossRef]
  13. Song, T.; Wang, Y.S. Carbon dioxide fluxes from an urban area in Beijing. Atmos. Res. 2012, 106, 139–149. [Google Scholar] [CrossRef]
  14. Xu, Q.; Dong, Y.X.; Yang, R. Urbanization impact on carbon emissions in the Pearl River Delta region: Kuznets curve relationships. J. Clean Prod. 2018, 180, 514–523. [Google Scholar] [CrossRef]
  15. Sitch, S.; Friedlingstein, P.; Gruber, N.; Jones, S.D.; Murray-Tortarolo, G.; Ahlström, A.; Doney, S.C.; Graven, H.; Heinze, C.; Huntingford, C.; et al. Recent trends and drivers of regional sources and sinks of carbon dioxide. Biogeosciences 2015, 12, 653–679. [Google Scholar] [CrossRef] [Green Version]
  16. Houghton, R.A. Magnitude, Distribution and causes of terrestrial carbon sinks and some implications for policy. Clim. Policy 2002, 2, 71–88. [Google Scholar] [CrossRef]
  17. Houghton, R.A.; House, J.I.; Pongratz, J.; van der Werf, G.R.; DeFries, R.S.; Hansen, M.C.; Le Quéré, C.; Ramankutty, N. Carbon emissions from land use and land-cover change. Biogeosciences 2012, 9, 5125–5142. [Google Scholar] [CrossRef] [Green Version]
  18. Houghton, R.A.; Hackler, J.L. Sources and sinks of carbon from land use change in China. Glob. Biogeochem. Cycle 2003, 17, 1034–1047. [Google Scholar] [CrossRef]
  19. Zhang, C.; Tian, H.Q.; Chen, G.S.; Chappelka, A.; Xu, X.F.; Ren, W.; Hui, D.F.; Liu, M.L.; Lu, C.Q.; Pan, S.F.; et al. Impacts of urbanization on carbon balance in terrestrial ecosystems of the Southern United States. Environ. Pollut. 2012, 164, 89–101. [Google Scholar] [CrossRef]
  20. Chuai, X.W.; Lai, L.; Huang, X.J.; Zhao, R.Q.; Wang, W.J.; Chen, Z.G. Temporospatial changes of carbon footprint based on energy consumption in China. J. Geogr. Sci. 2012, 22, 110–124. [Google Scholar] [CrossRef]
  21. Schipper, L.; Murtishaw, S.; Khrushch, M.; Ting, M.; Karbuz, S.; Unander, F. Carbon emissions from manufacturing energy use in 13 IEA countries: Long-term trends through 1995. Energy Policy 2001, 29, 667–688. [Google Scholar] [CrossRef]
  22. Ali, G.; Nitivattananon, V. Exercising multidisciplinary approach to assess interrelationship between energy use, carbon emission and land use change in a metropolitan city of Pakistan. Renew. Sustain. Energy Rev. 2012, 16, 775–786. [Google Scholar] [CrossRef]
  23. Zhu, Q.; Peng, X.Z.; Lu, Z.M.; Wu, K.Y. Factors decomposition and empirical analysis of variations in energy carbon emission in China. Resour. Sci. 2009, 31, 2072–2079. [Google Scholar]
  24. Wang, C.; Chen, J.; Zou, J. Decomposition of energy-related CO2 emission in China: 1957–2000. Energy 2005, 30, 73–83. [Google Scholar] [CrossRef]
  25. Tan, Z.F.; Li, L.; Wang, J.; Wang, J.H. Examining the driving forces for improving China’s CO2 emission intensity using the decomposing method. Appl. Energy 2011, 88, 4496–4504. [Google Scholar] [CrossRef]
  26. Guo, Y.G.; Lin, F.C.; Bai, Y.Q.; Wu, M.M. The decomposition research on energy-related carbon emissions of Shanghai. Chin. J. Environ. Pollut. Prot. 2009, 31, 68–72. [Google Scholar]
  27. Liu, C.L.; Chen, C.C.; Chen, Q.; Zhu, S.L.; Wang, H.H.; Li, Z. Evolution mechanisms of CO2 emissions in Beijing City during the period 1997–2007. Resour. Sci. 2010, 32, 235–241. [Google Scholar]
  28. Shi, A. The impact of population pressure on global carbon dioxide emissions, 1975–1996: Evidence from pooled cross-country data. Ecol. Econ. 2003, 44, 29–42. [Google Scholar] [CrossRef]
  29. Fan, Y.; Liu, L.C.; Wu, G.; Wei, Y.M. Analyzing impact factors of CO2 emissions using the STIRPAT model. Environ. Impact Assess. Rev. 2006, 26, 377–395. [Google Scholar] [CrossRef]
  30. Wang, Z.; Yin, F.; Zhang, Y.; Zhang, X. An empirical research on the influencing factors of regional CO2 emissions: Evidence from Beijing city, China. Appl. Energy 2012, 100, 277–284. [Google Scholar] [CrossRef]
  31. Greening, L.A.; Ting, M.; Krackler, T.J. Effects of changes in residential end-use and behavior on aggregate carbon emission intensity: Comparison of 100 OECD countries for the period 1970 through 1993. Energy Econ. 2001, 23, 153–178. [Google Scholar] [CrossRef]
  32. Singh, M.K.; Mukherjee, D. Drivers of greenhouse gas emissions in the United States: Revisiting STIRPAT model. Environ. Dev. Sustain. 2019, 21, 3015–3031. [Google Scholar] [CrossRef]
  33. Stern, D.I.; Jotzo, F. How ambitious are China and India’s emissions intensity targets? Energy Policy 2010, 38, 6776–6783. [Google Scholar] [CrossRef] [Green Version]
  34. Zhao, R.Q.; Huang, X.J.; Liu, Y.; Zhong, T.Y.; Ding, M.L.; Chuai, X.W. Carbon emission of regional land use and its decomposition analysis: Case study of Nanjing City, China. Chin. Geogr. Sci. 2015, 25, 198–212. [Google Scholar] [CrossRef]
  35. Ke, Y.; Yi, X. Path selection for low-carbon economic land use pattern in China. Energy Procedia 2011, 5, 452–456. [Google Scholar] [CrossRef] [Green Version]
  36. Sun, X.B. Effects of Carbon emission by land use patterns in Hefei’s economic circle of Anhui Province. J. Nat. Resour. 2012, 27, 394–401. [Google Scholar]
  37. Chuai, X.W.; Huang, X.J.; Lai, L.; Wang, W.J.; Peng, J.W.; Zhao, R.Q. Land use structure optimization based on carbon storage in several regional terrestrial ecosystems across China. Environ. Sci. Policy 2013, 25, 50–61. [Google Scholar] [CrossRef]
  38. Liu, Z.; Guan, D.B.; Wei, W.; Davis, S.J.; Ciais, P.; Bai, J.; Peng, S.S.; Zhang, Q.; Hubacek, K.; Marlang, G.; et al. Reduced carbon emission estimates from fossil fuel combustion and cement production in China. Nature 2015, 524, 335–338. [Google Scholar] [CrossRef] [Green Version]
  39. Zhao, R.Q.; Huang, X.J.; Zhong, T.Y. Research on carbon emission intensity and carbon footprint of different industrial spaces in China. Acta Geogr. Sin. 2010, 65, 1048–1057. [Google Scholar]
  40. Tian, J.X.; Yang, H.L.; Xiang, P.G.; Liu, D.W.; Li, L. Drivers of agricultural carbon emissions in Hunan Province, China. Environ. Earth Sci. 2016, 75, 121.1–121.7. [Google Scholar] [CrossRef]
  41. Shi, G.; Ye, P.; Ding, L.; Quinones, A.; Li, Y.; Jiang, N. Spatial-Temporal patterns of land use and cover change from 1990 to 2010: A case study of Jiangsu Province, China. Int. J. Environ. Res. Public Health 2019, 16, 907. [Google Scholar] [CrossRef] [Green Version]
  42. Gao, L.; Wen, X.; Guo, Y.T.; Gao, T.M.; Wang, Y.; Shen, L. Spatiotemporal variability of carbon flux from different land use and land cover changes: A case study in Hubei Province, China. Energies 2014, 7, 2298–2316. [Google Scholar] [CrossRef] [Green Version]
  43. Geng, Y.; Zhao, H.Y.; Liu, Z.; Xue, B.; Fujita, T.; Xi, F. Exploring driving factors of energy-related CO2 emissions in Chinese provinces: A case of Liaoning. Energy Policy 2013, 60, 820–826. [Google Scholar] [CrossRef]
  44. He, J.J.; Zhang, P.Y. Evaluating the coordination of Industrial-Economic development based on anthropogenic carbon emissions in Henan Province, China. Int. J. Environ. Res. Public Health 2018, 15, 1815. [Google Scholar] [CrossRef] [PubMed] [Green Version]
  45. Abubaker, O.; Ma, Z.G.; Zheng, Z.Y.; Farhan, S. Natural and anthropogenic influences on the recent droughts in Yellow River Basin, China. Sci. Total Environ. 2020, 704, 135428. [Google Scholar]
  46. Yin, Y.Y.; Tang, Q.H.; Liu, X.C.; Zhang, X.J. Water scarcity under various socio-economic pathways and its potential effects on food production in the Yellow River basin. Hydrol. Earth Syst. Sci. 2017, 21, 791–804. [Google Scholar] [CrossRef] [Green Version]
  47. Cen, Y.F.; Zhang, P.Y.; Yan, Y.H.; Jing, W.L.; Zhang, Y.; Li, Y.Y.; Yang, D.; Liu, X.; Geng, W.L.; Rong, T.Q. Spatial and Temporal Agglomeration Characteristics and Coupling Relationship of Urban Built-Up Land and Economic Hinterland—A Case Study of the Lower Yellow River, China. Sustainability 2019, 11, 5218. [Google Scholar] [CrossRef] [Green Version]
  48. Zhang, P.Y.; Qin, C.Z.; Hong, X.; Kang, G.H.; Qin, M.Z.; Yang, D.; Pang, B.; Li, Y.Y.; He, J.J.; Dick, R.P. Risk assessment and source analysis of soil heavy metal pollution from lower reaches of Yellow River irrigation in China. Sci. Total Environ. 2018, 633, 1136–1147. [Google Scholar] [CrossRef]
  49. Shi, H.X.; Mu, X.M.; Zhang, Y.L.; Lu, M.Q. Effects of different land use patterns on carbon emission in Guangyuan City of Sichuan province. Bull. Soil Water Conserv. 2012, 32, 101–106. (In Chinese) [Google Scholar]
  50. He, Y.; Li, X.; Li, Q. Analysis on the effect of carbon emissions from different types of land use in Henan. J. Anhui Agric. Sci. 2012, 40, 14049–14051. (In Chinese) [Google Scholar]
  51. Su, K.; Wei, D.Z.; Lin, W.X. Evaluation of ecosystem services value and its implications for policy making in China—A case study of Fujian province. Ecol. Indic. 2020, 108, 105752. [Google Scholar] [CrossRef]
  52. Yang, J.; Liu, W.L.; Li, Y.H.; Li, X.M.; Ge, Q.S. Simulating intraurban land use dynamics under multiple scenarios based on fuzzy cellular automata: A case study of Jinzhou district, Dalian. Complexity 2018, 2018, 7202985. [Google Scholar] [CrossRef] [Green Version]
  53. Peng, W.F.; Zhou, J.M.; Xu, X.L.; Luo, H.L.; Zhao, J.F.; Yang, C.J. Effect of land use changes on the temporal and spatial patterns of carbon emissions and carbon footprints in the Sichuan Province of Western China, from 1990 to 2010. Acta Ecol. Sin. 2016, 36, 7244–7259. (In Chinese) [Google Scholar]
  54. Gini, C. Measurement of Inequality of Incomes. Econ. J. 1921, 31, 124–126. [Google Scholar] [CrossRef]
  55. Wang, J.N.; Lu, Y.T.; Zhou, J.S.; Li, Y.; Cao, D. Analysis of China resource-environment Gini coefficient based on GDP. China Environ. Sci. 2006, 26, 111–115. (In Chinese) [Google Scholar]
  56. Lu, J.Y.; Huang, X.J.; Dai, L.; Chen, Z.G.; Li, Y. Spatiotemporal scale analysis on the equality of energy consumption carbon emission distribution in China. J. Nat. Resour. 2012, 27, 2006–2017. (In Chinese) [Google Scholar]
  57. Yuan, S.F.; Tang, Y.Y. Spatial differentiation of land use carbon emission in the Yangtze River economic belt based on low carbon perspective. Econ. Geogr. 2019, 39, 190–198. (In Chinese) [Google Scholar]
  58. Ehrlich, P.R.; Holdren, J.P. Impact of population growth. Science 1971, 171, 1212–1217. [Google Scholar] [CrossRef]
  59. Thomas, D.; Eugene, A.R. Rethinking the environmental impacts of population, affluence and Technology. Hum. Ecol. Rev. 1994, 1, 277–300. [Google Scholar]
  60. Li, H.H.; Mu, H.L.; Zhang, M.; Gui, S.S. Analysis of regional difference on impact factors of China’s energy—Related CO2 emissions. Energy 2012, 39, 319–326. [Google Scholar] [CrossRef]
  61. Huang, R.; Wang, Z.; Ding, G.Q.; Gong, Y.R.; Liu, C.X. Trend prediction and analysis of influencing factors of carbon emissions from energy consumption in Jiangsu province based on STIRPAT model. Geogr. Res. 2016, 35, 781–789. (In Chinese) [Google Scholar]
  62. Li, H.H.; Mu, H.L.; Zhang, M.; Li, N. Analysis on influence factors of China’s CO2 emissions based on Path-STIRPAT model. Energy Policy 2011, 39, 6906–6911. [Google Scholar] [CrossRef]
  63. Dempster, A.P.; Schatzoff, M.; Wermuth, N. A Simulation Study of Alternatives to Ordinary Least Squares. J. Am. Stat. Assoc. 1977, 72, 77–91. [Google Scholar] [CrossRef]
  64. Zhang, P.Y.; Yang, D.; Zhang, Y.; Li, Y.Y.; Liu, Y.; Cen, Y.F.; Zhang, W.; Geng, W.L.; Rong, T.Q.; Liu, Y.; et al. Re-examining the drive forces of China’s industrial wastewater pollution based on GWR model at provincial level. J. Clean. Prod. 2020, 262, 121309. [Google Scholar] [CrossRef]
Figure 1. Map showing the study area, Henan and Shandong Provinces, and the Yellow River. (a) Location of the study area with China, (b) map of Henan and Shandong Provinces.
Energies 13 02600 g001
Figure 2. Carbon emission Lorenz curve.
Energies 13 02600 g002
Figure 3. Distribution of land use carbon emissions in prefecture-level cities of the lower Yellow River area from 1995 to 2018.
Energies 13 02600 g003
Figure 4. Spatial distribution of the carbon emissions economic contributive coefficient in prefecture-level cities of the lower Yellow River area from 1995 to 2018.
Energies 13 02600 g004
Figure 5. Spatial distribution of ecological support coefficients in prefecture-level cities of the lower Yellow River area from 1995 to 2018.
Energies 13 02600 g005
Table 1. Carbon emission or absorption coefficients for different land use types.
Land Use TypeCarbon Emission Coefficient (kg/m2·a)
Cultivated land0.4595
Woodland−0.6125
Water area−0.0253
Unused land−0.0005
Table 2. Changes in land use area and single dynamic degree in the lower Yellow River area from 1995 to 2018.
Land Use Type1995–20052005–20102010–2018
Area (km2)Dynamic Degree (%)Area (km2)Dynamic Degree (%)Area (km2)Dynamic Degree (%)
Cultivated land−788−0.73−819−0.76−33763.17
Woodland−40−0.65160.26−692−11.23
Water area2485.261352.72197038.67
Unused land−539−23.62−172−9.87−682−43.41
Built-up land17128.089003.93463719.48
Table 3. Proportion of built-up land carbon emissions in prefecture-level cities of the lower Yellow River area in 2010 and 2018.
Region20102018
Zhengzhou74%86%
Kaifeng70%74%
Anyang70%74%
Hebi70%76%
Xinxiang71%75%
Jiaozuo70%78%
Puyang74%78%
Shangqiu75%76%
Xuchang73%76%
Zhoukou74%75%
Jinan74%82%
Zibo78%83%
Dongying78%78%
Jining71%77%
Taian71%76%
Laiwu72%81%
Dezhou70%71%
Liaocheng73%78%
Binzhou78%75%
Heze74%77%
Table 4. Gross Domestic Product (GDP) growth and growth rates of prefecture-level cities from 1995 to 2018.
Region1995 GDP (100 Million Yuan)2005 GDP (100 Million Yuan)2010 GDP (100 Million Yuan)2018 GDP (100 Million Yuan)GDP Growth from 1995 to 2018 (100 Million Yuan)Carbon Emission growth from 1995 to 2018 (10,000 Tons)
Zhengzhou389.91660.64040.910143.39753.4650.4
Kaifeng123.4408.0927.22002.21878.9110.4
Anyang189.1557.51315.62393.22204.1125.5
Hebi54.8186.2429.1862.0807.148.0
Xinxiang210.3544.21189.92526.62316.3174.9
Jiaozuo228.1584.01245.92371.52143.4128.4
Puyang122.5384.0775.41654.51532.0101.0
Shangqiu163.1560.81143.82389.02225.9110.3
Xuchang126.1605.51316.52830.62704.673.0
Zhoukou195.1595.51228.32687.22492.1122.1
Jinan481.51876.63910.57856.67375.0406.4
Zibo404.51431.02866.85068.44663.9215.6
Dongying229.31166.12359.94152.53923.2143.5
Jining368.21266.32542.84930.64562.4319.2
Taian205.2855.72051.73651.53446.4185.0
Laiwu69.2256.3546.31005.7936.571.3
Dezhou184.4831.81657.83380.33195.9124.9
Liaocheng164.5693.11622.43152.22987.7307.8
Binzhou151.8667.31551.52640.52488.786.2
Heze168.5450.91227.13078.82910.3226.1
Table 5. STIRPAT (Stochastic Impacts by Regression on Population, Affluence, and Technology) model regression results.
VariableRegression CoefficientStandard ErrortP
α−0.21330.0686−3.1090.0026
lnP0.00980.0081.2320.2218
lnA−0.03380.005−6.3690.0000
lnS1.0240.010597.1650.0000
lnI−0.05110.0189−2.7080.0084
Note: R2 = 0.9943, F-statistic = 3270.501, Prob (F-statistic) = 0.0000.

