Abstract
As electric vehicles gain acceptance, an increasing number of households consider the possibility of buying the bundle including an electric car, a photovoltaic system, and a battery storage unit. Apart from the attractive environmental benefits, a relevant uncertainty concerns the economic convenience of such a choice. Since many variables play a role, we set up a total cost of ownership model to evaluate whether, and under which conditions, the bundle is cost-competitive relative to buying an electric car only (and charging it from the electrical grid) or a conventional combustion engine car. By combining, for the first time, such an economic model with an energy model and a driving profile model, we find that the degree of electricity self-production used to charge the electric car might be very high, varying from 90% to 62%, depending on the annual distance traveled. The cost of such electricity varies widely and can be lower than the grid electricity price when fiscal incentives are available and for long annual distances traveled. A smart charging practice based on both economic factors and weather forecast can greatly enhance self-sufficiency, i.e., independence from the electrical grid. We estimate that, given the current Italian financial incentives, 10,000 km/year are needed to make the electric car cost-competitive with respect to an equivalent petrol-fueled one. Such threshold increases to more than 25,000 km/year if financial incentives are removed.
1. Introduction
The uptake of electric vehicles (EVs) is rapidly increasing. The stock of EVs (Battery Electric Vehicles and Plug-In Hybrid Electric Vehicles) in 2018, worldwide, was 5.1 million [1], to which more the 2.2 million EVs were added in 2019, although no official data were available at the time of writing of this manuscript. It is commonly accepted that the higher the share of renewables in the electricity mix, the more environmentally superior are EVs relative to internal combustion engine vehicles (ICEVs), as documented in several papers [1,2,3]. Under current carbon intensities of electricity generation, EVs and heat pumps are less emission intensive than fossil-fuel-based alternatives in 53 world regions, representing 95% of the global transport and heating demand [4]. In accordance with these trends, residential photovoltaic plants (PVs) supply renewable energy to the electrical grid and, especially when coupled with energy storage, contribute to contain the electricity request to the electrical grid, which might significantly increase as EVs progressively substitute ICEVs. Households become prosumers, i.e., producers and consumers of electricity at the same time. Various studies documented that EV owners are more interested in PV and battery storage (BS) than non-EV owners: They want to be greener, and sometimes electrical grid independent [5]. High cost and long payback time are, however, a concern.
Car manufacturers and electricity providers offer PV–BS–EV bundles. Tesla Motors, the pioneering and largest EV car manufacturer, offers EVs, solar roofs, and storage modules. The green financing sector is willing to provide interesting loans. For instance, the Connecticut Green Bank offers EV owners reduced-rate loans for home-energy upgrades, including an EV charger, solar PV, battery storage, and a heat pump [6].
This paper focuses on the PV–BS–EV bundle at the household level, investigating the following research questions. How much renewable energy can be obtained from the PV–BS system? What is the impact of the EV user driving profile and charging behavior? Is the bundle economically viable? Is it cost-competitive with respect to the traditional choice of owning a petrol-fueled ICEV from the point of view of a private owner? Is the PV–BS–EV bundle cost-competitive with respect to an EV charged from the grid? What would be the impact of the phasing out of the current fiscal incentives on PV and BS, and of purchase subsidies on EVs?
In order to shed some light on these research questions, we have developed a model linking several models: an EV driving profile model describing the user travel and charging behavior, distinguishing between work days, weekend travel, and long-distance holidays; an energy-flows model describing the electricity flows between PV, BS, the electrical grid, and the EV. Taking into account the different cost components (Levelized Cost of Energy or LCOE, Levelized Cost of Storage or LCOS, and grid electricity price) and the energy flows, we then calculate the electricity cost for the PV–BS system. Such a value is used as an input in a Total Cost of Ownership (TCO) model that allows us to evaluate the cost competitiveness of an EV charged by a PV–BS system with respect to a traditional petrol-based ICEV or an EV charged by electricity drawn from the electrical grid. The model is applied to an Italian case study with a specific PV–BS–EV bundle valued at the current market prices.
Three scenarios are developed: (1) a base case scenario with and without a solar forecast-based strategy; (2) a scenario reducing by 50% the BS capacity to test its impact on self-sufficiency from the electrical grid and on the profitability of the system; and (3) a scenario without the current EV purchase subsidy and the tax deductions on PV and BS equipment in order to test the dependence from the fiscal stimulus.
To the best of our knowledge, no other paper has combined an energy and charging model with a full-fledged EV driving profile model and a TCO model. Our findings could guide households in their purchasing decisions, car manufacturers and electricity providers in offering PV–BS–EV bundles, and policymakers aiming at accelerating the uptake of EVs and at decarbonizing the transport sector.
2. Literature Review
The literature on PV and storage system is abundant. Several studies in the engineering literature deal with the impact of the decentralized model PV plus BS on the secure operation of distribution grids [7]. A recent contribution discusses the optimal configuration of PV and electricity storage in a detailed representation of the Swiss power system [8]. They find that storage plays an important role in minimizing the total cost for energy systems with large PV capacity, as well as satisfying the distribution capacity constraints. Reference [9] focuses on both the residential customer’s and utility company’s perspective of the high penetration of PHEV and PV and storage systems. They find that appropriate scheduling has benefits for both customers and utility companies. Reference [10] analyzes the integration between electric mobility and renewable energy sources, studying the case of a grid-connected microgrid in a university framework. They estimate the charging price and the resulting total cost of ownership per kilometer, considering the match between the demand and the production of a photovoltaic generator.
With a specific focus on households (prosumers), Reference [11] uses data from real demand and PV generation profiles of 39 households and find that the self-consumption of PV power is the largest contributor to the savings obtained when using Energy Storage Systems. The implementation of different Energy Storage Systems reduces annual costs by 22–30% and increases the self-consumption of PV power by 23–29%. The availability of an EV is not considered in their study. Reference [12] takes the perspective of the current and new customers with rooftop PV installations and evaluates the performance, cost, value, and optimum energy storage technology for managing PV generation. They compare hot water tanks (supplying domestic hot water), lead-acid batteries, and lithium-ion batteries (supplying electricity).
Reference [13] presents an ES cost model that considers long-term, medium-term, and short-term ES applications, technologies, and technical characteristics in an integrated framework that considers the ES technical and economic characteristics supported by in-market insight. As key metrics, they use the annualized life-cycle cost of storage (LCCOS) and the levelized cost of energy (LCOE). However, they do not include an EV in their analysis. Similarly, Reference [14] investigates the economic viability of adding a BESS to a residential grid-connected PV plant. They find that the costs of storages are still too high to allow an economic convenience of the storage installation, and estimate the necessary incentives to allow the diffusion of these systems. Reference [15] analyzes the energy integration between PV and EV at urban scale. They underline the importance of self-consumption in optimizing the interaction between the PV system and charging station for EVs. Reference [16] finds that using an EV for storage of in-house-generated PV electricity has the potential to achieve the same levels of self-consumption and self-sufficiency for households as could be obtained by using a stationary battery, but substantial variations (up to 50% points) are possible depending on the households driving profiles.
On the contrary, Reference [17] focuses on the energy management of a smart home, including an electric vehicle, an energy storage, and a photovoltaic array. They develop a stochastic model that seeks to minimize consumers’ energy charges under a time-of-use tariff, while satisfying home power demand and PEV charging requirements and accommodating the variability of solar power. The technical aspects of integrating EVs in a microgrid and their impact on the network are dealt with a growing literature (see [18] for a review). Reference [18] argues that there is as synergy among these technologies, driven by technical, as well as economic, factors. The synergy takes place both at the mid-scale spatial configuration (large workplace buildings and charging stations) and less obviously at other scales (e.g., households and territories). Reference [19] takes a broad perspective presenting an energy, economic, and environmental feasibility study specifically regarding nocturnal electric vehicle (EV) charging by a residential user. He considers three EV-charging scenarios: use of the electrical grid; use of a grid-connected PV system with a storage battery; and use of an electrical grid-connected PV system with a storage battery, also in the presence of a residential user. He also develops two sub-scenarios that foresee the purchase of the EV as an alternative to a vehicle powered, respectively, by petrol and diesel. The main conclusion is that it is not possible to simultaneously comply with all the 3E objectives and constraints. However, it is possible to select optimal PV–BS–EV bundles from a unique point of view or those that lead to a trade-off. Regarding the economic viability of the system, Reference [19] states that the net present value is positive only when the distance traveled is higher than a determined value, without precisely stating which distance traveled is required and how this critical value varies depending on the characteristics of the microgrid. The adoption of residential PV, BS, and EV can have positive implications at the wider scale. In fact, Reference [20] finds that residential smart charging complemented by time-of-use (TOU) tariffs with added daytime periods are policies with the most potential to advance California’s dual goals of enhancing widespread adoption of EVs and the increase of the share of renewable energy in the electricity mix.
Some contribution come from the economic and marketing literature. Some papers underline that consumers view EV, PV, and BS as complements that together generate higher customer value than separately [5,21] and that most of the potential EV drivers living in a house consider purchasing a PV system once they purchase, or even before they purchase, an EV [22]. Reference [21] states that PV owners are willing to buy BS despite higher costs and longer payback periods, to become self-sufficient and electrical-grid-independent. Reference [23] explores the market acceptance factors of residential microgeneration technologies in Greece, as well as how these factors change over time, based on real decisions made by consumers. They find that socioeconomic and residence characteristics, as well as environmental behavior, play a major role. They do not include the EV in their analysis. Reference [24] analyzes, via a choice-based conjoint study in Austria, whether bundling together a product that includes an EV and a PV and battery storage (BS) system for households could be instrumental in improving EV adoption. They find that a majority of potential EV drivers, given the choice, would prefer to purchase an EV in such a bundle. Furthermore, the purchase intention for a PV and BS is twice as high in a bundle with an EV as standalone.
In the transportation literature, several recent contributions apply the TCO methodology to evaluate the economic case for EVs adoption. The TCO methodology is widely adopted to compare different products. It represents a tool to estimate the true financial cost of a good [25,26]. Although estimating a TCO model presents computational challenges, it provides a useful information to consumers, fleet managers, manufacturers, and policymakers. An important aspect to consider is that the TCO is inherently vehicle-, region-, and individual-specific. Cost competitiveness among propulsion systems depends on the vehicle market segment (small, medium, or large cars, SUVs, LCVs, trucks, etc.). Country and regional specificities are connected with policy choices regarding vehicles’ and fuel taxation. Finally, TCO is individual-specific related to the driving style, traveling and charging habits/needs and vehicle use intensity (measured by the average annual distance traveled). Several papers have explored these TCO differences. The authors of this study have performed previous TCO applications to different market segments, including private cars [27,28,29,30], LCVs [31], and taxis [32].
This paper combines the abovementioned streams of the literature and presents a model that evaluates the technical and economic characteristics of a PV–BS–EV bundle, using several energy metrics and linking them to the TCO metric.
3. Methodology
3.1. Estimating the Levelized Cost of Recharged Energy with Photovoltaics
Starting from the concept of levelized cost of energy (LCOE) [33], we define, as a new metric, the levelized cost of the photovoltaic recharge (LCOPR, (€/kWh)) as follows:
where OCS (€) is the overnight capital cost, FO&MC (%) are the fixed operation and maintenance costs as a percentage of the OCS, E0 (kWh/kWp/year) is the yield of the plant, (%/year) is the degradation rate of the PV modules, N is the project lifetime (years), and CRF (%) is the capital recovery factor that can be computed as:
WACC (%) is the weighted average cost of capital:
where E (€) is the equity, D (€) is the debt, (%) is the return on equity, and (%) is the cost of debt.
In Italy, the purchase and installation of a residential storage system linked to a rooftop PV system allows purchasers to take advantage of two main fiscal benefits: These plants are eligible for a reduced VAT of 10%, and 50% of the total expenditure, up to a maximum of €96,000 per housing unit, can be deducted (over a period of 10 years, via ten equal annual quotes) from the personal income tax [34]. We then account for this tax rebate by subtracting to the OCS the amount of the deduction, named TaxDeduction (€), which is equal to the following:
As for the household domestic load, since the focus of the paper is on EVs, based on [35,36], we make the assumption that residential users self-consume 36% of the electricity produced by the PV plant for running the domestic appliances (thus saving the Grid electricity price (€/kWh)) and sell the surplus (PV2Grid, (kWh)), injecting the energy into the distribution network. The price recognized by the Distribution System Operator (DSO) is named PR (€/kWh). We value these revenues and savings in the computation of the LCOPR.
3.2. Estimating the Levelized Cost of Storage of a Battery Storage System
An energy storage system designed for behind-the-meter residential home use provides backup power, power quality improvements, and extends the usefulness of self-generation. It also regulates the power supply and smoothens the quantity of electricity sold back to the electrical grid from distributed PV installations.
The Levelized Cost of Storage, LCOS is the “all-in” cost to design, construct, and utilize the BS over the course of its useful economic life cycle. In particular, this includes the fixed and variable O&M costs, the effects of the battery degradation over time (i.e., decreased output), etc. The LCOS calculation for energy storage is analogous to the LCOPR calculation for power generation facilities, but considers the discharged electricity (kWh) instead of the generated electricity as the normalization factor for the overall cost. The battery lifetime is greatly affected by the number of discharge/recharge cycles and the depth of discharge in terms of percentage of total discharge. The LCOS (€/kWh) can be computed as follows:
where OCS denotes the purchase price of the storage system per unity of stored energy, BC is the storage usable capacity that involves how much electricity in kWh can be stored in the battery, and the discharged energy is the amount of energy that flows from the PV to the storage during the entire battery lifetime. Fiscal benefits are computed as in the case of the PV plant. We do not consider O&M cost or the time value of money as opposed to the more commonly used LCOS, since we assume that the commercially available storage systems are maintenance-free.
3.3. EV Driving Profile Model
We have modeled the profile of a typical user of an EV during a solar year. This user goes to work by car five days a week, while on Saturday and Sunday stays at home or takes a day trip. S/he has two long holidays, fifteen days in summer and fifteen days in winter. We have introduced also some Italian holidays, which are a three-day Easter holiday, April 25, May 1, June 2, and November 1–3. During holidays, the user may set out on a long journey or stay at home. When the user stays at home during holidays, every day s/he may take a day trip or not. A uniform binary distribution, one turn of pitch-and-toss, realizes each choice. The timeline is divided in days, hours in a day, and fractions of hours, expressed with a real number in the interval (0, 1). Distances are in (km). The general performance of the system changes when the total kilometers traveled in a year changes. Therefore, we have set the parameters of the model so that the annual total distance traveled may change between 5000 and 25,000 km. Note that daily distances are usually set within the maximum range of car, both in mild and in cold periods, to limit charges at public charging stations. Times of departure, of home return, and covered distances are set, by means of a uniform distribution, within an interval (Xmin, Xmax), where X denotes the current value. We examine, hereafter, in detail, the simulation parameters.
3.3.1. Workdays and Day Trips
The user takes the car every workday in the morning and returns home in the afternoon. During weekends and single-day holidays, the user may take a day trip or not. On holidays lasting more than one day, the user can choose to go out of the city for a long stay, or to remain at home. If s/he remains at home, each day s/he can take a trip. Table 1 reports the departure and return time intervals. As far as the daily distance traveled is concerned, starting from the base case reported in Table 1, that approximates an annual distance traveled (ADT) of about 10,000 km, we simulate different mobility profiles by multiplying such an interval for an index , obtaining ADT values between 5000 and 25,000 km.

Table 1.
Time intervals and distance traveled in work days and day trips.
3.3.2. Long-Distance Holidays
If the user sets out on a long journey, there is a fixed day of departure and a fixed day of return home, for each considered holiday. Since the covered distance may be large, we have considered the difference of the car real range between the cold and mild season. Table 2 summarizes these positions.

Table 2.
Time intervals and distance traveled for long journeys.
During days spent out of the city, the user can use the car for short distances, chosen in the interval (0, 15).
3.4. Energy Flows Model
We consider the system sketched in Figure 1, representing a typical application, consisting of a 4 kWp photovoltaic generator, a DC–DC converter following the maximum power point of the PV field, a second DC–DC converter that regulates the 10 kWh battery state of charge in the range (10–100%), and an inverter linking the system to the local low voltage grid (230 V). The maximum power is 3.3 and 4.6 kW for the battery converter and the inverter, respectively. The EV is connected as a normal load within the user’s local network, and the charging power is 2.3 kW, a typical charging power for current commercial EVs.
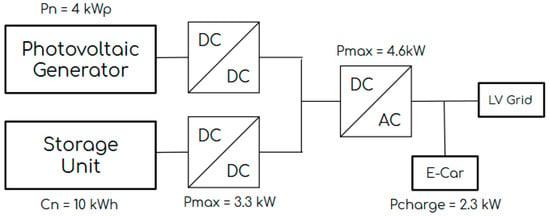
Figure 1.
Block diagram of the system considered in this study.
In order to calculate the amount of solar energy used to charge the EV, directly or through the storage unit, a power profile was taken from the well-known PVGIS-CMSA database [37]. The profile was downloaded for the city of Trieste (Italy), and the reference year was 2016, a leap year with 366 days.
The management of energy is set in a way that only the PV generator can charge the battery, while the storage unit is dedicated to the charge of the car only. When the PV production exceeds the charging needs, the excess of power goes to the local LV grid and is used to feed the local loads and the surplus injected into the distribution grid. On the other hand, when the PV generator cannot provide the requested charging power, then part of it is taken from the grid.
The user takes the plug off immediately before leaving home and puts the car in charge as soon as s/he arrives at home. When there is sunlight, PV power charges the car. If it is not sufficient, then the storage charges the car. If the storage is not sufficient, then the energy is drawn from the LV grid. On the other hand, if the PV power is greater than the power needed for charging the EV (Pcharge), then the remaining part is delivered to the storage, if SoC < 1 (where SoC is the State of Charge), otherwise to the LV grid. If there is no sunlight, the storage charges the car, until it is empty, and then the power is drawn from the LV grid. The value SoCmin represents the minimum possible SoC. Finally, if there is no sunlight and the car is not present, no action takes place. Table 3 summarizes this model in detail.

Table 3.
Energy-flows model outline.
The presence or not of sunlight and the presence or not of car determines the four main cases listed in the table. Cases A, B, and C give source to two sub-cases each, depending on the SoC value (third column). Case D instead implies no action at all. The most branched case is case A, because it needs a comparison between PV power and Pcharge. ∆PV power denotes the difference (PV power−Pcharge) delivered to storage if PV power > Pcharge. Items (1—Storage power to car) and (2—LV grid power to car) in the same cell denote an order of activation. If the storage power is not sufficient to charge the car, then the LV grid provides the required additional power. Note that, when the car is fully charged, the algorithm jumps from case A to case B and from case C to case D, respectively. A fully charged car is equivalent to an absent car. In the same way, when either SoC < 1 becomes SoC = 1 or SoC > SoCmin becomes SoC = SoCmin, the algorithm jumps to the group of cells below.
Solar-Forecast-Based Charging Strategy
If the user charges the car as soon as s/he arrives at home, the car is charged mainly by the storage or the LV grid, because charging begins in the evening and ends during the night, before sunrise. This is not advisable because direct PV charging is less expensive, even if the net balance between PV electricity discharged into the electrical grid and charging electricity taken from grid is positive. Hence, we have introduced a solar-forecast-based strategy, consisting of two provisions:
- During work days, the system checks the weather forecast at evening. If the next-day morning sunlight is high enough, the car is charged by storage and LV grid until 90% of full charge. In the morning, the PV power will top off the charge before the user takes the car.
- If the user expects to remain at home next day, then the car is not charged at all during evening and night. The PV power will charge the car during the next day, and then the remaining part is redirected to storage and LV grid.
With these provisions, the percentage of LV direct charge raises considerably, as it shown in the next sections.
3.5. The PV–BS Electricity Cost
The actual cost of electricity for EV charging is dependent on how much and from which energy source the vehicle is charged. In particular, if the EV is recharged directly from the PV, the user will pay for each kWh an amount of money equal to the LCOPR. Otherwise, the EV has to use the energy stored in the battery (if any), thus paying an electricity price equal to the production cost (LCOPR), plus the storage cost (LCOS). If the EV needs a higher amount of energy, it has to use the public electrical grid, paying the market grid electricity price. Hence, we get the following equation:
where %PV2EV is the percentage of the electricity drawn directly from PV over the total electricity needed to charge the EV, %BS2EV is the percentage of electricity from storage to EV, and %Grid2EV is the percentage of electricity drawn from the electrical grid.
3.6. Total Cost of Ownership Model
The private TCO of a vehicle covers all costs occurring over its lifetime. It includes the lump-sum initial costs (IC (€)), the annual operating costs (AOC (€)) during the period of use and the residual value (RV (€)) of the vehicle at time T, when it is sold or scrapped [32]. IC includes all the upfront expenses to acquire a vehicle, usually termed Manufacturer’s Suggested Retail Price (MSRP (€)). If the car acquisition is financed with borrowed money, the initial costs are subject to an Annual Percentage Rate (APR ), which represents the actual yearly cost of funds over the term of a loan. In addition to the MSRP, IC encompasses possible retailer’s discounts (RD (€)), government subsidies (SUB (€)), registration costs (RC (€)), and, in the case of EVs, the costs for acquiring and installing the home charging equipment (e.g., wall-box) (HC (€)):
AOC includes all the costs incurred during the period of ownership T (years) of the vehicle. For every year t ∈ (1, T), AOC is equal to the following:
CT (€) is the circulation tax, INS (€) is the insurance premium, MAINT (€) is the repair and maintenance cost depending on the annual distance traveled (ADT), and FE (€) stands for the fuel/electricity cost to run the car for a given ADT. FE is equal to the following:
where FE_E is the fuel/electricity efficiency (i.e., fuel/electricity consumption in liters or kWh per 100 km) and FE_P is fuel/electricity price (i.e., its average price in € per liter or kWh). We distinguish between urban and extra-urban cycles. Moreover, since extreme temperatures affect BEV FE_E, we specify FE_E as follows:
where γ is the weather-adjustment factor; and are the fuel/electricity efficiency in urban and in extra-urban roads, respectively; and α is the percentage of trips driven in an urban area.
The electricity cost depends on whether BEV charging takes place at home or at public chargers. Therefore, we compute the weighted average of the electricity price paid at home, , and that at the public charger, , denoting with β the percentage of electricity charged at home. For diesel and petrol cars (including petrol–electric HEVs), we consider the average price paid. Hence, we specify FE_P as follows:
The abovementioned costs, however, have different timelines. In order to obtain an estimate of the annualized TCO of the vehicle to be compared among different propulsion systems given an annual distance traveled, we need to make these costs comparable through discounting and annualization adjustments, as described in the following. The total amount to be paid to the retailer when purchasing the vehicle, MSRP–RD-SUB, when financed with borrowed money at a given APR for the ownership period T of the vehicle, generates annual constant costs equal to the following:
Initial costs include also RC and HC. Their annualized value is obtained by multiplying them by the CRF, i.e., the capital recovery factor equal to , where i (%) is the real discount rate:
The Annualized Initial Cost (AIC (€)), hence, is computed as follows:
Since AOC takes place during the lifetime of the vehicle, we discount each annual cost component, and we sum these values and compute the average value over the period of ownership, T, obtaining the average annual operating cost (AAOC (€)):
Finally, we consider the discounted and annualized residual value (DARV (€)):
where RV can be expressed as a percentage η of the MSRP. Therefore, the annualized TCO metric, given a specific annual distance traveled, is the following:
Dividing this sum by the ADT in kilometers, we finally obtain the metric TCO/km, which represents the average cost per kilometer (€/km) of owning a given vehicle:
4. Case Study
The model is estimated with reference to a representative household located in the Northeastern part of Italy. The following PV–BS–EV components are assumed.
4.1. PV Module
We consider a PV solar array with the following characteristics:
- Technical assumptions: : 4 kWp; degradation rate : 0.90% per year;
- Economic assumptions: PV overnight capital costs (OCS): 2000 €/kWp + 10%VAT; fiscal incentives: 50% tax rebate on the OCS; fixed operation and maintenance costs (FO&MC): 2.5% of the initial costs; guaranteed lifespan: 30 years; the capital structure is 50% equity with 1% cost of equity and 50% debt with a 5% cost of debt, which results in a weighted average cost of capital (WACC) rate of 3%; price recognized by the DSO (PR) = 0.0398 €/kWh.
4.2. Battery Storage
We consider a battery storage array with the following characteristics:
- Technical assumptions: nameplate and usable capacity: 10 kWh;
- Economic assumptions: battery price: 700 €/kWh + 10% VAT; fiscal incentives: 50% tax refund; guaranteed lifespan: 10 years.
4.3. EV and ICEV
As an EV, we consider the Nissan Leaf N-Connecta 40 kWh that we will compare with the Nissan Qashqai 1.3 DIG-T 140 CV N-Connecta. They have different propulsion systems but similar characteristics in terms of size, power, and technical equipment. They have the following technical and economic characteristics:
- Nissan Leaf. Concerning the initial costs, we use the following values: MSRP: €39,475; battery capacity of 40 kWh; registration costs (RC): €522; government subsidies (SUB): €6000 in line with the recent Italian policies, supporting EV uptake. Concerning the annual operating costs, we assume the following values: insurance premium is highly affected not only by factors related to vehicle’s features but also by driver’s characteristics (e.g., past accidents history), residential area, and the commercial strategy of the insurance company. In this analysis, we assume as a reference user a 40-year-old man living in the Friuli Venezia Giulia Region. We use quotes obtained from “facile.it”, a website comparing the most important Italian insurance companies obtaining a value INS = €359; repair and maintenance cost (MAINT): 0.05 €/km, assuming a value 30% lower than that of ICEVs because of regenerative breaking, no oil change, spark plugs, or transmission fluids; circulation tax (CT): €0 (in Italy EVs are exempt from the annual circulation tax); home charging equipment (HC): €1000; resale value: η = 20% of the MSRP after a period of ownership T = 8 years, electricity consumption in urban areas: 14.2 kWh/100 km; electricity consumption in extra-urban areas: 20.6 kWh/100 km; weather-adjustment factor (γ): 1.15, i.e., we assume for EVs a 30% decrease in electricity efficiency when driving at very high (in summer) or very low (in winter) temperatures; electricity price from the electrical grid (net of the fixed costs and including taxes on variable costs): 0.119 €/kWh.
- Nissan Qashqai: MSRP: €29,000; registration costs (RC): €577; circulation tax (CT): €270; insurance premium (INS): €412; repair and maintenance cost (MAINT): 0.07 €/km; resale value: η = 40% of the MSRP after a period of ownership T = 8 years; fuel efficiency in urban areas: 7 l/100 km; fuel efficiency in extra-urban areas: 5 l/100 km; petrol price = €1.645 (the value is kept constant over the vehicle lifetime).
4.4. Financial Assumptions
Moreover, we assume a real discount rate (i) equal to 1% that is the current interest rate of Italian treasury bonds with a residual maturity of eight years. Even if traditionally, in Italy, it was common to pay cash, recently more and more people finance their car purchases with borrowed money. Therefore, we assume that the car buyer finances the purchase with a loan, paying an average Annual Percentage Rate (APR) equal to 5%, in line with the most common values charged by financial institutions or retailers in Italy.
5. Results
We apply the model to two base-case scenarios: (1) with the solar-forecast-based charging strategy and (2) without solar-forecast-based strategy. Recall that, in the section called “Solar Forecast-Based Charging Strategy”, we assumed that the car, upon arriving at home, could be recharged mainly by drawing from the storage or from the LV grid before the next day’s sunrise. Alternatively, and more advisably, one may check the next day’s weather forecast and, if there is enough sunlight, charge with the storage and LV grid up to 90% and let the morning sunlight finish the charge before departing.
Next, adopting the solar-forecast-based strategy, we consider two simulative scenarios: (a) a scenario with a 50% lower BS capacity (i.e., 5 kWh) than in the base-case scenario; (b) a scenario without purchase subsidies on EV and tax deductions on the PV and BES equipment.
For each scenario, the model estimates the following metrics:
- The percentage of the electricity drawn directly from PV with respect to the total electricity needed to charge the EV (%PV2EV);
- The percentage of electricity from storage to EV (%BS2EV);
- The percentage of electricity withdrawn from the electrical grid (%Grid2EV);
- The percentage of electricity produced by PV and self-consumed for the household domestic load (%PV2HDL);
- The percentage of electricity produced by PV and discharged into the electrical grid (%PV2Grid);
- The levelized cost of the photovoltaic recharge (LCOPR);
- The levelized cost of storage (LCOS);
- The PV–BS electricity cost;
- The TCO/km of the EV coupled with a PV–BS system (EVPV–BS);
- The TCO/km of the EV charged only from the electrical grid (EVgrid);
- The TCO/km of the petrol fueled ICEV.
5.1. Base-Case Scenario without the Solar-Forecast-Based Charging Strategy
When the users completely charge the car in the evening, as soon as they arrive at home, they are not able to take advantage of the electricity directly produced by the PV; hence, they have to rely on the storage or the LV grid. Figure 2 shows that, when increasing the ADT, the percentage of the electricity drawn directly from PV over the total electricity needed to charge the EV (%PV2EV) reaches values up to 3%. The percentage of electricity from storage (%BS2EV) equals 93% when the ADT is equal to 5000 km. The motivation is that the demand of electricity for recharging the EV is low and can be almost completely satisfied by the PV–BS system and only 7% is withdrawn from the electrical grid. Increasing the ADT up to 25,000 km requires more and more electricity from the electrical grid (up to 50%), since the PV–BS system becomes insufficient. The discharge into the electrical grid of the excess of electricity produced by PV (%PV2Grid) decreases for longer distances traveled. Note that, for this and all the following cases, the fluctuations superimposed to the clearly observable trends are associated to the randomization of the input variables. Our estimates are in line with the energy charging flows actually recorded in the grid-connected system with similar technical characteristics that is operating at the University of Trieste [10].
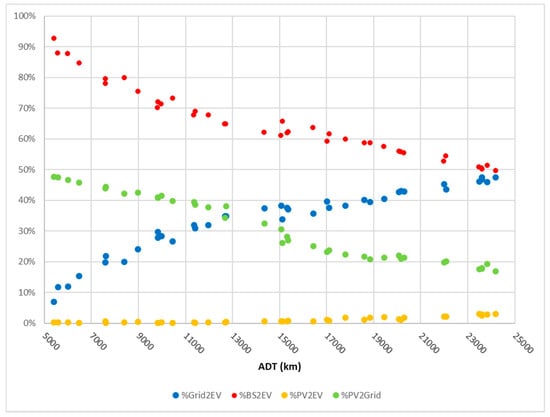
Figure 2.
Energy source used to charge the EV and electricity discharged to the electrical grid, with varying ADT in the base-case scenario, without the solar-forecast-based strategy.
5.2. Base Case Scenario with the Solar-Forecast-Based Charging Strategy
Let us now investigate what happens if the system allows for adapting the charging on the sunlight forecast. Such an option makes it possible to take advantage of the electricity produced by PV for recharging the vehicle during the morning hours’ previous departure, thus realizing a monetary saving, since the LCOPR is lower than the grid electricity price. Figure 3 shows that, with the solar-forecast-based strategy, the %PV2EV jumps to 39% for an ADT equal to 5000 km and decreases to 21% when the ADT reaches 25,000 km. The %Grid2EV decreases from the previous 7–50% range to a 10–38%. This result confirms that, if the user is able to optimize his/her charging strategy, a greater grid independence can be achieved.
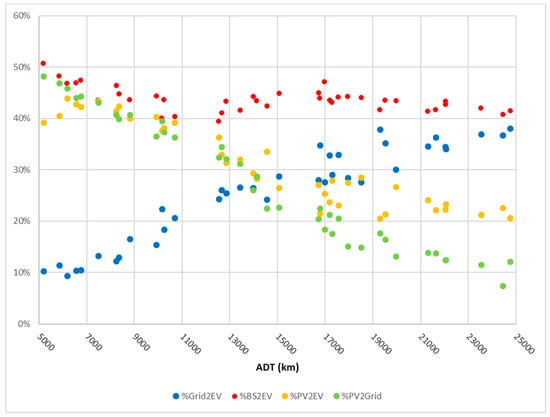
Figure 3.
Energy source used to charge the EV and electricity discharged into the electrical grid with varying ADT in the base-case scenario with the solar-forecast-based strategy.
Figure 4 shows the cost of electricity from the different energy sources. The LCOPR remains negative for all ADT, also thanks to the fiscal incentive (50% of tax deductions). While remaining negative, the value tends to zero as ADT increases, since the electricity demand from the EV increases, thus reducing the electricity discharged into the electrical grid and the generating revenues. The LCOS decreases as the ADT increases, since the amount of electricity going through the storage increases. The resulting electricity cost (PV–BS electricity cost), which is a weighted average of the LCOPR, LCOS, and grid electricity price, decreases. When ADT is higher than 10,000 km, the PV–BS electricity cost is lower than the Grid electricity price.
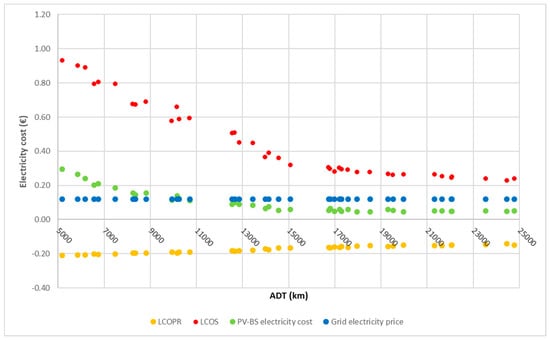
Figure 4.
LCOPR, LCOS, and PV–BS electricity cost in the base-case scenario with solar forecast-based strategy.
Figure 5 illustrates the impact on the economic competitiveness of the EV with respect to its petrol counterpart of both the ADT and the PV–BS system. In general, the EV becomes more convenient the higher the distance traveled. Specifically, for the case of the EV coupled with the PV–BS system, the TCO/km is lower than that of its petrol counterpart for ADT higher than 10,000 km. The TCO/km of the coupled system is always lower than that of the EV charged from the electrical grid, except for short traveled distances (ADT less than about 7000 km), where the difference between the two solutions is marginal. For long traveled distances (ADT higher than about 12,000 km), the TCO/km of the petrol-powered car and that of the EV charged from the electrical grid differ only marginally.
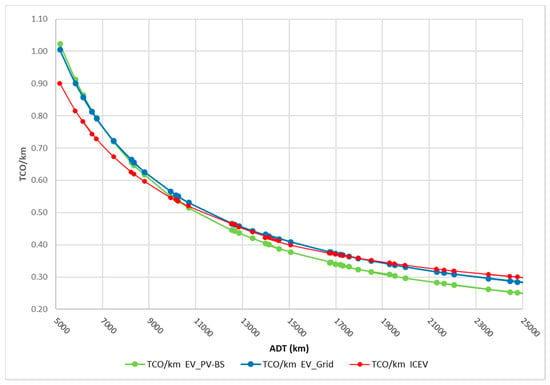
Figure 5.
TCO/km in the base-case scenario with varying ADT.
5.3. Simulative Scenarios
5.3.1. Simulative Scenario 1: 50% Reduction of the Storage Capacity
We now consider a simulative scenario where the BS capacity is reduced from 10 to 5 kWh and where the solar forecast-based charging strategy is applied. The results are illustrated in Figure 6, Figure 7 and Figure 8. Compared to the base-case scenario, the dependency from the grid increases (the %Grid2EV increases from a range 9–38% to a range 18–56%, and is larger for any ADT), but the economic viability of the system improves. The PV–BS electricity cost is lower than the grid electricity price for any ADT, and the EVPV–BS is competitive with the ICEV when the ADT is above 9000 km. This finding highlights the trade-off between the economic and the energy self-sufficiency goals and the need to optimize the PV–BS–EV system according to the specific driving profile of the user. We plan to analyze this issue in more depth in a future research project.
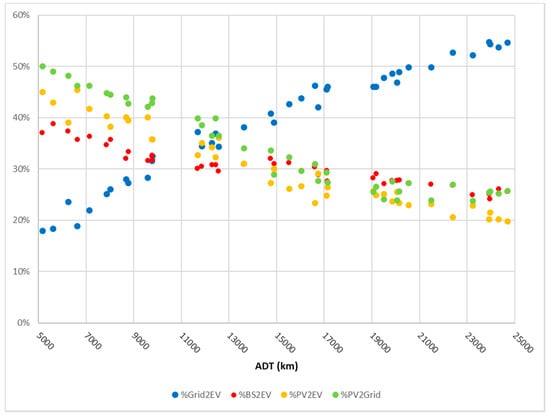
Figure 6.
Energy source used to charge the EV and electricity discharged into the electrical grid with varying ADT in Scenario 1.
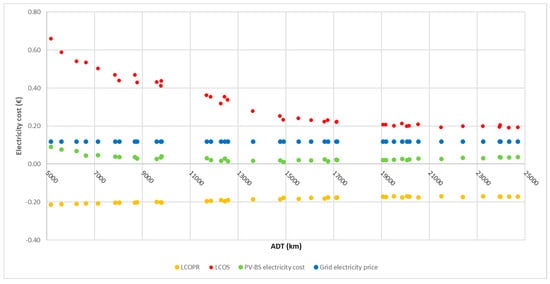
Figure 7.
LCOPR, LCOS, and PV–BS electricity cost in Scenario 1 with solar-forecast-based strategy.
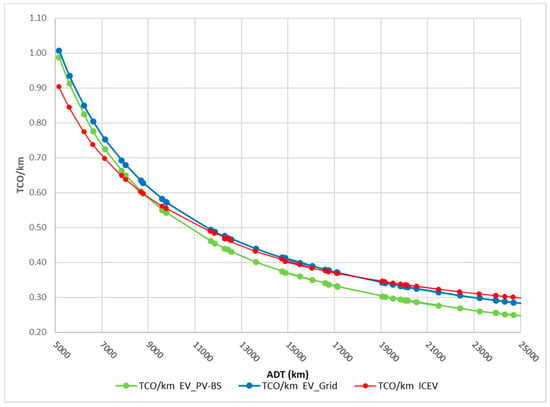
Figure 8.
TCO/km in Scenario 1 with varying ADT.
5.3.2. Simulative Scenario 2: Removing Purchase Subsidies on EV and Tax Deductions on the PV and BS Equipment
We now consider a simulative scenario without any fiscal incentives. We set to zero both the EV purchase subsidy and the tax deduction on PV and BS. Removing these fiscal incentives has no impact on the composition of the energy sources for recharging the EV. Instead, it has an important impact on the PV–BS Electricity Cost, which always becomes higher than the Grid Electricity Price (Figure 9).
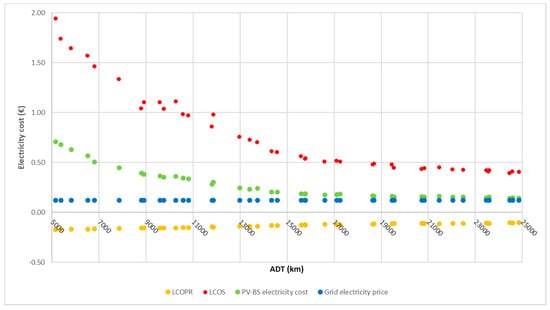
Figure 9.
LCOPR, LCOS, and PV–BS electricity cost in Scenario 2 with solar forecast-based strategy.
Similarly, as illustrated in Figure 10, phasing out the subsidy worsens the TCO/km metric. The EVPV–BS has a lower TCO/km relative to the ICEV only when ADT is higher than 25,000 km.
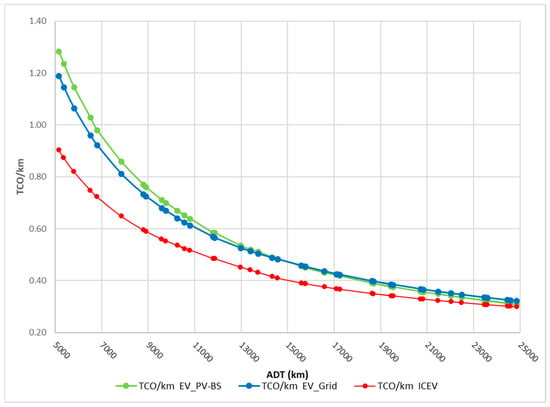
Figure 10.
TCO/km in Scenario 2 with varying ADT.
6. Discussion and Conclusions
In this paper, we developed a technoeconomic model that combines an energy model, a driving profile model, and a total cost of ownership model. The model allows us to estimate several energy and economic metrics that provide information on the electricity self-sufficiency, on the electricity discharged into the electrical grid, on the cost of the electricity used to charge the EV, and on the resulting TCO/km, which is then compared to the TCO/km of an EV charged by electricity exclusively drawn from the electrical grid and with that of a petrol-fueled ICEV. The model is applied to a variety of the user’s driving profiles and the resulting average annual distance traveled.
The PV–BS–EV bundle, given the current prices, subsidies, and available technologies in Italy, presents interesting characteristics both from an energy and economic standpoint. From an energy point of view, we find that the degree of electricity self-production used to charge the EV might be very high, varying from 90% to 62%, depending on the ADT. The PV–BS electricity cost might be lower than the grid electricity price, depending on the ADT and on the fiscal incentives. We also find that a solar-forecast-based charging strategy based on both economic factors and weather forecast can greatly enhance self-sufficiency from the electrical grid, as well as the economic viability of the PV–BS–EV bundle. Consequently, a properly selected PV–BS–EV bundle might currently be an interesting value proposition for many consumers. In line with Reference [19], we confirm that, when the user has a low ADT, the PV–BS–EV bundle is not cost competitive. We estimate such a value to be below 10,000 km/year, given the current financial incentives. Such a threshold distance is not far from the average ADT of the Italian drivers, so that the number of customers who might benefit from a PV–BS–EV bundle might be not small. Further research is needed to estimate the potential market for such a bundle, considering the residential distribution between apartments and single houses and the driving profiles.
Similarly to Reference [7], we have evaluated the impact of fiscal policies on the cost-competitiveness of the PV–BS–EV bundle. We find that the phasing out of these fiscal benefits, for reasons related to the sustainability of the public budget, would result in a modest increase of the PV–BS electricity cost, but in a significant increase in the ADT (more than 25,000 km/year) needed to make the EVPV–BS cost competitive with the ICEV. Therefore, we argue that the economic viability of the PV–BS–EV bundle is still heavily dependent on fiscal incentives, as previously argued by [14].
Finally, as already shown by some authors [19,20], we also detect that there is a trade-off between environmental, energy, and economic objectives, which raises the issue of determining the optimal size of the components of the bundle based on the user driving profile.
The model developed in this paper is a simulative tool that might help interested parties to understand the potential of bundling an electric car with a residential photovoltaic generator and a battery storage unit. Car manufacturers might use the results of such a tool to promote their commercial offering and streamline their marketing strategies. As pioneered by Tesla, more and more car manufacturers view their cars, especially the electric ones, not just as a simple product but as a bundle of products and services customized to the customers’ needs. Similarly, electricity providers might use our tool to upgrade their service and extend the range of products. An Italian example is Enel X, which promotes a range of products and services, much richer and diversified than the traditional energy supply. Last but not least, the results of this study are relevant for the individual households, being the final customers of a PV–BS–EV bundle. In order to take informed and financially sound decisions, they need to be able to evaluate the technical and economic viability of the bundle, relative to the current practice. As more and more energy consumers turn into energy prosumers, the more relevant will be their impact on the energy infrastructure and on local and national energy systems, as the literature illustrated in Section 2 has demonstrated. Consequently, the findings of this paper are of special relevance also for the policymaker. If the PV–BS–EV bundle gains acceptance and widespread adoption in the market, several energy and environmental impacts will take place. Our model might help policymakers design proper policy incentives to foster the uptake of PV–BS–EV bundles.
As any model, the set of models we proposed represent a simplification of the real world and of the users’ behavior. Several improvements are possible and actual data might be collected to test the predictive ability of the model. An important one is to model in greater detail the household electrical load, accounting for its seasonal variability. A further improvement concerns the modeling of the driving profile. Although detailed, our assumptions might not be sufficiently representative of the large variability of the actual driving and charging patterns of EV users. For some distances, fast charging might be unavoidable. Charging at work or charging while shopping at reduced rates might be a convenient alternative to charging at home, hence generating charging profiles different from the ones we have modeled.
The data in this paper are publicly available, and the results can be used for replication and comparison.
Author Contributions
Conceptualization, M.S., R.D., S.P., V.L., and A.M.P.; methodology, M.S., R.D., S.P., and A.M.P.; software, M.S. and S.P.; validation, M.S., R.D., S.P., V.L., and A.M.P.; formal analysis, M.S. and S.P.; data curation, M.S., R.D., S.P., V.L., and A.M.P.; writing—original draft preparation, M.S., R.D., S.P., and A.M.P.; writing—review and editing, M.S., R.D., S.P., V.L., and A.M.P. All authors have read and agreed to the published version of the manuscript.
Funding
This research received no external funding.
Conflicts of Interest
The authors declare no conflict of interest.
Nomenclature (NA: Not Applicable)
| UNIT | ||
| AAOC | Average annual operating costs | € |
| ADT | Annual distance traveled | km |
| AIC | Annualized initial cost | € |
| AOC | Annual operating costs | € |
| APR | Annual percentage rate | % |
| BC | Battery capacity | kWh |
| BS | Battery storage | NA |
| CRF | Capital recovery factor | % |
| CT | Circulation tax | € |
| DARV | Discounted and annualized residual value | € |
| dr | Photovoltaic module degradation rate | %/year |
| DSO | Distribution system operator | NA |
| E0 | Yield of the photovoltaic plant | kWh/kWp/year |
| EVs | Electrical vehicles | NA |
| FE | Fuel/electricity cost | € |
| FE_E | Fuel/electricity efficiency | Liter or kWh/100 km |
| FE_P | Fuel/electricity price | €/liter or €/kWh |
| FO&MC | Fixed operation and maintenance costs (photovoltaic plant) | % |
| HC | Home-charging equipment cost | € |
| i | Interest rate | % |
| IC | Initial cost | € |
| ICEVs | Internal combustion engine vehicles | NA |
| INS | Insurance premium | € |
| LCOE | Levelized cost of energy | €/kWh |
| LCCOS | Annualized life cycle cost of storage | €/kWh |
| LCOPR | Levelized cost of photovoltaic recharge | €/kWh |
| MSRP | Manufacturer suggested retail price | € |
| MAINT | Maintenance cost (vehicle) | € |
| OCS | Overnight capital cost | € |
| PHEV | Plug-in hybrid electrical vehicle | NA |
| PR | Price recognized for the energy injected into the grid | €/kWh |
| PV | Photovoltaic | NA |
| PVGIS | Photovoltaic geographical information system | NA |
| PV2GRID | Electricity produced by the photovoltaic plant and injected into the grid | % |
| RC | Registration cost | € |
| RD | Retailer discount | € |
| SOC | State of charge | % |
| SUB | Government subsidies | € |
| TCO | Total cost of ownership | €/km |
| WACC | Weighted average cost of capital | % |
References
- International Energy Agency. Global Ev Outlook 2019. Scaling-Up the Transition to Electric Mobility; International Energy Agency: Paris, France, 2019. [Google Scholar]
- European Environment Agency. Electric Vehicles From Life Cycle and Circular Economy Perspectives. Term 2018: Transport and Environment Reporting Mechanism (Term) Report; European Environment Agency: Luxemburg, 2018. [Google Scholar]
- Cavallaro, F.; Danielis, R.; Nocera, S.; Rotaris, L. Should BEVs be subsidized or taxed? A European perspective based on the economic value of CO2 emissions. Transp. Res. Part D Transp. Environ. 2018, 64, 70–89. [Google Scholar] [CrossRef]
- Hanssen, S.V.; Lam, A.; Pollitt, H.; Salas, P.; Chewpreecha, U.; Huijbregts, M.A.J.; Mercure, J.F. Net emission reductions from electric cars and heat pumps in 59 world regions over time. Nat. Sustain. 2020. [Google Scholar] [CrossRef]
- Delmas, M.A.; Kahn, M.E.; Locke, S.L. The private and social consequences of purchasing an electric vehicle and solar panels: Evidence from California. Res. Econ. 2017, 71, 225–235. [Google Scholar] [CrossRef]
- Connecticut Green Bank. Already Own an EV? Add Solar + Storage for More Savings. Available online: https://ctgreenbank.com/ev-bundle/ (accessed on 1 March 2020).
- Nousdilis, A.; Kryonidis, G.; Kontis, E.; Barzegkar-Ntovom, G.; Panapakidis, I.; Christoforidis, G.; Papagiannis, G. Impact of Policy Incentives on the Promotion of Integrated PV and Battery Storage Systems: A Techno-economic Assessment. IET Renew. Power Gener. 2020. [Google Scholar] [CrossRef]
- Rinaldi, A.; Soini, M.C.; Patel, M.K.; Parra, D. Optimised allocation of PV and storage capacity among different consumer types and urban settings: A prospective analysis for Switzerland. J. Clean. Prod. 2020, 259, 120762. [Google Scholar] [CrossRef]
- Zhao, J.; Kucuksari, S.; Mazhari, E.; Son, Y.J. Integrated analysis of high-penetration PV and PHEV with energy storage and demand response. Appl. Energy 2013, 112, 35–51. [Google Scholar] [CrossRef]
- Pavan, A.M.; Lughi, V.; Scorrano, M. Total cost of ownership of electric vehicles using energy from a renewable-based microgrid. In Proceedings of the 2019 IEEE Milan PowerTech, PowerTech 2019, Milan, Italy, 23–27 June 2019. [Google Scholar]
- van der Stelt, S.; AlSkaif, T.; van Sark, W. Techno-economic analysis of household and community energy storage for residential prosumers with smart appliances. Appl. Energy 2018, 209, 266–276. [Google Scholar] [CrossRef]
- Parra, D.; Walker, G.S.; Gillott, M. Are batteries the optimum PV-coupled energy storage for dwellings? Techno-economic comparison with hot water tanks in the UK. Energy Build. 2016, 116, 614–621. [Google Scholar] [CrossRef]
- Mostafa, M.H.; Abdel Aleem, S.H.E.; Ali, S.G.; Ali, Z.M.; Abdelaziz, A.Y. Techno-economic assessment of energy storage systems using annualized life cycle cost of storage (LCCOS) and levelized cost of energy (LCOE) metrics. J. Energy Storage 2020, 29, 101345. [Google Scholar] [CrossRef]
- Barcellona, S.; Piegari, L.; Musolino, V.; Ballif, C. Economic viability for residential battery storage systems in grid-connected PV plants. IET Renew. Power Gener. 2018, 12, 135–142. [Google Scholar] [CrossRef]
- Brenna, M.; Dolara, A.; Foiadelli, F.; Leva, S.; Longo, M. Urban scale photovoltaic charging stations for electric vehicles. IEEE Trans. Sustain. Energy 2014, 5, 1234–1241. [Google Scholar] [CrossRef]
- Gudmunds, D.; Nyholm, E.; Taljegard, M.; Odenberger, M. Self-consumption and self-sufficiency for household solar producers when introducing an electric vehicle. Renew. Energy 2020, 148, 1200–1215. [Google Scholar] [CrossRef]
- Wu, X.; Hu, X.; Moura, S.; Yin, X.; Pickert, V. Stochastic control of smart home energy management with plug-in electric vehicle battery energy storage and photovoltaic array. J. Power Sources 2016, 333, 203–212. [Google Scholar] [CrossRef]
- Hoarau, Q.; Perez, Y. Interactions between electric mobility and photovoltaic generation: A review. Renew. Sustain. Energy Rev. 2018, 94, 510–522. [Google Scholar] [CrossRef]
- Mazzeo, D. Nocturnal electric vehicle charging interacting with a residential photovoltaic-battery system: A 3E (energy, economic and environmental) analysis. Energy 2019, 168, 310–331. [Google Scholar] [CrossRef]
- Szinai, J.K.; Sheppard, C.J.R.; Abhyankar, N.; Gopal, A.R. Reduced grid operating costs and renewable energy curtailment with electric vehicle charge management. Energy Policy 2020, 136, 111051. [Google Scholar] [CrossRef]
- Agnew, S.; Dargusch, P. Consumer preferences for household-level battery energy storage. Renew. Sustain. Energy Rev. 2017, 75, 609–617. [Google Scholar] [CrossRef]
- EuPD Research, Elektroautos und Solaranlage Zusammen Anschaffen; Bundesverband Solarwirtschaft e.V.: Berlin, Germany, 2018.
- Karytsas, S.; Vardopoulos, I.; Theodoropoulou, E. Factors affecting sustainable market acceptance of residential microgeneration technologies. A two time period comparative analysis. Energies 2019, 12, 3298. [Google Scholar] [CrossRef]
- Priessner, A.; Hampl, N. Can product bundling increase the joint adoption of electric vehicles, solar panels and battery storage? Explorative evidence from a choice-based conjoint study in Austria. Ecol. Econ. 2020, 167, 106381. [Google Scholar] [CrossRef]
- Ellram, L.M. Total cost of ownership; An analysis approach for purchasing. Int. J. Phys. Distrib. Logist. Manag. 1995, 25, 4–23. [Google Scholar] [CrossRef]
- Ferrin, B.G.; Plank, R.E. Total cost of ownership models: An exploratory study. J. Supply Chain Manag. 2002, 38, 18–29. [Google Scholar] [CrossRef]
- Danielis, R.; Giansoldati, M.; Rotaris, L. A probabilistic total cost of ownership model to evaluate the current and future prospects of electric cars uptake in Italy. Energy Policy 2018, 119, 268–281. [Google Scholar] [CrossRef]
- Rusich, A.; Danielis, R. Total cost of ownership, social lifecycle cost and energy consumption of various automotive technologies in Italy. Res. Transp. Econ. 2015, 50, 3–16. [Google Scholar] [CrossRef]
- Scorrano, M.; Danielis, R.; Giansoldati, M. The cost gap between electric and petrol cars: An estimate via a persona-based deterministic and a probabilistic total cost of ownership model. Int. J. Transp. Econ. 2019, 46, 93–122. [Google Scholar]
- Scorrano, M.; Danielis, R.; Giansoldati, M. Dissecting the total cost of ownership of fully electric cars in Italy: The impact of annual distance travelled, home charging and urban driving. Res. Transp. Econ. 2020. [Google Scholar] [CrossRef]
- Scorrano, M.; Danielis, R.; Giansoldati, M. Electric Light Commercial Vehicles for a Cleaner Urban Goods Distribution. Are They Cost Competitive? Mimeo: Trieste, Italy, 2020. [Google Scholar]
- Scorrano, M.; Danielis, R.; Giansoldati, M. Mandating the use of the electric taxis: The case of Florence. Transp. Res. Part A Policy Pract. 2020, 132, 402–414. [Google Scholar] [CrossRef]
- Massi Pavan, A.; Lughi, V. Photovoltaics in Italy: Toward grid parity in the residential electricity market. In Proceedings of the Proceedings of the International Conference on Microelectronics, Algiers, Algeria, 16–20 December 2012. [Google Scholar]
- Italian Government. Italian Budget Law 2020. Available online: https://www.gazzettaufficiale.it/eli/id/2019/12/30/19G00165/sg (accessed on 1 March 2020).
- McKenna, E.; Webborn, E.; Leicester, P.A.; Elam, S. Analysis of international residential solar PV self-consumption (forthcoming). In Proceedings of the ECEEE 2019 Summer Study on Energy Efficiency, Belambra Presqu’île de Giens, France, 3–14 June 2019; pp. 707–716. [Google Scholar]
- Gestore dei Servizi Energetici. Rapporto Statistico Solare Fotovoltaico. 2017. Available online: https://www.gse.it/servizi-per-te/solare-fotovoltaico-pubblicato-il-rapporto-statistico-2017 (accessed on 17 May 2020).
- European Commission Photovoltaic Geographical Information System. Available online: https://re.jrc.ec.europa.eu/pvg_tools/en/tools.html (accessed on 1 March 2020).
© 2020 by the authors. Licensee MDPI, Basel, Switzerland. This article is an open access article distributed under the terms and conditions of the Creative Commons Attribution (CC BY) license (http://creativecommons.org/licenses/by/4.0/).