Abstract
This paper presents a method to estimate the yield and analyze the performance of a grid-connected photovoltaic (PV) power plant including a rooftop PV system and a solar farm. The yield model was developed based on a commercial PV model in a MATLAB/Simulink environment. A simulation model is built to connect with the PV rooftop system and the solar farm in which their total installed capacities are 0.986 and 30.7 MW, respectively. The simulated and measured final yield results of a rooftop PV system in Vietnam are compared. Additionally, this paper provides a function of reducing the final yield corresponding to different PV operation temperature values. Furthermore, the performance of both a rooftop PV system and a solar farm, in Vietnam, are evaluated as the rated power of 0.986 and 30.7 MWp, respectively. The results also show that their performance is satisfactory, in which the value of the performance ratio (PR) average reaches 70% for the rooftop PV system and 80.45% for the solar farm within a six-month period, in 2019. The PR is also compared with a global PR average from 70% to 80% for a sufficiently well-performed solar system.
1. Introduction
1.1. Solar Power Status in Vietnam
Vietnam, in Southeast Asia, is one of the countries that has the best solar radiation in Asia. In 2015, Polo [1] published a potential solar radiation mapping in Vietnam using satellite-derived and GIS-based information. Polo calculated solar radiation based on satellite-derived data combined with solar radiation derived from sunshine duration. According to the results obtained by Polo, over 47% of the provinces (30/63), in Vietnam, had an average solar radiation higher than . The average solar radiation of the 30 provinces are depicted Figure 1. The south central of Vietnam has great solar radiation potential for developing solar power plans, with an average number of sunshine hours ranging from 1700 to 2500 h per year, and a solar radiation of 4.9–5.7 kWh/m2/day. In addition, Table 1 presents a comparison of the average sunshine hours and solar radiation for different areas in Vietnam.
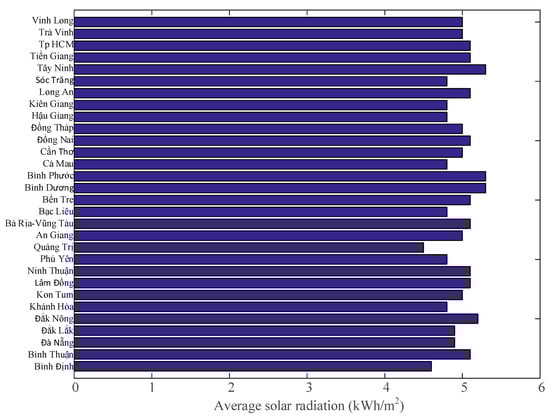
Figure 1.
Provinces, in Vietnam, with average solar radiation higher than .

Table 1.
Average sunshine hours and solar radiation for different areas in Vietnam.
Furthermore, the grid-connected photovoltaic (PV) systems, in Vietnam, have been strongly promising, since the Prime Minister of Vietnam issued the policy with a feed-in tariff for grid-connected systems, which is equivalent to USD 9.35 cent/kWh in 20 years, which came into effect on 1 June 2017 [2]. Then, 82 PV power plants in Vietnam were tested in terms of connection conditions and were successfully connected to the grid by the end of June 2019, with a total capacity reaching up to 4464 MW [3]. Figure 2 shows the development of solar farms in Vietnam from 2014 to 2019.
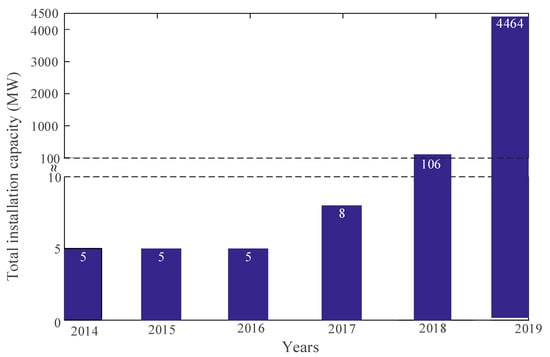
Figure 2.
Development of solar power in Vietnam from 2014–2019 as of 1 July 2019 [3,4].
1.2. Literature Review
There is currently a great deal of global interest in assessing the performance of grid-connected PV systems including the price of the PV module, the site for energy generation, the performance ratio (PR), etc. In addition, the price of a PV module has dropped year by year, and it is expected to continue to decrease in the coming years. According to IRENA’s analysis, within five years (2013–2018) [5], the price of a PV module has fallen in value from 16% to 64%, depending on the technology and country of origin. The price decrease of a PV module in the market from 2013 to 2018 is shown in Figure 3.
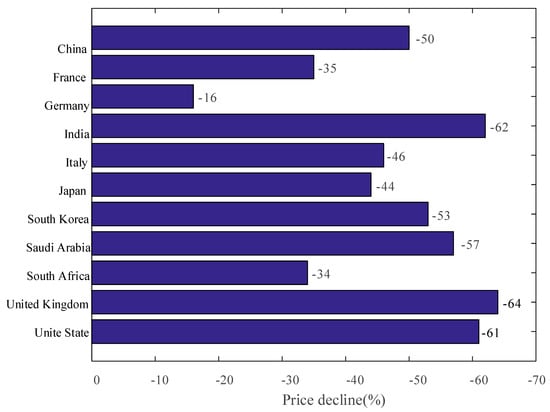
Figure 3.
Market price decrease of a module in Vietnam from 2013 to 2018.
In addition, the yield and PRs of PV systems including a rooftop PV system and solar farm are the main key performance indicators (KPIs) used to evaluate the effectiveness of a grid-connected PV system. In recent years, according to the literature review, there have been many researchers that have focused on the final yield and PR of a grid-connected PV system, the main features of which are summarized in Table 2.
Table 2.
The performance of solar power plants within difference countries.
As shown in Table 2, the grid-connected PV system is numbered based on the most recent available data (from 2015 to 2019) and the total installed capacity from the smallest to the largest. The PR of different countries changes with values ranging from 67% to 86%. The method for evaluating the PR and yield of the PV connected to the grid was simulated or measured and, in addition, there were researchers using commercial software to estimate and analyze the PV grid-connected systems including the evaluation of technical feasibility, design, and performance analysis. The different simulation tools used for analyzing the PV connected to the grid are shown in Table 3.
Table 3.
Different simulation tools used for analyzing the photovoltaic (PV) system.
A yield and performance model is developed based on the MATLAB/Simulink environment to estimate the yield and PRs of a PV rooftop system and a solar farm. The yield and PRs simulated results are compared with a PV rooftop system which is being operated in Vietnam. In addition, this study analyzes the PR of a PV rooftop system and a solar farm operated in Vietnam. Following the general background, the organization for the remaining sections of this paper are as follows: The introduction of the system description is presented in Section 2; in Section 3, the methodology is found; in Section 4, the clarification of both yield and performance of analyses is outlined; and finally, the conclusions are summarized in the final section.
2. System Description
2.1. Simulation Model Description
Figure 4 shows the schematic diagram of the estimated PV rooftop system and a solar farm, which consist of a commercial PV model, losses of the system, and PR. First, the PV model is developed based on a commercial PV module. It simulates the power of the PV module at standard test condition (STC), and then it is multiplied by the number of PV modules to form a PV array. Secondly, the losses of the system are determined based on the incidence angle losses, soiling losses, the temperature loss, LID losses, mismatch losses, module degradation loss, wiring losses, inverter losses, and transformer losses. Thirdly, the PV and loss models are inputs to develop the yield model. Finally, the PR and capacity factor (CF) of the systems are determined from the yield model and measured solar radiation.
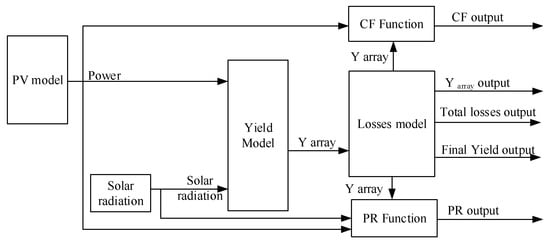
Figure 4.
Block diagram of the system.
2.2. Solar PV Power Plants’ Descriptions
The actual measurement data of two PV systems were used as the data input for the simulation, including a rooftop PV system and a solar farm in which their total installed capacities are 0.986 and 30.7 MW, respectively. The simulation results were compared with the ones of the rooftop system to prove the accuracy of the estimated model. Furthermore, the measurement data were used to analyze the actual PR of the following two PV systems:
Rooftop PV System
The present PV system is a grid-connected system, installed on a roof in Dai Nam, Binh Duong province, Vietnam and it is connected to a monitoring station whose data are obtained. It includes 2988 Canadian PV modules with the rated power of 330 W and 17 inverters with a total installed capacity of 986.04 MW. The solar panels are mounted facing south with an approximate altitude tilt angle of 15° in order to reach the maximum energy capture. Figure 5 shows the location of the Dai Nam rooftop PV station, and the detailed specifications are listed in Table 4. Close to the building, near the right side of PV modules, there is almost 30 min partial shading effect on the PV module after sunrise. This does not have a significant effect on daily PV output power due to low irradiance.
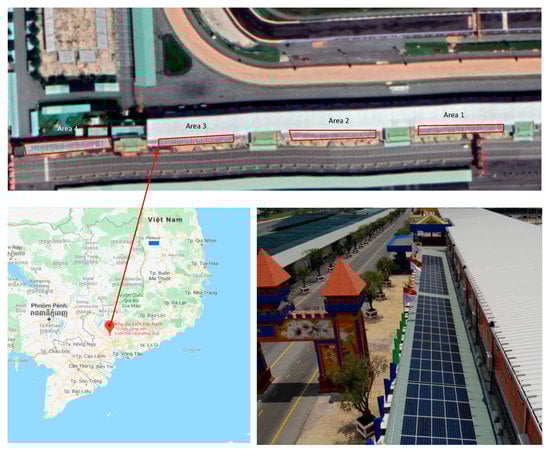
Figure 5.
Information of the rooftop grid-connected PV plant at Dai Nam, Vietnam.
Table 4.
Specification of the Dai Nam rooftop PV plant (located at 11°02′28.3″ N, 106°37′35.3″ E).
Solar Farm
The Buon Ma Thuot Solar Farm, in this case study, is located in the Daklak Province, Vietnam. Figure 6 shows the relative location of the Buon Ma Thuot Solar Farm. This facility has 86,956 Saraphim panels with a rated power of and seven ABB inverters with a rated power of . The total nominal capacity of this system is 30,718 MWp. The installation consists of solar panels which are mounted facing south with an approximate altitude tilt angle of 12° to capture maximum energy. Table 5 shows the specification of the Buon Ma Thuot Solar Farm.
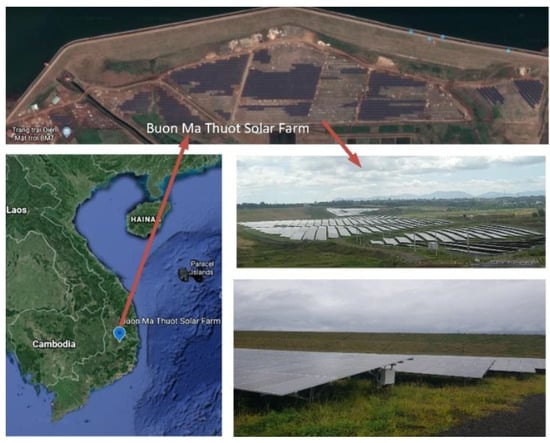
Figure 6.
Location and snapshot of the Buon Ma Thuot Solar Farm.
Table 5.
The specifications of the Buon Ma Thuot Solar Farm.
3. Methodology
3.1. PV Model
According to the datasheets of PV manufacturers, a PV simulation model for a commercial PV module was built with sufficient precision. In general, PV devices exhibit nonlinear and characteristics that vary with radiant intensity and cell temperature. The output characteristic equation is given by
where and are, respectively, the numbers of solar cells in parallel and in series; is the photocurrent; is the dark saturation current; is the charge of an electron; is the Boltzmann constant; is the cell temperature which is assumed to be uniform in the PV module; is the ideality factor that depends on PV technology; and are the resistance of shunt and series resistors; and is the exponential function. The photocurrent naturally depends on the solar irradiance and cell’s working temperature and is obtained by
where is the short-circuit current of PV module at the standard test condition (STC) of and and is the temperature coefficient of short-circuit current. The dark saturation current varies with the cell temperature and is defined as
where is the reverse saturation current of solar cell and is the band-gap energy of the semiconductor used in the cell. Having an operating voltage, the PV output power is calculated by
3.2. Performance Model
As defined in Standard IEC 61724, for the evaluation of the performance of a PV plant [15,16,17,18,19,20,21], it is given by these equations as follows:
where is performance ratio, is final yield, is reference yield, is array yield, is array output, is peak power, is mean daily irradiation, is energy to grid, is capacity factor, is the system efficiency, and is inverter efficiency. In addition, the final yield, in this case study, has been developed based on the commercial PV model and loss model. It can be written by:
or
From Equations (11) and (12), Equation (10) is rewritten as:
where is effective global corrected solar irradiance in kWh/m2, is the efficiency of the PV module under STC in %, is the rated power of PV array with commercial PV module at STC, is the area of the PV module, is total losses of the system, is the yield of array, and is the final yield.
3.3. Losses of System
The losses of the system [22,23,24] including incidence angle losses, soiling losses, the temperature loss, light induced degradation (LID) losses, mismatch losses, module degradation loss, wring losses, inverter losses, and transformer losses have a significant impact on the yield of a solar power plant connected into the grid. In this study, the lumped sum of system losses is chosen to be 15% for the simulation.
3.4. MATLAB/Simulink Development
Figure 7 presents the proposed simulation platform in a graphic program that is built using the MATLAB/Simulink block. As shown in Figure 7a, it includes the PV model, solar radiation input, yield model, loss model, model, and model. According to the datasheets of PV manufacturers, a PV simulation model for commercial PV modules was built with sufficient precision as a subsystem. Figure 7b further shows the subsystem of the PV model according to Equations (1)–(4). Furthermore, all losses of the system, solar radiation, and yield model were built based on Equations (10)–(13). Figure 7c,d shows the subsystems of the yield model and loss model. Finally, based on Equations (5)–(9), the subsystems of both the PR and CF model were built, as shown in Figure 7e,f.
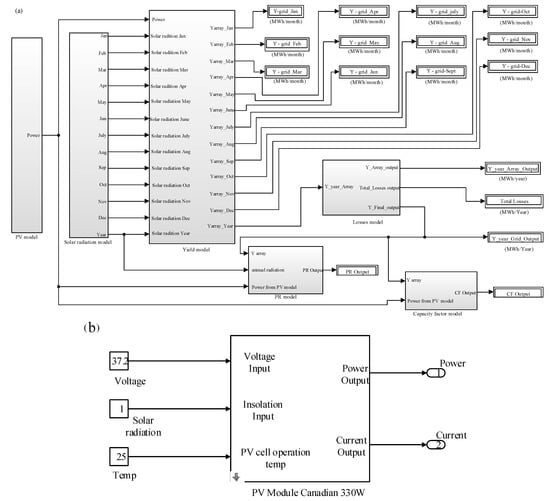
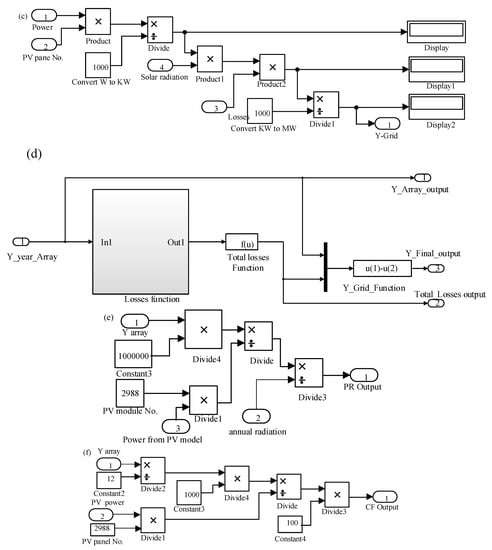
Figure 7.
Simulation model in MATLAB/Simulink environment. (a) Proposed simulation platform; (b) Subsystem of the PV model; (c) Subsystem of the yield model; (d) Subsystem of losses; (e) Subsystem of performance ratio (PR); and (f) Subsystem of capacity factor (CF).
4. Results and Discussions
4.1. Input Parameters
The simulation set-up consists of available commercial PV models with a rate power of 330 Wp (model no. CS1H330) for the PV rooftop station and 345 Wp (model no. SRP-345-6MA) for the solar farm. Table 6 represents the specifications of Canadian and Saraphim solar panels.
Table 6.
Specifications of the Canadian and Seraphim solar panels [25,26].
Additionally, the solar radiation is the main parameter for simulation. In this case, the solar radiation of two PV power plants including the Dai Nam rooftop PV plant and the Buon Ma Thuot solar farm (see Table 7) are used to simulate.
Table 7.
Solar radiation (kWh/m2d) of the Dai Nam rooftop PV plant and the Buon Ma Thuot Solar Farm.
4.2. Simulation Results
The simulation results, for the yield of the grid-connected PV system in Dai Nam using the proposed MATLAB/Simulink program (It is developed by MathWork company in Massachusetts, United States). These results are shown in Table 8. From the simulation results, the temperature strongly impacts the yield of the PV rooftops system. With the installed capacity of , the function of temperature and yield can be calculated as
where In addition, the yearly yield of PV rooftop system including PV array and net PV system are shown in Figure 8.
Table 8.
Simulation results.
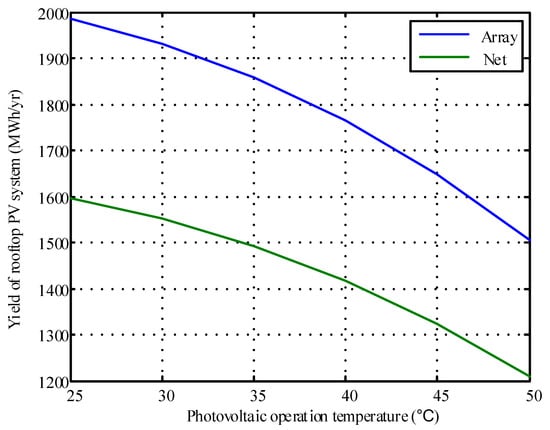
Figure 8.
Comparison of Yarray and Ynet.
In addition, the yield of the Dai Nam rooftop PV system was measured to validate the accuracy of the performance model. The comparison between the simulation and measurement results shows a gap for the simulation and measurement ranging from 0.95% to 4.9% for the rooftop PV system, and from 0.82% to 3.5% for the solar farm. Table 9 shows the gap for the simulation and measurement results for both the rooftop PV system and the solar farm. As shown in Table 9, the gap in September is high (15.2%) as a result of system maintenance at this time period.
Table 9.
Gap of simulation and measurements results for the Dai Nam and Buon Ma Thuot PV systems.
4.3. Performance Analysis of the Dai Nam PV Rooftop PV System and the Buon Ma Thuot Solar Farm
The results for the and were described by Equations (5) and (9), and are shown in Table 10. The monthly yields of the Dai Nam PV rooftop station ranged from 95,470 to 122,780 MWh. It is clear that the productivity in September drops dramatically due to a two-day shut down for maintenance. This caused a slide fall of 63% in in September, whereas the monthly average values of in this month were at 69%. In addition, the of the Dai Nam rooftop system ranged from 13.24% to 16.48%.
Table 10.
The PR analysis of the Dai Nam PV rooftop system.
The Buon Ma Thuot Solar Farm has been operated and connected to the grid since May 2019. All of the data were measured to evaluate the . However, the main Key Performance Indicator for the solar farm included the and also the final yield or plant energy delivered to the EVN grid. The results are shown in Table 11. From the results, the average PR is 80.45% and the average final yield is 3432.7 MWh/month throughout seven months in the study period. Furthermore, Figure 9 presents the relationship between the solar radiation and from May to September, in 2019. Consider September 2019, for example, and the effect of solar radiation on PV operation temperature and PV output power and this shows the inversely responses to solar radiation.
Table 11.
PR analysis of the Buon Ma Thuot Solar Farm.
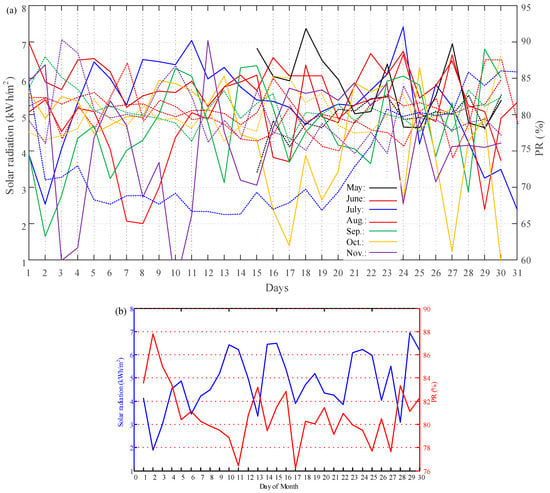
Figure 9.
PR and solar radiation. (a) May–September 2019; (b) September 2019.
Furthermore, the daily measurements of the solar farm are shown in Table 12. From the measurement results, the plant energy delivered to the grid is 146.539 MWh (measurement data as of 17 August 2019) with the daily peak Alternating Current (AC) Power is 23.31 MW per 30 MWp installed capacity to reach the PR of 87.48%.
Table 12.
The performance of the Ban Me Thuot Solar Farm.
Moreover, the key parameters of daily system outputs are solar radiation, active power for each phase, reactive power, apparent power, active energy traffic, and reactive energy traffic, which are depicted in Figure 10. Specifically, reactive energy traffic is the main parameter output that controls the balance of the solar farm. The solar radiation and also all of the values of the system are measured to assess the balance and PR of the solar farm. Furthermore, reactive power is one of the important parameters to control the balance in the PV systems. It can be controlled by using PV inverters and it depends on both solar radiation and the active power curve. The solar radiation, reactive power, active power, and apparent power of the Ban Me Thuot Solar Farm are depicted in Figure 10a–d.
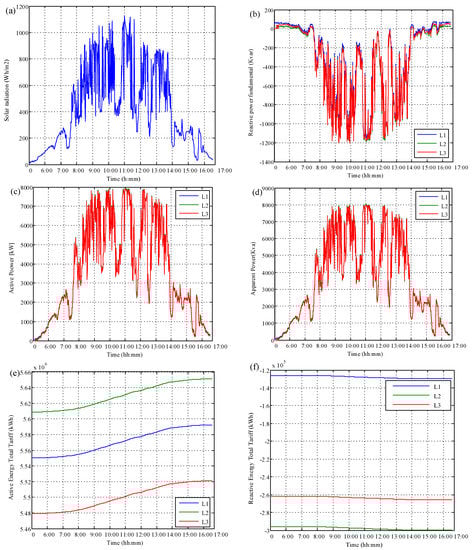
Figure 10.
Daily system output @ 30 August 2019. (a) Solar radiation; (b) Reactive power; (c) Active power; (d) Apparent power; (e) Active energy; (f) Reactive energy.
5. Conclusions
This paper addresses a method to estimate and analyze the yield and performance ratio (PR) of a rooftop photovoltaic (PV) system at Dai Nam and the first solar farm in Buon Me Thuot. From the practical viewpoint of PV system engineering, the proposed yield model has significant advantages as follows: (1) reliable accuracy, (2) cost-effectiveness, and (3) self-development. Additionally, the performance validation of the rooftop PV system and a newly installed PV solar farm in Buon Ma Thuot, Vietnam have been assessed. The critical performance indicator, the PR, is averagely found to be 69% for the PV rooftop system and 78% for the solar farm, across all months in the study. Furthermore, the results of this study are the basis for determining the feasibility of solar power projects in Vietnam and this result proves that it is technically feasible to expand solar PV development in Vietnam.
Author Contributions
Conceptualization, L.P.T.; methodology, H.L.T.; software, L.P.T.; validation, H.A.Q.; formal analysis, D.V.D.; investigation, L.P.T.; resources, L.P.T.; data curation, L.P.T.; writing—original draft preparation, L.P.T.; writing—review and editing, H.L.T; visualization, H.L.T.; supervision, H.A.Q.; project administration, L.P.T.; funding acquisition, D.V.D. All authors have read and agreed to the published version of the manuscript.”
Funding
This research was funded by Ministry of Education and Training and hosted by the Ho Chi Minh City University of Technology and Education and Lac Hong University, Vietnam.
Acknowledgments
This work belongs to the project grant no. CT2019.04.01 funded by the Ministry of Education and Training and hosted by the Ho Chi Minh City University of Technology and Education, Vietnam. In addition, the authors gratefully acknowledge Lac Hong University, Vietnam for the financial and equipment supports under grant number LHU-RF-TE-18-02-01.
Conflicts of Interest
The authors declare no conflict of interest.
References
- Polo, J.; Bernardos, A.; Navarro, A.; Fernandez-Peruchena, C.; Ramírez, L.; Guisado, M.V.; Martínez, S. Solar resources and power potential mapping in Vietnam using satellite-derived and GIS-based information. Energy Convers. Manag. 2015, 98, 348–358. [Google Scholar] [CrossRef]
- Mechanism for Solar Power Development in Vietnam; Decision No. 11/2017/QD-TTg; Vietnam Government Office: Hanoi, Vietnam, 2017.
- Waldau, A.J. PV Status Report; Publications Office of the European Union: Luxembourg, 2019. [Google Scholar]
- Report, I. Renewable Energy Statistics. Available online: https://www.irena.org/publications/2019/Jul/Renewable-energy-statistics-2019 (accessed on 22 September 2019).
- IRENA. Renewable Power Generation Costs in 2018; IRENA: Abu Dhabi, United Arab Emirates, 2018. [Google Scholar]
- Nacer, T.; Hamidat, A.; Nadjemi, O.; Bey, M. Feasibility study of grid connected photovoltaic system in family farms for electricity generation in rural areas. Renew. Energy 2016, 96, 305–318. [Google Scholar] [CrossRef]
- Kumar, B.S.; Sudhakar, K. Performance evaluation of 10 MW grid connected solar photovoltaic power plant in India. Energy Rep. 2015, 1, 184–192. [Google Scholar] [CrossRef]
- Mpholo, M.; Nchaba, T.; Monese, M. Yield and performance analysis of the first grid-connected solar farm at Moshoeshoe I International Airport, Lesotho. Renew. Energy 2015, 81, 845–852. [Google Scholar] [CrossRef]
- Martín-Martínez, S.; Cañas-Carretón, M.; Honrubia-Escribano, A.; Gómez-Lázaro, E. Performance evaluation of large solar photovoltaic power plants in Spain. Energy Convers. Manag. 2019, 183, 515–528. [Google Scholar] [CrossRef]
- Sidi, C.E.B.E.; Ndiaye, M.L.; El Bah, M.; Mbodji, A.; Ndiaye, A.; Ndiaye, P.A. Performance analysis of the first large-scale (15 MWp) grid-connected photovoltaic plant in Mauritania. Energy Convers. Manag. 2016, 119, 411–421. [Google Scholar] [CrossRef]
- Baghdadi, I.; El Yaakoubi, A.; Attari, K.; Leemrani, Z.; Asselman, A. Performance investigation of a PV system connected to the grid. Procedia Manuf. 2018, 22, 667–674. [Google Scholar] [CrossRef]
- Shah, K.K.; Mundada, A.S.; Pearce, J.M. Performance of US hybrid distributed energy systems: Solar photovoltaic, battery and combined heat and power. Energy Convers. Manag. 2015, 105, 71–80. [Google Scholar] [CrossRef]
- Good, C.; Andresen, I.; Hestnes, A.G. Solar energy for net zero energy buildings–A comparison between solar thermal, PV and photovoltaic–thermal (PV/T) systems. Sol. Energy 2015, 122, 986–996. [Google Scholar] [CrossRef]
- Cavalcante, F.F.; dos Santos Rodrigues, V.; dos Santos Rodrigues, G.; Nunes, M.V.A.; de Carvalho, E.N.; de Araújo, W.G.; Ramkeerat, P.F.R.; Souza, V. Simulation Study to Evaluate the Performance of a Photovoltaic System Connected to the Electrical Network in the Municipality of Terra Santa–PA. J. Eng. Technol. Ind. Appl. 2017, 3, 133–141. [Google Scholar]
- Jordan, D.C.; Kurtz, S.R. Photovoltaic degradation rates—An analytical review. Prog. Photovolt. Res. Appl. 2013, 21, 12–29. [Google Scholar] [CrossRef]
- Ya’acob, M.E.; Hizam, H.; Khatib, T.; Radzi, M.A.M. A comparative study of three types of grid connected photovoltaic systems based on actual performance. Energy Convers. Manag. 2014, 78, 8–13. [Google Scholar] [CrossRef]
- Sidrach-de-Cardona, M.; Lopez, L.M. Evaluation of a grid-connected photovoltaic system in southern Spain. Renew. Energy 1998, 15, 527–530. [Google Scholar] [CrossRef]
- Van Dyk, E.; Meyer, E.; Vorster, F.; Leitch, A. Long-term monitoring of photovoltaic devices. Renew. Energy 2002, 25, 183–197. [Google Scholar] [CrossRef]
- Pietruszko, S.; Gradzki, M. Performance of a grid connected small PV system in Poland. Appl. Energy 2003, 74, 177–184. [Google Scholar] [CrossRef]
- Mondol, J.D.; Yohanis, Y.; Smyth, M.; Norton, B. Long term performance analysis of a grid connected photovoltaic system in Northern Ireland. Energy Convers. Manag. 2006, 47, 2925–2947. [Google Scholar] [CrossRef]
- Chokmaviroj, S.; Wattanapong, R.; Suchart, Y. Performance of a 500 kWP grid connected photovoltaic system at Mae Hong Son Province, Thailand. Renew. Energy 2006, 31, 19–28. [Google Scholar] [CrossRef]
- Mathieu, H. The impact of angular dependent loss measument of PV module Energy Prediction. In Proceedings of the 29th European PV solar Energy Conference and Exhibition, Amsterdam, The Netherlands, 22–26 September 2014; pp. 22–26. [Google Scholar]
- Kumar, N.M.; Gupta, R.P.; Mathew, M.; Jayakumar, A.; Singh, N.K. Performance, energy loss, and degradation prediction of roof-integrated crystalline solar PV system installed in Northern India. Case Stud. Therm. Eng. 2019, 13, 100409. [Google Scholar] [CrossRef]
- Krauss, K.; Fertig, F.; Menzel, D.; Rein, S. Light-induced degradation of silicon solar cells with aluminiumoxide passivated rear side. Energy Procedia 2015, 77, 599–606. [Google Scholar] [CrossRef]
- Canadian Datasheet. Available online: https://www.canadiansolar.com (accessed on 12 September 2019).
- Seraphin Data Sheet. Available online: http://www.seraphimusa.com/datasheets (accessed on 12 September 2019).
© 2020 by the authors. Licensee MDPI, Basel, Switzerland. This article is an open access article distributed under the terms and conditions of the Creative Commons Attribution (CC BY) license (http://creativecommons.org/licenses/by/4.0/).